BIG Data How to handle it. Mark Holton, College of Engineering, Swansea University,
|
|
|
- Ezra Boone
- 5 years ago
- Views:
Transcription
1 BIG Data How to handle it Mark Holton, College of Engineering, Swansea University,

2 The usual What I m going to talk about The source of the data some tag (data loggers) history Selection criteria Some numbers Hardware / storage Preparation of the data Visualisations Where BIG data processing is heading

3 Selection criteria to get what we need / want Weight Durability
4 Choosing the right tag Tags vary greatly in their abilities Range of logging frequencies 1 Hz 800 Hz depending on need Different on-board sensors subsampled relative to the others Sensors from different manufacturers have different accuracies / sensitivities Potentially 10 or more channels of data Accelerometer X Y Z Magnetometer X Y Z Temperature Pressure Light level Battery Speed Humidity GPS / DGPS Differential pressure pitot probe Feeding - inter-mandibular angle sensor (IMASEN)
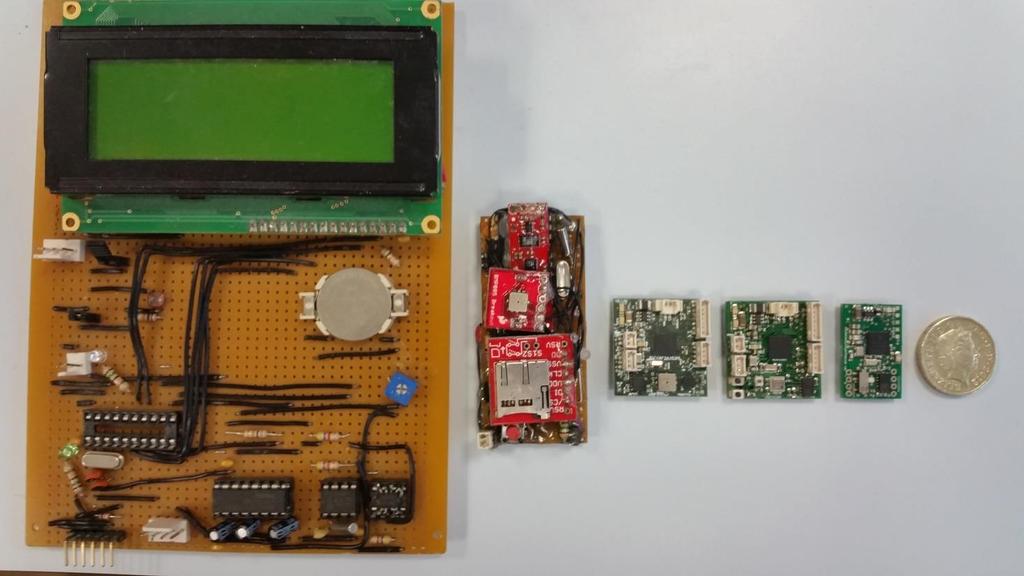
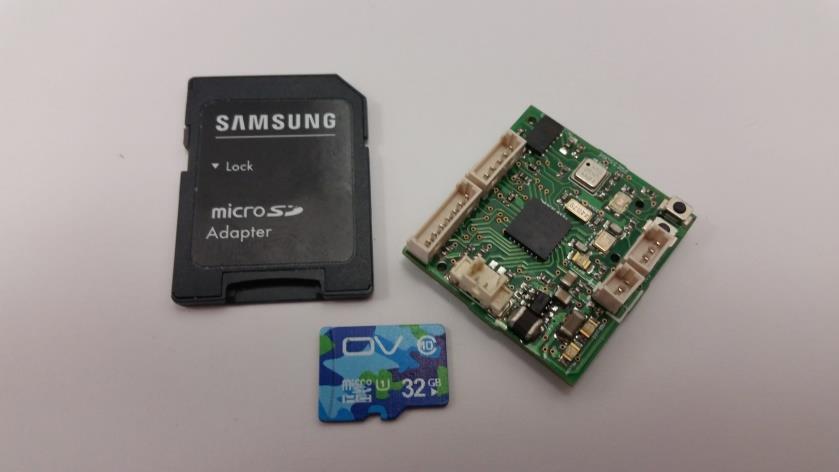
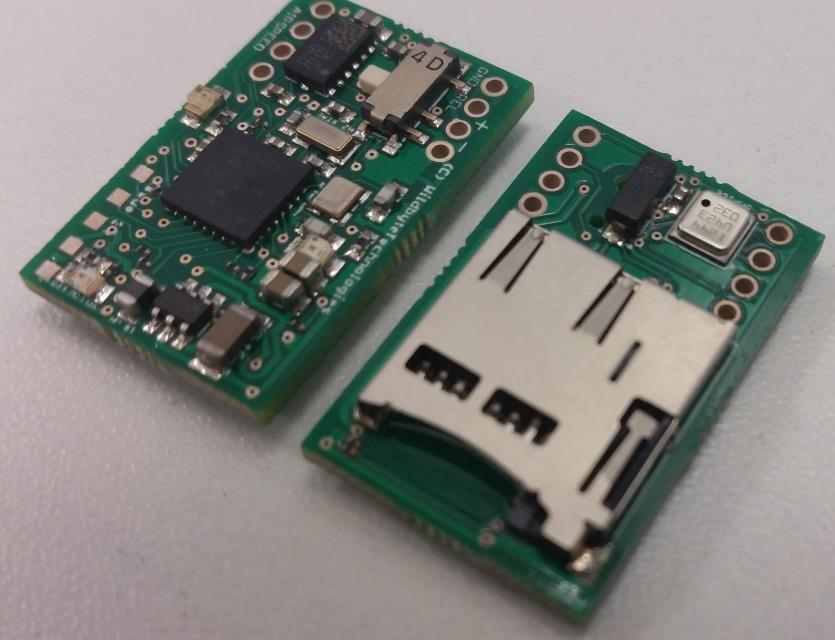

5 Tag development
6 Some numbers For 10 channels, at 40 Hz sampling 400 pieces of data per second 24,000 pieces of data per minute 1,440,000 pieces of data per hour 34,560,000 pieces of data per day Per month 1,036,800,000 This is just the RAW data Smoothed channels Various metrics Marker / sync channels (GPS etc.)
 Lots of local hard-drive space Networked")
7 Hardware what is needed, actually really needed i5-i7 Intel processor Lots of memory (16-32 GB) Lots of local hard-drive space Networked storage
8 Pre-preparing the data Raw data can be difficult to understand. Some data preparation can help a lot with interpretation of results Simple preparation: Channel smoothing Median filters Threshold filters Histograms Time filters i.e. sectioning by the hour, day etc. Slightly harder preparation: Synchronisation of data to GPS data 3D normalisation Draw scaling and colour scaling Hard (multiple channel, large processing) preparation: Complex 3D plots of multi-channel data (the user has the option to plot any combinations of available channels)
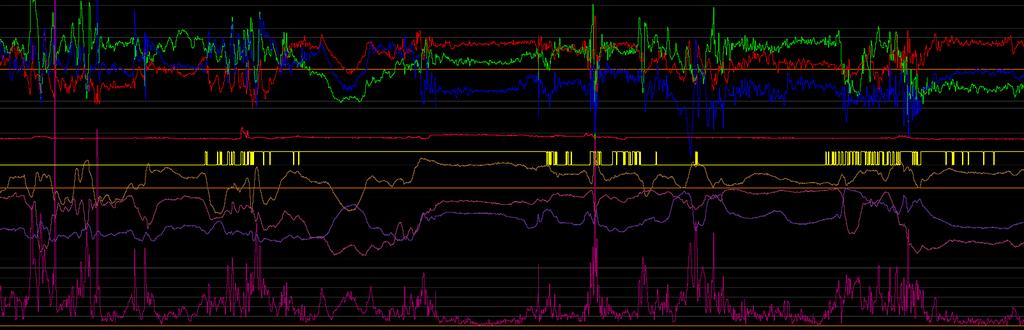

9 Visualisations


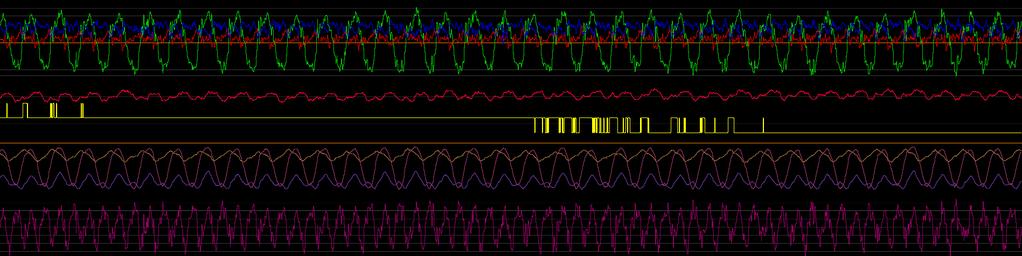
10 Fourier Transforms for frequency analysis

11 Fourier Transforms for frequency analysis

12 Interpretation of acceleration traces as body pitch and sway Pitch Pitch


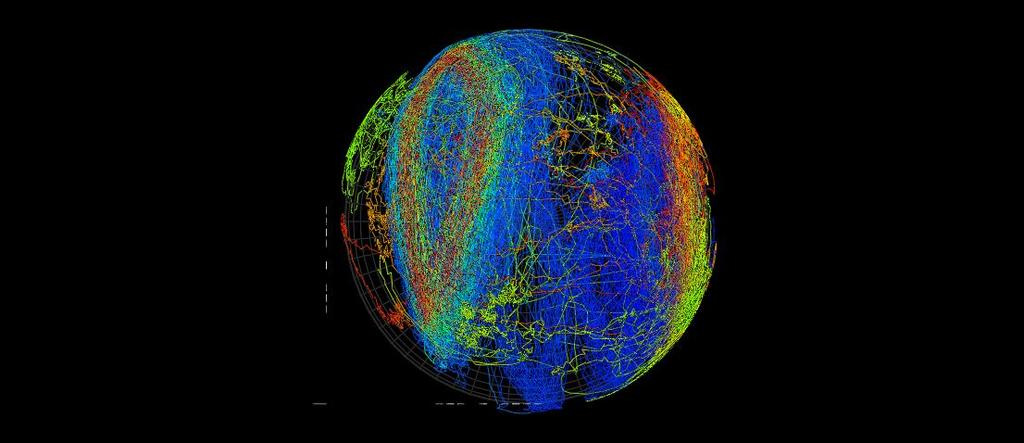
13 Look more at the bulk data Acceleration XYZ Acceleration XYZ Coloured by Pressure Acceleration XYZ Coloured by Pressure, the radius modulated by pressure


14 Spherical histograms, modulated by another channel Acceleration XYZ Coloured by Pressure Acceleration XYZ Coloured by Pressure spherical histogram, each block is the sum of one particular attribute of all points that fall within that area Acceleration XYZ Coloured by Pressure, the spherical histogram showing distribution of a different attribute Logarithmic spherical histogram
15 Acceleration magnitude separated by magnitude into layers


16 Determining mean angular separation of clusters of data


17 2 dimensional histograms to clustering or frequent behaviour across multiple axes 2D histograms of various channel data to aid in looking for behaviours due to unusual/unique clusters


18 Incorporating other systems data with sensor data; GPS GPS trace with associated behaviour/environmentally coloured traces GPS track coloured by one of many attributes including pre-calculated behaviour values GPS track coloured by one of many attributes with additional duplicate environmental and behavioural tracks stacked Different view of a section of GPS data


19 Searching data using thresholds Surfacing Picking out interesting data using a basic thresholding search algorithm


20 Everyone wants something different One large difficulty with developing a system to look at this type of data is that EVERYONE wants something different Correlation to compare channels against each other Cross correlation to compare waveform shapes to a database to determine best fit Various tests to determine similarity, convergence etc. For now make the raw and processed data as accessible to the user to carry out post processing in existing statistical/graphing packages such as Origin, MatLab etc. Advanced expression builder for search and tagging of data sections
21 The future of BIG data processing It s easy for the human eye to see patterns in large, often complex, data sets Data sets containing multiple variables can very quickly become a task beyond standard mathematics and will often require something new Analysis of data using neural networks has been around for decades Create a series of Input neurons or an Input layer Create a Hidden layer to accept outputs from the Input layer Or not Create an Output layer that effectively summarises the results from the Hidden layer The network is then Trained with data sets, and the Weighting that links the Input layer to the Hidden layer and the Hidden layer to the Output layer are mathematically adjusted to achieve a known result based on the known input data. There are many different algorithms around today, with varying degrees of strengths and weaknesses depending on the data set type. The oldest and most typical is the Feed Forward Neural Network that relies on the back-propagation of error. Such a network, if trained correctly for certain types of data sets, will be able to identify to a degree of probability a previously unseen data set. More complex networks include delays and loop-backs (recurrent) to earlier layers to allow sort of memory of previous input sets
22 Thank you
Infographics and Visualisation (or: Beyond the Pie Chart) LSS: ITNPBD4, 1 November 2016
 LSS: ITNPBD4, 1 November 2016") Infographics and Visualisation (or: Beyond the Pie Chart) LSS: ITNPBD4, 1 November 2016 Overview Overview (short: we covered most of this in the tutorial) Why infographics and visualisation What s the
Infographics and Visualisation (or: Beyond the Pie Chart) LSS: ITNPBD4, 1 November 2016 Overview Overview (short: we covered most of this in the tutorial) Why infographics and visualisation What s the
Goals: Course Unit: Describing Moving Objects Different Ways of Representing Functions Vector-valued Functions, or Parametric Curves
 Block #1: Vector-Valued Functions Goals: Course Unit: Describing Moving Objects Different Ways of Representing Functions Vector-valued Functions, or Parametric Curves 1 The Calculus of Moving Objects Problem.
Force Modeling, Quaternion PID, and Optimization
 Cornell University Autonomous Underwater Vehicle Team Spring 2014 Force Modeling, Quaternion PID, and Optimization Technical Report Alex Spitzer (aes368) May 11, 2014 Contents 1 Abstract 2 2 Previous Designs
Ensemble methods in machine learning. Example. Neural networks. Neural networks
 Ensemble methods in machine learning Bootstrap aggregating (bagging) train an ensemble of models based on randomly resampled versions of the training set, then take a majority vote Example What if you
Statistical graphics in analysis Multivariable data in PCP & scatter plot matrix. Paula Ahonen-Rainio Maa Visual Analysis in GIS
 Statistical graphics in analysis Multivariable data in PCP & scatter plot matrix Paula Ahonen-Rainio Maa-123.3530 Visual Analysis in GIS 11.11.2015 Topics today YOUR REPORTS OF A-2 Thematic maps with charts
Movit System G1 WIRELESS MOTION DEVICE SYSTEM
 Movit System G1 WIRELESS MOTION DEVICE SYSTEM 1 INTRODUCTION The Movit System G1 incorporates multiple wireless motion devices (Movit G1) with the Dongle G1 station, dedicated software and a set of full
Artificial Neuron Modelling Based on Wave Shape
 Artificial Neuron Modelling Based on Wave Shape Kieran Greer, Distributed Computing Systems, Belfast, UK. http://distributedcomputingsystems.co.uk Version 1.2 Abstract This paper describes a new model
Digital Image Processing. Prof. P. K. Biswas. Department of Electronic & Electrical Communication Engineering
 Digital Image Processing Prof. P. K. Biswas Department of Electronic & Electrical Communication Engineering Indian Institute of Technology, Kharagpur Lecture - 21 Image Enhancement Frequency Domain Processing
Kinematics of Machines Prof. A. K. Mallik Department of Mechanical Engineering Indian Institute of Technology, Kanpur. Module 10 Lecture 1
 Kinematics of Machines Prof. A. K. Mallik Department of Mechanical Engineering Indian Institute of Technology, Kanpur Module 10 Lecture 1 So far, in this course we have discussed planar linkages, which
For Monday. Read chapter 18, sections Homework:
 For Monday Read chapter 18, sections 10-12 The material in section 8 and 9 is interesting, but we won t take time to cover it this semester Homework: Chapter 18, exercise 25 a-b Program 4 Model Neuron
Improvement of optic flow estimation from an event-based sensor with recurrently connected processing layers
 Improvement of optic flow estimation from an event-based sensor with recurrently connected processing layers Vilim Štih 31st March 2014 1 Introduction The Dynamic Vision Sensor (DVS) is a visual sensor
Data Should Not be a Four Letter Word Microsoft Excel QUICK TOUR
 Toolbar Tour AutoSum + more functions Chart Wizard Currency, Percent, Comma Style Increase-Decrease Decimal Name Box Chart Wizard QUICK TOUR Name Box AutoSum Numeric Style Chart Wizard Formula Bar Active
Parallel Coordinate Plots
 Page 1 of 6 Parallel Coordinate Plots Parallel coordinates plots are a technique used for representing high dimensional data. To show a set of points in an n dimensional space onto a 2D surface (the computer
What is the best way to implement my algorithm in Simulink?
 What is the best way to implement my algorithm in Simulink? By Giampiero Campa, PhD, Technical Evangelist MathWorks, 970 W 190 ST, Suite 530, Torrance, CA, 90502, USA giampiero.campa@mathworks.com 2014
PRODUCT DATA. Test for I-deas Core Software BZ-6000
 PRODUCT DATA Test for I-deas Core Software BZ-6000 Test for I-deas Core software provides foundation display, data management, and signal processing capabilities and is a prerequisite for most other Test
navigation Isaac Skog
 Foot-mounted zerovelocity aided inertial navigation Isaac Skog skog@kth.se Course Outline 1. Foot-mounted inertial navigation a. Basic idea b. Pros and cons 2. Inertial navigation a. The inertial sensors
Data Analysis in ATLAS. Graeme Stewart with thanks to Attila Krasznahorkay and Johannes Elmsheuser
 Data Analysis in ATLAS Graeme Stewart with thanks to Attila Krasznahorkay and Johannes Elmsheuser 1 ATLAS Data Flow into Analysis RAW detector data and simulated RDO data are reconstructed into our xaod
Rapid Natural Scene Text Segmentation
 Rapid Natural Scene Text Segmentation Ben Newhouse, Stanford University December 10, 2009 1 Abstract A new algorithm was developed to segment text from an image by classifying images according to the gradient
DS-IMU NEXT GENERATION OF NAVIGATION INSTRUMENTS
 DS-IMU NEXT GENERATION OF NAVIGATION Ruggedized and reliable GPS aided inertial navigation system including AHRS that provides accurate position, velocity, acceleration and orientation under most demanding
Performance Evaluation. Recommended reading: Heidelberg and Lavenberg Computer Performance Evaluation IEEETC, C33, 12, Dec. 1984, p.
 Thomas Clark 5/4/09 cs162 lecture notes cs162-aw Performance Evaluation Recommended reading: Heidelberg and Lavenberg Computer Performance Evaluation IEEETC, C33, 12, Dec. 1984, p. 1195 We ve been talking
Decimals should be spoken digit by digit eg 0.34 is Zero (or nought) point three four (NOT thirty four).
 point three four (NOT thirty four).") Numeracy Essentials Section 1 Number Skills Reading and writing numbers All numbers should be written correctly. Most pupils are able to read, write and say numbers up to a thousand, but often have difficulty
Numeracy Essentials Section 1 Number Skills Reading and writing numbers All numbers should be written correctly. Most pupils are able to read, write and say numbers up to a thousand, but often have difficulty
AX22 Performance Computer
 AX22 Performance Computer Built in high accuracy 5Hz GPS Digital accelerometers Compact flash memory Lap beacon input Serial input from ECU/OBDii Very high accuracy measurements of acceleration timings
Big Data Analytics CSCI 4030
 High dim. data Graph data Infinite data Machine learning Apps Locality sensitive hashing PageRank, SimRank Filtering data streams SVM Recommen der systems Clustering Community Detection Queries on streams
Designing and Implementing a Dynamic Camera System
 Designing and Implementing a Dynamic Camera System Phil Wilkins Phil Wilkins, Sony Playstation Entertainment GDCʼ08 Lecture Objectives Flexible Designer driven Smooth Not require player intervention No
CS 4510/9010 Applied Machine Learning. Neural Nets. Paula Matuszek Fall copyright Paula Matuszek 2016
 CS 4510/9010 Applied Machine Learning 1 Neural Nets Paula Matuszek Fall 2016 Neural Nets, the very short version 2 A neural net consists of layers of nodes, or neurons, each of which has an activation
Question: What are the origins of the forces of magnetism (how are they produced/ generated)?
?") This is an additional material to the one in the internet and may help you to develop interest with the method. You should try to integrate some of the discussions here while you are trying to answer the
This is an additional material to the one in the internet and may help you to develop interest with the method. You should try to integrate some of the discussions here while you are trying to answer the
Visual Analytics. Visualizing multivariate data:
 Visual Analytics 1 Visualizing multivariate data: High density time-series plots Scatterplot matrices Parallel coordinate plots Temporal and spectral correlation plots Box plots Wavelets Radar and /or
STA Module 2B Organizing Data and Comparing Distributions (Part II)
") STA 2023 Module 2B Organizing Data and Comparing Distributions (Part II) Learning Objectives Upon completing this module, you should be able to 1 Explain the purpose of a measure of center 2 Obtain and
STA 2023 Module 2B Organizing Data and Comparing Distributions (Part II) Learning Objectives Upon completing this module, you should be able to 1 Explain the purpose of a measure of center 2 Obtain and
STA Learning Objectives. Learning Objectives (cont.) Module 2B Organizing Data and Comparing Distributions (Part II)
 Module 2B Organizing Data and Comparing Distributions (Part II)") STA 2023 Module 2B Organizing Data and Comparing Distributions (Part II) Learning Objectives Upon completing this module, you should be able to 1 Explain the purpose of a measure of center 2 Obtain and
STA 2023 Module 2B Organizing Data and Comparing Distributions (Part II) Learning Objectives Upon completing this module, you should be able to 1 Explain the purpose of a measure of center 2 Obtain and
Robotics. Lecture 5: Monte Carlo Localisation. See course website for up to date information.
 Robotics Lecture 5: Monte Carlo Localisation See course website http://www.doc.ic.ac.uk/~ajd/robotics/ for up to date information. Andrew Davison Department of Computing Imperial College London Review:
Data Mining on Agriculture Data using Neural Networks
 Data Mining on Agriculture Data using Neural Networks June 26th, 28 Outline Data Details Data Overview precision farming cheap data collection GPS-based technology divide field into small-scale parts treat
Surfaces and Partial Derivatives
 Surfaces and James K. Peterson Department of Biological Sciences and Department of Mathematical Sciences Clemson University November 15, 2017 Outline 1 2 Tangent Planes Let s go back to our simple surface
Understanding Clustering Supervising the unsupervised
 Understanding Clustering Supervising the unsupervised Janu Verma IBM T.J. Watson Research Center, New York http://jverma.github.io/ jverma@us.ibm.com @januverma Clustering Grouping together similar data
Deep Learning for Visual Computing Prof. Debdoot Sheet Department of Electrical Engineering Indian Institute of Technology, Kharagpur
 Deep Learning for Visual Computing Prof. Debdoot Sheet Department of Electrical Engineering Indian Institute of Technology, Kharagpur Lecture - 05 Classification with Perceptron Model So, welcome to today
In this assignment, we investigated the use of neural networks for supervised classification
 Paul Couchman Fabien Imbault Ronan Tigreat Gorka Urchegui Tellechea Classification assignment (group 6) Image processing MSc Embedded Systems March 2003 Classification includes a broad range of decision-theoric
Choosing the right graph in Excel
 Choosing the right graph in Excel Guide? Presentation Level? Graph type Example Application Variants Notes (Y) Column Shows data change over time Illustrates comparisons (Y) Bar Illustrates comparisons
Getting Started. What is SAS/SPECTRAVIEW Software? CHAPTER 1
 3 CHAPTER 1 Getting Started What is SAS/SPECTRAVIEW Software? 3 Using SAS/SPECTRAVIEW Software 5 Data Set Requirements 5 How the Software Displays Data 6 Spatial Data 6 Non-Spatial Data 7 Summary of Software
Practice Exam Sample Solutions
 CS 675 Computer Vision Instructor: Marc Pomplun Practice Exam Sample Solutions Note that in the actual exam, no calculators, no books, and no notes allowed. Question 1: out of points Question 2: out of
BOSS. Quick Start Guide For research use only. Blackrock Microsystems, LLC. Blackrock Offline Spike Sorter. User s Manual. 630 Komas Drive Suite 200
 BOSS Quick Start Guide For research use only Blackrock Microsystems, LLC 630 Komas Drive Suite 200 Salt Lake City UT 84108 T: +1 801 582 5533 www.blackrockmicro.com support@blackrockmicro.com 1 2 1.0 Table
Introduction to Trajectory Clustering. By YONGLI ZHANG
 Introduction to Trajectory Clustering By YONGLI ZHANG Outline 1. Problem Definition 2. Clustering Methods for Trajectory data 3. Model-based Trajectory Clustering 4. Applications 5. Conclusions 1 Problem
Evaluating the Performance of a Vehicle Pose Measurement System
 Evaluating the Performance of a Vehicle Pose Measurement System Harry Scott Sandor Szabo National Institute of Standards and Technology Abstract A method is presented for evaluating the performance of
Lecture #11: The Perceptron
 Lecture #11: The Perceptron Mat Kallada STAT2450 - Introduction to Data Mining Outline for Today Welcome back! Assignment 3 The Perceptron Learning Method Perceptron Learning Rule Assignment 3 Will be
3 Graphical Displays of Data
 3 Graphical Displays of Data Reading: SW Chapter 2, Sections 1-6 Summarizing and Displaying Qualitative Data The data below are from a study of thyroid cancer, using NMTR data. The investigators looked
TDWI strives to provide course books that are contentrich and that serve as useful reference documents after a class has ended.
 Previews of TDWI course books offer an opportunity to see the quality of our material and help you to select the courses that best fit your needs. The previews cannot be printed. TDWI strives to provide
Automotive Testing: Optical 3D Metrology Improves Safety and Comfort
 Automotive Testing: Optical 3D Metrology Improves Safety and Comfort GOM Measuring System: ARAMIS, TRITOP, GOM Touch Probe Keywords: Automotive, Crash Testing, Static and Dynamic Deformation, Simulation
FLUENT Secondary flow in a teacup Author: John M. Cimbala, Penn State University Latest revision: 26 January 2016
 FLUENT Secondary flow in a teacup Author: John M. Cimbala, Penn State University Latest revision: 26 January 2016 Note: These instructions are based on an older version of FLUENT, and some of the instructions
Lecture Notes (Reflection & Mirrors)
") Lecture Notes (Reflection & Mirrors) Intro: - plane mirrors are flat, smooth surfaces from which light is reflected by regular reflection - light rays are reflected with equal angles of incidence and reflection
Lecture Notes (Reflection & Mirrors) Intro: - plane mirrors are flat, smooth surfaces from which light is reflected by regular reflection - light rays are reflected with equal angles of incidence and reflection
3 Graphical Displays of Data
 3 Graphical Displays of Data Reading: SW Chapter 2, Sections 1-6 Summarizing and Displaying Qualitative Data The data below are from a study of thyroid cancer, using NMTR data. The investigators looked
Machine Learning (CSMML16) (Autumn term, ) Xia Hong
 (Autumn term, ) Xia Hong") Machine Learning (CSMML16) (Autumn term, 28-29) Xia Hong 1 Useful books: 1. C. M. Bishop: Pattern Recognition and Machine Learning (2007) Springer. 2. S. Haykin: Neural Networks (1999) Prentice Hall. 3.
Machine Learning (CSMML16) (Autumn term, 28-29) Xia Hong 1 Useful books: 1. C. M. Bishop: Pattern Recognition and Machine Learning (2007) Springer. 2. S. Haykin: Neural Networks (1999) Prentice Hall. 3.
Content-based Image Retrieval (CBIR)
") Content-based Image Retrieval (CBIR) Content-based Image Retrieval (CBIR) Searching a large database for images that match a query: What kinds of databases? What kinds of queries? What constitutes a match?
Content-based Image Retrieval (CBIR) Content-based Image Retrieval (CBIR) Searching a large database for images that match a query: What kinds of databases? What kinds of queries? What constitutes a match?
- 1 - Class Intervals
 - 1 - Class Intervals To work with continuous numeric data and to represent it in some sort of a graph or a chart, you have to separate the data into class intervals that is, intervals of equal length.
Tobii Pro Lab Release Notes
 Tobii Pro Lab Release Notes Release notes 1.89 2018-05-23 IMPORTANT NOTICE! Projects created or opened in this version will not be possible to open in older versions than 1.89 of Tobii Pro Lab Panels for
Product information. Hi-Tech Electronics Pte Ltd
 Product information Introduction TEMA Motion is the world leading software for advanced motion analysis. Starting with digital image sequences the operator uses TEMA Motion to track objects in images,
Neural Networks. CE-725: Statistical Pattern Recognition Sharif University of Technology Spring Soleymani
 Neural Networks CE-725: Statistical Pattern Recognition Sharif University of Technology Spring 2013 Soleymani Outline Biological and artificial neural networks Feed-forward neural networks Single layer
Programming assignment 3 Mean-shift
 Programming assignment 3 Mean-shift 1 Basic Implementation The Mean Shift algorithm clusters a d-dimensional data set by associating each point to a peak of the data set s probability density function.
Neural Nets. CSCI 5582, Fall 2007
 Neural Nets CSCI 5582, Fall 2007 Assignments For this week: Chapter 20, section 5 Problem Set 3 is due a week from today Neural Networks: Some First Concepts Each neural element is loosely based on the
Visualisation of uncertainty. Kai-Mikael Jää-Aro
 Visualisation of uncertainty Kai-Mikael Jää-Aro Why is this important? Visualising uncertainty Means and Methods Scalar data Vector data Volume data Generic methods Let us talk about the weather A weather
Lab Practical - Limit Equilibrium Analysis of Engineered Slopes
 Lab Practical - Limit Equilibrium Analysis of Engineered Slopes Part 1: Planar Analysis A Deterministic Analysis This exercise will demonstrate the basics of a deterministic limit equilibrium planar analysis
Stage 6 Checklists Have you reached this Standard?
 Stage 6 Checklists Have you reached this Standard? Main Criteria for the whole year. Multiply and divide numbers with up to three decimal places by 10, 100, and 1000 Use long division to divide numbers
Advanced Programming Features
 Advanced Programming Features Compute Tools 4 and 5 Program Area Level 5 The two advance programming templates for manipulating data are Compute Tools 4 and Compute Tools 5. Each of these templates provide
A Vision System for Automatic State Determination of Grid Based Board Games
 A Vision System for Automatic State Determination of Grid Based Board Games Michael Bryson Computer Science and Engineering, University of South Carolina, 29208 Abstract. Numerous programs have been written
Lecture 2 Notes. Outline. Neural Networks. The Big Idea. Architecture. Instructors: Parth Shah, Riju Pahwa
 Instructors: Parth Shah, Riju Pahwa Lecture 2 Notes Outline 1. Neural Networks The Big Idea Architecture SGD and Backpropagation 2. Convolutional Neural Networks Intuition Architecture 3. Recurrent Neural
4. TROUBLESHOOTING PREVIOUS VERSIONS RUN LOLITRACK ALWAYS AS ADMIN WIBU SOFTWARE PROTECTION... 30
 Version 4.2.0 CONTENTS 1. GETTING STARTED... 2 2. TYPICAL APPLICATIONS... 4 3. USER GUIDE... 5 3.1 SINGLE OBJECT MODE... 7 3.2 SINGLE ARENA MODE... 12 3.3 EVENT RECORDER... 19 3.4 BATCH TRACKING... 21
Automatic Partiicle Tracking Software USE ER MANUAL Update: May 2015
 Automatic Particle Tracking Software USER MANUAL Update: May 2015 File Menu The micrograph below shows the panel displayed when a movie is opened, including a playback menu where most of the parameters
LASER s Level 2 Maths Course - Summary
 LASER s Level 2 Maths Course - Summary Unit Code Unit Title Credits Level Status SER945 Shape, Space and Measurement 3 2 Mandatory SER946 Collecting, Recording and Analysing Data 3 2 Mandatory SER947 Development
Lesson 5: Surface Check Tools
 Lesson 5: Surface Check Tools In this lesson, you will learn to check a surface for its continuity and to repair its discontinuities. You will also learn about particularities of a molded surface and how
Time-Domain EM at GDD Instrumentation. By Circé Malo Lalande, Eng., MASc. Geophysicist & GM
 Time-Domain EM at GDD Instrumentation By Circé Malo Lalande, Eng., MASc. Geophysicist & GM NordicEM24 EM Receiver FEATURES: Low noise 24-bit ADCs Rx with full-waveform recording (Raw & Stacked files);
Implementing Machine Learning in Earthquake Engineering
 CS9 MACHINE LEARNING, DECEMBER 6 Implementing Machine Learning in Earthquake Engineering Cristian Acevedo Civil and Environmental Engineering Stanford University, Stanford, CA 9435, USA Abstract The use
The question FLOW-3D and IOSO NM
 Searching for the optimal velocity of the piston in an HPDC process 3D optimization study of the velocity profile during first phase shot sleeve process Stefano Mascetti, srl The question High pressure
Kuske Martyna, Rubio, Rubio Rafael, Nicolas Jacques, Marco Santiago, Romain Anne-Claude
 Fuzzy k-nn applied to moulds detection. Kuske Martyna, Rubio, Rubio Rafael, Nicolas Jacques, Marco Santiago, Romain Anne-Claude Communication presented at ISOEN 2003 RIGA- Latvia Introduction Excessive
Introduction to Minitab 1
 Introduction to Minitab 1 We begin by first starting Minitab. You may choose to either 1. click on the Minitab icon in the corner of your screen 2. go to the lower left and hit Start, then from All Programs,
What s New in Spotfire DXP 1.1. Spotfire Product Management January 2007
 What s New in Spotfire DXP 1.1 Spotfire Product Management January 2007 Spotfire DXP Version 1.1 This document highlights the new capabilities planned for release in version 1.1 of Spotfire DXP. In this
Use case: mapping sparse spatial data with TOPCAT
 Use case: mapping sparse spatial data with TOPCAT This use case describes a workflow related to large hyperspectral datasets. In this example you will use data from the VIRTIS/Rosetta experiment and study
Vehicle s Kinematics Measurement with IMU
 536441 Vehicle dnamics and control laborator Vehicle s Kinematics Measurement with IMU This laborator is design to introduce ou to understand and acquire the inertia properties for using in the vehicle
Satellite Attitude Determination
 Satellite Attitude Determination AERO4701 Space Engineering 3 Week 5 Last Week Looked at GPS signals and pseudorange error terms Looked at GPS positioning from pseudorange data Looked at GPS error sources,
Data anagement -meteorological Data -Hy rological Data - n ironmental ata
 Vista Data Vision Bring your data to life Download a 30-day evaluation version from vistadatavision.com/download Data anagement -meteorological Data -Hy rological Data - n ironmental ata Bring your ata
An Introduction to PDF Estimation and Clustering
 Sigmedia, Electronic Engineering Dept., Trinity College, Dublin. 1 An Introduction to PDF Estimation and Clustering David Corrigan corrigad@tcd.ie Electrical and Electronic Engineering Dept., University
Logger Pro Resource Sheet
 Logger Pro Resource Sheet Entering and Editing Data Data Collection How to Begin How to Store Multiple Runs Data Analysis How to Scale a Graph How to Determine the X- and Y- Data Points on a Graph How
FleetLocate v2.7 User Guide
 FleetLocate v2.7 User Guide User Guide v2.7 - FleetLocate: Fleet & Asset Intelligence Contents FleetLocate Fleet Intelligence v2.7 User Guide... 5 Map Tab... 6 Changing and Printing the Map View... 6 Bookmarks
MITOCW watch?v=w_-sx4vr53m
 MITOCW watch?v=w_-sx4vr53m The following content is provided under a Creative Commons license. Your support will help MIT OpenCourseWare continue to offer high-quality educational resources for free. To
11/8/ th IEEE Requirements Engineering Conference 27-Sep to 1-Oct, 2010
 11/8/2010 18 th IEEE Requirements Engineering Conference 27-Sep to 1-Oct, 2010 Requirements Engineering @ Intel few dedicated requirements engineers central training / coaching department still using Word
5 Learning hypothesis classes (16 points)
") 5 Learning hypothesis classes (16 points) Consider a classification problem with two real valued inputs. For each of the following algorithms, specify all of the separators below that it could have generated
5 Learning hypothesis classes (16 points) Consider a classification problem with two real valued inputs. For each of the following algorithms, specify all of the separators below that it could have generated
Name: Tutor s
 Name: Tutor s Email: Bring a couple, just in case! Necessary Equipment: Black Pen Pencil Rubber Pencil Sharpener Scientific Calculator Ruler Protractor (Pair of) Compasses 018 AQA Exam Dates Paper 1 4
Application Note AN10 RTLS TDOA Platform Components Comparison
 Application Note AN10 TDOA Platform Components Comparison 1 Brief Changelog v1.1 No changes Important Changes Position Algorithm API Database Manager v1.12 v1.21 API for Building plans API /tags /anchor
INSTITUTE OF AERONAUTICAL ENGINEERING
 Name Code Class Branch Page 1 INSTITUTE OF AERONAUTICAL ENGINEERING : ROBOTICS (Autonomous) Dundigal, Hyderabad - 500 0 MECHANICAL ENGINEERING TUTORIAL QUESTION BANK : A7055 : IV B. Tech I Semester : MECHANICAL
1 Introduction to Using Excel Spreadsheets
 Survey of Math: Excel Spreadsheet Guide (for Excel 2007) Page 1 of 6 1 Introduction to Using Excel Spreadsheets This section of the guide is based on the file (a faux grade sheet created for messing with)
Your Name: Section: INTRODUCTION TO STATISTICAL REASONING Computer Lab #4 Scatterplots and Regression
 Your Name: Section: 36-201 INTRODUCTION TO STATISTICAL REASONING Computer Lab #4 Scatterplots and Regression Objectives: 1. To learn how to interpret scatterplots. Specifically you will investigate, using
Chapter 2: The Normal Distribution
 Chapter 2: The Normal Distribution 2.1 Density Curves and the Normal Distributions 2.2 Standard Normal Calculations 1 2 Histogram for Strength of Yarn Bobbins 15.60 16.10 16.60 17.10 17.60 18.10 18.60
UNIVERSITY OF OSLO. Faculty of Mathematics and Natural Sciences
 UNIVERSITY OF OSLO Faculty of Mathematics and Natural Sciences Exam: INF 4300 / INF 9305 Digital image analysis Date: Thursday December 21, 2017 Exam hours: 09.00-13.00 (4 hours) Number of pages: 8 pages
Research and Literature Review on Developing Motion Capture System for Analyzing Athletes Action
 International Conference on Education Technology, Management and Humanities Science (ETMHS 2015) Research and Literature Review on Developing Motion Capture System for Analyzing Athletes Action HAN Fang
Natural Language Processing CS 6320 Lecture 6 Neural Language Models. Instructor: Sanda Harabagiu
 Natural Language Processing CS 6320 Lecture 6 Neural Language Models Instructor: Sanda Harabagiu In this lecture We shall cover: Deep Neural Models for Natural Language Processing Introduce Feed Forward
Section 33: Advanced Charts
 Section 33 Advanced Charts By the end of this Section you should be able to: Use Chart Options Add Moving Averages to Charts Change a 3D Chart View Use Data Labels and Markers Create Stacked Bar Charts
Surfaces and Partial Derivatives
 Surfaces and Partial Derivatives James K. Peterson Department of Biological Sciences and Department of Mathematical Sciences Clemson University November 9, 2016 Outline Partial Derivatives Tangent Planes
Multiframe September 2010 Release Note
 Multiframe 12.11 20 September 2010 Release Note This release note describes the version 12.11 release of Multiframe, Steel Designer and Section Maker. This release is a minor upgrade that will run on Windows
Studuino Block Programming Environment Guide
 Studuino Block Programming Environment Guide [DC Motors and Servomotors] This is a tutorial for the Studuino Block programming environment. As the Studuino programming environment develops, these instructions
Survey of Math: Excel Spreadsheet Guide (for Excel 2016) Page 1 of 9
 Page 1 of 9") Survey of Math: Excel Spreadsheet Guide (for Excel 2016) Page 1 of 9 Contents 1 Introduction to Using Excel Spreadsheets 2 1.1 A Serious Note About Data Security.................................... 2 1.2
Survey of Math: Excel Spreadsheet Guide (for Excel 2016) Page 1 of 9 Contents 1 Introduction to Using Excel Spreadsheets 2 1.1 A Serious Note About Data Security.................................... 2 1.2
ACTIVITY TWO CONSTANT VELOCITY IN TWO DIRECTIONS
 1 ACTIVITY TWO CONSTANT VELOCITY IN TWO DIRECTIONS Purpose The overall goal of this activity is for students to analyze the motion of an object moving with constant velocity along a diagonal line. In this
CHAPTER 3 WAVEFRONT RECONSTRUCTION METHODS. 3.1 Spatial Correlation Method
 CHAPTER 3 WAVEFRONT RECONSTRUCTION METHODS Pierce [9] defines a wavefront as any moving surface along which a waveform feature is being simultaneously received. The first step in performing ray tracing
Geometric Entities for Pilot3D. Copyright 2001 by New Wave Systems, Inc. All Rights Reserved
 Geometric Entities for Pilot3D Copyright 2001 by New Wave Systems, Inc. All Rights Reserved Introduction on Geometric Entities for Pilot3D The best way to develop a good understanding of any Computer-Aided
Image Processing, Analysis and Machine Vision
 Image Processing, Analysis and Machine Vision Milan Sonka PhD University of Iowa Iowa City, USA Vaclav Hlavac PhD Czech Technical University Prague, Czech Republic and Roger Boyle DPhil, MBCS, CEng University