L13-Mon-3-Oct-2016-Sec-1-1-Dist-Midpt-HW Graph-HW12-Moodle-Q11, page 1 L13-Mon-3-Oct-2016-Sec-1-1-Dist-Midpt-HW Graph-HW12-Moodle-Q11
|
|
|
- Abraham Harrell
- 5 years ago
- Views:
Transcription

1 L13-Mon-3-Oct-016-Sec-1-1-Dist-Midpt-HW11-1--Graph-HW1-Moodle-Q11, page 1 L13-Mon-3-Oct-016-Sec-1-1-Dist-Midpt-HW11-1--Graph-HW1-Moodle-Q Rectangular Coordinate System: Suppose we know the sum of two numbers is 6. We could represent this situation with the equation x + y = 6. There are an infinite number of possibilities for x and y: 1 and 5; -4 and 10; 0 and 6; etc. We could visualize this relation between x and y by plotting points using two number lines, one for x and the other for y.

2 L13-Mon-3-Oct-016-Sec-1-1-Dist-Midpt-HW11-1--Graph-HW1-Moodle-Q11, page A better way is to do this: Draw a horizontal number line. This is usually called the x-axis and is labeled with the variable x. Next, draw a vertical number line perpendicular to the x-axis with the two number lines intersecting at zero. The vertical number line is usually called the y-axis and is labeled with the variable y. The point of intersection, the zero of each number line, is called the origin.
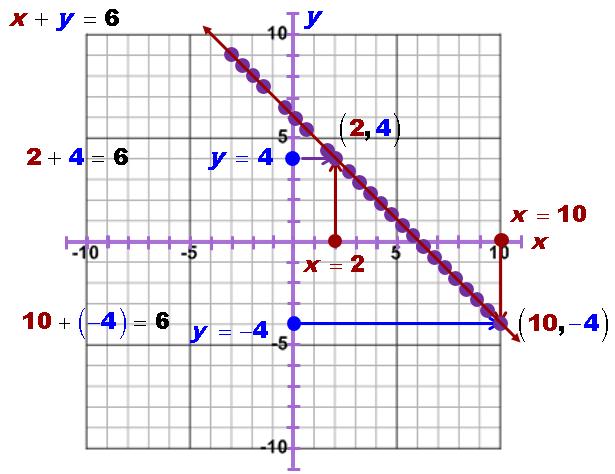

3 L13-Mon-3-Oct-016-Sec-1-1-Dist-Midpt-HW11-1--Graph-HW1-Moodle-Q11, page 3 Now, plot points where the x and y coordinates satisfy the equation x + y = 6: The flat surface that the axes and the grid lie on is called the xy-plane.
4 L13-Mon-3-Oct-016-Sec-1-1-Dist-Midpt-HW11-1--Graph-HW1-Moodle-Q11, page 4 Taken together, the number lines and grid, form a rectangular coordinate system. Because we typically use x and y for the variables, a rectangular coordinate system is often called an xycoordinate system. Also, because the French mathematician Rene Descartes is credited with developing this type of coordinate system, it is also referred to as the Cartesian coordinate system. Every point in the xy-plane has two numbers associated with it. The x-coordinate or abscissa tells how far the point lies to the left or right of the y-axis. The y-coordinate or ordinate tells how far the point lies above or below the x-axis. The x-and y-coordinate are often written inside parentheses like this: (x, y). The first number always represents the x-coordinate and the second number always represents the y-coordinate. Because the order in which the numbers is written is important, (x, y) is called an ordered pair. The x- and y-axes divide the plane into four regions called quadrants. These are labeled with the Roman numerals I, II, III, and IV in a counter-clockwise direction beginning in the upper right. Points on the axes do not lie in a quadrant. The rectangular coordinate system can be used to connect algebra and geometry. For example, suppose we have any two points x y and x, y. Note use of subscripts. We want to find the distance between the points. Use Pythagoras to find the hypotenuse., This gives us the Distance Formula (memorize this): d P, P x x y y
 and (0, y) that are a distance of 5 units from each other.")
5 L13-Mon-3-Oct-016-Sec-1-1-Dist-Midpt-HW11-1--Graph-HW1-Moodle-Q11, page 5 It looks like there will be two points. If the points are on the y-axis then their x component must be 0. So, we have the two points (4, 4) and (0, y) that are a distance of 5 units from each other., d P P x x y y y y y y 3 4 y or 3 4 y y 1 or y 7 So, the two points are (0, 1) and (0, 7).

6 L13-Mon-3-Oct-016-Sec-1-1-Dist-Midpt-HW11-1--Graph-HW1-Moodle-Q11, page 6 The midpoint x, y of a line segment connecting points P 1 x, y 1 1 and P x, y is the point where the distance from x, y 1 1 to x, y is the same as the distance from x, y to x, y. We can use the distance formula to find x, y. x y x y x y x y 1, 1, x x 1 y y1 x x y y x x y y x x y y distance from to, distance from to, 1 1 The x and y variables are completely independent of each other. That is, for a given x, y can be anything and vice versa. So, we can break up this equation into two equations, one involving x and the other involving y. Then, we can solve each equation independently. x x x x 1 x x x x 1 x x x x or x x x x 1 1 x x or x x x x 1 1 x x x 1 x x 1 x x1 = x means the two points are the same so we ignore that solution. x x 1 The y part works the same. This gives the formulas: x midpoint y y 1 y midpoint
7 L13-Mon-3-Oct-016-Sec-1-1-Dist-Midpt-HW11-1--Graph-HW1-Moodle-Q11, page 7

8 L13-Mon-3-Oct-016-Sec-1-1-Dist-Midpt-HW11-1--Graph-HW1-Moodle-Q11, page 8 Let d = distance from balloon to intersection (feet) Let t = time since balloon passed intersection (seconds) From the diagram we see that we have a right triangle and want to find the hypotenuse. So, use Pythagoras: d dist along road vertical dist Hypotenuse d feet Vertical Leg 100 feet 15 miles Horizontal Leg 15 mpht t hours 15t miles 1 hour Since we use feet and seconds we must convert 15 mph to feet per second before using Pythagoras. 15 mi 580 ft 1 hr 15mph 1 hr 1 mi 3600 sec feet 1 second ft per sec
9 L13-Mon-3-Oct-016-Sec-1-1-Dist-Midpt-HW11-1--Graph-HW1-Moodle-Q11, page 9 d dist along road vertical dist ft t sec 1sec t ,000 Here is the graph: 100 ft Notice that when t gets very large, 484t completely dominates the 10,000 and we have d for t 484t 10,000 d 484t t That is lim 484t 10,000 t which is a straight line. Check: When time t 0, d ,000 10, ft t

10 L13-Mon-3-Oct-016-Sec-1-1-Dist-Midpt-HW11-1--Graph-HW1-Moodle-Q11, page 10 x-intercept: Value of x when y = 0: 0 x x 6 x x 0 3 x 3 or x x -int: 3,0 and,0 y-intercept: Value of y when x = 0 y y y -int: 0, 6
11 L13-Mon-3-Oct-016-Sec-1-1-Dist-Midpt-HW11-1--Graph-HW1-Moodle-Q11, page 11 x-intercept: x 0 16 y-intercept: 0 x 1 x y ,0 and 3.5,0 y 16 y 4 or y 4 y 6 or y 0,6 or 0,
12 L13-Mon-3-Oct-016-Sec-1-1-Dist-Midpt-HW11-1--Graph-HW1-Moodle-Q11, page 1
13 L13-Mon-3-Oct-016-Sec-1-1-Dist-Midpt-HW11-1--Graph-HW1-Moodle-Q11, page 13 We can test for symmetries if we have the equation by doing the following: Symmetry about x axis: Replace y with -y and simplify. If you get the original equation you have symmetry about the x axis. Symmetry about y axis: Replace x with -x and simplify. If you get the original equation you have symmetry about the y axis. Using function notation: f x f x Symmetry about origin: Replace x with -x and simplify. If you get the NEGATIVE of the original equation you have symmetry about the origin. Using function notation: f x f x Say whether each of these has x, y, or origin symmetry or none of these. 5 y x x x x y 5 x 5 x x Since we get back -y, this is symmetric about the origin.
14 L13-Mon-3-Oct-016-Sec-1-1-Dist-Midpt-HW11-1--Graph-HW1-Moodle-Q11, page 14 y x 4 x x x x 1 4 x 1 y Since we get back y, this is symmetric about the y-axis. x 4 y x x x x 4 x 4 x 4 y x x x Since we get back -y, this is symmetric about the origin.
15 L13-Mon-3-Oct-016-Sec-1-1-Dist-Midpt-HW11-1--Graph-HW1-Moodle-Q11, page 15 Complete the graph to make it Symmetric about the x-axis Complete the graph to make it Symmetric about the y-axis Complete the graph to make it Symmetric about the y-axis
Each point P in the xy-plane corresponds to an ordered pair (x, y) of real numbers called the coordinates of P.
 of real numbers called the coordinates of P.") Lecture 7, Part I: Section 1.1 Rectangular Coordinates Rectangular or Cartesian coordinate system Pythagorean theorem Distance formula Midpoint formula Lecture 7, Part II: Section 1.2 Graph of Equations
Lecture 7, Part I: Section 1.1 Rectangular Coordinates Rectangular or Cartesian coordinate system Pythagorean theorem Distance formula Midpoint formula Lecture 7, Part II: Section 1.2 Graph of Equations
+ b. From this we can derive the following equations:
 A. GEOMETRY REVIEW Pythagorean Theorem (A. p. 58) Hypotenuse c Leg a 9º Leg b The Pythagorean Theorem is a statement about right triangles. A right triangle is one that contains a right angle, that is,
Rational Numbers: Graphing: The Coordinate Plane
 Rational Numbers: Graphing: The Coordinate Plane A special kind of plane used in mathematics is the coordinate plane, sometimes called the Cartesian plane after its inventor, René Descartes. It is one
Section 1.1 The Distance and Midpoint Formulas; Graphing Utilities; Introduction to Graphing Equations
 Section 1.1 The Distance and Midpoint Formulas; Graphing Utilities; Introduction to Graphing Equations origin (x, y) Ordered pair (x-coordinate, y-coordinate) (abscissa, ordinate) x axis Rectangular or
1.6 Modeling with Equations
 1.6 Modeling with Equations Steps to Modeling Problems with Equations 1. Identify the variable you want to solve for. 2. Express all unknown quantities in terms of this variable. 3. Set up the model by
.(3, 2) Co-ordinate Geometry Co-ordinates. Every point has two co-ordinates. Plot the following points on the plane. A (4, 1) D (2, 5) G (6, 3)
 Co-ordinate Geometry Co-ordinates. Every point has two co-ordinates. Plot the following points on the plane. A (4, 1) D (2, 5) G (6, 3)") Co-ordinate Geometry Co-ordinates Every point has two co-ordinates. (3, 2) x co-ordinate y co-ordinate Plot the following points on the plane..(3, 2) A (4, 1) D (2, 5) G (6, 3) B (3, 3) E ( 4, 4) H (6,
Co-ordinate Geometry Co-ordinates Every point has two co-ordinates. (3, 2) x co-ordinate y co-ordinate Plot the following points on the plane..(3, 2) A (4, 1) D (2, 5) G (6, 3) B (3, 3) E ( 4, 4) H (6,
1.8 Coordinate Geometry. Copyright Cengage Learning. All rights reserved.
 1.8 Coordinate Geometry Copyright Cengage Learning. All rights reserved. Objectives The Coordinate Plane The Distance and Midpoint Formulas Graphs of Equations in Two Variables Intercepts Circles Symmetry
7/7/2016 Unit 4: Linear Relations Grade 9 Mathematics
 Rene Descartes, a mathematician who lived during the 17 th century, developed a system for graphing ordered pairs on a grid. This system is called the Cartesian Coordinate System. 1 In this system, ordered
The x coordinate tells you how far left or right from center the point is. The y coordinate tells you how far up or down from center the point is.
 We will review the Cartesian plane and some familiar formulas. College algebra Graphs 1: The Rectangular Coordinate System, Graphs of Equations, Distance and Midpoint Formulas, Equations of Circles Section
Section Graphs and Lines
 Section 1.1 - Graphs and Lines The first chapter of this text is a review of College Algebra skills that you will need as you move through the course. This is a review, so you should have some familiarity
Math 3 Coordinate Geometry part 1 Unit November 3, 2016
 Reviewing the basics The number line A number line is a visual representation of all real numbers. Each of the images below are examples of number lines. The top left one includes only positive whole numbers,
3.1. 3x 4y = 12 3(0) 4y = 12. 3x 4y = 12 3x 4(0) = y = x 0 = 12. 4y = 12 y = 3. 3x = 12 x = 4. The Rectangular Coordinate System
 4y = 12. 3x 4y = 12 3x 4(0) = y = x 0 = 12. 4y = 12 y = 3. 3x = 12 x = 4. The Rectangular Coordinate System") 3. The Rectangular Coordinate System Interpret a line graph. Objectives Interpret a line graph. Plot ordered pairs. 3 Find ordered pairs that satisfy a given equation. 4 Graph lines. 5 Find x- and y-intercepts.
3. The Rectangular Coordinate System Interpret a line graph. Objectives Interpret a line graph. Plot ordered pairs. 3 Find ordered pairs that satisfy a given equation. 4 Graph lines. 5 Find x- and y-intercepts.
CHAPTER 2 REVIEW COORDINATE GEOMETRY MATH Warm-Up: See Solved Homework questions. 2.2 Cartesian coordinate system
 CHAPTER 2 REVIEW COORDINATE GEOMETRY MATH6 2.1 Warm-Up: See Solved Homework questions 2.2 Cartesian coordinate system Coordinate axes: Two perpendicular lines that intersect at the origin O on each line.
Graphs and Linear Functions
 Graphs and Linear Functions A -dimensional graph is a visual representation of a relationship between two variables given by an equation or an inequality. Graphs help us solve algebraic problems by analysing
3 CHAPTER. Coordinate Geometry
 3 CHAPTER We are Starting from a Point but want to Make it a Circle of Infinite Radius Cartesian Plane Ordered pair A pair of numbers a and b instead in a specific order with a at the first place and b
Math 2 Coordinate Geometry Part 1 Slope & Transformations
 Math 2 Coordinate Geometry Part 1 Slope & Transformations 1 MATH 1 REVIEW: THE NUMBER LINE A number line is a visual representation of all real numbers. Each of the images below are examples of number
The Rectangular Coordinate Systems and Graphs
 OpenStax-CNX module: m51252 1 The Rectangular Coordinate Systems and Graphs OpenStax College This work is produced by OpenStax-CNX and licensed under the Creative Commons Attribution License 4.0 In this
Section 3.1 Graphing Using the Rectangular Coordinate System
 Objectives Section 3.1 Graphing Using the Rectangular Coordinate System n Construct a rectangular coordinate system n Plot ordered pairs and determine the coordinates of a point n Graph paired data n Read
6.1 The Rectangular Coordinate System
 6.1 The Rectangular Coordinate System In this chapter we want to take a look at the connection between algebra and geometry. This connection is made in the graphing of equations. We will start by looking
Section 10.1 Polar Coordinates
 Section 10.1 Polar Coordinates Up until now, we have always graphed using the rectangular coordinate system (also called the Cartesian coordinate system). In this section we will learn about another system,
The Rectangular Coordinate System and Equations of Lines. College Algebra
 The Rectangular Coordinate System and Equations of Lines College Algebra Cartesian Coordinate System A grid system based on a two-dimensional plane with perpendicular axes: horizontal axis is the x-axis
Section 2 0: The Rectangular Coordinate System. The Coordinate System
 Section 2 : The Rectangular Coordinate System The rectangular coordinate system is based on two number lines. A horizontal line called the x axis and a vertical line called the y axis. Each axis has marks
Exercise (3.1) Question 1: How will you describe the position of a table lamp on your study table to another person?
 Question 1: How will you describe the position of a table lamp on your study table to another person?") Class IX - NCERT Maths Exercise (3.1) Question 1: How will you describe the position of a table lamp on your study table to another person? Solution 1: Let us consider the given below figure of a study
Class IX - NCERT Maths Exercise (3.1) Question 1: How will you describe the position of a table lamp on your study table to another person? Solution 1: Let us consider the given below figure of a study
MATHEMATICS 105 Plane Trigonometry
 Chapter I THE TRIGONOMETRIC FUNCTIONS MATHEMATICS 105 Plane Trigonometry INTRODUCTION The word trigonometry literally means triangle measurement. It is concerned with the measurement of the parts, sides,
Review Exercise. 1. Determine vector and parametric equations of the plane that contains the
 Review Exercise 1. Determine vector and parametric equations of the plane that contains the points A11, 2, 12, B12, 1, 12, and C13, 1, 42. 2. In question 1, there are a variety of different answers possible,
Class IX Mathematics (Ex. 3.1) Questions
 Questions") Class IX Mathematics (Ex. 3.1) Questions 1. How will you describe the position of a table lamp on your study table to another person? 2. (Street Plan): A city has two main roads which cross each other
Class IX Mathematics (Ex. 3.1) Questions 1. How will you describe the position of a table lamp on your study table to another person? 2. (Street Plan): A city has two main roads which cross each other
Coordinate Geometry. Coordinate geometry is the study of the relationships between points on the Cartesian plane
 Coordinate Geometry Coordinate geometry is the study of the relationships between points on the Cartesian plane What we will explore in this tutorial (a) Explore gradient I. Identify the gradient of a
Section 1.1 The Distance and Midpoint Formulas
 Section 1.1 The Distance and Midpoint Formulas 1 y axis origin x axis 2 Plot the points: ( 3, 5), (0,7), ( 6,0), (6,4) 3 Distance Formula y x 4 Finding the Distance Between Two Points Find the distance
WHAT YOU SHOULD LEARN
 GRAPHS OF EQUATIONS WHAT YOU SHOULD LEARN Sketch graphs of equations. Find x- and y-intercepts of graphs of equations. Use symmetry to sketch graphs of equations. Find equations of and sketch graphs of
FLC Ch 3. Ex 1 Plot the points Ex 2 Give the coordinates of each point shown. Sec 3.2: Solutions and Graphs of Linear Equations
 Math 100 Elementary Algebra Sec 3.1: The Rectangular Coordinate System x-axis and y-axis origin ordered pair x-coordinate y-coordinate quadrants (I, II, III, and IV) Rectangular/Cartesian Coordinate System
Chapter 1. Linear Equations and Straight Lines. 2 of 71. Copyright 2014, 2010, 2007 Pearson Education, Inc.
 Chapter 1 Linear Equations and Straight Lines 2 of 71 Outline 1.1 Coordinate Systems and Graphs 1.4 The Slope of a Straight Line 1.3 The Intersection Point of a Pair of Lines 1.2 Linear Inequalities 1.5
5. In the Cartesian plane, a line runs through the points (5, 6) and (-2, -2). What is the slope of the line?
 and (-2, -2). What is the slope of the line?") Slope review Using two points to find the slope In mathematics, the slope of a line is often called m. We can find the slope if we have two points on the line. We'll call the first point and the second
Slope review Using two points to find the slope In mathematics, the slope of a line is often called m. We can find the slope if we have two points on the line. We'll call the first point and the second
The Coordinate System and Graphs
 The Coordinate System and Graphs - 3.1-3.2 Fall 2013 - Math 1010 (Math 1010) M 1010 3.1-3.2 1 / 17 Roadmap Plotting ordered pairs. The distance formula. The midpoint formula. Graphs of equations. Intercepts.
Sec 4.1 Coordinates and Scatter Plots. Coordinate Plane: Formed by two real number lines that intersect at a right angle.
 Algebra I Chapter 4 Notes Name Sec 4.1 Coordinates and Scatter Plots Coordinate Plane: Formed by two real number lines that intersect at a right angle. X-axis: The horizontal axis Y-axis: The vertical
Topic. Section 4.1 (3, 4)
") Topic.. California Standards: 6.0: Students graph a linear equation and compute the x- and y-intercepts (e.g., graph x + 6y = ). They are also able to sketch the region defined by linear inequality (e.g.,
Topic.. California Standards: 6.0: Students graph a linear equation and compute the x- and y-intercepts (e.g., graph x + 6y = ). They are also able to sketch the region defined by linear inequality (e.g.,
6th Grade Graphing
 1 6th Grade Graphing 2015-12-02 www.njctl.org 2 Graphing 6th Grade Topics Cartesian Plane Click on the topic to go to that section Graphing Ordered Pairs Polygons in the Coordinate Plane Cartesian Plane
About Graphing Lines
 About Graphing Lines TABLE OF CONTENTS About Graphing Lines... 1 What is a LINE SEGMENT?... 1 Ordered Pairs... 1 Cartesian Co-ordinate System... 1 Ordered Pairs... 2 Line Segments... 2 Slope of a Line
LESSON 3.1 INTRODUCTION TO GRAPHING
 LESSON 3.1 INTRODUCTION TO GRAPHING LESSON 3.1 INTRODUCTION TO GRAPHING 137 OVERVIEW Here s what ou ll learn in this lesson: Plotting Points a. The -plane b. The -ais and -ais c. The origin d. Ordered
Lecture 5. If, as shown in figure, we form a right triangle With P1 and P2 as vertices, then length of the horizontal
 Distance; Circles; Equations of the form Lecture 5 y = ax + bx + c In this lecture we shall derive a formula for the distance between two points in a coordinate plane, and we shall use that formula to
Graphs of Equations. MATH 160, Precalculus. J. Robert Buchanan. Fall Department of Mathematics. J. Robert Buchanan Graphs of Equations
 Graphs of Equations MATH 160, Precalculus J. Robert Buchanan Department of Mathematics Fall 2011 Objectives In this lesson we will learn to: sketch the graphs of equations, find the x- and y-intercepts
Rational Numbers on the Coordinate Plane. 6.NS.C.6c
 Rational Numbers on the Coordinate Plane 6.NS.C.6c Copy all slides into your composition notebook. Lesson 14 Ordered Pairs Objective: I can use ordered pairs to locate points on the coordinate plane. Guiding
Math Analysis Chapter 1 Notes: Functions and Graphs
 Math Analysis Chapter 1 Notes: Functions and Graphs Day 6: Section 1-1 Graphs Points and Ordered Pairs The Rectangular Coordinate System (aka: The Cartesian coordinate system) Practice: Label each on the
Geometry R. Unit 12 Coordinate Geometry. Day Classwork Day Homework Wednesday 3/7 Thursday 3/8 Friday 3/9
 Geometry R Unit 12 Coordinate Geometry Day Classwork Day Homework Wednesday 3/7 Thursday 3/8 Friday 3/9 Unit 11 Test Review Equations of Lines 1 HW 12.1 Perimeter and Area of Triangles in the Coordinate
The Graph of an Equation Graph the following by using a table of values and plotting points.
 Precalculus - Calculus Preparation - Section 1 Graphs and Models Success in math as well as Calculus is to use a multiple perspective -- graphical, analytical, and numerical. Thanks to Rene Descartes we
Unit Circle. Project Response Sheet
 NAME: PROJECT ACTIVITY: Trigonometry TOPIC Unit Circle GOALS MATERIALS Explore Degree and Radian Measure Explore x- and y- coordinates on the Unit Circle Investigate Odd and Even functions Investigate
Intro. To Graphing Linear Equations
 Intro. To Graphing Linear Equations The Coordinate Plane A. The coordinate plane has 4 quadrants. B. Each point in the coordinate plain has an x-coordinate (the abscissa) and a y-coordinate (the ordinate).
Maintaining Mathematical Proficiency
 NBHCA SUMMER WORK FOR ALGEBRA 1 HONORS AND GEOMETRY HONORS Name 1 Add or subtract. 1. 1 3. 0 1 3. 5 4. 4 7 5. Find two pairs of integers whose sum is 6. 6. In a city, the record monthly high temperature
Review for Mastery Using Graphs and Tables to Solve Linear Systems
 3-1 Using Graphs and Tables to Solve Linear Systems A linear system of equations is a set of two or more linear equations. To solve a linear system, find all the ordered pairs (x, y) that make both equations
MATH 115: Review for Chapter 1
 MATH 115: Review for Chapter 1 Can you use the Distance Formula to find the distance between two points? (1) Find the distance d P, P between the points P and 1 1, 6 P 10,9. () Find the length of the line
Math 3C Section 9.1 & 9.2
 Math 3C Section 9.1 & 9.2 Yucheng Tu 11/14/2018 1 Unit Circle The unit circle comes to the stage when we enter the field of trigonometry, i.e. the study of relations among the sides and angles of an arbitrary
Example 1: Give the coordinates of the points on the graph.
 Ordered Pairs Often, to get an idea of the behavior of an equation, we will make a picture that represents the solutions to the equation. A graph gives us that picture. The rectangular coordinate plane,
Geometry Pre AP Graphing Linear Equations
 Geometry Pre AP Graphing Linear Equations Name Date Period Find the x- and y-intercepts and slope of each equation. 1. y = -x 2. x + 3y = 6 3. x = 2 4. y = 0 5. y = 2x - 9 6. 18x 42 y = 210 Graph each
Chapter 11 GRAPHS OF LINEAR EQUATIONS
 Chapter 11 GRAPHS OF LINEAR EQUATIONS 11.1 Graphs and Applications of Linear Equations Learning Objectives A Plot points associated with ordered pairs of numbers; determine the quadrant in which a point
Slide 1 / 220. Linear Relations and Functions
 Slide 1 / 220 Linear Relations and Functions Slide 2 / 220 Table of Contents Domain and Range Discrete v Continuous Relations and Functions Function Notation Linear Equations Graphing a Linear Equation
Math Analysis Chapter 1 Notes: Functions and Graphs
 Math Analysis Chapter 1 Notes: Functions and Graphs Day 6: Section 1-1 Graphs; Section 1- Basics of Functions and Their Graphs Points and Ordered Pairs The Rectangular Coordinate System (aka: The Cartesian
Section 3.1 Objective 1: Plot Points in the Rectangular Coordinate System Video Length 12:35
 Section 3.1 Video Guide The Rectangular Coordinate System and Equations in Two Variables Objectives: 1. Plot Points in the Rectangular Coordinate System 2. Determine If an Ordered Pair Satisfies an Equation
3 John likes to experiment with geometric. 4 Which of the following conjectures is true for
 1 Rectangle ABCD is drawn on a coordinate plane. Each angle measures 90. The rectangle is reflected across the y axis, translated 9 units down, and then rotated 180 clockwise about the origin. What would
WRITING AND GRAPHING LINEAR EQUATIONS ON A FLAT SURFACE #1313
 WRITING AND GRAPHING LINEAR EQUATIONS ON A FLAT SURFACE #11 SLOPE is a number that indicates the steepness (or flatness) of a line, as well as its direction (up or down) left to right. SLOPE is determined
1.1 Functions. Cartesian Coordinate System
 1.1 Functions This section deals with the topic of functions, one of the most important topics in all of mathematics. Let s discuss the idea of the Cartesian coordinate system first. Cartesian Coordinate
What You ll See in This Chapter. Word Cloud. René Descartes. Introduction. Ian Parberry University of North Texas. Fletcher Dunn
 What You ll See in This Chapter Chapter 1: Cartesian Coordinate Systems Fletcher Dunn Valve Software Ian Parberry University of North Texas This chapter describes the basic concepts of 3D math. It is divided
4.1 Ordered Pairs and Graphs. Copyright Cengage Learning. All rights reserved.
 4.1 Ordered Pairs and Graphs Copyright Cengage Learning. All rights reserved. 1 What You Will Learn Plot points on a rectangular coordinate system Determine whether ordered pairs are solutions of equations
Chapter 9 Topics in Analytic Geometry
 Chapter 9 Topics in Analytic Geometry What You ll Learn: 9.1 Introduction to Conics: Parabolas 9.2 Ellipses 9.3 Hyperbolas 9.5 Parametric Equations 9.6 Polar Coordinates 9.7 Graphs of Polar Equations 9.1
Quadratic Functions CHAPTER. 1.1 Lots and Projectiles Introduction to Quadratic Functions p. 31
 CHAPTER Quadratic Functions Arches are used to support the weight of walls and ceilings in buildings. Arches were first used in architecture by the Mesopotamians over 4000 years ago. Later, the Romans
Beecher J.A, Penna J.A., Bittinger M.L. Algebra and Trigonometry (3ed, Addison Wesley, 2007) 58 Chapter 1 Graphs, Functions, and Models
 58 Chapter 1 Graphs, Functions, and Models") Beecher J.A, Penna J.A., Bittinger M.L. Algebra and Trigonometr (ed, Addison Wesle, 007) 8 Chapter Graphs, Functions, and Models.. Introduction Polnomial to Functions Graphing and Modeling Plot points.
Beecher J.A, Penna J.A., Bittinger M.L. Algebra and Trigonometr (ed, Addison Wesle, 007) 8 Chapter Graphs, Functions, and Models.. Introduction Polnomial to Functions Graphing and Modeling Plot points.
Lesson 8: Graphs and Graphing Linear Equations
 In this chapter, we will begin looking at the relationships between two variables. Typically one variable is considered to be the input, and the other is called the output. The input is the value that
(0, 4) Figure 12. x + 3. d = c. = b. Figure 13
 Figure 12. x + 3. d = c. = b. Figure 13") 80 CHAPTER EQUATIONS AND INEQUALITIES Plot both points, and draw a line passing through them as in Figure. Tr It # _, 0 Figure Find the intercepts of the equation and sketch the graph: = _ +. (0, (This
80 CHAPTER EQUATIONS AND INEQUALITIES Plot both points, and draw a line passing through them as in Figure. Tr It # _, 0 Figure Find the intercepts of the equation and sketch the graph: = _ +. (0, (This
Pre-calculus Chapter 4 Part 1 NAME: P.
 Pre-calculus NAME: P. Date Day Lesson Assigned Due 2/12 Tuesday 4.3 Pg. 284: Vocab: 1-3. Ex: 1, 2, 7-13, 27-32, 43, 44, 47 a-c, 57, 58, 63-66 (degrees only), 69, 72, 74, 75, 78, 79, 81, 82, 86, 90, 94,
Rational Numbers and the Coordinate Plane
 Rational Numbers and the Coordinate Plane LAUNCH (8 MIN) Before How can you use the numbers placed on the grid to figure out the scale that is used? Can you tell what the signs of the x- and y-coordinates
Parallel or Perpendicular? How Can You Tell? Teacher Notes Page 1 of 6
 Teacher Notes How can a student be sure when lines are parallel or perpendicular to a given graph using the graphing calculator? The difficulty lies in matching a mechanical graph that is on a rectangular
You should be able to plot points on the coordinate axis. You should know that the the midpoint of the line segment joining (x, y 1 1
 Name GRAPHICAL REPRESENTATION OF DATA: You should be able to plot points on the coordinate axis. You should know that the the midpoint of the line segment joining (x, y 1 1 ) and (x, y ) is x1 x y1 y,.
If three points A (h, 0), P (a, b) and B (0, k) lie on a line, show that: a b 1.
, P (a, b) and B (0, k) lie on a line, show that: a b 1.") ASSIGNMENT ON STRAIGHT LINES LEVEL 1 (CBSE/NCERT/STATE BOARDS) 1 Find the angle between the lines joining the points (0, 0), (2, 3) and the points (2, 2), (3, 5). 2 What is the value of y so that the line
ASSIGNMENT ON STRAIGHT LINES LEVEL 1 (CBSE/NCERT/STATE BOARDS) 1 Find the angle between the lines joining the points (0, 0), (2, 3) and the points (2, 2), (3, 5). 2 What is the value of y so that the line
Exam 2 Review. 2. What the difference is between an equation and an expression?
 Exam 2 Review Chapter 1 Section1 Do You Know: 1. What does it mean to solve an equation? 2. What the difference is between an equation and an expression? 3. How to tell if an equation is linear? 4. How
Module Four: Connecting Algebra and Geometry Through Coordinates
 NAME: Period: Module Four: Connecting Algebra and Geometry Through Coordinates Topic A: Rectangular and Triangular Regions Defined by Inequalities Lesson 1: Searching a Region in the Plane Lesson 2: Finding
Graphing Linear Equations
 Graphing Linear Equations Question 1: What is a rectangular coordinate system? Answer 1: The rectangular coordinate system is used to graph points and equations. To create the rectangular coordinate system,
Math 8 Honors Coordinate Geometry part 3 Unit Updated July 29, 2016
 Review how to find the distance between two points To find the distance between two points, use the Pythagorean theorem. The difference between is one leg and the difference between and is the other leg.
Algebra 1 Semester 2 Final Review
 Team Awesome 011 Name: Date: Period: Algebra 1 Semester Final Review 1. Given y mx b what does m represent? What does b represent?. What axis is generally used for x?. What axis is generally used for y?
Test Name: Chapter 3 Review
 Test Name: Chapter 3 Review 1. For the following equation, determine the values of the missing entries. If needed, write your answer as a fraction reduced to lowest terms. 10x - 8y = 18 Note: Each column
Glossary Common Core Curriculum Maps Math/Grade 6 Grade 8
 Glossary Common Core Curriculum Maps Math/Grade 6 Grade 8 Grade 6 Grade 8 absolute value Distance of a number (x) from zero on a number line. Because absolute value represents distance, the absolute value
Geometry Unit 5 Geometric and Algebraic Connections. Table of Contents
 Geometry Unit 5 Geometric and Algebraic Connections Table of Contents Lesson 5 1 Lesson 5 2 Distance.p. 2-3 Midpoint p. 3-4 Partitioning a Directed Line. p. 5-6 Slope. p.7-8 Lesson 5 3 Revisit: Graphing
UNIT 4 NOTES. 4-1 and 4-2 Coordinate Plane
 UNIT 4 NOTES 4-1 and 4-2 Coordinate Plane y Ordered pairs on a graph have several names. (X coordinate, Y coordinate) (Domain, Range) (Input,Output) Plot these points and label them: a. (3,-4) b. (-5,2)
FORMULAS to UNDERSTAND & MEMORIZE
 1 of 6 FORMULAS to UNDERSTAND & MEMORIZE Now we come to the part where you need to just bear down and memorize. To make the process a bit simpler, I am providing all of the key info that they re going
Section 7D Systems of Linear Equations
 Section 7D Systems of Linear Equations Companies often look at more than one equation of a line when analyzing how their business is doing. For example a company might look at a cost equation and a profit
UNIT 5: GEOMETRIC AND ALGEBRAIC CONNECTIONS. Apply Geometric Concepts in Modeling Situations
 UNIT 5: GEOMETRIC AND ALGEBRAIC CONNECTIONS This unit investigates coordinate geometry. Students look at equations for circles and use given information to derive equations for representations of these
Algebra I Summer Math Packet
 01 Algebra I Summer Math Packet DHondtT Grosse Pointe Public Schools 5/0/01 Evaluate the power. 1.. 4. when = Write algebraic epressions and algebraic equations. Use as the variable. 4. 5. 6. the quotient
Unit 1. Name. Basics of Geometry Part 1. 2 Section 1: Introduction to Geometry Points, Lines and Planes
 Name Period Date Points, lines, and planes are the building blocks of geometry. What is geometry? Unit 1 Basics of Geometry Part 1 Geometry means, and it involves the properties of points, lines, planes
Geometry Unit 2: Linear. Section Page and Problems Date Assigned
 Geometry Name: Geometry Unit 2: Linear Topics Covered: Midpoint formula Distance formula Slope Slope- Intercept Form Point- Slope Form Standard Form Assignment # Section Page and Problems Date Assigned
CHAPTER. Graphs of Linear Equations. 3.1 Introduction to Graphing 3.2 Graphing Linear Equations 3.3 More with Graphing 3.4 Slope and Applications
 Graphs of Linear Equations CHAPTER 3 3.1 Introduction to Graphing 3.2 Graphing Linear Equations 3.3 More with Graphing 3.4 Slope and Applications Slide 2 3.1 Introduction to Graphing OBJECTIVES a Plot
College Pre Calculus A Period. Weekly Review Sheet # 1 Assigned: Monday, 9/9/2013 Due: Friday, 9/13/2013
 College Pre Calculus A Name Period Weekly Review Sheet # 1 Assigned: Monday, 9/9/013 Due: Friday, 9/13/013 YOU MUST SHOW ALL WORK FOR EVERY QUESTION IN THE BOX BELOW AND THEN RECORD YOUR ANSWERS ON THE
Unit 14: Transformations (Geometry) Date Topic Page
 Date Topic Page") Unit 14: Transformations (Geometry) Date Topic Page image pre-image transformation translation image pre-image reflection clockwise counterclockwise origin rotate 180 degrees rotate 270 degrees rotate
Unit 14: Transformations (Geometry) Date Topic Page image pre-image transformation translation image pre-image reflection clockwise counterclockwise origin rotate 180 degrees rotate 270 degrees rotate
Overview for Families
 unit: Graphing Equations Mathematical strand: Algebra The following pages will help you to understand the mathematics that your child is currently studying as well as the type of problems (s)he will solve
ax + by = 0. x = c. y = d.
 Review of Lines: Section.: Linear Inequalities in Two Variables The equation of a line is given by: ax + by = c. for some given numbers a, b and c. For example x + y = 6 gives the equation of a line. A
Section 2.1 Graphs. The Coordinate Plane
 Section 2.1 Graphs The Coordinate Plane Just as points on a line can be identified with real numbers to form the coordinate line, points in a plane can be identified with ordered pairs of numbers to form
3, 10,( 2, 4) Name. CP Algebra II Midterm Review Packet Unit 1: Linear Equations and Inequalities. Solve each equation. 3.
 Name. CP Algebra II Midterm Review Packet Unit 1: Linear Equations and Inequalities. Solve each equation. 3.") Name CP Algebra II Midterm Review Packet 018-019 Unit 1: Linear Equations and Inequalities Solve each equation. 1. x. x 4( x 5) 6x. 8x 5(x 1) 5 4. ( k ) k 4 5. x 4 x 6 6. V lhw for h 7. x y b for x z Find
Name CP Algebra II Midterm Review Packet 018-019 Unit 1: Linear Equations and Inequalities Solve each equation. 1. x. x 4( x 5) 6x. 8x 5(x 1) 5 4. ( k ) k 4 5. x 4 x 6 6. V lhw for h 7. x y b for x z Find
Indirect measure the measurement of an object through the known measure of another object.
 Indirect measure the measurement of an object through the known measure of another object. M Inequality a sentence that states one expression is greater than, greater than or equal to, less than, less
A is any set of ordered pairs of real numbers. This is a set of ordered pairs of real numbers, so it is a.
 Fry Texas A&M University!! Math 150!! Chapter 3!! Fall 2014! 1 Chapter 3A Rectangular Coordinate System A is any set of ordered pairs of real numbers. A relation can be finite: {(-3, 1), (-3, -1), (0,
Students interpret the meaning of the point of intersection of two graphs and use analytic tools to find its coordinates.
 Student Outcomes Students interpret the meaning of the point of intersection of two graphs and use analytic tools to find its coordinates. Classwork Example 1 (7 minutes) Have students read the situation
Charting new territory: Formulating the Dalivian coordinate system
 Parabola Volume 53, Issue 2 (2017) Charting new territory: Formulating the Dalivian coordinate system Olivia Burton and Emma Davis 1 Numerous coordinate systems have been invented. The very first and most
Geometry CP Constructions Part I Page 1 of 4. Steps for copying a segment (TB 16): Copying a segment consists of making segments.
: Copying a segment consists of making segments.") Geometry CP Constructions Part I Page 1 of 4 Steps for copying a segment (TB 16): Copying a segment consists of making segments. Geometry CP Constructions Part I Page 2 of 4 Steps for bisecting a segment
Geometry CP Constructions Part I Page 1 of 4 Steps for copying a segment (TB 16): Copying a segment consists of making segments. Geometry CP Constructions Part I Page 2 of 4 Steps for bisecting a segment
Student Exploration: Quadratics in Polynomial Form
 Name: Date: Student Exploration: Quadratics in Polynomial Form Vocabulary: axis of symmetry, parabola, quadratic function, vertex of a parabola Prior Knowledge Questions (Do these BEFORE using the Gizmo.)
Section 7.3 from Basic Mathematics Review by Oka Kurniawan was developed by OpenStax College, licensed by Rice University, and is available on the
 Section 7.3 from Basic Mathematics Review by Oka Kurniawan was developed by OpenStax College, licensed by Rice University, and is available on the Connexions website. It is used under a Creative Commons