Section 1.1 The Distance and Midpoint Formulas; Graphing Utilities; Introduction to Graphing Equations
|
|
|
- Allen Boyd
- 6 years ago
- Views:
Transcription
1 Section 1.1 The Distance and Midpoint Formulas; Graphing Utilities; Introduction to Graphing Equations
2 origin (x, y) Ordered pair (x-coordinate, y-coordinate) (abscissa, ordinate) x axis Rectangular or Cartesian Coordinate System
3 Let's plot the point (6,4) (-6,0) (0,7) Let's plot the point (-6,0) (6,4) (-3,-5) 6 7 Let's plot the point (-3,-5) Let's plot the point (0,7)
4 Quadrant II x < 0, y > 0 Quadrant I x > 0, y > 0 Quadrant III x < 0, y < 0 Quadrant IV x > 0, y < 0

5 All graphing utilities (graphing calculators and computer software graphing packages) graph equations by plotting points on a screen. The screen of a graphing utility will display the coordinate axes of a rectangular coordinate system.

6 You must set the scale on each axis. You must also include the smallest and largest values of x and y that you want included in the graph. This is called setting the viewing rectangle or viewing window.

7 Here are these settings and their relation to the Cartesian coordinate system.

8 Finding the Coordinates of a Point Shown on a Graphing Utility Screen Find the coordinates of the point shown. Assume the coordinates are integers. Viewing Window 2 ticks to the left on the horizontal axis (scale = 1) and 1 tick up on the vertical axis (scale = 2), point is ( 2, 2)
9
10

11
12
13 Horizontal or Vertical Segments
 2 d = 1 2 + 3 4 ( ) ( ) d 2 = ( 3) + 7 9 49 ( ) 2 = + =")
14 Find the distance d between the points (2, 4) and ( 1, 3). 2 ( ) 2 d = ( ) ( ) d 2 = ( 3) ( ) 2 = + =
15
16
17
18
19

20

21 Find the midpoint of the line segment from P 1 = (4, 2) to P 2 = (2, 5). Plot the points and their midpoint. y x y 4+ 2 = = 3 2 = = 7 2 M 7 = 3, M P 1 x P 2 5
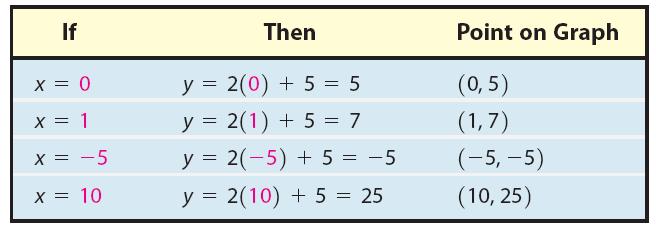
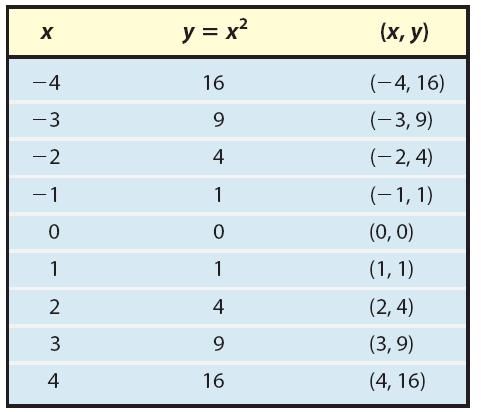
22 Graph Equations by Hand by Plotting Points
23
24 Determine if the following points are on the graph of the equation 3x +y = 6 (a) (0, 4) (b) ( 2, 0) (c) ( 1, 3) 3( 0) + 4= 4 6 3( 2) + 0= 6 ( ) = 3 + 3=
25
26
27 Graph Equations Using a Graphing Utility
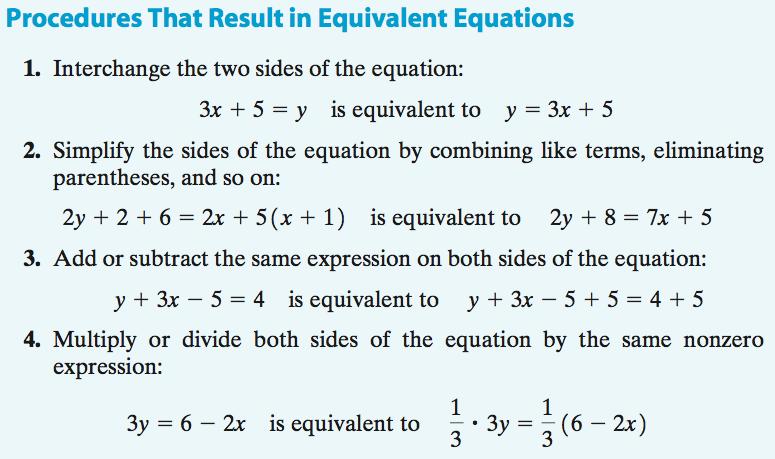
28 To graph an equation in two variables x and y using a graphing utility requires that the equation be written in the form y = {expression in x}. If the original equation is not in this form, rewrite it using equivalent equations until the form y = {expression in x} is obtained. In general, there are four ways to obtain equivalent equations.
29
30 Expressing an Equation in the Form y = {expression in x} Solve for y: 2y + 3x 5 = 4 We replace the original equation by a succession of equivalent equations.
31 Graphing an Equation Using a Graphing Utility Use a graphing utility to graph the equation: 6x 2 + 2y = 36 Step 1: Solve for y. 6x 2 + 3y = 36 3y = 6x y = 2x 2 +12

32 Graphing an Equation Using a Graphing Utility Step 2: Enter the equation into the graphing utility. Step 3: Choose an initial viewing window.


33 Graphing an Equation Using a Graphing Utility Step 4: Graph the equation. Step 5: Adjust the viewing window.
34 Use a Graphing Utility to Create Tables
35 Create a Table Using a Graphing Utility Create a table that displays the points on the graph of 6x 2 + 3y = 36 for x = 3, 2, 1, 0, 1, 2, and 3. Step 1: Solve for y: y = 2x Step 2: Enter the equation into the graphing utility.


36 Create a Table Using a Graphing Utility Step 3: Set up a table using AUTO mode Step 4: Create the table.
37
38
39 .
40 Use a Graphing Utility to Approximate Intercepts

41 Approximating Intercepts Using a Graphing Utility Use a graphing utility to approximate the intercepts of the equation y = x Here s the graph of y = x 3 16.

42 Approximating Intercepts Using a Graphing Utility The evalueate feature of a TI-84 Plus graphing calculator accepts as input a value of x and determines the value of y. If we let x = 0, the y-intercept is found to be 16.
. Rounded to two decimal places, the x-intercept is 2.")
43 Approximating Intercepts Using a Graphing Utility The ZERO feature of a TI-84 Plus is used to find the x-intercept(s). Rounded to two decimal places, the x-intercept is 2.52.
Each point P in the xy-plane corresponds to an ordered pair (x, y) of real numbers called the coordinates of P.
 of real numbers called the coordinates of P.") Lecture 7, Part I: Section 1.1 Rectangular Coordinates Rectangular or Cartesian coordinate system Pythagorean theorem Distance formula Midpoint formula Lecture 7, Part II: Section 1.2 Graph of Equations
Lecture 7, Part I: Section 1.1 Rectangular Coordinates Rectangular or Cartesian coordinate system Pythagorean theorem Distance formula Midpoint formula Lecture 7, Part II: Section 1.2 Graph of Equations
The x coordinate tells you how far left or right from center the point is. The y coordinate tells you how far up or down from center the point is.
 We will review the Cartesian plane and some familiar formulas. College algebra Graphs 1: The Rectangular Coordinate System, Graphs of Equations, Distance and Midpoint Formulas, Equations of Circles Section
Test Name: Chapter 3 Review
 Test Name: Chapter 3 Review 1. For the following equation, determine the values of the missing entries. If needed, write your answer as a fraction reduced to lowest terms. 10x - 8y = 18 Note: Each column
The Rectangular Coordinate System and Equations of Lines. College Algebra
 The Rectangular Coordinate System and Equations of Lines College Algebra Cartesian Coordinate System A grid system based on a two-dimensional plane with perpendicular axes: horizontal axis is the x-axis
Example 1: Give the coordinates of the points on the graph.
 Ordered Pairs Often, to get an idea of the behavior of an equation, we will make a picture that represents the solutions to the equation. A graph gives us that picture. The rectangular coordinate plane,
f( x ), or a solution to the equation f( x) 0. You are already familiar with ways of solving
, or a solution to the equation f( x) 0. You are already familiar with ways of solving") The Bisection Method and Newton s Method. If f( x ) a function, then a number r for which f( r) 0 is called a zero or a root of the function f( x ), or a solution to the equation f( x) 0. You are already
The Bisection Method and Newton s Method. If f( x ) a function, then a number r for which f( r) 0 is called a zero or a root of the function f( x ), or a solution to the equation f( x) 0. You are already
Section Graphs and Lines
 Section 1.1 - Graphs and Lines The first chapter of this text is a review of College Algebra skills that you will need as you move through the course. This is a review, so you should have some familiarity
The Coordinate System and Graphs
 The Coordinate System and Graphs - 3.1-3.2 Fall 2013 - Math 1010 (Math 1010) M 1010 3.1-3.2 1 / 17 Roadmap Plotting ordered pairs. The distance formula. The midpoint formula. Graphs of equations. Intercepts.
L13-Mon-3-Oct-2016-Sec-1-1-Dist-Midpt-HW Graph-HW12-Moodle-Q11, page 1 L13-Mon-3-Oct-2016-Sec-1-1-Dist-Midpt-HW Graph-HW12-Moodle-Q11
 L13-Mon-3-Oct-016-Sec-1-1-Dist-Midpt-HW11-1--Graph-HW1-Moodle-Q11, page 1 L13-Mon-3-Oct-016-Sec-1-1-Dist-Midpt-HW11-1--Graph-HW1-Moodle-Q11 1.1 Rectangular Coordinate System: Suppose we know the sum of
Lesson 8: Graphs and Graphing Linear Equations
 In this chapter, we will begin looking at the relationships between two variables. Typically one variable is considered to be the input, and the other is called the output. The input is the value that
Class IX Mathematics (Ex. 3.1) Questions
 Questions") Class IX Mathematics (Ex. 3.1) Questions 1. How will you describe the position of a table lamp on your study table to another person? 2. (Street Plan): A city has two main roads which cross each other
Class IX Mathematics (Ex. 3.1) Questions 1. How will you describe the position of a table lamp on your study table to another person? 2. (Street Plan): A city has two main roads which cross each other
1.6 Modeling with Equations
 1.6 Modeling with Equations Steps to Modeling Problems with Equations 1. Identify the variable you want to solve for. 2. Express all unknown quantities in terms of this variable. 3. Set up the model by
Section 1.1 The Distance and Midpoint Formulas
 Section 1.1 The Distance and Midpoint Formulas 1 y axis origin x axis 2 Plot the points: ( 3, 5), (0,7), ( 6,0), (6,4) 3 Distance Formula y x 4 Finding the Distance Between Two Points Find the distance
Intro. To Graphing Linear Equations
 Intro. To Graphing Linear Equations The Coordinate Plane A. The coordinate plane has 4 quadrants. B. Each point in the coordinate plain has an x-coordinate (the abscissa) and a y-coordinate (the ordinate).
Graphing Linear Equations
 Graphing Linear Equations Question 1: What is a rectangular coordinate system? Answer 1: The rectangular coordinate system is used to graph points and equations. To create the rectangular coordinate system,
Geometry Unit 2: Linear. Section Page and Problems Date Assigned
 Geometry Name: Geometry Unit 2: Linear Topics Covered: Midpoint formula Distance formula Slope Slope- Intercept Form Point- Slope Form Standard Form Assignment # Section Page and Problems Date Assigned
1.8 Coordinate Geometry. Copyright Cengage Learning. All rights reserved.
 1.8 Coordinate Geometry Copyright Cengage Learning. All rights reserved. Objectives The Coordinate Plane The Distance and Midpoint Formulas Graphs of Equations in Two Variables Intercepts Circles Symmetry
Linear Topics Notes and Homework DUE ON EXAM DAY. Name: Class period:
 Linear Topics Notes and Homework DUE ON EXAM DAY Name: Class period: Absolute Value Axis b Coordinate points Continuous graph Constant Correlation Dependent Variable Direct Variation Discrete graph Domain
About Graphing Lines
 About Graphing Lines TABLE OF CONTENTS About Graphing Lines... 1 What is a LINE SEGMENT?... 1 Ordered Pairs... 1 Cartesian Co-ordinate System... 1 Ordered Pairs... 2 Line Segments... 2 Slope of a Line
Exercise (3.1) Question 1: How will you describe the position of a table lamp on your study table to another person?
 Question 1: How will you describe the position of a table lamp on your study table to another person?") Class IX - NCERT Maths Exercise (3.1) Question 1: How will you describe the position of a table lamp on your study table to another person? Solution 1: Let us consider the given below figure of a study
Class IX - NCERT Maths Exercise (3.1) Question 1: How will you describe the position of a table lamp on your study table to another person? Solution 1: Let us consider the given below figure of a study
Chpt 1. Functions and Graphs. 1.1 Graphs and Graphing Utilities 1 /19
 Chpt 1 Functions and Graphs 1.1 Graphs and Graphing Utilities 1 /19 Chpt 1 Homework 1.1 14, 18, 22, 24, 28, 42, 46, 52, 54, 56, 78, 79, 80, 82 2 /19 Objectives Functions and Graphs Plot points in the rectangular
Notes Lesson 3 4. Positive. Coordinate. lines in the plane can be written in standard form. Horizontal
 A, B, C are Notes Lesson 3 4 Standard Form of an Equation: Integers Ax + By = C Sometimes it is preferred that A is Positive All lines in the plane can be written in standard form. Oblique Coordinate Horizontal
Franklin Math Bowl 2008 Group Problem Solving Test Grade 6
 Group Problem Solving Test Grade 6 1. The fraction 32 17 can be rewritten by division in the form 1 p + q 1 + r Find the values of p, q, and r. 2. Robert has 48 inches of heavy gauge wire. He decided to
+ b. From this we can derive the following equations:
 A. GEOMETRY REVIEW Pythagorean Theorem (A. p. 58) Hypotenuse c Leg a 9º Leg b The Pythagorean Theorem is a statement about right triangles. A right triangle is one that contains a right angle, that is,
Polynomial and Rational Functions
 Chapter 3 Polynomial and Rational Functions Review sections as needed from Chapter 0, Basic Techniques, page 8. Refer to page 187 for an example of the work required on paper for all graded homework unless
6.1 The Rectangular Coordinate System
 6.1 The Rectangular Coordinate System In this chapter we want to take a look at the connection between algebra and geometry. This connection is made in the graphing of equations. We will start by looking
Algebra 1 Semester 2 Final Review
 Team Awesome 011 Name: Date: Period: Algebra 1 Semester Final Review 1. Given y mx b what does m represent? What does b represent?. What axis is generally used for x?. What axis is generally used for y?
Review Exercise. 1. Determine vector and parametric equations of the plane that contains the
 Review Exercise 1. Determine vector and parametric equations of the plane that contains the points A11, 2, 12, B12, 1, 12, and C13, 1, 42. 2. In question 1, there are a variety of different answers possible,
WHAT YOU SHOULD LEARN
 GRAPHS OF EQUATIONS WHAT YOU SHOULD LEARN Sketch graphs of equations. Find x- and y-intercepts of graphs of equations. Use symmetry to sketch graphs of equations. Find equations of and sketch graphs of
JUST THE MATHS SLIDES NUMBER 5.2. GEOMETRY 2 (The straight line) A.J.Hobson
 A.J.Hobson") JUST THE MATHS SLIDES NUMBER 5.2 GEOMETRY 2 (The straight line) by A.J.Hobson 5.2.1 Preamble 5.2.2 Standard equations of a straight line 5.2.3 Perpendicular straight lines 5.2.4 Change of origin UNIT 5.2
JUST THE MATHS SLIDES NUMBER 5.2 GEOMETRY 2 (The straight line) by A.J.Hobson 5.2.1 Preamble 5.2.2 Standard equations of a straight line 5.2.3 Perpendicular straight lines 5.2.4 Change of origin UNIT 5.2
UNIT 4 NOTES. 4-1 and 4-2 Coordinate Plane
 UNIT 4 NOTES 4-1 and 4-2 Coordinate Plane y Ordered pairs on a graph have several names. (X coordinate, Y coordinate) (Domain, Range) (Input,Output) Plot these points and label them: a. (3,-4) b. (-5,2)
You should be able to plot points on the coordinate axis. You should know that the the midpoint of the line segment joining (x, y 1 1
 Name GRAPHICAL REPRESENTATION OF DATA: You should be able to plot points on the coordinate axis. You should know that the the midpoint of the line segment joining (x, y 1 1 ) and (x, y ) is x1 x y1 y,.
Graphs of Equations. MATH 160, Precalculus. J. Robert Buchanan. Fall Department of Mathematics. J. Robert Buchanan Graphs of Equations
 Graphs of Equations MATH 160, Precalculus J. Robert Buchanan Department of Mathematics Fall 2011 Objectives In this lesson we will learn to: sketch the graphs of equations, find the x- and y-intercepts
3 CHAPTER. Coordinate Geometry
 3 CHAPTER We are Starting from a Point but want to Make it a Circle of Infinite Radius Cartesian Plane Ordered pair A pair of numbers a and b instead in a specific order with a at the first place and b
Rational Numbers: Graphing: The Coordinate Plane
 Rational Numbers: Graphing: The Coordinate Plane A special kind of plane used in mathematics is the coordinate plane, sometimes called the Cartesian plane after its inventor, René Descartes. It is one
Section 2 0: The Rectangular Coordinate System. The Coordinate System
 Section 2 : The Rectangular Coordinate System The rectangular coordinate system is based on two number lines. A horizontal line called the x axis and a vertical line called the y axis. Each axis has marks
Section 9.3: Functions and their Graphs
 Section 9.: Functions and their Graphs Graphs provide a wa of displaing, interpreting, and analzing data in a visual format. In man problems, we will consider two variables. Therefore, we will need to
UNIT 5 QUADRATIC FUNCTIONS Lesson 6: Analyzing Quadratic Functions Instruction
 Prerequisite Skills This lesson requires the use of the following skills: factoring quadratic expressions finding the vertex of a quadratic function Introduction We have studied the key features of the
Section 7.2 Characteristics of Quadratic Functions
 Section 7. Characteristics of Quadratic Functions A QUADRATIC FUNCTION is a function of the form " # $ N# 1 & ;# & 0 Characteristics Include:! Three distinct terms each with its own coefficient:! An x
Section 10.1 Polar Coordinates
 Section 10.1 Polar Coordinates Up until now, we have always graphed using the rectangular coordinate system (also called the Cartesian coordinate system). In this section we will learn about another system,
Complex Numbers, Polar Equations, and Parametric Equations. Copyright 2017, 2013, 2009 Pearson Education, Inc.
 8 Complex Numbers, Polar Equations, and Parametric Equations Copyright 2017, 2013, 2009 Pearson Education, Inc. 1 8.5 Polar Equations and Graphs Polar Coordinate System Graphs of Polar Equations Conversion
Section 1.5. Finding Linear Equations
 Section 1.5 Finding Linear Equations Using Slope and a Point to Find an Equation of a Line Example Find an equation of a line that has slope m = 3 and contains the point (2, 5). Solution Substitute m =
CHAPTER 2 REVIEW COORDINATE GEOMETRY MATH Warm-Up: See Solved Homework questions. 2.2 Cartesian coordinate system
 CHAPTER 2 REVIEW COORDINATE GEOMETRY MATH6 2.1 Warm-Up: See Solved Homework questions 2.2 Cartesian coordinate system Coordinate axes: Two perpendicular lines that intersect at the origin O on each line.
DRAWING QUADRATIC GRAPHS (EDEXCEL HIGHER) These questions are suitable for Higher Tier students. All questions should be done without a calculator.
 These questions are suitable for Higher Tier students. All questions should be done without a calculator.") GCSE MATHEMATICS KEY TOPIC PRACTICE SHEETS DRAWING QUADRATIC GRAPHS (EDEXCEL HIGHER) These questions are suitable for Higher Tier students. All questions should be done without a calculator. www.tutor2u.net/maths
GCSE MATHEMATICS KEY TOPIC PRACTICE SHEETS DRAWING QUADRATIC GRAPHS (EDEXCEL HIGHER) These questions are suitable for Higher Tier students. All questions should be done without a calculator. www.tutor2u.net/maths
Polynomial and Rational Functions. Copyright Cengage Learning. All rights reserved.
 2 Polynomial and Rational Functions Copyright Cengage Learning. All rights reserved. 2.7 Graphs of Rational Functions Copyright Cengage Learning. All rights reserved. What You Should Learn Analyze and
CAMI Education links: Maths NQF Level 2
 - 1 - CONTENT 1.1 Computational tools, estimation and approximations 1.2 Numbers MATHEMATICS - NQF Level 2 LEARNING OUTCOME Scientific calculator - addition - subtraction - multiplication - division -
UNIT 3 EXPRESSIONS AND EQUATIONS Lesson 3: Creating Quadratic Equations in Two or More Variables
 Guided Practice Example 1 Find the y-intercept and vertex of the function f(x) = 2x 2 + x + 3. Determine whether the vertex is a minimum or maximum point on the graph. 1. Determine the y-intercept. The
Math-2. Lesson 3-1. Equations of Lines
 Math-2 Lesson 3-1 Equations of Lines How can an equation make a line? y = x + 1 x -4-3 -2-1 0 1 2 3 Fill in the rest of the table rule x + 1 f(x) -4 + 1-3 -3 + 1-2 -2 + 1-1 -1 + 1 0 0 + 1 1 1 + 1 2 2 +
Functions. Copyright Cengage Learning. All rights reserved.
 Functions Copyright Cengage Learning. All rights reserved. 2.2 Graphs Of Functions Copyright Cengage Learning. All rights reserved. Objectives Graphing Functions by Plotting Points Graphing Functions with
UNIT NUMBER 5.2. GEOMETRY 2 (The straight line) A.J.Hobson
 A.J.Hobson") JUST THE MATHS UNIT NUMBER 5.2 GEOMETRY 2 (The straight line) b A.J.Hobson 5.2.1 Preamble 5.2.2 Standard equations of a straight line 5.2. Perpendicular straight lines 5.2.4 Change of origin 5.2.5 Exercises
JUST THE MATHS UNIT NUMBER 5.2 GEOMETRY 2 (The straight line) b A.J.Hobson 5.2.1 Preamble 5.2.2 Standard equations of a straight line 5.2. Perpendicular straight lines 5.2.4 Change of origin 5.2.5 Exercises
WK # Given: f(x) = ax2 + bx + c
 = ax2 + bx + c") Alg2H Chapter 5 Review 1. Given: f(x) = ax2 + bx + c Date or y = ax2 + bx + c Related Formulas: y-intercept: ( 0, ) Equation of Axis of Symmetry: x = Vertex: (x,y) = (, ) Discriminant = x-intercepts: When
Alg2H Chapter 5 Review 1. Given: f(x) = ax2 + bx + c Date or y = ax2 + bx + c Related Formulas: y-intercept: ( 0, ) Equation of Axis of Symmetry: x = Vertex: (x,y) = (, ) Discriminant = x-intercepts: When
Topic. Section 4.1 (3, 4)
") Topic.. California Standards: 6.0: Students graph a linear equation and compute the x- and y-intercepts (e.g., graph x + 6y = ). They are also able to sketch the region defined by linear inequality (e.g.,
Topic.. California Standards: 6.0: Students graph a linear equation and compute the x- and y-intercepts (e.g., graph x + 6y = ). They are also able to sketch the region defined by linear inequality (e.g.,
Exam 2 Review. 2. What the difference is between an equation and an expression?
 Exam 2 Review Chapter 1 Section1 Do You Know: 1. What does it mean to solve an equation? 2. What the difference is between an equation and an expression? 3. How to tell if an equation is linear? 4. How
Common Core Vocabulary and Representations
 Vocabulary Description Representation 2-Column Table A two-column table shows the relationship between two values. 5 Group Columns 5 group columns represent 5 more or 5 less. a ten represented as a 5-group
The Rectangular Coordinate Systems and Graphs
 OpenStax-CNX module: m51252 1 The Rectangular Coordinate Systems and Graphs OpenStax College This work is produced by OpenStax-CNX and licensed under the Creative Commons Attribution License 4.0 In this
Lesson 19: The Graph of a Linear Equation in Two Variables is a Line
 Lesson 19: The Graph of a Linear Equation in Two Variables is a Line Classwork Exercises Theorem: The graph of a linear equation y = mx + b is a non-vertical line with slope m and passing through (0, b),
Coordinate Geometry. Coordinate geometry is the study of the relationships between points on the Cartesian plane
 Coordinate Geometry Coordinate geometry is the study of the relationships between points on the Cartesian plane What we will explore in this tutorial (a) Explore gradient I. Identify the gradient of a
Section Graphs of the Sine and Cosine Functions
 Section 5. - Graphs of the Sine and Cosine Functions In this section, we will graph the basic sine function and the basic cosine function and then graph other sine and cosine functions using transformations.
This strand involves properties of the physical world that can be measured, the units used to measure them and the process of measurement.
 ICAS MATHEMATICS ASSESSMENT FRAMEWORK ICAS Mathematics assesses mathematical skills in a range of contexts. The content of the papers is divided into the strands of: and, and, and, and, and and. The content
Math 165 Guided Activity to study ahead some concepts from sections 1.1 and 1.2 Name Section Distance and Midpoint Formula
 Math 165 Guided Activity to study ahead some concepts from sections 1.1 and 1. Name Section 1.1 - Distance and Midpoint Formula Use the power point presentation for sections 1.1 and 1. to answer the following
College Algebra Exam File - Fall Test #1
 College Algebra Exam File - Fall 010 Test #1 1.) For each of the following graphs, indicate (/) whether it is the graph of a function and if so, whether it the graph of one-to one function. Circle your
Three-Dimensional (Surface) Plots
 Plots") Three-Dimensional (Surface) Plots Creating a Data Array 3-Dimensional plots (surface plots) are often useful for visualizing the behavior of functions and identifying important mathematical/physical features
Three-Dimensional (Surface) Plots Creating a Data Array 3-Dimensional plots (surface plots) are often useful for visualizing the behavior of functions and identifying important mathematical/physical features
Chapter 2. Polynomial and Rational Functions. 2.2 Quadratic Functions
 Chapter 2 Polynomial and Rational Functions 2.2 Quadratic Functions 1 /27 Chapter 2 Homework 2.2 p298 1, 5, 17, 31, 37, 41, 43, 45, 47, 49, 53, 55 2 /27 Chapter 2 Objectives Recognize characteristics of
slope rise run Definition of Slope
 The Slope of a Line Mathematicians have developed a useful measure of the steepness of a line, called the slope of the line. Slope compares the vertical change (the rise) to the horizontal change (the
LINEAR TOPICS Notes and Homework: DUE ON EXAM
 NAME CLASS PERIOD LINEAR TOPICS Notes and Homework: DUE ON EXAM VOCABULARY: Make sure ou know the definitions of the terms listed below. These will be covered on the exam. Axis Scatter plot b Slope Coordinate
FLC Ch 3. Ex 1 Plot the points Ex 2 Give the coordinates of each point shown. Sec 3.2: Solutions and Graphs of Linear Equations
 Math 100 Elementary Algebra Sec 3.1: The Rectangular Coordinate System x-axis and y-axis origin ordered pair x-coordinate y-coordinate quadrants (I, II, III, and IV) Rectangular/Cartesian Coordinate System
Section 7.6 Graphs of the Sine and Cosine Functions
 Section 7.6 Graphs of the Sine and Cosine Functions We are going to learn how to graph the sine and cosine functions on the xy-plane. Just like with any other function, it is easy to do by plotting points.
3.1. 3x 4y = 12 3(0) 4y = 12. 3x 4y = 12 3x 4(0) = y = x 0 = 12. 4y = 12 y = 3. 3x = 12 x = 4. The Rectangular Coordinate System
 4y = 12. 3x 4y = 12 3x 4(0) = y = x 0 = 12. 4y = 12 y = 3. 3x = 12 x = 4. The Rectangular Coordinate System") 3. The Rectangular Coordinate System Interpret a line graph. Objectives Interpret a line graph. Plot ordered pairs. 3 Find ordered pairs that satisfy a given equation. 4 Graph lines. 5 Find x- and y-intercepts.
3. The Rectangular Coordinate System Interpret a line graph. Objectives Interpret a line graph. Plot ordered pairs. 3 Find ordered pairs that satisfy a given equation. 4 Graph lines. 5 Find x- and y-intercepts.
5. NSBT.1 I can understand and explain the value of digits in a number.
 5. NSBT.1 I can understand and explain the value of digits in a number. 5. NSBT.1 I can relate the place value system to the base ten system and realize that a digit in one place represents 10 times what
5.6 Exercises. Section 5.6 Optimization Find the exact maximum value of the function f(x) = x 2 3x.
 = x 2 3x.") Section 5.6 Optimization 541 5.6 Exercises 1. Find the exact maximum value of the function fx) = x 2 3x. 2. Find the exact maximum value of the function fx) = x 2 5x 2. 3. Find the vertex of the graph
Section 5.6 Optimization 541 5.6 Exercises 1. Find the exact maximum value of the function fx) = x 2 3x. 2. Find the exact maximum value of the function fx) = x 2 5x 2. 3. Find the vertex of the graph
More Ways to Solve & Graph Quadratics The Square Root Property If x 2 = a and a R, then x = ± a
 More Ways to Solve & Graph Quadratics The Square Root Property If x 2 = a and a R, then x = ± a Example: Solve using the square root property. a) x 2 144 = 0 b) x 2 + 144 = 0 c) (x + 1) 2 = 12 Completing
Section 3.1 Objective 1: Plot Points in the Rectangular Coordinate System Video Length 12:35
 Section 3.1 Video Guide The Rectangular Coordinate System and Equations in Two Variables Objectives: 1. Plot Points in the Rectangular Coordinate System 2. Determine If an Ordered Pair Satisfies an Equation
3.1 The Coordinate Plane
 3.1 The Coordinate Plane Learning Objectives Identify coordinates of points. Plot points in a coordinate plane. Graph a function given a table. Graph a function given a rule. Introduction We now make our
In this section we continue our study of functions. We have already been introduced to
 DETAILED SOLUTIONS AND CONCEPTS - GRAPHS OF COMMON FUNCTIONS Prepared by Ingrid Stewart, Ph.D., College of Southern Nevada Please Send Questions and Comments to ingrid.stewart@csn.edu. Thank you! PLEASE
THE MATHEMATICS DIVISION OF LEHIGH CARBON COMMUNITY COLLEGE PRESENTS. WORKSHOP II Graphing Functions on the TI-83 and TI-84 Graphing Calculators
 THE MATHEMATICS DIVISION OF LEHIGH CARBON COMMUNITY COLLEGE PRESENTS WORKSHOP II Graphing Functions on the TI-83 and TI-84 Graphing Calculators Graphing Functions on the TI-83 or 84 Graphing Calculators
The points (2, 2, 1) and (0, 1, 2) are graphed below in 3-space:
 and (0, 1, 2) are graphed below in 3-space:") Three-Dimensional Coordinate Systems The plane is a two-dimensional coordinate system in the sense that any point in the plane can be uniquely described using two coordinates (usually x and y, but we have
Three-Dimensional Coordinate Systems The plane is a two-dimensional coordinate system in the sense that any point in the plane can be uniquely described using two coordinates (usually x and y, but we have
4.1 Ordered Pairs and Graphs. Copyright Cengage Learning. All rights reserved.
 4.1 Ordered Pairs and Graphs Copyright Cengage Learning. All rights reserved. 1 What You Will Learn Plot points on a rectangular coordinate system Determine whether ordered pairs are solutions of equations
Courtesy :
 STATISTICS The Nature of Statistics Introduction Statistics is the science of data Statistics is the science of conducting studies to collect, organize, summarize, analyze, and draw conclusions from data.
Today is the last day to register for CU Succeed account AND claim your account. Tuesday is the last day to register for my class
 Today is the last day to register for CU Succeed account AND claim your account. Tuesday is the last day to register for my class Back board says your name if you are on my roster. I need parent financial
ax + by = 0. x = c. y = d.
 Review of Lines: Section.: Linear Inequalities in Two Variables The equation of a line is given by: ax + by = c. for some given numbers a, b and c. For example x + y = 6 gives the equation of a line. A
Section 2.1 Graphs. The Coordinate Plane
 Section 2.1 Graphs The Coordinate Plane Just as points on a line can be identified with real numbers to form the coordinate line, points in a plane can be identified with ordered pairs of numbers to form
Lesson 20: Every Line is a Graph of a Linear Equation
 Student Outcomes Students know that any non vertical line is the graph of a linear equation in the form of, where is a constant. Students write the equation that represents the graph of a line. Lesson
Chapter 3: Rate Laws Excel Tutorial on Fitting logarithmic data
 Chapter 3: Rate Laws Excel Tutorial on Fitting logarithmic data The following table shows the raw data which you need to fit to an appropriate equation k (s -1 ) T (K) 0.00043 312.5 0.00103 318.47 0.0018
2.1. Rectangular Coordinates and Graphs. 2.1 Rectangular Coordinates and Graphs 2.2 Circles 2.3 Functions 2.4 Linear Functions. Graphs and Functions
 2 Graphs and Functions 2 Graphs and Functions 2.1 Rectangular Coordinates and Graphs 2.2 Circles 2.3 Functions 2.4 Linear Functions Sections 2.1 2.4 2008 Pearson Addison-Wesley. All rights reserved Copyright
A is any set of ordered pairs of real numbers. This is a set of ordered pairs of real numbers, so it is a.
 Fry Texas A&M University!! Math 150!! Chapter 3!! Fall 2014! 1 Chapter 3A Rectangular Coordinate System A is any set of ordered pairs of real numbers. A relation can be finite: {(-3, 1), (-3, -1), (0,
CURVE SKETCHING EXAM QUESTIONS
 CURVE SKETCHING EXAM QUESTIONS Question 1 (**) a) Express f ( x ) in the form ( ) 2 f x = x + 6x + 10, x R. f ( x) = ( x + a) 2 + b, where a and b are integers. b) Describe geometrically the transformations
EXAMPLE. 1. Enter y = x 2 + 8x + 9.
 VI. FINDING INTERCEPTS OF GRAPHS As we have seen, TRACE allows us to find a specific point on the graph. Thus TRACE can be used to solve a number of important problems in algebra. For example, it can be
Lesson 8: Graphs and Graphing Linear Equations
 A critical skill required for the study of algebra is the ability to construct and interpret graphs. In this lesson we will learn how the Cartesian plane is used for constructing graphs and plotting data.
But a vertex has two coordinates, an x and a y coordinate. So how would you find the corresponding y-value?
 We will work with the vertex, orientation, and x- and y-intercepts of these functions. Intermediate algebra Class notes More Graphs of Quadratic Functions (section 11.6) In the previous section, we investigated
Chapter 4: Solving Linear Equations Study Guide
 4.1: Plot Points in the Coordinate Plane Chapter 4: Solving Linear Equations Study Guide - Identify/graph ordered pairs Ex: Write the coordinates of - Identify the 4 quadrants point graphed and identify
Lesson 10 Practice Problems
 Name: Date: Lesson 10 Section 10.1: Roots, Radicals, and Rational Exponents 1. Complete the table below. Each expression should be written in radical notation, written with rational exponents and evaluated
Sixth Grade SOL Tracker Name:
 Sixth Grade SOL Tracker Name: % https://i.ytimg.com/vihttps://i.ytimg.com/vi/rinaa-jx0u8/maxresdefault.jpg/rinaajx0u8/maxresdefault.jpg g x A COLONIAL HEIGHTS PUBLIC SCHOOLS Mathematics Department I Can
February 13, notebook
 Module 12 Lesson 1: Graphing on the coordinate plane Lesson 2: Independent and dependent variables in tables and graphs Lesson 3: Writing equations from tables Lesson 4: Representing Algebraic relationships
HFCC Math Lab Intermediate Algebra 1 SLOPE INTERCEPT AND POINT-SLOPE FORMS OF THE LINE
 HFCC Math Lab Intermediate Algebra SLOPE INTERCEPT AND POINT-SLOPE FORMS OF THE LINE THE EQUATION OF A LINE Goal I. Use the slope-intercept form of the line to write the equation of a non-vertical line
Maintaining Mathematical Proficiency
 NBHCA SUMMER WORK FOR ALGEBRA 1 HONORS AND GEOMETRY HONORS Name 1 Add or subtract. 1. 1 3. 0 1 3. 5 4. 4 7 5. Find two pairs of integers whose sum is 6. 6. In a city, the record monthly high temperature
MATHEMATICS 105 Plane Trigonometry
 Chapter I THE TRIGONOMETRIC FUNCTIONS MATHEMATICS 105 Plane Trigonometry INTRODUCTION The word trigonometry literally means triangle measurement. It is concerned with the measurement of the parts, sides,
More About Factoring Trinomials
 Section 6.3 More About Factoring Trinomials 239 83. x 2 17x 70 x 7 x 10 Width of rectangle: Length of rectangle: x 7 x 10 Width of shaded region: 7 Length of shaded region: x 10 x 10 Area of shaded region:
CHAPTER. Graphs of Linear Equations. 3.1 Introduction to Graphing 3.2 Graphing Linear Equations 3.3 More with Graphing 3.4 Slope and Applications
 Graphs of Linear Equations CHAPTER 3 3.1 Introduction to Graphing 3.2 Graphing Linear Equations 3.3 More with Graphing 3.4 Slope and Applications Slide 2 3.1 Introduction to Graphing OBJECTIVES a Plot
YEAR 7 SCHEME OF WORK - EXTENSION
 YEAR 7 SCHEME OF WORK - EXTENSION Autumn Term 1 Number Skills Spring Term 1 Angles and Shape Summer Term 1 Multiplicative Reasoning Analysing and displaying data Decimals Perimeter, Area and Volume Half
1.4. Comparing Graphs of Linear Motion. Acceleration Time Graphs
 Comparing Graphs of Linear Motion Cheetahs are adapted for speed they are the fastest land animals. They can accelerate at faster rates than most sports cars (Figure 1). Cheetahs have been measured accelerating