Student Research & Creative Works
|
|
|
- Solomon Rogers
- 6 years ago
- Views:
Transcription

. Masters Theses. 4574. http://scholarsmine.mst.")
1 Scholars' Mine Masters Theses Student Research & Creative Works Summer 2007 Executable system architecting using systems modeling language in conjunction with Colored Petri Nets - a demonstration using the GEOSS network centric system Renzhong Wang Follow this and additional works at: Part of the Systems Engineering Commons Department: Recommended Citation Wang, Renzhong, "Executable system architecting using systems modeling language in conjunction with Colored Petri Nets - a demonstration using the GEOSS network centric system" (2007). Masters Theses This Thesis - Open Access is brought to you for free and open access by Scholars' Mine. It has been accepted for inclusion in Masters Theses by an authorized administrator of Scholars' Mine. This work is protected by U. S. Copyright Law. Unauthorized use including reproduction for redistribution requires the permission of the copyright holder. For more information, please contact scholarsmine@mst.edu.
2
3 EXECUTABLE SYSTEM ARCHITECTING USING SYSTEMS MODELING LANGUAGE IN CONJUNCTION WITH COLORED PETRI NETS A DEMONSTRATION USING THE GEOSS NETWORK CENTRIC SYSTEM by RENZHONG WANG A THESIS Presented to the Faculty of the Graduate School of the UNIVERSITY OF MISSOURI-ROLLA In Partial Fulfillment of the Requirements for the Degree MASTER OF SCIENCE IN SYSTEMS ENGINEERING 2007 Approved by Cihan H. Dagli, Advisor David Enke Scott E. Grasman
4 2007 Renzhong Wang All Rights Reserved
5 iii ABSTRACT Models and simulation furnish abstractions to manage complexities allowing engineers to visualize the proposed system and to analyze and validate system behavior before constructing it. Unified Modeling Language (UML) and its systems engineering extension, Systems Modeling Language (SysML), provide a rich set of diagrams for systems specification. However, the lack of executable semantics of such notations limits the capability of analyzing and verifying defined specifications. This research has developed an executable system architecting framework based on SysML-CPN transformation, which introduces dynamic model analysis into SysML modeling by mapping SysML notations to Colored Petri Net (CPN), a graphical language for system design, specification, simulation, and verification. A graphic user interface was also integrated into the CPN model to enhance the model-based simulation. A set of methodologies has been developed to achieve this framework. The aim is to investigate system wide properties of the proposed system, which in turn provides a basis for system reconfiguration. This framework can be applied to general system development. For demonstration purpose, the Global Earth Observation System of Systems (GEOSS) was selected as an example and was modeled as a distributed information system that involves multi-task concurrent processing driven by discrete events. The simulation results helped to refine the architecture design, and finally verified and validated the behavior and functionality of the system being modeled. The Model Driven Architecture (MDA) approach from software engineering has also been investigated and applied in the systems engineering context to create a SysML-based modeling process, which keeps all the SysML diagrams related to each other and provides a cue for what diagrams to build and how to build them.
6 iv ACKNOWLEDGMENTS I would like to thank one and all who made this study possible. First, I would like to express my deepest sense of gratitude to my advisor, Dr. Cihan H. Dagli, for his continuous guidance, encouragement, support, and patience in this research and my entire studies at the University of Missouri-Rolla. I would also like to extended appreciations to my advisory committee members, Dr. David Enke, and Dr. Scott Grasman, for their time and contributions. I am deeply indebted to my parents, Enming Wang and Xiuyun Hong, who were continuously backing me in whatever I wanted to pursue. I am grateful to my sister Yang Wang who has always been supporting me. I would also like to thank all my relatives, friends, and past colleagues, who have encouraged me, helped me, supported me and cared about me. Without your help and encouragement, I couldn t have been here to study. It has been a great pleasure to work with my colleagues in the Smart Engineering Systems Lab who have always encouraged me and helped me. Finally, I would like to thank the Engineering Management and Systems Engineering Department for providing me funds during my study at UMR.
7 v TABLE OF CONTENTS Page ABSTRACT...iii ACKNOWLEDGMENTS... iv LIST OF ILLUSTRATIONS...viii LIST OF TABLES... x SECTION 1. INTRODUCTION MOTIVATION PROBLEM DEFINITION RESEARCH OBJECTIVE SECTION ORGANIZATION LITERATURE REVIEW GEOSS DEPARTMENT OF DEFENSE ARCHITECTURE FRAMEWORK SYSTEMS MODELING LANGUAGE (SysML) COLORED PETRI-NETS ARTISAN STUDIO BRITNEY SUITE MODELING METHODOLOGY AN EXECUTABLE SYSTEM ARCHITECTING PARADIGM OBJECT ORIENTED ANALYSIS MODEL DRIVEN ARCHITECTING APPROACH The Core MDA Technique is Model Transformation The Model-Based Specification is More Precise and Rich in Semantics than the Object Oriented Paradigm MDA Designs Portability, Interoperability and Reusability into the System at the Model Level MDA Approach is Ideal for Building and Maintaining the GEOSS Architecture A MDA Process for Developing System Model... 21
8 vi Preamble to the process An overview of the modeling process SYNTHESIS OF THE EXECUTABLE MODEL Select a Proper Simulation Tool Conversion Rules Based on Static Views Case Based Syntheses Consistence Issues in SysML Models The Procedure for Synthesizing CPN Models from SysML Models and the Mapping Rules Instantiation and Concurrent Processing Results of the Object Oriented Approach and the Model Driven Approach SIMULATION Interactive Control Message Sequence Charts (MSCs) State Space Graphs ARCHITECTURE EVALUATION AND ANALYSIS Behavior and Functionality Verification Specification Completeness Checking MODEL DEVELOPMENT MISSION DEFINITION REQUIREMENTS CAPTURE OPERATIONAL CONCEPT ANALYSIS USE CASE DEFINITION USE CASE SCENARIOS Five Day Ocean Forecast Use Case Scenario Five-Day Ocean Forecast Pre-Operational Use Case Scenario Characterize Improvements Use Case Scenario Emergency Management Use Case Scenario COMPUTATION INDEPENDENT MODEL (CIM) DEVELOPMENT PRELIMINARY STRUCTURE DIAGRAMS DEVELOPMENT SEQUENCE DIAGRAMS DEVELOPMENT ACTIVITY DIAGRAMS DEVELOPMENT... 73
9 vii REFINE STRUCTURE DIAGRAMS EXECUTABLE MODEL DEVELOPMENT MODEL OVERVIEW THE ANIMATION GRAPHICAL USER INTERFACE (GUI) The Interactive Interface Message Sequence Charts (MSCs) SOME EXECUTION SPECIFIC CONCERNS SIMULATION SET UP SIMULATION SIMULATION RESULTS ARCHITECTURE EVALUATION AND ANALYSIS SIMULATION BASED ANALYSIS Behavior and Functionality Verification/Validation Specification Completeness Checking STATE SPACE ANALYSIS SYSTEM REFINEMENTS CONCLUSIONS AND FUTURE WORK CONCLUSIONS FUTURE WORK APPENDICES A. SYSML SPECIFICATIONS FOR GEOSS B. CPN MODEL FOR GEOSS C. MSC CHARTS GENERATED BASED ON A SIMULATION D. GEOSS 10-YEAR IMPLEMENTATION PLAN: REFERENCE DOCUMENT 196 BIBLIOGRAPHY VITA
10 viii LIST OF ILLUSTRATIONS Figure Page 3.1. Executable System Architecting Paradigm Three-Dimensional Decomposition of a System MDA Modeling Process Concordance between Activity, Sequence, and Block Diagrams Procedure for Synthesizing a CPN Model from a SysML Model Interleaving Process vs. Concurrent Process Reusable Module in a CPN GEOSS Functional Requirements Requirements Diagram GEOSS Functional Requirements Decomposition Requirements Diagram GEOSS Nonfunctional Requirements GEOSS Nonfunctional Requirements GEOSS High-Level Operational Concept Graphic (OV-1) GEOSS Top Level Use Case Diagram GEOSS High Level Operational Use Case Diagram GEOSS Middle Level Use Case Diagram Decomposition of the Data and Resource Management Use Case Five Day Ocean Forecast Use Case Scenario Five-Day Ocean Forecast Pre-Operational Use Case Scenario Characterize Improvements Use Case Scenario Emergency Management Use Case Scenario Block Definition Diagram GEOSS Domain Breakdown Internal Block Diagram GEOSS High Level Operation Block Definition Diagram Interface Definition GEOSS High Level Activity Diagram Showing Generic Behavior GEOSS High Level Activity Diagram Showing Concurrent Behavior Block Definition Diagram GEOSS Structure Breakdown Internal Block Diagram GEOSS Internal Connection Block Definition Diagram for Interface Definition Block Definition Diagram for the Flow Specification... 76
11 ix 5.1. Page Hierarchy of the CPN Model The Code Segment on Transition Distrubite RegForecast -ResAccess from Page FiveDOceanForecast The Code Segment on Transition Identify Required and Desired Improvements AnlsTool from Page Improvement The Transition Update to New Mdl Models fom Page FiveDOceanForecast Declarations under the Animation Setup Declaration Group Evaluating Auxiliary Texts on a CPN Page A Screenshot on Declarations of the MSC Object A Screenshot after Applying User-Defined Monitor Tool to Related Transitions Specifications for Initialization Function Specifications for Prediction Function Specifications for Observation Function Specifications for Action Function Specifications for Stop Function A Screenshot on the Place Contents Monitor Index A Screenshot on a CPN Construct for Generating Tokens State Space Report-Part State Space Report-Part State Space Report-Part State Space Report-Part
12 x LIST OF TABLES Table Page 3.1. Mapping Rules for Converting UML Models to CPN Models Possible Mapping Rules for Converting SysML Models to CPN Models Mapping between Elements in a SysML Model and a CPN Model... 35
13 1. INTRODUCTION Document driven approaches to system development have been a predominant approach to design in the past. As systems become increasingly complex, this type of approach is falling short because the document itself is always up for interpretation and is subject to misunderstanding [1]. This problem can be solved with formal specifications by models since formal models have well defined semantics that are more difficult to misinterpret than a textual specification. Model-based systems engineering leverages the use of models across many of activities in system development which allows an enormous potential for increasing design productivity, system quality, and lifetime by shifting the bulk of design efforts to early phases [2, 3]. Models can be used both to analyze the problem domain and to describe and specify the architecture for the solution domain. However, the only way for one to be sure about the correctness of the models is to test those models. The specification of formal models, execute those models and analyze the simulation results creates a new paradigm of systems engineering executable system architecting. A forma1 model of the architecture design is needed for specifying and proving the system properties. An executable model is capable of generating dynamic behavior and can be used to check the overall integrity and internal consistency of the architecture model, evaluate the specifications of the system, refine the system design, forecast its performance, verify its functionality, experiment different system configurations, and select the right design alternatives. Despite nearly universal acceptance by the software industry as the standard object oriented design notation, the Unified Modeling Language (UML) is weak in defining precise dynamic semantics [4, 5, 6]. The Systems Modeling Language (SysML) extends UML to allow modeling of a wide range of systems but still lacks execution semantics. Consequently, the UML/SysML-based designs are not formally verifiable. This research proposes a design methodology that supplements SysML modeling with dynamic model analysis capability using Colored Petri Net (CPN). CPN can provide a formal dynamic semantic framework for the SysML notations plus the behavioral modeling and analysis strength needed by system designers. Accordingly, a conversion procedure was developed to facilitate the transformation from SysML specifications to CPN models. This procedure
14 2 is based on the condition/event interpretation of the place/transition of CPN. The purpose of developing an executable architecture for the proposed system in this thesis is to facilitate the investigation of the system wide properties and refine the system design based on the analysis. Therefore, the interactive behavior of the system components is of greater interest than the reactive behavior of the individual components. In order to concentrate on the interactive behavior, the transformation process from SysML model to CPN model in this thesis is primarily based on SysML sequence diagrams. The executable model has been extremely useful in assisting the system development. In this thesis, the proposed system was incrementally developed based on four use case scenarios. The simulation of these scenarios demonstrate that the architecture of the proposed system can be modified to better achieve its intended results based on the executable system architecting framework developed in this thesis. The executable model also helped to reveal missing specifications and requirements. Modeling can follow different paradigms depending on the system to be modeled. However, a system design that is resilient to change is highly desired. The development of Object-Oriented modeling approach has proven to be more flexible, maintainable than the functional decomposition paradigm and a greater potential for reuse. The Model Driven Architecture (MDA) approach is a more advanced way of writing specifications, which is still under development. The MDA initiative and the standards that support it allow the same model specifying business system or application functionality and behavior to be realized on multiple platforms [7]. This leads to greater advantages in improving portability, cross-platform interoperability, platform independence, domain specificity, reusability, productivity, and maintainability. MDA was initially developed as a software design approach, but its principles can also be applied to other areas such as business process modeling. This thesis explores MDA s applications in the system engineering context. This research continues the work conducted by Madwaraj Rao (former M.S. student in Systems Engineering at the University of Missouri-Rolla) for his thesis [8-10]. In his work, both the Department of Defense Architecture Framework (DoDAF) and Systems Modeling Language (SysML) were used to model the Global Earth Observation System of Systems (GEOSS) by following a structured approach and an object-oriented
15 3 approach, respectively. The SysML model was then converted to an executable model represented by CPN. This CPN model was used to simulate one scenario of GEOSS. The behavior of the system being modeled was analyzed and verified based on the simulation. In this research, several use case scenarios have been considered and executed in parallel. This allows the analysis of concurrent behavior. The target system to be modeled is still GEOSS. However, the system was decomposed into lower levels of abstraction where physical architecture was introduced. This allows the distributed prosperities of the system to be modeled and analyzed. The Model Driven Architecture (MDA) approach from software engineering has been investigated. A SysML based modeling process, in systems engineering context, was developed using the advanced principles of MDA. The feasibility of this process is demonstrated by modeling the GEOSS. The advantages of using this modeling process to model the proposed system were analyzed. A new method was developed for converting a SysML model to a CPN model in order to facilitate the modeling of concurrent behavior. For the simulation, a Graphical user interface (GUI) was integrated into the original CPN to give graphical feedback supporting interactive control of the simulation. The Message Sequence Charts (MSCs) were used as a main tool for architecture analysis and functionality verification/ validation MOTIVATION The specification and development of Network centric systems is a complex task. One reason is such systems often involve highly distributed and heterogeneous architecture and are equally distributed in their development, procurement, management, and maintenance. Furthermore, complexities exist not only in the individual systems but also in the integration of these systems. As an example, in modern computation environment, a distributed system often consists of a number of hardware or software components which are located at networked computers. These components usually proceed concurrently but also have to communicate and interact with each others to achieve complex work. The distributed nature of the system components leads to a heavy emphasis on web services, which allow previously incompatible applications to interoperate regardless of language, platform, operating systems, or physical locations. The overall management and life cycle maintenance of such systems are great challenges, especially when the systems are
16 4 continually evolving. For example, many of the new domain applications have to be achieved by integrating systems with other legacy systems to form a complex system of systems. For such systems, in many cases, it is impossible to build a real system and test its performance before implementation. Models and simulations can address these challenges by allowing engineers to visualize the proposed system and to evaluate the performance before constructing it. Models assist in managing complexities, facilitate communications, and help detect errors and omissions in designs. Simulation-based designs allow experiments to explore multiple solutions and enable early and on-going verification and validation to reduce risk and address problems in a cost effective way offering significant savings in time and resources. Unified Modeling Language (UML) has become the de facto standard modeling language in the design process of object-oriented system but is software centric. The systems engineering community has been looking for a modeling language that is compatible with UML but allows modeling a wide range of systems. This has resulted in the evolution of Systems Modeling Language (SysML). It is of great interest to see how SysML can support the modeling of network centric systems and how a SysML model can achieve a high fidelity representation of the real system. So far, relatively few approaches can be found in the literature investigating UML/SysML for hardware design and hardware/software co-design. This research will contribute to the practice of applying SysML in system design. The system engineering community benefits from the achievement of software engineering. The software industry has developed a large number of methodologies and approaches in system architecting. Many of the advance principles of these methodologies can be, or have been, applied in the system engineering context. The aforementioned modeling paradigms are examples of them. Efforts are currently underway within the Object Management Group (OMG) and associated organizations to enhance the UML (including the SysML) and MDA for use in systems engineering. Therefore, there is much research to be done in these areas.
17 PROBLEM DEFINITION This research will take the Global Earth Observation System of Systems (GEOSS) as an example and explore the modeling and simulation of network centric system of systems. From a net centric system view, GEOSS is envisioned as a network of regional, national, and global systems that rapidly and systematically acquires and disseminates data and data products on Earth observations to serve a broad range of critical and expanding societal needs. From a physical view, GEOSS is a system of sensors, communication devices, storage, computers and other devices used in concert to observe the Earth. In this research, the GEOSS is viewed as an information processing system. This thesis focuses on some specific features of network centric systems, i.e. the system will be modeled as a distributed multi-task concurrent processing system with high interoperability, maintainability, and expandability. The challenge is to model the management, discovery, access, and process of the observation datasets and information products in a distributed and heterogeneous computational environment that links distributed centers, users, models, data, applications, computer networks and storage resources together RESEARCH OBJECTIVE The main purpose of this research is to develop an executable system architecting paradigm to facilitate the investigation of system wide prosperities of the proposed system, which, in turn, can provide a basis for system reconfiguration. A set of methodologies for achieving this framework also needs to be developed. Following are specific goals. 1. Investigate how to supplement SysML-based specifications with executable semantics. Develop a methodology to convert SysML models to executable models and demonstrate its feasibility. Develop the mapping between elements of the SysML model and the executable model. 2. Investigate approaches to model-based simulation. Investigate methods for analyzing system behavior and performance based on simulation results. Explore how the simulation results can help to refine the architecture design.
18 6 3. Develop a SysML-based modeling process that facilitates the development of architecting specifications in a systematic way. Demonstrate its feasibility; and justify its advantages in modeling the network centric systems SECTION ORGANIZATION The rest of this thesis is organized as follows. Section 2 provides the literature review, which includes a discussion of related work undertaken in the areas of executable system architecting, and an introduction of some background information and tools used in this thesis. Section 3 discusses the modeling methodology used in this research. It includes a SysML-based model driven architecting process, a procedure for converting SysML models to CPN models, approaches for carrying out simulation based on CPN models, and methodologies for architecture evaluation and analysis. Section 4 presents the model development process with GEOSS as an example. Section 5 demonstrates how an executable model can be derived from the SysML model by following the procedure developed in Section 3. Section 6 demonstrates how to execute the CPN model developed in Section 5. Section 7 discusses how to carry out architecture evaluation and analysis based on the simulation results. Finally, Section 8 sums up the conclusions and discusses directions for further research. A complete set of SysML diagrams developed for the proposed system is attached in Appendix A. A complete set of pages from the CPN model is attached in Appendix B. The output Message Sequence Charts (MSCs) for selected CPN pages are packaged in Appendix C. The GEOSS 10-Year Implementation Plan Reference Document is attached in Appendix D.
19 7 2. LITERATURE REVIEW Executable modeling allows models to be tested as prototypes, and is emerging as a powerful supporting methodology. Intensive research has been conducted in this area in recent years, especially in the software engineering context. Since the Unified Modeling Language (UML) [11, 12] is almost universally accepted by the software industry as the modeling language, many efforts have been undertaken to make UML executable. In [13, 14, 15], three popular approaches are discussed. The are Executable UML(xUML) [16], Executable and Translatable UML ( X TUML) [17, 18], and Virtual Machines (VM) [19, 20]. The executable model is one pillar supporting the Model-Driven Architecture (MDA) initiative announced by the Object Management Croup (OMG) in Many of aforementioned approaches allow the execution of Platform Independent Model (PIM). However, these approaches are intensely software centric being aimed at automatic code generation, e.g. the xuml approach relies on a platform-specific code generation mechanism to achieve executable model. Furthermore, they are based on UML StateChart variants [4, 5, 21-23], which means they take an asynchronous view of the system and concentrate on the reactive behavior of the individual objects. This further limits their application to software engineering. For modeling general systems, the UML state machines lack well-defined execution semantics, do not support modeling of multiple instances of classes [11], and do not scale well to large systems [24, 25]. An alternative approach to making UML executable is to incorporate the Colored Petri Nets (CPN) [26-29] as a supplement to the well-established UML diagrams. UML is well suited to model the static aspects of a system; however CPN is good at modeling and subsequently validating the behavioral characteristics of concurrent object architectures. The reasons CPN is a good candidate for this purpose are discussed in depth in Section of this thesis. The use of UML in conjunction with CPN can benefit from the strength of both modeling languages. This topic has been studied intensely in recent years. Much of the work done is concerned with transformation (manually or automatically) from UML notation to Petri nets, often aimed at formal verification and validation, e.g. [30-33]. Also, Petri nets have been used to ascribe formal execution semantics to UML notations via a rule-based approach, e.g. [34]. While much of the combined use of UML and CPN is often
20 8 discussed in general terms, a small number of examples have concentrated on pinpointing a number of specific, important design issues that can be addressed properly in CPN, but not at all or not as easily in UML, e.g., some specific design issues that are addressed better with CPN than with UML are pointed out in [6]. The design of user interfaces is described in [24]. High-level Petri nets in conjunction with mobile computing have been investigated in [35]. Some research has also addressed the development of concepts and theories that combine the ideas of object-orientation in general (not just UML) and Petri nets [36]. Some research even proposes a CPN profile for UML [37]. However, much of the work is still based on the transformation of UML state machines. This limits its usage in general systems since StateChart variants only model the reactive behavior of a single object [30]. Only a few examples can be found in the literature that use the combination of UML and CPN for general system modeling with an emphasis on interactive behavior between systems components, e.g., [38], where a UML-based process for developing Command, Control, Communications, Computer, Intelligence, Surveillance, and Reconnaissance (C4ISR) architectures based on an Object-Oriented paradigm is presented and a CPN model for verifying and validating the architecture model being built is suggested. In [39], a software tool, Bonapart, has been used to build the executable model. This software tool is based on the concept of Petri Net but specialized in process simulation and analysis (simulation of amounts, costs, times and capacities). A procedure for converting UML diagrams to CPN models using an object-oriented approach is presented in [40]. This procedure imposes a rationale for style constraints on the use of UML artifacts. The methodologies for evaluating the logic, behavior, and performance of the architecture based on the simulation are also discussed in [40]. Using CPN only to specify and simulate a system is also possible. Four of such examples are given in [41]. However, this is not very common since CPN is not good at giving purely static descriptions of system architecture. The execution of CPN models allows detailed behavior and performance analysis of the architecture providing a basis for refining the system configuration. Some approaches for modifying system architecture based on simulation also appeared in literature. The modification can be categorized into reconfiguration and refinements. In [42], a set of approaches for refining a CPN model are summarized. These are type
21 9 refinement (change color set definition of a place), node refinement (decompose a components) and adding a subnet to an existing net. The architecture can then be modified accordingly. An application of these approaches can be found in [43] where the reconfiguration (of the architecture) approaches have also been used. The purpose of the simulation in [43] is to test the dynamic configuration capability of a reconfigurable system and the effectiveness of the new configuration. In [44], Petri Net has been used to evaluate and modify the architecture of a dynamically evolving system. In [45], Petri Net has been used to reconfigure the architecture of Flexible Manufacturing Systems (FMS) to respond to changes in requirements. The simulation of CPN also can be used for checking the completeness of specifications and/or requirements, experimenting different system configurations, and select the right design alternatives. Examples can be seen in [41]. As mentioned before, the System Modeling Language (SysML) was developed to overcome deficiencies of UML in modeling systems that include hardware, software, data, personnel, procedures, and facilities. Some limitations of UML for modeling non-software systems and the required extensions to UML have been discussed in [46, 47]. However, still relative few works can be found that derives executable models from SysML model. In [8, 9], the architecture for GEOSS was developed using both Department of Defense (DoD) Architecture Framework (DoDAF) and SysML. The SysML Model was then converted to an executable model represented by CPN that allows behavior and functionality analysis. The mapping between elements of SysML diagrams and CPN models is in similar line with the mapping between elements of UML models and CPN models presented in [40]. The block definition diagrams of SysML have been used to start the conversion process in this case. The modeling and validation of the architecture for complex systems with emerging behavior, e.g. network centric systems, is a tough job due to the complexity of the problem domain. The DoDAF Architecture Framework is designed for addressing such challenges, and therefore is an ideal guideline for developing a network centric system. Many network centric systems have been modeled using the DoDAF Architecture Framework, e.g. [8, 9, 48]. The executable model approach discussed above gives one solution to the analysis, verification and validation of such system. However, in some cases, the behavior of such systems may be too complex to observe and analyze by regular
22 10 methods. Therefore, computation intelligence technologies have also been applied for facilitating the modeling of such systems. Examples can be seen in [49-52]. A brief insight into the literature on related tools used in this thesis and some other background information is presented below GEOSS Global Earth Observation System of Systems (GEOSS) was collaboratively developed by interested countries and organizations. The aim is to achieve comprehensive and sustained Earth observations. Comprehensive information about GEOSS can be found in [53]. Most of the information required for this research has been derived from this document, e.g. end user requirements and performance indicators. This document highlights the origin and purpose of the GEOSS implementation plan and the vision and scope of GEOSS. It also presents the societal benefits areas of GEOSS, the capacity building, outreach, governance, and the related technical approaches, including observations and modeling, products/data management, architecture and interoperability, data sharing arrangement, and research facilitation DEPARTMENT OF DEFENSE ARCHITECTURE FRAMEWORK The Department of Defense (DoD) Architecture Framework (DoDAF) defines a common approach for architecture description development, presentation, and integration for both war-fighting operations and business operations and processes. Within the DoDAF, architectures are described in terms of three views: Operational View (OV), Systems View (SV), and Technical Standards View (TV). The OV is a description of the tasks and activities, operational elements, and information exchanges required to accomplish desired missions. The Systems View (SV) is a set of graphical and textual products that describe systems and interconnections providing for, or supporting, system functions. The SV associates systems resources to the OV. These systems resources support the operational activities and facilitate the exchange of information among operational nodes. The TV is the minimal set of rules governing the arrangement, interaction, and interdependence of system parts or elements. Its purpose is to ensure that a system satisfies a specified set of operational requirements. A detail understanding of the
23 11 DoDAF can be obtained from [54-56]. DoDAF evolved from Command, Control, Communications, Computers, Intelligence, Surveillance, and Reconnaissance (C4ISR) Architecture Framework version 2.0. Now, DoDAF has been updated to DoDAF version 1.5. DoDAF provides the guidance, rules, and product descriptions for developing and presenting architecture descriptions, e.g. on how to view the system, what to present in describing each view, and how to present them. In this research, DoDAF has been used in analyzing the problem domain SYSTEMS MODELING LANGUAGE (SysML) Model Driven Architecture (MDA) development process has been employed in this thesis. Unified Modeling Language (UML) is the key enabling technology of MDA. UML is a general-purpose modeling language to graphically illustrate system concepts. It was originally developed for software engineering by Object Management Goup (OGM) but has been universally accepted as modeling standard. SysML, which is an extension of UML, was developed to address the limitations of UML for modeling non-software systems. SysML reuses a subset of UML 2.1 and provides additional extensions needed to address the requirements for modeling general systems. The extension abilities include modeling parametric equations, physical architecture, system interfaces and requirements. Modeling using UML or SysML provides the capability to develop a consistent, verifiable, and validated model that allows the systems engineer to discover missing requirements, evaluate alternatives, and verify the performance requirements. The most update version of SysML is SysML 1.0. A detailed specification of SysML 1.0 can be found at [57] COLORED PETRI-NETS Colored Petri Net (CPN) is a graphical discrete-event modeling language. The CPN modeling language combines Petri nets and programming languages. Petri nets [58, 59] provide the foundation of the graphical notation and the semantical foundation for modeling concurrency, synchronization, and communication in systems. The functional programming language, Standard ML [60, 61], provides the primitives for compactly
24 12 modeling the sequential aspects of systems (such as data manipulation) and for creating compact and parameteriable models [41]. CPN is state and action oriented at the same time providing an explicit description of both the states and the actions. CPN models are executable and describe the states of a system and the events (transitions) between the states. CPN includes a module concept that makes it possible to organize large models into a hierarchically related set of modules. The CPN modeling language is supported by CPN Tools. CPN Tools is a tool for editing, simulating and analyzing CPN. The tool features incremental syntax checking and code generation which take place while a net is being constructed. An introduction to the practical use of CPN is provided in [62]. It introduces the basic ideas behind the CPN language and illustrates how CPN models can be analyzed by means of simulation, state spaces and condensed state spaces. Detailed specification and application skills of CPN can be found in [18, 26-28, 63-65]. The use of CPN with the example of a simple communication protocol is demonstrated in [62]. It gives out basic concept of CPN, such as places, transitions, tokens, markings, color set, code segment, guide condition, and declaration. An insight into the simulation, state space analysis, and performance analysis is also provided with the example in [62]. In [40], an approach to simulating and validating a UML models using CPN has been demonstrated ARTISAN STUDIO ARTiSAN Studio, developed by ARTiSAN Software Tools Inc., is a multi-user suite of development tools that provides systems and software modeling and component-based development specifically for technical systems. ARTiSAN Studio is built on a true, shared, object repository. Development teams can create and share access to diagrams, models, and documentation. The entire team is kept in synch throughout the project and updated of any changes that affect them. ARTiSAN Studio is an integrated suite for UML modeling. It embraces the UML 2.0 and OMG SysML standards. ARTiSAN Studio provides a number of good features to facilitate model development [66]. For example:
25 13 ARTiSAN Studio automatically establishes a single data dictionary that maintains a consistent view across the model. Model items are defined once in the model and can be referenced on any diagram as either a symbol or rich text reference. Consequently, any change to the model element is automatically propagated across all diagrams and textual descriptions, ensuring architectural consistency and completeness. The flexible package view allows the user to structure models in a variety of ways and quickly switch between the project, dictionary, relationship and diagram browser views. ARTiSAN Studio supports domain and organization specific extensions to the UML through the mechanism of profiles, a collection of stereotypes and tags. It pre-defined a wide range of standard UML profiles and also supports the user defined profiles. For example, by adding the DoDAF profile, the studio can be used for DoDAF modeling. ARTiSAN Studio enables the user to analyze and model system requirements in a number of UML diagrams. ARTiSAN Studio has also established mature interfaces to Telelogic DOORS and other Requirement Management (RM) tools. Any model elements can be traced to any textual requirements managed in the user s tool of choice, unleashing the full power of impact and trace analysis. ARTiSAN Studio supports code generation. Different parts of the model can be implemented in different programming languages, including C, C++, Java, Ada 83/95 and Spark Ada 83/95. On-demand Code Synchronization (OCS) supports forward generation, reverse engineering and round tripping. ARTiSAN Studio supports state machine generation, which allows the user to build and simulate executable models as a demonstration tool, and/or to validate and verify system behavior. Simulations can also be hooked to Graphical User Interface (GUI) prototyping tools, such as Altia Design. ARTiSAN Studio provides a powerful Document Generator. High-quality documents can be easily configured to meet the user s project standards. ARTiSAN Studio also offers an online tutorial in the form of Real-time Perspective Mentor [67], which provides a comprehensive set of object-oriented development
26 14 techniques and detailed guidance on how to make the best use of the modeling capability supported by ARTiSAN Studio. All the SysML diagrams in this thesis have been developed using ARTiSAN studio. It gave tremendous convenience in the model development and modification process BRITNEY SUITE BRITNeY is the abbreviation of Basic Real-time Interactive Tool for Net-based animation [68]. It was developed by Michael Westergaard. BRITNeY Suite consists of a Java application and a CPN ML library which (among other things) enables visualization and advanced interaction through CPN Tools. BRITNeY Suite currently focuses on four things: animation based on the simulation of a CPN, optionally using CPN Tools, state-space analysis of CPN models, editing, simulation, and state-space analysis of bi-graphical reactive systems, and loading of CPN models in the most recent proposal for a standard interchange format for High-level Petri nets. The simulation based animation can be run directly from BRITNeY Suite. BRITNeY Suite allows deploying animations without modifying the CPN model. BRITNeY Suite supports state-space analysis of CPN models loaded via CPN Tools. This includes drawing the state-space graphs (occurrence graphs). BRITNeY Suite supports input of a bi-graphical reactive system (BRS) using a simple text format. BRITNeY Suite also supports entry of BRS by means of an asynchronous pi-calculus process, by an ambient-calculus expression, and by converting a CPN. BRITNeY Suite also supports drawing of Message Sequence Charts (MSC) (including space chart and transition chart) in an automatic way or in an advanced user defined way.
27 15 3. MODELING METHODOLOGY 3.1. AN EXECUTABLE SYSTEM ARCHITECTING PARADIGM Models have three types of basic functions: specification (of a system to be built), presentation (of a system to be explained to other people, or ourselves), and execution. However, no single modeling tool currently available can do all of them best. This suggests a combination usage of these tools can take immediate advantages of the best of these tools. Unified Modeling Language (UML) and Systems Modeling Language (SysML) are well suited for specification since they have strict syntax and rich semantics. They are also excellent for communicating design details to other people because they are widely accepted. However, due to lack of executable semantics, UML/SysML-based designs cannot be formally verified [69]. In this thesis SysML is employed to define the formal specifications of the proposed system. The DoDAF architecture framework does well in presentation since the architecture represented in this way is very easy to understand. However, DoDAF only provides a guideline or a template for architecture description but is inadequate in the semantic foundations for describing architectures, which makes it insufficient in specification. This problem has been realized and measures have been taken to remedy it [70]. In this thesis, DoDAF architecture framework is used as a supplement tool in analyzing problem domain. Because SysML and UML cannot perform formal model verification, human reviews have to be involved to check the correctness of the design and assess how well the designed architecture meets the system requirements upstream. Unfortunately, the quality of the review is subject to the human reviewer s ability to detect inherent flaws. As designs become increasingly complex, knowing how their myriad parts all fit together becomes increasingly difficult, if not impossible. By going one step further that is, converting the SysML-based design to an executable and verifiable model the design and review process can be greatly strengthened. As a result, the quality of the final system can be greatly improved. This research suggests the use of Colored Petri Net (CPN) as the modeling language for specifying the executable model. CPN models are executable and verifiable.
28 16 CPNs provide rich capability for carrying out system analysis, either by means of simulation or by means of more formal analysis methods. A number of analysis techniques supported by CPN can be found in [26-28, 62, 69, 71]. The reason to choose CPN is analyzed in depth in Section of this thesis. On the other hand, CPNs are not suited for giving purely static descriptions of system architecture. The transformation from SysML specification to CPN model must follow well-defined mapping rules to secure faithful transformation. Only in this way, can the simulation of the executable model be used to verify and validate the system modeled by SysML. There are several ways to do the conversion depending on the system behavior of interest, e.g. reactive behavior or interactive behavior. Some existing rules for UML to CPN transformation have already been discussed in Section 2 of this thesis. The conversion procedure used in this thesis is presented in detail in Section of this thesis. CPNs can communicate with external applications and processes based on Standard ML(SML language). This allows CPNs to be integrated with other tools that can enhance the simulation, e.g. providing graphic user interface, instant feedback, interactive control of the simulation process, and etc. Based on the above concerns, an executable system architecting process can be developed (see Figure 3.1). This is an iterative process. The basic steps are as follows: 1. The overall process starts from requirements analysis and specification where the mission is defined, the operational concept is analyzed, system requirements are captured, and use cases are delineated. 2. The formal model of the system is represented by SysML. This modeling activity transforms the natural language specification into a formal, standardized model (a set of SysML diagrams). The principles of Modern Driven Architecture (MDA) approach have been applied to guide the modeling process in this thesis. 3. This SysML model is then converted to an executable model represented by Colored Petri Net (CPN). The CPN model must faithfully render the structure and behavior of the architecture model. The accuracy depends strongly on the conversion process. Well-defined rules need to be established and govern this transformation. 4. The executable model is then exercised. The behavior of the modeled system can be observed. The simulation can be enhanced by integrating external tools to the original
29 17 Start Requirement Analysis and Specification Requirements Analysis Modeling Formal Model SysML Representation Based on MDA paradigm Capture desired behaviors Model Transformation Refinement Executable model Architecture Evaluation and Analysis CPN End Behavior analysis Functionality verification Architecture refinement & reconfiguration Simulation Interactive GUI Behaviors as modeled Figure 3.1. Executable System Architecting Paradigm CPN model. Note that the executable model should be exercised for each use case and their combinations in order to fully simulate the real-word applications. 5. The final step is architecture evaluation and analysis. The tasks in this step include behavior and performance analysis, functionality verification (against the requirements), and system configuration refinement. CPN tools provide a set of analysis tools for detailed net analysis. The verification and validation is carried out through the comparison of sequence diagrams of the SysML model and Message Sequence Charts (MSCs) generated by CPN model. If there is a match, then the model can be verified. If the match is insufficient, then either the SysML model needs to be redesigned in order to better represent the system architecture, or the system architecture needs to be reconfigured to better satisfy the requirements. The system configuration can then be refined according to the simulation and analysis results. Therefore, the above process becomes an iterative process. It is recommended to test the system behavior at each level of abstraction before entering into a lower lever of abstraction.
30 OBJECT ORIENTED ANALYSIS The concept of Object-Oriented Analysis (OOA) has been used to identify, analysis, and define system components in this thesis. Object-Oriented Analysis (OOA) aims to model the problem domain in terms of objects and the services they provide. From the OOA perspective, a system is composed of a set of related, interacting objects. The behavior of the system is generated through the collaboration of these objects. The state of the system is the combined state of all the objects in it. An object is an entity that has state, attributes, and operations. OOA involves identifying and defining objects in terms of these three prosperities. The interaction between objects may be messages (including operation calls) or other item flows. OOA emphasize importance of well-defined interfaces between objects. The Unified Modeling Language (UML) has become the standard modeling language used in object-oriented analysis and design. UML uses the concept of Class to describe objects. Classes provide a way of grouping objects with similarity MODEL DRIVEN ARCHITECTING APPROACH The Model Driven Architecture (MDA) approach is a new way of writing specifications adopted by the Object Management Group (OMG) in It promotes the use of models as the primary artifacts in software development. MDA makes use of Platform Independent Models (PIMs), which define system functionality and behavior completely free of technical and implementation concerns, and Platform Specific Models (PSMs), which represent design and implementation. PIMs are transformed into one or more PSMs according to Platform Models (PM) that describe how a system uses a particular type of platform. The PSMs produced in this way may then undergo further transformations to more specific PSMs and eventually to source codes. The MDA approach enables the same model specifying business processes or application functionalities to be realized on multiple platforms. The three primary goals of MDA are portability, interoperability and reusability [7]. The MDA approach is still under development, some basic concepts can be found in [72, 73].The OMG documents the overall process in a document called the MDA Guide [7].
31 19 In order to develop a modeling process using the MDA paradigm, it is necessary to discuss the core techniques that are applicable to this process and the advantages of using MDA approach The Core MDA Technique is Model Transformation. Model transformation is the process of converting one model to another model of the same system. The input to the transformation is the marked PIM and the mapping. The result is the PSM and the record of transformation. [7]. Model transformation allows the developer to clearly define the refinements from PIMs to PSMs and the relationships between those models. Since MDA is still relatively new and evolving, many model transformation approaches have been developed as discussed in [7, 72, 74]. Some paradigms and approaches developed in software engineering can also be applied for this process. The Component-Based Software Engineering (CBSE) is discussed in [75-77]. As defined in [77], a software component is a unit of composition with contractually specified interfaces and explicit context dependencies only. A software component can be deployed independently and is subject to composition by third party. Components are considered to be a higher level of abstraction than objects (a concept in the Object-Oriented Programming (OOP) context). Components are selected at build-time and configured at run-time. A component only exhibits its provided or required interfaces. Therefore, components allow more reusability and portability through inheritance and adapting existing components. Another hot on-going research is the application of Aspect-Oriented Programming (AOP) or Aspect Oriented Software Development (AOSD) in MDA. Some work in this respect can be seen in [78-80]. AOP or AOSD addresses the separation of concerns, especially the cross-cutting concerns by modeling them as reusable modules called aspects. Cross-cutting concerns cut across many modules in a program thus reducing the modularity of OOP and increasing the complexity. AOP method involves developing a primary model and a set of aspect models (which encapsulate crosscutting concerns into reusable modules) separately, and then weaving them together to create the application at well defined locations, called join points. The principles of CBSE and AOP have been applied to guide the model development in this thesis.
32 The Model-Based Specification is More Precise and Rich in Semantics than the Object Oriented Paradigm. Model-based specification defines behavior precisely, formalizing in the model all terms that must be defined for those behaviors. In Object-Oriented programming, object is the only concept for specification whereas MDA employs multitude concepts, such as collaborations (interaction between objects), design patterns, middleware, components, and aspects [81]. In addition, because many aspects of a system might be of interest, the MDA approach allows the use of various modeling concepts and notations to highlight one or more particular perspectives, or views, of that system MDA Designs Portability, Interoperability and Reusability into the System at the Model Level. MDA creates a conceptual framework that separates fundamental logic behind a specification from the specifics of the particular middleware that implements it. This allows greater flexibility when architecting and evolving these systems [82]. Portability will be enhanced because PIMs remain unchanged in the face of changing technology. As new platform technologies emerge, only the related PSMs need to be modeled according to the new Platform Models. Existing PIMs can then be transformed into these new PSMs. This allows rapid development and delivery of new system. Other architectures are generally tied to a particular technology. This will result in repeated efforts in modeling of the system s functionality and behavior each time a new technology comes along. Since PIMs are technology neutral, with the standards that support MDA, they can be realized on multiple platforms. This allows the possibility of large scale reuse of proven, tested business models captured in the PIMs. MDA enables different applications to be integrated by explicitly relating their models. This facilitates integration and interoperability. More complete descriptions of MDA can be found in [7, 83]. The OMG is promoting this framework and is working on standards that help realize it. It can be concluded that the MDA has significant advantages to allow portability, cross-platform interoperability, platform independence, domain specificity, and increased productivity.
33 MDA Approach is Ideal for Building and Maintaining the GEOSS Architecture. Although the MDA approach stemmed from the software engineering, many of the core principles are applicable in the systems engineering context. As discussed in Section 1.2, GEOSS in this modeling task can be conceived as a distributed computing system and thus many of the modeling approaches of software engineering can be easily applied. An in-depth analysis of the requirements of the GEOSS reveals that some highly desirable attributes of such system are interoperability and extensibility. From the above analysis, it can be concluded that the MDA approach is ideal for modeling network centric system like GEOSS. Detailed requirements analysis can be seen in Section 4.2 of this thesis A MDA Process for Developing System Model. In this section, a SysMLbased process for developing architecting representation is presented. The process demonstrates the feasibility of developing architecture descriptions based on MDA paradigm Preamble to the process. MDA specifies three default types of models for a system corresponding to three layers of abstraction. They are Computation Independent Model (CIM), Platform Independent Model (PIM), and Platform Specific Model (PSM). A set of models can be constructed within each layer. During the architecting process a CIM is transformed to a PIM architecture model, then to a PIM detailed design model, and likewise to have several abstractions within the PSM level. However, for MDA, a platform is meaningful only in relation to a particular point of view in other words, one person s PIM is another person s PSM. Therefore, the concept of abstract platform has often been used in this context [84-86]. An abstract platform is determined by considering the platform characteristics that are relevant for applications at a certain level of platform-independence as well as the various design goals [85]. An MDA-based design process should be able to accommodate designs at different levels of platform independence. For simplicity, PSM and PIM here are conceived as relative to each other in this thesis. A three-dimensional view of a system helps to understand and develop a MDA model [81]. They are: vertical different levels of abstraction of the same subject; horizontal different subject areas or views that are not more or less abstract than each
34 22 others; and variants a family of related components that share the same interface and can be configured for different applications. Figure 3.2 reflects these concepts. Different subject areas Variants Different levels of abstractions Marketing R & D Manufacturing Sales Service Figure 3.2. Three-Dimensional Decomposition of a System (Adapted from Model-Driven Architecture and Integration Opportunities and Challenges Version 1.1 [81]) A complex system may consist of many interrelated models organized along well defined layers of abstraction, with mappings defined from one set of models into another. The basic driving force for the model transformation is domain information, i.e. by continually adding domain information, a set of models can be developed from the initial CIM. The two best practices are applied to facilitate this transformation process. They are CBSE and AOP as discussed in Section of this thesis. CBSE allows components to be configurable and thus is used as part of the solution to the variance caused by multiple use cases. AOP helps to separate and modularize cross-cutting components.
35 An overview of the modeling process. The modeling process is shown in Figure 3.2 This diagram depicts an overview of the SysML-based modeling process with MDA principles applied. For each of the modeling phases, this diagram shows the essential tasks, associated inputs, and output products. The basics of the iteration loop are as follows: Stage 1. Requirements Analysis -The essential tasks in the requirements analysis phase are mission definition, operational concept analysis, requirements capture and use case scenarios definition. The input for the mission definition is where one receives the architecting task. Then, the textual requirements can be specified by extracting the application requirements and a preliminary SysML requirement diagram can be depicted based on the analysis of missions. From this point, an operational concept can be created that describes how the mission will be carried out. The DoDAF products, such as the High Level Operational Concept Graphic (OV-1), and the Operational Activity Model (OV-5), Requirement Diagrams Use Cases Diagrams Requirements Analysis Mission Definition Requirements Capture Operational Concept Use Case Definition Architecture Analysis & Design Domain Information DoDAF Products PIM PSM Model Transformation (Refinement) Block Definition Diagrams Internal Block Diagrams Sequence Diagrams Activity Diagrams Refined Internal Block Diagrams State Machine Diagrams Platform Specialty CIM PIM PSM PIM PSM PIM Architectural PSM Design Use Case Integration Abstraction Black Box Use Case Scenarios White Box Use Case Scenarios Scenario based Test Cases on-going verification and validation Figure 3.3. MDA Modeling Process
36 24 are good choices for this purpose. The operational concept can then be used to refine the requirements and create more detail requirements diagrams. With this information in hand, functions can be grouped to create the use cases. A use case describes a specific operational aspect of the system in the form a service provided by the system for an actor. Stage 2. Architecting Analysis and Design. The main objective in this step is to transform the identified functional requirements into a coherent description of system architecture in a systematic way. The detail steps are as follows: 1. Construct Computation Independent Model (CIM). Given one or more use cases and the operational concept created in the former steps, a generic CIM can be created to model the business process, which is both domain independent and platform independent. This business process of CIM can be developed by identifying the top level horizontal partition of the system. Different use cases may correspond to different business models. These can be viewed as a set of variants of one generic business model. At this point, no details about the target domain and platform are being taken into consideration. It is recommended to use the concept of CBSE [77] to define each part of the CIM as components (referred as component hereafter) in order to allow configuration and make generic model possible. This CIM often corresponds to the high level Operational View of the DoDAF architecture representation. The SysML Block Definition Diagram and Internal Block diagram can be used to represent the CIM. With these components identified, the domain operations of each component that are needed for carrying out the tasks specified in the use case can be identified. These operations can form a set of high level activity diagrams that show the flow of operations, decisions points and operation calls. These high level activity diagrams specify the dynamic behavior of the CIM and provide a basis for separating concerns in later refinements. 2. Construct Structure Diagrams. The initial PIM is created by transforming from the CIM with appropriate domain information added in (and thus the PIM is domain dependent but platform independent). This PIM contains components for carrying out the system-level functionalities and the domain operations carried by these components. This set of generic components can be extracted by identifying general abstractions and similarities of a set of applications. Note that a component is a high level abstraction of an
37 25 object. One component may have multiple instances to be chosen for a particular application. The technique of black box analysis can be used to facilitate the abstraction. By applying this concept, the system-level functionalities can be verified and validated through the execution of the corresponding black-box use case model (The executable model however should be developed separately). 3. Refine the first PIM by adding domain information and mapping domain operations to the target platform (or more precisely, the abstract platform). The system is then decomposed to a lower level of abstraction (or the PSM in relation to its PIM). The domain information is generally the implementation concerns. For example, each domain operation is implemented by certain resources of a given target platform(s). This suggests the decomposition can be done by identifying the required resources needed to implement the application. Alternatively, the implementation of the domain operation may need some common services provided by the target platforms. This refinement process involves white box analysis, i.e. the components needed to support or collectively realize the domain operations are identified and allocated. The system thus built can be verified and validated through the execution of the corresponding white box use case model. This PIM to PSM refinement process is further carried out until the desired abstraction level is achieved. The models developed in this step can be represented by SysML Block Definition Diagram and Internal Block diagram. 4. Refine the structure design. If there are components representing certain cross-cutting concerns, separate them from the above models. These cross-cutting components can be weaved back at proper joints when the system is instantiated. The separation of cross-cutting components helps to increase both reusability and maintainability of the system model. 5. Transform these block diagrams into sequence diagrams. For each of the domain operations specified in the CIM stage, there may be a sequence diagram that elaborates on the detail interactions between system components identified in the block definition diagrams. The messages sent to or received by the interacting objects can be events (input or output signals between system parts and outside actors), item flows (message/data exchanges) or operation calls (calling an operation on the receiver). Note that a sequence diagram is in the application domain so it has to be defined for each use case scenario.
38 26 6. Transform sequence diagrams into activity diagrams. By observing the input and output message flow of an object in the sequence diagrams, the operations (actions) that the object needs to conduct in order to generate the output can be identified. The information for determining action sequence and item/object flows between operations (actions) can be derived from the sequence diagrams developed in the preceding step. 7. Refine system structure design. The structure diagrams developed in previous steps have not specified the connections between its components and the corresponding interfaces and item flows. This information is identified in developing the sequence and activity diagrams. With this information in hand, a refined structure diagram can be created and represented by Internal Block diagrams. The Internal Block Diagrams define the internal structure of a block in terms of its prosperities (part), connectors, and ports. The operational calls identified in sequence diagrams can be used to specify standard ports and the corresponding interfaces. The object flows identified in activity diagrams, together with the message exchanges in sequence diagrams, can be used to specify the flow ports, flow properties, flow specifications and item flows. The operations that are identified by observing the required input and desired output of each interacting objects in sequence diagrams (and are later defined in activity diagrams) can be grouped to define each object (block) using block definition diagrams. The attributes of each block derive from the object flows as mentioned above. So far, the structure design of the system can be completed. 8. Transform sequence diagrams to state Machine diagrams. A State Machine diagram describes the reactive behavior of an object. The State Machine diagrams need to be developed for all object classes that have behavior. The State Machine diagrams can be used to generate simulation for each object. 9. Use case integration. The final step is the use case consistency analysis, in which the verified and validated use case models are integrated into a common framework that can be executed as concurrent processes.
39 SYNTHESIS OF THE EXECUTABLE MODEL As discussed in Section 2, a number of approaches have been proposed to make UML executable. However, all this work is based on UML StateChart variants and concentrates on the reactive behavior of a single object, i.e. it views each object as potentially having a state machine that can execute asynchronously and concurrently [16]. This kind of approach is targeted at software engineering. In the system engineering context, it is often more important to model the interactive behavior between the components of a system. Hence, it is better to define the executable model that relies on synchronous operation calls between objects to produce a complete synchronous model of the subject matter Select a Proper Simulation Tool. The ARTiSAN studio used to develop the SysML model in this thesis provides a simulation capability based on state diagrams. However, this simulation capability is not enough to fully exercise the behavior of the system being modeled in this thesis for the following reasons: 1. A state diagram is created for each single object. The simulations associated with such state diagrams are also divided into single object views. There is no way to connect these individual views together. 2. The State diagram does not support hierarchy structure. This makes the simulation of complex systems rather difficult. Based on the prosperities of the system to be modeled in this thesis and the objectives of this research, the following criteria were identified for choosing the simulation tool: 1. General purpose (because this research is aimed at modeling general system). 2. Both state and action oriented (because the behavior of the system to be modeled should be described in these two terms). 3. Discreet event driven (because the emphasis of the modeling task is the interactions between the components of the system). 4. Concurrent behavior (because the system to be modeled should support concurrent behavior). 5. Synchronization (because parallel processes need to coordinate with each other). 6. Object-oriented and easy to map to UML/SysML notations.
40 28 7. Capability for supporting analysis. 8. Verifiable. Based on these criteria, the Colored Petri Net (CPN) seems to be the best choice among those having been investigated because it satisfies all those criteria. Some of the reasons and advantages of using CPN are highlighted as follows (In [62], a number of advantages for using CPN has been provided. Only those that are closely related to the purpose of this thesis are mentioned here): 1. CPN is very general instead of domain specific, i.e., it is not aimed directly at modeling a specific class of systems, but aimed towards a large variety of different systems. The applications of CPNs range from informal systems (such as the description of work processes) to formal systems (such as communication protocols). They also range from software systems to hardware systems [62]. CPN is very basic and works like a low level programming language because it has few, but powerful, modeling primitives that make it possible to model systems and concepts at different levels of abstraction. However, this is both a weakness and a strength [41]. Other simulation tools are either tied to a particular application, e.g. network simulation, or a particular aspect, e.g. process simulation. 2. CPNs are well suited for modeling concurrency, synchronization, and resource sharing behavior of a system. 3. CPNs have flexibility of token definition and manipulation. It is possible to use tokens to model various architectural elements. Each token in a CPN has a value typed by a pre-defined data type. Different token types can be used to represent different architectural elements, e.g. components, tasks, messages, events, and even use cases can all be described by different types of tokens. The value of tokens can be investigated and modified by the transitions corresponding to different system behavior [87]. 4. CPNs offer hierarchical descriptions through the concept of sub-page, which can be used as a module definition mechanism for various purposes. This makes it possible for CPNs to model large systems in a manageable and modular way. 5. CPNs have an explicit description of both states and actions. Actions can be represented by CPN transitions. How the actual action occurs is not the interest of modeling; only how the conditions for the action to take place and what the effects of that action are. The state carries the concepts of conditions and effects; the transition carries the concept of state change.
41 29 6. CPNs have a graphical representation, which is intuitively very appealing and easy to understand [62]. 7. CPNs have well-defined semantics which unambiguously define the behavior of each CPN. The presence of the semantics makes it possible to implement simulators for CPNs and also forms the foundations for the formal analysis methods [62]. 8. CPNs have a semantics which builds upon true concurrency, instead of interleaving. In an interleaving semantics, it is impossible to have two actions in the same step, and thus concurrency only means that the actions can occur after each other, in any order. A true concurrency semantics is easier to work with because it is closer to the way human beings think about concurrent actions [62]. The concurrent concept is also illustrated in Figure CPNs integrate the description of control and synchronization with the description of data manipulation. This means that on a single sheet of paper it can be seen what the environment, enabling conditions and effects of an action are. Many other graphical description languages work with graphs which only describe the environment of an action while the detailed behavior is specified separately (often by means of unstructured prose) [62]. 10. CPNs offer interactive simulations where the results are presented directly on the CPN diagram. The simulation makes it possible to debug a large model while it is being constructed. The data values of the moving tokens can be inspected [62]. The major weaknesses of CPNs are: 1. They are too low-level to serve as a suitable means for communication and visualization. 2. They lack commercially acceptable tools for developing Petri net models. An approach has been provided to address this drawback in [32], where an interface is developed that is extensible to any drawing package capable of using Web services and extensible Markup Language/Simple Object Access Protocol (XML/SOAP). 3. Although the state space concept provides a powerful analysis tool, as the system size and complexity increase, the state space of the CPN grows exponentially, which could become too difficult to manage both graphically and analytically, if it is not impossible.
42 Conversion Rules Based on Static Views. The executable model must faithfully render the structure and behavior of the architecture model. The accuracy depends strongly on the conversion process. Therefore, an automatically generated executable model based solely on the information of the architecture model is highly desired. However, such automation currently does not exist in commercial tools so the conversion in this thesis is a manual process. By following the steps in the preceding section, the architecture models should have sufficient details to enable the generation of a CPN model. Several approaches can be used to generate the CPN model. For example, executable models can be derived from various behavioral diagrams (Activity Diagrams, Sequence Diagram, State Machine Diagrams, etc.) or structural diagrams (Block Definition Diagram, Internal Block Diagram etc.). A method of deriving the CPN model primarily from UML class diagrams (some related diagrams need to be modified according to some style constraints for this purpose) is described in [40]. The basic ideas are summarized in Table 3.1. Table 3.1. Mapping Rules for Converting UML Models to CPN Models System Elements UML Artifacts CPN Elements Fixed component Class Substitution transition Transient information Class attribute Token Message Type Association class Place Operation Class Operation Transition A similar idea can be applied to the model represented by SysML. The Internal Block Diagrams and Block Definition Diagrams can be used as the main source for this conversion. The basic mapping rules are summarized in Table 3.2. However, in this thesis the conversion is based on behavior diagrams. The reason will be discussed in the next section.
43 31 Table 3.2. Possible Mapping Rules for Converting SysML Models to CPN Models System Elements SysML Artifacts CPN Elements Fixed component Parts within internal Substitution block diagram transition Transient information/event Item flow Token Message Type Flow propriety Place Operation Block Operation Transition Case Based Syntheses. Note that the above mentioned approach is actually trying to derive dynamic behavior (an executable should surely represent dynamic behavior) from a static view of the system (class diagram is a static view). This approach works well for models that only have one use case scenario. For a CPN model that supports multiple use case scenarios, there are additional concerns to be addressed. For example, the workflow may be different from case to case. The corresponding information/object flow between objects may also be case sensitive. That is the system may have different configurations (in terms of connections and the information/object that flows between) for different use case scenarios in order to perform different tasks. Hence, a generic class diagram is insufficient to render the case specific information which is necessary for an executable model. One way to solve this problem is to follow the approach defined in [40] (or the modified approach for SysML models as described in the above section) and further develop an algorithm to cope with the multi-scenario problems. This method is expected to be able to generate a generic executable model that simulates multi use case scenarios using one structure. This seems tempting but is not the always the best solution (reasons will be discussed later) from an execution perspective. Another problem with this class-diagram based transformation is that a class is a group of objects sharing the same properties and operations, and however, what is actually interacting with each other is the instance of a class. By following the class-diagram based transformation, it is very easy to get confused with classes and their instances, which will result in an interleave process instead of the desired parallel process (see Figure 3.6).
44 32 Alternatively, one can use behavioral diagrams as the basis of conversion and construct a representation for each use case scenario to reflect different configurations of the system. Sequence diagrams carry the key information necessary for the conversion (object, information/object flow, and operations (by linking to activity diagrams)); and a set of SysML sequence diagrams is always constructed for each use case scenario. This make the set of sequence diagrams a good candidate for the conversion purpose. In this thesis, a procedure was developed to convert the CPN model primarily from SysML sequence diagrams. Information from several concordant diagrams was also needed. This method turned out to have additional benefit since a set of sequence diagrams specified for a use case scenario keeps only the connections between objects in that context eliminating unnecessary information (connections, code segments and etc) and thus makes workflow clearer. A CPN model constructed in this way is more readable and maintainable, and easily extends as well. There are also other advantages that will be discussed later Consistence Issues in SysML Models. In order to derive a CPN model from a SysML model, there should be an unambiguous mapping between elements of SysML and elements of CPN. For this reason, two types of style consistence have been recommended in this research. Style Consistence in Sequence diagrams. The entities on sequence diagrams represent instances of objects (represented by block), not the objects themselves. The information on the message lines between lifelines can represents message (object) exchanges and/or operation calls. The conversion process requires a consistent representation. Therefore, the following style should be followed: 1. When message (object) exchanges and/or operation calls are involved in the interaction of two objects, the message (object) exchanges should be labeled on the message lines, the operation calls should be labeled in the description line corresponding to the receiver s lifeline. 2. When only an operation call is involved in the interaction between two objects, it is viewed as a special message sent to the receiver in order to activate a service provided by the receiver. Concordance between SysML artifacts. The SysML model should maintain an integrated dictionary, a single repository of definitions and descriptions of all elements of
45 33 every diagram in the model. The concordance concepts between SysML elements in different diagrams are reflected in Figure 3.4 (also can be seen in Table 3.3). The items connected by dashed lines should use consistent names. Note: A I_B1B2 Data interface is also shown in the internal block diagram but has not yet been related to any element in the sequence diagram shown on the graph. This indicates it has not been used in this case but may be used in other sequence diagrams. Note that a block diagram always shows generic information whereas a sequence diagram always shows context information. Activity Diagram Internal Block Diagram Object 1 Object 2 Object 3 Block 2 Action A1 Item A1O1 Action A2 Item O2O3Cmd Item O2O3Data Action A3 Block 1 Operation: A1 Operation: A4 Operation: A2 StdPortB2B3 Flowport_B2B3 I_B2B3 Date I_B2B3 Cmd I_B2B3 Cmd I_B2B3 Date Action A4 Item O3A4 StdPortB2B3 Block 3 Flowport_B2B3 Sequence Diagram Object 1 Object 2 Object 3 Operation: A3 Block Definition Diagram bdd[block]system[stdportb2b3 Interface Definitions] Action A1 Opr Call <<Interface>> I_B2B3 Cmd perform Action A3 <<Interface>> I_B2B3 Data getsignal:type Do Act A2 Action A2 Msg bdd FlowSpecifications Do Act A3 Do Act A4 Action A4 Msg Action A3 <<flowspecficaitons>> Flowport_B2B3 <<flowproperities>> Item O2O3 Data Figure 3.4. Concordance between Activity, Sequence, and Block Diagrams
46 The Procedure for Synthesizing CPN Models from SysML Models and the Mapping Rules. In order to derive a CPN model from a SysML model, an unambiguous mapping between the elements of the various SysML diagrams and the elements of the CPN must be established. This includes structural elements such as places, transitions, input and output arcs, and logical elements such as color sets, variables, and the associations of color sets with places, arc inscriptions, guard functions, and code segments. Figure 3.5 outlines the procedure for synthesizing a CPN from a SysML model used in this thesis. One basic idea is to interpret places and transitions in a CPN model as conditions and events, respectively. An event can occur if all conditions for the event hold. Step 0: Augment the sequence diagram(s). For each object in the sequence diagram(s), add operation names to the appropriate position on the lifeline in between the input and output message/event. The operations have been defined in a block definition diagram Step 1: Create a transition for each operation in the sequence diagram(s) (preferably also label the object name next to the operation name). Step 2: Create a substitution transition for each nested sequence diagram. Step 3: Create a place for each message/event between lifelines. Assign the appropriate color set and create the corresponding declaration in the index. Step 4: Create arcs between the transitions and the places according to the sequence diagrams. There should be a one-to-one matching between the numbers of message/event in the sequence diagrams and the number of places between transitions in the CPN model. Step 5: Add Arc inscriptions, guard functions, or code segments derived from the rules associated with each operation. Step 6: Create a sub-page for each substitution transition Follows step 0 to 5 to create all the related transitions, places and arcs Assign the Input, Output, and I/O ports places. Step 7: Assign socket places and connect all substitution transitions and their sub-pages. Step 8: Specify initial markings related each places. Figure 3.5. Procedure for Synthesizing a CPN Model from a SysML Model
47 35 Based on the above procedures, the basic mappings between elements in SysML diagrams and elements in a CPN model are summarized in the Table 3.3. Table 3.3. Mapping between Elements in a SysML Model and a CPN Model System Elements in SysML Diagrams Elements in Entities Sequence Diagram Activity Diagram Block Diagram CPN Model Fixed Substitution Interacting Object Part component transition Transient information/ event Message Type Operation Call Information on the Message line between Object flow Item flow Token lifelines Place and its Flow color set specification. declaration Information on the Interface Message line and/or Object flow specification description line Place Operations Action Block definition Transition Dashed line Message line between Ports and Port Flow connecting Object Arc lifelines connection flow and action Nested sequence Child activity Substitution Module diagram diagram transition Instantiation and Concurrent Processing. The concurrent system involves multiple processing units working concurrently. This requires multiple instances of the same object to be created (for each use case scenario) for each of the concurrent processing
48 36 task. If, for example, only one instance of an object is created, the processing requests from other use case scenarios have to line in a queue and be processed one after each other, in any order. Therefore, the different use case scenarios are not proceeding in parallel. Figure 3.6 depicts this idea. Of course, resource constraints and sharing may prevent tasks from Interleaving Process 1`Input from process1 +1`Input from process3 2 Operation A Input Class A Multiple Instances of a class should be created for concurrent processing unit The graph shows that process 1 and 2 have been processed. Process 3 is about to be processed 1`Output for process2 1 Output Three processes are interleaved at the point for Operation A from Class A. Only one task is processed at a point of time. Inputs have to be processed one by one, not in parallel. The graph shows that processed 2 has been processed but processe1 and process 3 is still waiting Input Input Concurrent Process Operation A Instance 1 of Class A 1`Output for process1 1 Output Input Operation A Instance 2 of Class A 1`Output for process2 1 Output 1`Input from process3 1 Operation A Input Instance 3 of Class A Output Figure 3.6. Interleaving Process vs. Concurrent Process
49 37 being processed in parallel. This concern will be discussed in a concrete case in later sections. By following the procedure specified in the preceding section, a CPN transition is created for each operation in each use case scenario, which enables parallel processing Results of the Object Oriented Approach and the Model Driven Approach. As mentioned in Section of this thesis, the conversion method used in [40] is based on UML Class diagram. The resulting CPN model is in line with the Object-Oriented approach. For each interacting object, a substitution transition is created and in the corresponding sub-page, a transition is created for each of the operations belonging to that object, together with those places representing attributes of that object. Therefore, each sub-page defines a class (class name corresponds to the sub-page name and the substitution transition name; attributes correspond to places; and operations correspond to transitions). The conversion method used in this thesis is based on SysML diagrams. The resulting CPN model is in line with the MDA approach since the sequence diagram is constructed according to the MDA paradigm. For example, the overall process starts from the high level business process, and then is gradually decomposed to lower levels of abstraction through substitution transitions. MDA benefit can be reflected in the executable model. First, modularity: common operations that are carried out by several objects can be organized into modular components which are reusable. Second, easy to maintain: if there is a change in the business process or a new use case scenario is introduced, only the high level process needs to be modified (or created). All the lower CPN pages can be reused. If there is a change in the lower level, the change usually is localized in the modular level and only the sub-pages need to be modified. This is analogous to the relationships between Platform Independent Models (PIMs) and Platform Specific Models (PSMs) in the MDA approach. These proprieties are very useful since during the design process, the designer often needs to shift back and forth between the CPN model and the SysML model in order to refine or reconfigure the design, or to incrementally develop the system. Figure 3.7 reflects the concept of reusable module in a CPN.
50 38 A process configuration in scenario 1 Event 1 Module M1 A set of operations Event 2 Object 1 Operation 1 Port input Reusable Module Port Output Object m1 Operation m1 Event m1 Module M2 A set of operations A process configuration in scenario 2 Event 3 Module M1 A set of operations Event 4 Object 2 Operation 2 Figure 3.7. Reusable Module in a CPN 3.5. SIMULATION The CPN model provides a very detailed view on the execution of the system but it also contains many details that are not needed in the simulation. The simulation and its results should be as easy to observe as possible in order to facilitate the behavior and performance analysis. In addition, from an execution perspective, the simulation sometimes may need to interact with outside users during the simulation as the real system does. Therefore, a Graphical User Interface (GUI) for the CPN is highly desired. In this thesis, the BRITNeY Suite [68] was employed for these purposes. With the help of the BRITNeY, a GUI is integrated into the original CPN model. During the simulation, the CPN is running underneath the GUI. The user needs only to interact with the GUI to control the execution of the CPN model. A couple of graphic outputs can be generated after the simulation, such as the Message Sequence Charts (MSCs), the State Space Graphs, and etc. They provide effective means to analyze the
51 39 behavior of the system. The following three animation tools supported by the BRITNeY have been used in this thesis: Interactive Control. The interactive control includes accepting inputs from outside users and providing graphical feedback. It is achieved by adding code segments to related transitions. These code segments are executed when the corresponding transition fires in the execution of the CPN model Message Sequence Charts (MSCs). There are four ways to generate the MSCs: Transition Message Sequence Charts can be generated fully automatically based on the fired transitions. This kind of chart shows a timed sequence of fired transitions and their bindings. The sequence of operations in a simulation can be observed through this kind of chart. Place Message Sequence Charts can be generated fully automatically based on values added and removed from places. Code Segment Message Sequence Charts use the code segments attached to CPN transitions together with MSC animation plug-in to generate the MSCs. Monitor Message Sequence Charts use CPN monitors together with MSC animation plug-in to generate the MSCs State Space Graphs. By adding appropriate auxiliary texts to a CPN page, and evaluating these texts, the state Space Graph will be created on the graph window of the BRITNeY Suite. The layout of the graph can be adjusted automatically or manually. Note that the executable model should be exercised for each use case scenario and their combinations in order to fully simulate the real-word application of the system being modeled ARCHITECTURE EVALUATION AND ANALYSIS The tasks in this step include behavior and performance analysis, functionality verification and system configuration refinement. Three forms of methods for architectural evaluation, i.e. logical, behavioral, and performance, are described in [40]. The logic is examined by testing each step of the execution to ensure that the model is following the desired logic. The behavior of the system can be observed directly from the simulation.
52 40 However, it is often beyond the capability of human being to observe the details of simulation by watching the CPN and its markings. Alternative ways must be developed to observe the simulation. A numbers of such ways supported by CPN are provided in [62], e.g. simulation report, adding report places, business, charts, Message Sequence Charts (MSCs), state space reports, and state space graphs. These methods and tools enable detailed net analysis in a static way Behavior and Functionality Verification. The behavior of the architecture should be compared to the user s requirements. The initial system behavior is captured by the sequence diagrams in the architecture model, which represents the desired behavior as specified in the requirements. After an architecture model has been converted to a CPN model, the modeled behavior can be observed from the simulation. This suggests an effective way of verifying and validating the behavior and functionality of the modeled system is to compare the Message Sequence Chart (MSC) (generated by executing the CPN model) and the SysML sequence diagrams. If there is a match, the model can be verified and validated. If the match is insufficient, then either the architecture model needs to be refined in order to better represent the system architecture or the system architecture needs to be reconfigured in order to better satisfy the requirements Specification Completeness Checking. From the comparison of the input sequence diagrams and the output MSCs, the missing specifications in sequence diagrams can be easily identified. The missing specifications in other diagrams can be found based on the concordance between different SysML diagrams as discussed in Section The underneath rationale is that an executable always leads to more complete specifications since the model will not be fully operational until all parts and interaction of the system has been at least abstractly specified. For the same reason, some of the missing specifications can even be found during the development of the executable models. Experimenting the simulation can also help to identify the missing requirements. The existence of missing requirements implies that there are functions that the system must support in order to generate the required behavior or desired performance but have not been yet specified. The refined new model needs to be evaluated again. Thus the system design is an iterative process.
53 41 This section provided a set of generalized methodologies that constitute a framework of executable system architecting. In the following sections, these methodologies will be applied to a concrete system. It will be shown in detail how to use these methodologies to solve practical problems, which includes model development, executable model synthesis, simulation, and architecture evaluation and analysis. Some application specific concerns and solutions will also be highlighted.
54 42 4. MODEL DEVELOPMENT The model development presented in this section demonstrates the application of the modeling methodology described in the previous section. The Global Earth Observation System of Systems (GEOSS) is the target system to be modeled. The basic information about the GEOSS was derived from the 10-Year Implementation Plan Reference Document, which is attached in Appendix D MISSION DEFINITION The purpose of the architecting activity is to develop a model of the GEOSS according to identified requirements. The model can then be used for various purposes such as understanding, presenting, planning, managing or building such system, or system acquisition procurement and integration. The following is a mission statement of the system to be modeled, which is adapted from [53]. Understanding the Earth system its weather, climate, oceans, atmosphere, water, land, geodynamics, natural resources, ecosystems, and natural and human-induced hazards is crucial to enhancing human health, safety and welfare, alleviating human suffering including poverty, protecting the global environment, reducing disaster losses, and achieving sustainable development. Observations of the Earth system constitute critical input for advancing this understanding. The purpose of GEOSS is to achieve comprehensive, coordinated and sustained observations of the Earth system, in order to improve monitoring of the state of the Earth, increase understanding of Earth processes, and enhance prediction of the behavior of the Earth system. GEOSS will meet the need for timely, quality long-term global information as a basis for sound decision making, and will enhance delivery of benefits to society in the following initial areas: Reducing loss of life and property from natural and human-induced disasters; Understanding environmental factors affecting human health and well-being; Improving management of energy resources;
55 43 Understanding, assessing, predicting, mitigating, and adapting to climate variability and change; Improving water resource management through better understanding of the water cycle; Improving weather information, forecasting, and warning; Improving the management and protection of terrestrial, coastal, and marine ecosystems; Supporting sustainable agriculture and combating desertification; Understanding, monitoring, and conserving biodiversity REQUIREMENTS CAPTURE Based on the above mission statements, the requirements of the system were analyzed and extracted from application requirements. A textual representation of the requirements can be organized in a hierarchical manner with index numbers as shown in Figure 4.1 (adapted from [88]). The SysML requirements diagrams help to capture the requirements clearly. Figure 4.2 depicts the functional requirements decomposition. REQ_G 0: The GEOSS shall be able to achieve comprehensive, coordinated and sustained observations of the Earth system, in order to improve monitoring of the state of the Earth, increase understanding of Earth processes, and enhance prediction of the behavior of the Earth system. GEOSS will meet the need for timely, quality long-term global information as a basis for sound decision making, and will enhance delivery of benefits to society in selected areas. REQ_G 1.1 Disaster Mitigation Functional Requirements: Continuity of operations Continuous, real-time data streams Rapid tasking of other data sources Figure 4.1. GEOSS Functional Requirements
56 44 REQ_G 1.2 REQ_G 1.3 REQ_G 1.4 Global coordination of resources Rapid generation of accurate information and forecasts, and Efficient sharing of information products, in formats that are adapted to users needs. Human Health and Well-Being Functional Requirements: Increased coverage and resolution of observations Observations of environmental elements not presently observed Issue-specific observations, especially those related to air and water quality Long-term, sustained observations of ground cover, and air and water quality. Energy Resources Functional Requirements: Continuity of operations Continuous, real-time data streams Time scales of hours, days, seasons, years and decades Geographic scales including point source, regional, and global scale Efficient sharing of information products, in formats that are adapted to users needs. Climatic Functional Requirements: Improved knowledge of Earth s past and present climate, including natural variability, and understanding of causes of observed variability and change Climate system variables that specify the state, forcings, and feedbacks Reduced uncertainty in Earth s climate change forecasts Integrated observations from operational and research observing systems Better understanding of the sensitivity and adaptability of natural and managed ecosystems. Figure 4.1. GEOSS Functional Requirements (cont.)
57 45 REQ_G 1.5 REQ_G 1.6 REQ_G 1.7 REQ_G 1.8 Water Availability and Quality Functional Requirements: Continuity of operations Continuous, real-time data streams Rapid tasking of other data sources Global coordination of resources Rapid generation of accurate information and forecasts, and Efficient sharing of information products, in formats that are adapted to users needs. Weather Forecasting Functional Requirements: Increased coverage and resolution of observations Observations of environmental elements not presently observed Improved timeliness, data quality, and long-term continuity of observations Integrated multi-purpose observing systems and networks that allow rapid dissemination of weather information. Ecosystems and Ecological Forecasting Functional Requirements: Understand ecosystem composition, structure, and function Monitor status and trends in ecosystem conditions and important ecological processes Develop and improve ecological prediction and interpretation tools Develop and test a comprehensive forecasting framework through pilot and case studies Efficient sharing of information products, in formats that are adapted to users needs Sustainable Agriculture and Forestry, and Combating Land Degradation Functional Requirements: Land Cover Assessment Change Detection Figure 4.1. GEOSS Functional Requirements (cont.)
58 46 Soil Moisture Content Species Composition Surveys Linking Observations Across Different Scales. REQ_G 1.9 Understanding, monitoring, and conserving biodiversity Functional Requirements: Open access to continuous, real-time, near real-time, and delayed data streams, and rapid access to archives Robust calibration and validation for all systems An efficient process to transition research into operations Global coordination of resources Rapid generation of accurate information and forecasts Efficient sharing of information products, in formats that are adapted to users needs. REQ_GIS 0: The GEOSS information System shall knit together the distributed components of GEOSS into a global whole that functions as a unified component. It shall effectively ingest and archive observations and integrated observations into the data and communications components that move data among systems and users in a distributed environment. The GEOSS will be required to link observations collected from a broad range of platforms: space, atmospheric, land surface, and oceans. Observations may be point measurements, continuous measurements, or imagery and variables may be biological, geological, chemical, physical, or abstract. The many millions of individual measurements anticipated to be obtained daily by the sensor networks will be transmitted (in real-time, near-real-time, and delayed modes) directly to end users, as well as to the applications and data-assimilating models that process these measurements into maps, plots, forecasts, and other useful forms of information. While the GEOSS vision recognizes that data products, rather than raw data, are typically required by users, the development of most data products will Figure 4.1. GEOSS Functional Requirements (cont.)
59 47 be the responsibility of the various subsystem of the GEOSS. The requirements of the GEOSS with respect to product generation are as follows: 1. to ensure that the needs of product generators are met for timely delivery of quality-controlled data; 2. to provide accurate and thorough metadata accompanying the data; 3. to provide a uniform guaranteed minimum level of geo- and timereferenced graphical browse capability for all classes of data. The GEOSS system shall also guarantee assured data discovery and minimal browsing capability depend upon descriptive metadata, ensuring that the data are readily intelligible to users. REQ_GIS 1.1: The system shall be able to collect remote and in-situ sensor measurements from various Earth observations e.g. space observations, atmospheric observations, land surface observations, and ocean observations. The system shall also have data telemetry capability. REQ_GIS 1.1.1: Collecting in situ measurements. REQ_GIS 1.1.2: Performing remote sensing. REQ_GIS 1.1.3: Conveying data from sensors to primary data assembly centers. REQ_GIS 1.2: The system shall be able to manage data/information (includes data archiving, access, processing, transport, and discovery) to enable efficient sharing of information products. REQ_GIS 1.2.1: Metadata management. The system shall provide simple, clear guidelines and extensible standards for metadata; ensure that the linkages between data and metadata are maintained with great reliability; provide for communication of metadata among components of the system; provide training and tools to increase end users and data providers capacity in meta- Figure 4.1. GEOSS Functional Requirements (cont.)
60 48 data generation and management. REQ_GIS 1.2.2: Data Archive. Long-term archive and stewardship of GEOSS data sets and metadata; conform to related standards and user requirements. REQ_GIS 1.2.3: Data Discovery. The ability to search for and find data sets of interest and access them in an interoperable manner from user applications. REQ_GIS 1.2.4: Data assembly and Transport. The ability to transmit data between various GEOSS points (e.g. sensor nets, assembly centers, archive centers, and users) in real time and delayed mode; the mechanisms for aggregation and buffering of data streams over useful spans of time and space. REQ_GIS 1.3: The system shall be able to process data into useful products that are ready to use by various applications. REQ_GIS 1.3.1: Quality control and quality assurance. The mechanism for assuring that data are of known, documented quality. REQ_GIS 1.3.2: Data-translation and filter. The mechanism for making data compatible as they are transported between various applications. These services include format conversion, region and parameter subsets, point extraction and re-gridding. REQ_GIS 1.3.3: Visualizing data/information product and publishing them on the Internet for uniform on-line browse. REQ_GIS 1.4: The system shall coordinate the distributed resources to support various applications that run on the system. REQ_GIS 1.4.1: Dynamic allocating computing tasks to grid computers. REQ_GIS 1.4.2: Managing the deployment and configuration of real applications. REQ_GIS 1.4.3: Planning workflow and coordinating resources, data and Figure 4.1. GEOSS Functional Requirements (cont.)
61 49 REQ_GIS 1.4.3: applications. Enable the automation of a process in a whole or part, according to a set of procedural rules. REQ_GIS 1.5: The system shall be able to (1) improve, develop, test, and validate operational models; (2) produce accurate estimates of current states of various areas of Earth systems; (3) develop data assimilating techniques to initialize and update models for more accurate forecasts of state changes; and (4) optimize the observing. REQ_GIS 1.5.1: Supporting various analysis models for each domain applications. REQ_GIS 1.5.2: Supporting various domain specific applications and tools. Sustaining and enhancing capacities in research, training, and development. REQ_GIS 1.6: The System shall be able to interface with the user community and the decision support systems they use. REQ_GIS 1.6.1: Providing internet portals for user involvement. Access to data and metadata shall be available through the Internet via a portal. REQ_GIS 1.6.2: Supporting and integrating various user applications and services Figure 4.1. GEOSS Functional Requirements (cont.) The high level requirements for the GEOSS were drawn from [53]. A <<derive>> relationship was used to model this dependency. These high level requirements were then decomposed into sub requirements based on different services areas that the system is supposed to support. The model items that satisfy or verify specific requirements were also related to the corresponding requirements using the <<satisfy>> relationship. The nonfunctional requirements are shown in Figure 4.3. The corresponding textual requirements are given in Figure 4.4.


62 Figure 4.2. Requirements Diagram GEOSS Functional Requirements Decomposition 50
63 51 Figure 4.3. Requirements Diagram GEOSS Nonfunctional Requirements REQ_GIS-NF 1.1: Interoperability. The System shall support Interoperability across components and services: Transparency (format, protocol, etc.); Defining and updating interoperability arrangements including technical specifications for collecting, processing, storing, and disseminating shared data, metadata and products; Facilitating architecture and data standards, using existing standards wherever possible, and identifying gaps in existing standards; Integrated multi-purpose observing systems and networks; Global coordination of resources; Make data available in multiple forms including the data s native form Offer a cross-language and cross-platform data access mechanism that is independent of the data repository Figure 4.4. GEOSS Nonfunctional Requirements
64 52 Enable the abstraction of encoding and transmission mechanisms and allow transparent distributed access to data using multiple protocols REQ_GIS-NF 1.2: Legacy System. The system shall build on existing systems and initiatives defining the components of the GEOSS architecture converging or harmonizing observation methods promoting the use of existing standards and references, intercalibration, and data assimilation The system shall provide a backward-compatible, version-controlled software environment. The system shall not adversely impact existing data access methods or systems of the data providers. REQ_GIS-NF 1.3: Openness. The system shall support open design and standards process The system shall provide access to all types of data: physical, chemical, biological, and geological. Interfaces to data repositories may reside at any location that has network connectivity with the application and the data repository REQ_GIS-NF 1.4: Flexibility/Extensibility/Scalability. The GEOSS as a whole shall be extensible in terms of function, volume, capacity, and throughput. REQ_GIS-NF 1.5: User-friendly and customization. The GEOSS shall provide access to data in a manner that is (largely) transparent to the user; Generic treatment of data sources isolating the requesting client from specific representations, unique request semantics, and protocols. The System shall support customization and personalized services; REQ_GIS-NF 1.6: User feedback and interaction. The system shall support effective user feedback and interactions. Figure 4.4. GEOSS Nonfunctional Requirements (cont.)
65 53 The system shall respond automatically, in a coordinated manner, to both internal and external influences in a manner that optimizes overall system performance. REQ_GIS-NF 1.7: Effectivity. The System shall support reliable, sustained, efficient operations. Improved timeliness, data quality, and long-term continuity of observations. Rapid generation of accurate information and forecasts REQ_GIS-NF 1.8: Performance. The GEOSS shall be developed to conform to minimum performance requirements. The following TBD notional performance requirements apply: 1. Minimum storage at Regional Data Centers, Data Assembly Centers, Modeling Centers, Archive Centers 2. Minimum aggregate computing capacity (ops/s) at Regional Data Centers, Data Assembly Centers, Modeling Centers, Archive Centers 3. Minimum communications bandwidth among Regional Data Centers, Data Assembly Centers, Modeling Centers, Archive Centers. 4. Maximum latency from data request to return to requesting user for simple data requests. 5. Maximum latency from data request to return to multiple simultaneous requesting users for simple data requests. 6. Maximum latency from data request to return to requesting user for complex data requests, including data aggregation, subsetting. 7. Maximum latency from data request to return to multiple simultaneous requesting users for complex data requests, including data aggregation, subsetting. 8. Minimum data volume rate of sustained delivery of volumes of data to a single user. Figure 4.4. GEOSS Nonfunctional Requirements (cont.)
66 54 9. Minimum data volume rate of sustained delivery of volumes of data to multiple users simultaneously. Figure 4.4. GEOSS Nonfunctional Requirements (cont.) Note that the requirement model evolved through design phases, where design details were added and design elements were linked with appropriate requirements. The above requirement models only show the final results OPERATIONAL CONCEPT ANALYSIS Given the requirements, a high level operational concept that describes how the mission will be carried out can be formulated. The DoDAF products can be used for this purpose. Since the main purpose of using DoDAF products in this thesis is to facilitate the function analysis and refine the requirements, only the High-Level Operational Concept Graphic (OV-1) has been used here. The intent of OV-l is to provide a quick, high- level description of what the architecture is supposed to do, and how it is supposed to do it, including the interactions between the subject architecture and its environment, and between the architecture and external systems. Figure 4.5 shows the OV-l. The architecture describes the major system modules, data elements or objects, and interfaces between those modules. From a functional view, GEOSS includes the following four efficiently linked systems: the Observations and Data Telemetry system; Data Analysis and Modeling system; User Service System (a variety of services available to the users), and External Control System (providing oversight mechanisms to ensure the proper functioning and smooth evolution of GEOSS, e.g. fault detection and correction, security, monitoring and evaluation of system performance, providing for system extensibility). All these systems are connected by the Information Management Infrastructure, which integrates the diverse data flow from a variety of sources and incorporates the data flow into an open-access, scalable, modular and distributed real-time system.
67 55 Observational Community Research Community Observation & Data Telemetry Sensor Networks Systems Data Retrieve & Consolidate Data Modeling & Analysis Systems Analysis Models Analysis Tools Inputs Observations Primary Data Assembly & Quality Control Other Data Portals (Social-economic data) Predictions & Analysis System Operator Data Management Meta data Data Discovery Data Archive Data Transport Information Management infrastructure External Control System Dynamic Planning & Scheduling Health Energy User Interface Services Aware Tools Application/Data Management Web Services Infrastructure Operational information Maintenance & Management Forecasts Distributed Resources Ecology Disasters Information Products (Forecasts, Maps, images), On-line Browse User Service System Policy Decisions Social Benefits Climate Agriculture Management Decisions Oceans Resource Management Primary Data Processing Water Cyber Infrastructur Impacts Outcome Outputs User Community Figure 4.5. GEOSS High-Level Operational Concept Graphic (OV-1)
68 56 Data flow within GEOSS begins with the Observing & Data Telemetry System. Raw measurements from its elements are processed at various primary data assembly and quality control sites. These measurements then enter the data communications infrastructure. Both the observations and the processed information (e.g. predictions and analysis results) are delivered by the GEOSS Information Management Infrastructure as requested by the end user. Three basic tasks are performed by the infrastructure. They are: Data management, including: GEOSS-wide descriptions of data sets (Metadata Management); The ability to search for and find data sets of interest (Data Discovery); The ability to securely archive data and metadata and retrieve them on demand (Data Archive); The ability to access the data in an interoperable manner from client applications (Data Transport). Resource management (coordinates the distributed resources to support various applications that run on the system, e.g. dynamic allocation computing tasks to grid computers, manage the deployment and configuration of real applications, and plan workflows), and Primary data processing (data quality control, format conversion, visualization, and publishing the data on the Internet for uniform on-line browse). The data and information product of the system are also grouped into four categories, inputs, outputs, outcomes and impacts, as shown in the figure. The scope of the system is delineated using the rectangular box. Actors are end users who interact with the systems and hence are placed outside the system but are connected to the appropriate part of the system USE CASE DEFINITION Based on the above information, functionality can be grouped to create the use cases. A use case describes the usage of the system (subject) in the form of a set of services provided by the system for its actors (environment).

. Figure 4.6.")

69 57 Figure 4.6 is a top level use case of GEOSS (All actors shown in this diagram should be connected to each of the use case but the association relationships have not been shown explicitly in this diagram for simplicity purpose). Figure 4.6. GEOSS Top Level Use Case Diagram Figure 4.7 shows the decomposition of the Weather Forecasting Service use case and the related use cases. Figure 4.8 shows the middle level use case. Figure 4.9 shows the decomposition of Data and Resource Management use case.


70 58 Figure 4.7. GEOSS High Level Operational Use Case Diagram Figure 4.8. GEOSS Middle Level Use Case Diagram


71 59 Figure 4.9. Decomposition of the Data and Resource Management Use Case In these diagrams, the include relationship defines common functionality which is shared among multiple use cases and is always performed as part of the base use case. The extend relationship defines optional functionality that extends the base use cases. The generalization specifies variants of the base use case. These diagrams are also shown in Appendix A.
72 USE CASE SCENARIOS A use case scenario in this thesis refers to a specific application of the system. The operational concept can support several use case scenarios. A scenario can be used as a test case to verify the architecture being modeled. Four use case scenarios were considered in this thesis. They are selected from [89] as shown in Figure 4.10 through Figure These figures have been extracted from Popkin s System Architect where they reside as OV-6a diagrams (Operational Rules Model of DoDAF products). These scenarios were, however, revised as required for the modeling purpose in this thesis. The system being modeled in this thesis contains both automatic processes and configurable processes. The workflows for these four scenarios are configurable ones, which are based on some pre-defined automatic processes. These configurations represent the initial set of the system, which should be defined case by case Five Day Ocean Forecast Use Case Scenario. Figure 4.10 presents the Five Day Ocean Forecast use case scenario. A highlight of the scenario is given as follows: National or Global modeling is performed in data assembly centers. National and Global modeling makes use of the consolidated regional forecasts as boundary input to global (ocean basin) modeling and also takes high resolution core variables provided by regional observing systems as input. The steps depicted in Figure 4.10, are simultaneously executed in multiple locations at different levels (e.g. regional, national, and global) exchanging information between cycles, in order to provide continuous high fidelity nowcasts and forecasts for a true five day forecasting capability, similar to that of the National Weather Service. For detail descriptions of this use case scenario, please refer to [90] Five-Day Ocean Forecast Pre-Operational Use Case Scenario. The Five Day Ocean Forecast application is an operational system that demands high reliability and availability. Therefore, updates to the operational system are thoroughly tested and examined in a separate but equally stressing environment before being transitioned into the operational system. That s why a pre-operational scenario is needed. Figure 4.11, presents the Use Case scenario for maintaining and operating a Pre-Operational version of the Five Day Ocean Forecasting application. The scenario begins with the receipt of a change proposal generated as an output from the Academic
73 61 Perform Sensor Collections Consolidate Sensor Data Access Current Data Archive Current Sensor Data QA/QC Current Data Retrieve Bathometric Data Retrieve Climatological Data & & Consolidate Model Inputs Publish Operational Inputs Retrieve Historical Sensor Data Obtain Latest Forecasts from Regions Synthesize Regional Forecasts Obtain Grid Boundary Conditions from National Forecast Next Version Ready? O Regional or National? O Run with Current Version O Run Operational Models QA/QC Operational Five Day Ocean Model Outputs Forecast-Pre-Operati onal Use case Publish Current Replace Operational Model with the next version Forecast Characterize Improvement Use Case Archive Current Forecast Regional or National? & O Distribute Regional Forecasts Distribute National Forecasts Perform Threshold Analyses Generate Alerts & Alarms Figure Five Day Ocean Forecast Use Case Scenario
74 62 Modeling and Algorithm Research Use Case (which is pretty much like the Characterize Improvements Use Case Scenario mentioned shortly later so it has not been modeled in this thesis). After running the proposed change in parallel with the operational system and comparing the resulting outputs, the scenario ends with an approved change being queued for introduction into the operational system. This Use Case is targeted for the specific instance of Pre-Operational Five Day Ocean Forecasting. There can, and probably will be, several instances of Pre-Operational Five Day Ocean Forecasting models being examined at the same time, some at the national level and some at each Regional Association. For detail descriptions of this use case scenario, please refer to [91] Academic Modeling & Algorithm Research Use case Approve Change to Operational Model Baseline Change Proposal Subscribe to Operational Inputs Create Beta Version Forecasting Model & Run Beta Model QA/QC Beta Model Outputs Publish Beta Forecast Characterize Improvements Use case Forecast Not Improved Queue Operational Model Baseline Update Forecast Forecast Improved Improved? O Figure Five-Day Ocean Forecast Pre-Operational Use Case Scenario Characterize Improvements Use Case Scenario. The evolution of operational GEOSS systems and subsystems across time is governed by a set of processes that introduce changes in a controlled non-disruptive manner. As academic research is conducted and updates to operational systems are proposed, any potential changes to the systems are carefully evaluated to characterize the improvements. Figure 4.12, depicts a
75 63 stand-alone use case scenario that can be applied in a variety of different situations in order to evaluate the outputs from a research or pre-operational system against the outputs from the current operational system and/or the actual sensor readings. For detail descriptions of this use case scenario, please refer to [92]. Subscribe to Operational Forecast Subscribe to Research or Beta Forecast & & Compare Operational to Research or Beta Forecast Compare Actual Measures to Forecast & Identify Required and Desired Improvements Retrieve Sensor Data Figure Characterize Improvements Use Case Scenario Emergency Management Use Case Scenario. Figure 4.13 shows the emergency management plan carried out by the Maryland Emergency Management Agency and other related organizations being aimed at reducing public health risks and effectively mitigating the effects of natural hazards. The specific events being addressed are category 3 and category 4 hurricanes that come on-shore. Emergency plans need to be updated regularly. Part of the update includes making use of the latest high-resolution digital elevation maps and the near-shore maps. The SLOSH (Sea, Lake, and Overland Surge from Hurricanes) model is used to perform a major part of the analysis. Large sets of cases are inputted to get a robust Monte Carlo simulation producing Maximum Envelopes of Water (MEOWs). This intermediate product
76 64 set is used to create new maps showing how much further inland flooding could stretch under various forcing conditions. This Use Case is based, in large, on an AP Wire article entitled Storm surges could be twice as bad as those caused by Isabel published April 30, For detail descriptions of this use case scenario, please refer to [93]. Need to Update Evaluation Plan is Realized & Retrieve Digital Elevation Maps from IOOS Retrieve Core Variables from IOOS Select Hurricane Monte Carlo Data set & Execute SLOSH Model Through IOOS Significant Changes Found Retrieve SLOSH results from IOOS Significant Changes? O No Significant Changes Update MOMS set Points in IOOS Prepare Inundation Report Distribute Inundation Report Subscribe to Core Variables in IOOS & Threshold MOMS Exceed? Monitors Core & Variables in IOOS Within Thresholds Threshold Exceed MOMS Sends Emergency Notifications Continue Monitoring Figure Emergency Management Use Case Scenario

77 COMPUTATION INDEPENDENT MODEL (CIM) DEVELOPMENT A generic Computation Independent Model (CIM) can be created by abstracting the business process aspect of the operational concept. Here both structure diagrams and behavior diagrams have been used to specify CIM. In Figure 4.14, a block definition diagram has been used to identify the domain of the system. The information was extracted directly from the OV-1. Block is a SysML stereotype based on UML class. It provides a unifying concept to describe the structure of an element or a system. Unlike UML class, multiple compartments can be used to describe the block characteristics in SysML. This is an advantage of SysML over UML. A block definition diagram describes the relationship between blocks (e.g. composition, association, generalization). SysML uses different arrow types to indicate this relationship. The composition relationships and reference relationships are used in Figure In Figure 4.15, an Internal Block Diagram is used to depict the business process for representing the CIM. This business process was developed by identifying the top level functional organization partition from a horizontal view [81]. At this point, no details about the target domain and platform are being taken into consideration. An internal block Figure Block Definition Diagram GEOSS Domain Breakdown


78 66 Figure Internal Block Diagram GEOSS High Level Operation diagram shows the connection between composition parts. Interfaces, which are service or signal exchanges, are represented by SysML standard ports, either provided type or required type. Data and item flows between parts are represented by SysML flow port. In Figure 4.16, a block definition diagram is used to present the interface definitions corresponding to the standard port in Figure The dynamic behavior of the components identified so far can be specified using activity diagrams. An activity diagram specifies sequences of actions, the object flow between actions and conditions for coordinating activities. These actions can be separated into swim lanes, each of which represents a specific responsible entity, e.g. an organizational group or a subsystem.
.")

79 67 Figure Block Definition Diagram Interface Definition Activity diagrams can be presented in a variety of ways to show different views of the system behavior. Figure 4.17 is a high level activity diagram showing generic behavior. It modeled the control-driven serial behavior of the system. Control flows were represented by solid arrows connecting actions (represented by rounded rectangles). Objects flows between actions were represented by dashed arrows that connect the object (represented by rectangle) and the actions (represented by rounded rectangles). Parallel activities start from Fork Nodes and end at Joint Nodes. For a multi-task system, Figure 4.18 represents the prototype of a single thread of behavior that the system may carry out in all use cases. For each specific use case some of the actions may not take place. Since the GEOSS was modeled as a parallel processing system, the concurrent behavior should also be modeled in some way. Figure 4.18 did this job. It modeled the I/O driven continuous parallel behavior of the system. All actions in this diagram share the same fork node and the same joint node since, and at any specific point of time, all of these actions may take place concurrently corresponding to a specific point of stage in carrying out a task.


80 Figure GEOSS High Level Activity Diagram Showing Generic Behavior 68


81 Figure GEOSS High Level Activity Diagram Showing Concurrent Behavior 69
82 PRELIMINARY STRUCTURE DIAGRAMS DEVELOPMENT In this step, the model transformation principles of MDA approach were applied. Domain information was iteratively introduced and drove the decomposition from CIM to PIM and from PIMs to PSMs. The resulting system architecture was a layered architecture, unlike the typical federated one. This style of organizing the components standardizes structure and leverages enormous flexibility in behavior. In Figure 4.19, a SysML block definition diagram is used to describe the relationship of the components in GEOSS. The generalization relationship is used to describe different variants of the same base blocks. As shown in Figure 4.19, the system activities are realized as five distinct yet highly interconnected layers and a cross-cutting layer according to their roles in data and information processing. Lower layers provide service to upper layers and upper layers are logically closer to the user. Layer 1 is packaged into user interface and comprised of web portals (including websites) that spawn user-customized workflows and various user applications, e.g. decision-support tools that automatically ingest information products from pre-configured workflows. These collaborating components interact directly with end users and end-user tools and provide all the behavior of the system with the supports of the lower layers. The complexities of the underlying system architecture and the implementation details are hidden from outside users. Layer 2 is packaged into Applications & Tools and comprised of common applications and tools that provide services to the user applications. It contains the various numerical models employed by GEOSS for predicting and analyzing observations. It also includes data translation and visualization toolkits for pre-processing or post-processing data and information products. Components within this layer generally interact with one another in a fashion that is coordinated by the workflow tools. These components are identified by concerning the needs for interoperation between the applications in the upper level and the domain specific operations that these applications carry out. Layer 3 is packaged into Configuration & Execution Management and comprised of service modules that would be invoked by GEOSS workflows. They are divided into the following five groups:


83 Figure Block Definition Diagram GEOSS Structure Breakdown 71
84 72 Application environment configuration components manage the deployment and configuration of real applications facilitating their executions. Application resource management components coordinate the distributed computational resources to support various applications that run on the system. Data management components coordinate input and output of an application (usually the model input/output). These components coordinates with resource management components to make sure the data goes to its intended destinations. Archive management components establish dynamic and standardized connections to existing repositories of GEOSS (data/ metadata/ information product). Workflow management components provide a coordinated mechanism to manage resources, data and application tasks. These components are identified by concerning the interfaces between the applications and the hardware infrastructure. Layer 4 is packaged into Resource Access. It provides the data transport service and the standard protocols for accessing the raw services. These components were identified by concerning the interfaces between local and remote computational resources. Layer 5 is packaged into Resources representing all the physical raw resources including distributed database and storage, computational hardware and software, sensors, and data collection centers. Some cross-cutting components provide functionality that spans multiple layers, for example, catalog, registration, subscription, security, and monitoring service. These components are identified and grouped into a package named Common Services. In general, such cross-cutting components provide ancillary services that are needed by the tasks in Configuration & Execution Management layer. For instance, directory provides services that enable discovery and location of data and resources throughout the system. Note that only a preliminary structure diagram can be developed from the information on hand in this step. The detail specifications of interfaces and flow properties between interconnecting components need information from the sequence diagrams and activity diagrams which will be developed after this step.
85 SEQUENCE DIAGRAMS DEVELOPMENT The sequence diagrams illustrate the flow of control between actors and systems or between the parts of a system. The sequence of message passing (over time) between interacting entities are depicted on the horizontal line between the lifelines under each interacting object. The messages can be events (input or output signals between system parts and outside actors), item flows, or operation calls. To manage the complexity, hierarchical sequence diagrams are used. Appendix A20 through Appendix A22 depict the top level sequence activities for each of the use case scenario (The Pre-Operational use case and the Characterize Improvements use case were combined together for simplification purpose). The reference interactions that further elaborate on the system behavior are represented by rectangles that span several interacting objects. A sub-level sequence diagram was created for each of these reference interactions. Each of theses nesting sequence diagrams might also have nested sequence diagrams. Appendix A23 through Appendix A30 shows these nested sequence diagrams ACTIVITY DIAGRAMS DEVELOPMENT By examining the input and output message flow of an object in the sequence diagrams, the operations (actions) that the object needs to conduct in order to generate the output can be identified. Again, these sets of activity diagrams were organized in hierarchical structures. For each of the action shown in high level activity diagrams, there is, if needed, a child activity diagram that further elaborates on that action, which may contain further child activity diagrams. Appendix A33 through Appendix A40 shows these child activity diagrams REFINE STRUCTURE DIAGRAMS Now, enough information is available for refining the structure diagrams. The tasks involve the definition of blocks in terms of their operations and attributes, the specification of connections between blocks, and the corresponding interfaces and item flows. When these are done, the specifications of structure diagrams should be completed. In Figure 4.20, an internal block diagram was used to show the internal structure of GEOSS in terms of its prosperities (part), connectors, and ports.


86 74 Figure Internal Block Diagram GEOSS Internal Connection The operational calls identified in sequence diagrams are used to specify standard ports and the corresponding interfaces. A Standard Port can either be provided or required, which represents the services that the owning block provides to its environment or the services that the owning block expects of its environment, respectively. The standard port is typed by interface specification. In Figure 4.21, a block definition diagram was used to define the interface specifications.


87 75 Figure Block Definition Diagram for Interface Definition The object flows identified in activity diagrams and message exchanges in sequence diagrams were used to specify the Flow Ports, Flow Specifications and Item Flows. Flow Ports and the associated Flow Specifications define what can flow between the block and its environment, whereas Item Flows specify what does flow in a specific

88 76 usage context. Flow Ports and Item Flows have been shown in the above internal block diagram. Flow Specifications are defined using a block definition diagram as shown in Figure Figure Block Definition Diagram for the Flow Specification The operations identified in activity diagrams and sequence diagrams were grouped for each of GEOSS s components to form the block definitions as shown in Appendix A10 through A 14. The main purpose of the model development in this thesis is to facilitate the simulation of system behavior, which mainly involves the interaction of the components (object) within the system. A State machine diagram illustrates the behavior of an individual object and thus is of little usefulness for this purpose. Therefore, the state machine diagrams have not been used here.
89 77 5. EXECUTABLE MODEL DEVELOPMENT In this section, the SysML model developed in the preceding phase was converted to an executable model represented by Colored Petri Net (CPN). The conversion was based on SysML sequences diagrams as discussed in Section 3.4 of this thesis MODEL OVERVIEW The complete CPN model is hierarchically structured into 15 modules. The module concept of CPN is achieved through the substitution transitions which have associated sub-modules providing a more precise and detailed description of the activity represented by the substitution transition. A sub-module of a substitution transition may contain further substitution transitions. A CPN module is presented on a CPN page. As discussed earlier, the conversion method used in this thesis is case based, which means each use case scenario will have a corresponding representation in the CPN model. Appendix B2 through Appendix B5 presents the 4 top level modules (page) of the CPN model, each corresponding to a specific use case scenario and the associated sequence diagram. For each of the lower level sequence diagrams, there is also a corresponding sub-module (page). They are shown in Appendix B6 through Appendix B15. Each of these sub-modules is connected to its corresponding substitution transition through specific sockets and ports. The hierarchy relationship is depicted in Figure 5.1, which also shows the corresponding index of these pages in appendix B. A transition was named by both the operation that the transition represents and the owning object of that operation. Since an operation is always conducted by an object, this naming policy clearly shows this relationship. The colors (data types) of tokens that can reside on a place are determined by the color set of the place. Color sets are similar to data types in conventional programming languages. Appendix B16 lists the definitions of the color sets used in this CPN model. These color sets are constructed using the attributes of the blocks in related block definitions diagrams. The variables and functions used in the CPN model are also shown in Appendix B16. A state of a CPN is called a marking. It consists of a number of tokens positioned on the individual places.
90 78 GEOSSv2n_N4msc-Mon-Obj FiveDOceanForecast EmergencyMgt UserInput ModelUpdate ExternalControl Improvement Resources Appendix B2 Appendix B3 Appendix B1 Appendix B4 Appendix B6 Appendix B5 Appendix B7 CollectObs Appendix B9 CollectAncillaryInfo(1) Appendix B10 Prepare Md In Appendix B11 Computation(3) Appendix B12 Workflow Mgt(3) Appendix B13 SltCfgCmpRsc(3) Appendix B14 DataDiscvAccess(3) Appendix B15 Computation(5) Appendix B12 Workflow Mgt(5) Appendix B13 SltCfgCmpRsc(5) Appendix B14 DataDiscvAccess(5) Appendix B15 CollectAncillaryInfo(2) Appendix B10 Computation(4) Appendix B12 Workflow Mgt(4) Appendix B13 SltCfgCmpRsc(4) Appendix B14 DataDiscvAccess(4) Appendix B15 Computation(6) Appendix B12 Workflow Mgt(6) Appendix B13 SltCfgCmpRsc(6) Appendix B14 DataDiscvAccess(6) Appendix B15 Computation(1) Appendix B12 Workflow Mgt(1) Appendix B13 SltCfgCmpRsc(1) Appendix B14 DataDiscvAccess(1) Appendix B15 Computation(2) Appendix B12 Workflow Mgt(2) Appendix B13 SltCfgCmpRsc(2) Appendix B14 DataDiscvAccess(2) Appendix B15 Archive Data Appendix B8 Figure 5.1. Page Hierarchy of the CPN Model A new CPN page named UserInput was created but had no associated SysML sequence diagrams. It was created exclusively for simulation purposes. In order to better simulate the real-word situation, the concurrent execution of multiple tasks, the user is given the freedom to specify which task(s) and how many times each task(s) are going to be executed in the simulation. This is done by giving the proper Initial Markings to specific places in the UserInput page. For example, the three places, Five Day Ocean Forecast, PreOperational Model and Emergency Management, respectively, are given the initial markings of "Ocean Forecast", "Operational Model Basline Update" and "Emergency Management". These initial markings are notations that represent the three top level tasks to be executed by the CPN model. The three places named zcycles1, zcycles2 and zcycles3, respectively are used to specify how many times each of the above three tasks is going to be executed with 0 meaning no execution. Note that the Characterize
91 79 Improvement use case scenario is always executed in combination with the Pre-Operational use case scenario in this thesis so the exestuation of Characterize Improvement scenario is designed to be invoked by the Pre-Operational scenario THE ANIMATION GRAPHICAL USER INTERFACE (GUI) The CPN model can be integrated with the BRITNEY suite to generate a Graphical User Interface (GUI) during the simulation. The integration is done by adding certain artifacts to the CPN model in the way defined by the BRITNEY suite. Two types of GUI supported by the BRITNEY suite have been used in this thesis The Interactive Interface. Two type of user interactions are involved in the use case scenarios modeled in this thesis. The first is instant feedback. The BRITNEY suite can extract information during the simulation and give instant feedback. This provides a means to monitor the simulation by observing the information of interest. For example, during the execution of the scenarios modeled in this thesis, the system may generate some products, say ocean forecast, which gives important information about the execution of the simulation (indicating the completeness of the Five day ocean forecast scenario in this case). The second is interactive control. The model will ask for and accept user input during the simulation in order to determine the workflow of the simulation. For example, during the execution of the scenarios modeled in this thesis, there are some decision points that need the user to review certain outcomes of the execution and make decisions, which may have impacts on the workflow. These user interactions in the execution of the CPN model are achieved by attaching code segments to interested transitions in the CPN model. These code segments are executed whenever the corresponding transition occurs in the simulation of the CPN model. As an example, the transition Distrubite RegForecast -ResAccess (see Figure 5.2) has an attached code segment displaying a dialog window on the users screen with the text 5 Day Ocean Forecast Output2-Distributed Service Product: Regional Ocean Forecast, which indicates the completion of one cycle of five day ocean forecast scenario. While the transition Identify Required and Desired Improvements AnlsTool (see Figure 5.3) has an attached code segment that asks for the user s input using a dialog window. The user is


92 80 asked to review the performance of the beta model and decide whether there is an improvement. If the user inputs y meaning yes, the transition Update to New Mdl Models (see Figure 5.4) will be fired after some steps and the operational model used in the five day ocean forecast will be replaced by the beta model in the later simulation process. Figure 5.2. The Code Segment on Transition Distrubite RegForecast -ResAccess from Page FiveDOceanForecast Figure 5.3. The Code Segment on Transition Identify Required and Desired Improvements AnlsTool from Page Improvement

93 81 Figure 5.4. The Transition Update to New Mdl Models fom Page FiveDOceanForecast In addition to the code segments, certain declarations need to be set up in the Animation setup declaration group of the CPN tools as shown in Figure 5.5. The declarations set up the connection to the BRITNeY suite. Animation setup structure dialog = GetString(val name = "Question"); structure msg = ShowString(val name = "Important Message"); Figure 5.5. Declarations under the Animation Setup Declaration Group

94 82 In this declaration, two new objects, dialog and msg are created in the BRITNeY suite. Each object is created by a Standard ML functor, which takes as parameter a descriptive name of the new object. The available methods for each object can be seen by evaluating open <object-name> as shown Figure 5.6. Figure 5.6. Evaluating Auxiliary Texts on a CPN Page Message Sequence Charts (MSCs). The generation of Message Sequence Charts (MSCs) provides a powerful tool for analyzing the behavior of the system. The BRITNeY suite supports 5 approaches to drawing MSCs. In this thesis, the more advanced approach, Monitor Message Sequence Chart, was employed because it allows more control on the style of the output of MSCs. This approach of generating MSCs uses the MSC animation plug-in of BRITNeY with monitor in CPN. The only steps needed on the CPN model are 1) creating a proper User-Defined Monitor, which monitors interested transitions, and 2)adding MSC object declarations. Here, the top CPN page of the five day ocean forecast scenario is taken as an example to show how the transitions of this page are monitored and how the MSC was created.

95 83 The declaration of the MSC object specifies the name of the MSC that events will be drawn on during the simulation (see Figure 5.7). It is given a name so the BRITNeY Suite can recognize it. Figure 5.7. A Screenshot on Declarations of the MSC Object In order to create the monitor, the User-Defined Monitor tool of CPN should be applied to each of the transitions that are going to be monitored. The selected transitions are shown in the Nodes ordered by pages group under the CPN monitor index (see Figure 5.8). There are five parts in the monitor specification. 1. Initialization function (see Figure 5.9). These specifications initialize the MSC with the interacting objects that are going to be shown on the top of the MSC (analogues to the SysML sequence diagram). The order specified here determines the order of the objects shown in the MSC.

96 84 Figure 5.8. A Screenshot after Applying User-Defined Monitor Tool to Related Transitions fun init (FiveDOceanForecast'PostProcess_1_mark : DataLbxTpxValxTpMxServID ms, FiveDOceanForecast'ResAccess1_1_mark : DataLbxTpxValxTpMxServID ms, FiveDOceanForecast'ResAccess2_1_mark : DataLbxTpxValxTpMxServID ms, FiveDOceanForecast'ResAccess3_1_mark : DataLbxTpxValxTpMxServID ms) = (msc5dof.addprocess("desktopapp"); msc5dof.addprocess("obssys"); msc5dof.addprocess("websiteportals"); msc5dof.addprocess("anlstool"); msc5dof.addprocess("resaccess"); msc5dof.addprocess("database"); msc5dof.addprocess("models"); msc5dof.addprocess("preprocess"); msc5dof.addprocess("postprocess") ) Figure 5.9. Specifications for Initialization Function
97 85 2. Prediction function (see Figure 5.10). The predication functions will evaluate to true when one of the monitored transitions fires with some binding. The code is auto-generated. fun pred (bindelem, FiveDOceanForecast'PostProcess_1_mark : DataLbxTpxValxTpMxServID ms, FiveDOceanForecast'ResAccess1_1_mark : DataLbxTpxValxTpMxServID ms, FiveDOceanForecast'ResAccess2_1_mark : DataLbxTpxValxTpMxServID ms, FiveDOceanForecast'ResAccess3_1_mark : DataLbxTpxValxTpMxServID ms) = let fun predbindelem (FiveDOceanForecast'Disseminate_Model_Input (1, {Id,Lb,Tp,Tp2,TpM,US,vl})) = true predbindelem (FiveDOceanForecast'Distribute_Observations (1, {Id,Lb,Tp,TpM,US,vl})) = true predbindelem (FiveDOceanForecast'Distrubite_RegForecast (1, {Id,Lb,Tp,TpM,US,vl})) = true predbindelem (FiveDOceanForecast'Distrubute_NatForecast (1, {Id,Lb,Tp,TpM,US,vl})) = true predbindelem (FiveDOceanForecast'Interpret_Services (1, {Id,US})) = true predbindelem (FiveDOceanForecast'Publish_Forecast (1, {ApRqs,Id,Lb,Tp,TpM,Tps,US,vl})) = true predbindelem (FiveDOceanForecast'QA (1, {Id,Lb,Tp,Tp2,TpM,US,vl})) = true predbindelem (FiveDOceanForecast'Receive_Mdl (1, {ApRqs,Id,InRqs,Tps,US})) = true predbindelem (FiveDOceanForecast'Sorting (1, Figure Specifications for Prediction Function
98 86 {ApRqs,Id,Lb,Tp,TpM,Tps,US,vl})) = true predbindelem (FiveDOceanForecast'Threshold_analysis (1, {ApRqs,Id,Lb,TH,Tp,TpM,Tps,US,vl})) = true predbindelem (FiveDOceanForecast'Transmit_Anc_Info (1, {Id,Lb,Tp,TpM,US,vl})) = true predbindelem (FiveDOceanForecast'Update_to_New_Mdl (1, {Tps,Tps2})) = true predbindelem _ = false in predbindelem bindelem end Figure Specifications for Prediction Function (cont.) 3. Observation function (see Figure 5.11). The observation function extracts the information of interest from the binding element and transforms it so it can be used in the action function. The information of interest is a triple (the sender object, the receiver object, and the message sent from sender to receiver). fun obs (bindelem, FiveDOceanForecast'PostProcess_1_mark : DataLbxTpxValxTpMxServID ms, FiveDOceanForecast'ResAccess1_1_mark : DataLbxTpxValxTpMxServID ms, FiveDOceanForecast'ResAccess2_1_mark : DataLbxTpxValxTpMxServID ms, FiveDOceanForecast'ResAccess3_1_mark : DataLbxTpxValxTpMxServID ms) = Let Figure Specifications for Observation Function
99 87 fun obsbindelem (FiveDOceanForecast'Disseminate_Model_Input (1, {Id,Lb,Tp,Tp2,TpM,US,vl})) = [("PreProcess","ResAccess","PrepareMdlInput "),("ResAccess","Models","MdelInput "^DataLbxTpxValxTpMxServID.mkstr(("",Tp2,vl,Tp2^"MetaDt"),(US,Id))), ("ResAccess","Models","MdelInput "^DataLbxTpxValxTpMxServID.mkstr(("",Tp2,vl,Tp2^"MetaDt"),(US,Id))), ("ResAccess","Database","MdelInput "^DataLbxTpxValxTpMxServID.mkstr(("",Tp2,vl,Tp2^"MetaDt"),(US,Id))), ("ResAccess","Models","MdelInput "^DataLbxTpxValxTpMxServID.mkstr(("",Tp2,vl,Tp2^"MetaDt"),(US,Id)))] obsbindelem (FiveDOceanForecast'Distribute_Observations (1, {Id,Lb,Tp,TpM,US,vl})) = [("ObsSys","ResAccess","CollectObservations "),("ResAccess","PreProcess","Obs "^DataLbxTpxValxTpMxServID.mkstr((Lb,Tp,vl,TpM),(US,Id))), ("ResAccess","Database","Obs "^DataLbxTpxValxTpMxServID.mkstr((Lb,Tp,vl,TpM),(US,Id))), ("ResAccess","AnlsTool","Obs "^DataLbxTpxValxTpMxServID.mkstr((Lb,Tp,vl,TpM),(US,Id))), ("ResAccess","WebsitePortals","Obs "^DataLbxTpxValxTpMxServID.mkstr((Lb,Tp,vl,TpM),(US,Id)))] obsbindelem (FiveDOceanForecast'Distrubite_RegForecast (1, {Id,Lb,Tp,TpM,US,vl})) = [("ResAccess","Database","DistrubiteRegF "^DataLbxTpxValxTpMxServID.mkstr(("Distributed",Tp,vl,TpM),(US,Id)))] obsbindelem (FiveDOceanForecast'Distrubute_NatForecast (1, {Id,Lb,Tp,TpM,US,vl})) = [("ResAccess","Database","DistrubiteNatF "^DataLbxTpxValxTpMxServID.mkstr(("Distributed",Tp,vl,TpM),(US,Id)))] obsbindelem (FiveDOceanForecast'Interpret_Services (1, {Id,US})) = Figure Specifications for Observation Function (cont.)
100 88 [("DesktopApp","ObsSys","RequireObs"^AppxInputxServ.mkstr([],["Ocean Obs-"],(US,Id))), ("DesktopApp","WebsitePortals","RequireAncInfo"^AppxInputxServ.mkstr([], ["Bathymetric data-","climatological data-","historical sensor data-","ocean Forecast Product-"],(US,Id))), ("DesktopApp","PreProcess","PreProcessReq "^AppxInputxServ.mkstr(["Consolidate-","translate-"],["ObsPrd-Ocean Obs-","Bathymetric data-","climatological data-","historical sensor data-","ocean Forecast Product-"],(US,Id))), ("DesktopApp","Models","ModelsReq"^AppxInputxServ.mkstr(["Ocean Forecast model-"],["processed Model Input for-ocean Forecast model-"],(us,id))), ("DesktopApp","AnlsTool","AnlsToolReq"^AppxInputxServ.mkstr (["SortForecast"],["Regional Ocean Forecast-","National Ocean Forecast-"],(US,Id))), ("DesktopApp","AnlsTool","AnlsToolReq"^AppxInputxServ.mkstr(["Threshold analysis-"],[],(us,id))), ("DesktopApp","DesktopApp","ServicesReq"^AppxInputxServ.mkstr(["Publish Forecast"],["Ocean Forecast Product-"],(US,Id)))] obsbindelem (FiveDOceanForecast'Publish_Forecast (1, {ApRqs,Id,Lb,Tp,TpM,Tps,US,vl})) = [("DesktopApp","AnlsTool","PubForecast "^DataLbxTpxValxTpMxServID.mkstr(("",hd Tps,vl,(hd Tps)^"MetaDt"),(US,Id))), ("DesktopApp","AnlsTool","PubForecast "^DataLbxTpxValxTpMxServID.mkstr(("",hd Tps,vl,(hd Tps)^"MetaDt"),(US,Id))), ("DesktopApp","WebsitePortals","PubForecast "^DataLbxTpxValxTpMxServID.mkstr(("",hd Tps,vl,(hd Tps)^"MetaDt"),(US,Id))), ("DesktopApp","Database","PubForecast Figure Specifications for Observation Function (cont.)
101 89 "^DataLbxTpxValxTpMxServID.mkstr(("",hd Tps,vl,(hd Tps)^"MetaDt"),(US,Id)))] obsbindelem (FiveDOceanForecast'QA (1, {Id,Lb,Tp,Tp2,TpM,US,vl})) = [("Models","ResAccess","RunModel"),("ResAccess","PostProcess", "Transmit_Mdl_Output"),("PostProcess","ResAccess","QAQC Data"),("ResAccess","DesktopApp","QAQC "^DataLbxTpxValxTpMxServID.mkstr(("",Tp2,vl,Tp2^"MetaDt"),(US,Id))), ("ResAccess","Database","QAQC "^DataLbxTpxValxTpMxServID.mkstr(("",Tp2,vl,Tp2^"MetaDt"),(US,Id)))] obsbindelem (FiveDOceanForecast'Receive_Mdl (1, {ApRqs,Id,InRqs,Tps,US})) = [("Models","","ModelsReq "^AppxInputxServ.mkstr(if Tps<>[] then (Tps,InRqs,(US,Id)) else (ApRqs,InRqs,(US,Id))))] obsbindelem (FiveDOceanForecast'Sorting (1, {ApRqs,Id,Lb,Tp,TpM,Tps,US,vl})) = [("AnlsTool","ResAccess","Sorting "^DataLbxTpxValxTpMxServID.mkstr((Lb,hd Tps,vl,(hd Tps)^"MetaDt"),(US,Id))), ("AnlsTool","ResAccess","Sorting "^DataLbxTpxValxTpMxServID.mkstr((Lb, (List.nth(Tps,1)),vl,(List.nth(Tps,1))^"MetaDt"),(US,Id)))] obsbindelem (FiveDOceanForecast'Threshold_analysis (1, {ApRqs,Id,Lb,TH,Tp,TpM,Tps,US,vl})) = [("AnlsTool","DesktopApp","ThresholdAnaResult "^TypexServID.mkstr(if vl>=th then ("Ocean Alarm",(US,Id)) else ("",(US,Id))))] obsbindelem (FiveDOceanForecast'Transmit_Anc_Info (1, [("WebsitePortals","ResAccess","CollectAncInfo "),("ResAccess","PreProcess","Anc_Info Figure Specifications for Observation Function (cont.)
102 90 "^DataLbxTpxValxTpMxServID.mkstr((Lb,Tp,vl,TpM),(US,Id)))] {Id,Lb,Tp,TpM,US,vl})) = obsbindelem (FiveDOceanForecast'Update_to_New_Mdl (1, {Tps,Tps2})) = [("WebsitePortals","Models","Update_to_New_Md "^Types.mkstr(Tps))] obsbindelem _ = [] in obsbindelem bindelem end Figure Specifications for Observation Function (cont.) 4. Action function (see Figure 5.12). The action function processes the observed data according to the description above. fun action [] = () action ((process, "", msg)::rest) = (msc5dof.addinternalevent(process,msg); action rest) action ((snd,rcv,msg)::rest) = (msc5dof.addevent(snd,rcv,msg); action rest) Figure Specifications for Action Function 5. Stop Function (see Figure 5.13). The stop function could be used to add a line, which indicates the simulation has stopped.
103 91 fun stop (FiveDOceanForecast'PostProcess_1_mark : DataLbxTpxValxTpMxServID ms, FiveDOceanForecast'ResAccess1_1_mark : DataLbxTpxValxTpMxServID ms, FiveDOceanForecast'ResAccess2_1_mark : DataLbxTpxValxTpMxServID ms, FiveDOceanForecast'ResAccess3_1_mark : DataLbxTpxValxTpMxServID ms) =() Figure Specifications for Stop Function 5.3. SOME EXECUTION SPECIFIC CONCERNS The purpose of converting the SysML model into the CPN model is to execute the model. In order to facilitate the simulation, there are some execution-specific concerns that need to be addressed. The above mentioned animation graphical user interface, and the addition of UserInput page are examples. In many of the approaches used to address these concerns, some extra CPN constructs, which were not converted from the SysML model, were added to the CPN model. Some of the execution specific concerns considered in this thesis are summarized below: 1. Stop point. Although in the real world the modeled scenarios of GEOSS are continuously running, the simulation has to be stopped after the desired tasks are completed so that the analysis can be followed. This is achived by adding Breakpoint monitors in the CPN model. A Breakpoint monitor can stop simulations when certain conditions are fulfilled. Three kinds of breakpoint monitors are available in the CPN tools. They are Place contents monitors, Transition enabled monitors and Generic breakpoint monitors. The place contents monitors were used in the CPN model of this thesis. A Place Contents monitor will check the number of tokens on a place to determine if a simulation should be stopped. The simulation can be stopped either when the place is empty or when the place is not empty. To create a Place contents monitor, the user can apply the Create place contents monitor tool to the place to be monitored. The option under the Type index entry of the monitor will determine when the simulation should stop (see Figure 5.14).

104 92 Figure A Screenshot on the Place Contents Monitor Index For the convenience of monitoring places, some places and transitions were added to the original CPN model that could generate the end signals. For example, when each of the three scenarios (the Pre-operational use case and the Characterize Improvements are combined together) in this CPN model completes its assigned task(s), a token will be added to the corresponding place on the UserInput page that is designed to receive the end signal from that scenario. Only when all of these three places get their tokens, can it be concluded that the simulation is completed. The End Simulation transition on the UserInput page does this job since it needs tokens from the three places to fire. The fire of this transition will send a token to the place zsimendsig, which is the place being monitored. When this place is not empty the end condition is satisfied and the CPN Tool will stop the simulation. 2. Uniform data structure for information identification. The message exchanges between components of the system should be written in a format, structure and vocabulary that is understood by both parties. In addition, the message should be uniquely identifiable. For example, in this CPN model, some of the transitions may process data coming from different task (scenario) sources or different cycles of the same task. There must be a mechanism to discriminate this data. Therefore, a uniform data structure is applied in this model. All related data was post-fixed by the name of the source task and the number of cycles of that task, whereas a short descriptive notation was added to the front of a datum when it goes through a transition and is processed by the activity represented by that transition. This change signifies that the datum has been processed into a different form. For example, suppose a token takes the value of Data( Ocean Forecast 1), when it caused the fire of the transition Archive data,
105 93 the token value in the output place will be ArchivedData( Ocean Forecast 1). This event can be interpreted as the specific data from the five day ocean forecast scenario is archived. 3. Simulation monitor. In order to record some results of a simulation, a number of report places can be added. Such places gather historical information about the simulation without influencing the simulation. The place named ztemp in page FiveDOceanForecast of the CPN model is an example. It records what has been processed by the post-processing operation in the five day ocean forecast scenario. Such places are colored pink in the model of this thesis. 4. Model resource constraints. Many of the numerical models used in GEOSS need intense computational power, which often involves grid computing. Multiple tasks running concurrently on the net may compete for resources. This gives rise to the resource constraint problems. This CPN model tried to model a simple case of this concern. As can be seen in the Appendix B7, there is a fusion place named Computation resources, which was not connected to any transition in this page. However, it was connected to all SltCfgCmpRsc pages (represents Select and Configure Computational resources module) through fusion places. Fusion places are sets of places that anything happening to each place in the set also happens to all the other places in the set. The Computation resources fusion place mentioned above was typed by an enumerated color set with only one instance e. Every operation that involves computation needs to get computational resources ( e ) before it can proceed. Accordingly, the Resource Scheduling transition on every SltCfgCmpRsc page needs to get a token from this place so that a computing task can be performed. When the computing task is completed, a token can be placed back to this place. When there are more concurrently running computing tasks than the available tokens on the Computational resources place, the computing tasks that requests resources latter will be suspended until other computational resource(s) are released. 5. Other additional transitions and places. Some other transitions and places may also be added to the original CPN model for simulation control purposes. For example, Figure 5.15 shows a construct that was used to continually generate data which signify the sensor measures. This construct was created exclusively for generating signals that drive the execution of the system. There are also
106 94 some constructs added to achieve certain functions such as the Anti-places/limit places, Queues/stacks, and Inhibitor arcs [71]. Figure A Screenshot on a CPN Construct for Generating Tokens
107 95 6. SIMULATION 6.1. SET UP SIMULATION Since the CPN model was integrated with the BRITNEY suite, the simulation can be run directly from the BRITNeY Suite. BRITNeY should run on the same machine as the CPN Tools, otherwise additional Java functors need to be set up. Following are the steps to run the simulation: 1. Start BRITNeY Suite; 2. Load the CPN model (The BRITNeY needs to be run before the CPN tool is loaded); 3. Set the desired cycles to be run for each use case scenario by giving the proper initial markings to the zcycle place corresponding to the use case scenario on the UserInput page, with 0 representing no execution. Other position integers represent the number of cycles wanted; 4. Apply the Play tool of the BRITNeY Suite to the Simulator console window. After the CPN model is loaded, there will be a number of windows opened, each of which corresponds to a declaration of the MSC object in the CPN Tool. The name of the window is the same as that defined in the declaration. The objects specified in the initialization functions are shown in rounded rectangles on the top of the windows with no connections between the objects yet. Along with the execution of the simulation, message lines are drawn between interacting objects in a synchronic manner. This gives a way to observe the simulation in a real-time and intuitive way. In certain specified stages of the simulation, a dialog window will pop up; either a message window showing that the event associated with the fire of certain transitions happened or an input window that requires input from the user in order to direct the workflow. When such a window appears, click OK (for message window), or give proper input (for input window) to dismiss the window and let the simulation continue. Those use case scenarios can be executed individuality (in any number of cycles) or in any of their combinations (in terms of different scenarios and number of cycles for each scenario). This allows examining the correctness of the modeled system when it works under each single use scenario or under a multi-task parallel processing environment.
108 96 When executed in combination, the individual use case can communicate with each other so these uses cases are integrated in the model. If executed individually, the five day ocean forecast use case must run at least once before the pre-operational use case scenario can run since the latter needs the data produced by the former SIMULATION RESULTS Appendix C1 through C9 presents a set of MSCs generated based on a simulation. This simulation involved the execution of two cycles of the five day ocean forecast and one cycle of other use case scenarios. Since the ocean forecast is a repeated activity it was run twice. The message lines were added to the chart in a time sequence along the vertical direction. The information shown on a message line is the token value that was inputted to or outputted from a transition. The small solid square at the vertical line represents an internal event process. The MSCs clearly show the behavior that the system generated during a simulation. They allow close examination of the dynamic behavior since the behavior is captured and presented in a static view. The MSC can have a message line (or square) for each step. This means the MSC contains all the information in the simulation report. However, it is more common to only record a few key activities. This gives a condensed overview of the interest activities and thus makes it faster to interpret the simulation results and easier to observe whether the CPN model behaves as expected. This is why the Monitor Message Sequence Charts rather than other types were used in this thesis.
109 97 7. ARCHITECTURE EVALUATION AND ANALYSIS The tasks in this step include behavior and performance analysis, functionality verification and System configuration refinement. In [40], some guidelines for architecture evaluation using the CPN are presented. Since the CPN model is an executable model, the architecture evaluation can be done by both simulation and analysis. In using the simulation, the Message Sequence Chart (MSC) was used in this thesis and for the analysis, the state space report was used SIMULATION BASED ANALYSIS The simulation results can be used to help the analysis of the architecture in two aspects: 1) the behavior and functionality verification/validation, and 2) the specification completeness checking Behavior and Functionality Verification/Validation. The architecture model has established a standard or reference against which an executable model of the system s architecture can be compared. The methodology for behavior analysis and functionality verification/validation has been discussed in Section Here, an example is presented to illustrate how to compare the input SysML sequence diagrams in the architecture model and the output Message Sequence Charts (MSCs) after the simulation. The example presented involves the activity of collecting observation data. Appendix A25 shows the sequence diagram. Appendix C5 shows the corresponding MSC generated based on a simulation. The interacting objects are shown on the top of both charts. A close examination reveals that both graphs share the same objects however the MSC has more objects. The extra objects are beyond the boundary of the observation system so they are not shown in the sequence diagram. The bold solid line on the left of the sequence diagram represents the system boundary. The interaction of system to its environment is through this boundary. Since the purpose of the MSC is to show the interaction occurring during the simulation, there is little sense to discriminate the system boundary. The extra objects can be viewed as collectively forming part of the environment (boundary) of the observation system, and thus the two charts are consistent.
110 98 The verification of the behavior of the modeled system can be done by comparing the message lines in time sequences. From the comparison, it could be seen that the activity sequences, as reflected by the message lines, on both charts were exactly the same although the wording of the message may be a little different. As discussed earlier, the message lines in sequence diagrams can represent either message (item) exchanges or operation calls, while in a MSC, the message lines represent both. However, they are closely related to each other. Note that two operations, the create metadata and the event, change & pattern detection, in the sequence diagram are molded as a parallel activity. However, in a simulation, there must be one operation first and the other later since the fire of a transition takes no time. Therefore, the two operations are shown as sequence activities on the MSC but this did not conflict with the sequence diagram. After close examination and analysis, it can be concluded that the behavior as modeled matched the desired behavior in the case of collecting observations, and thus the observation system module can be verified and validated Specification Completeness Checking. The methodology for checking missing specifications has been discussed in Section An example of identifying missing requirements is shown here. As introduced in Section 5.3, a construct was added to the CPN model to simulate the resource constraints (the computational resources). The computation resources place was initially given six tokens. The simulation was running normally until the computational resources were gradually reduced to 1 when the five day ocean forecast scenario and the pre-operational scenario (including the associated Characterize Improvement scenario) stopped producing the desired outcome. A closer examination reveals that the problem was caused by a lack of synchronous mechanisms between data management and resource management. The run model operation of the five day ocean forecast use case was assigned the computational resources but could not complete the operation because it had not received the required input. The operation could not get the input because the input processing task could not get the computational resources (occupied by the run model task) and thus was unable to serve the data. This dilemma will prevent both use cases from producing further outcomes. This result suggests that, under the resource constraints, there must be a mechanism to solve the
111 99 synchronization of data and computational resource. Some possible solutions are: using the workflow management to synchronize data and computational resources; using the combination of workflow management, monitor and resource management to temporarily release the computational resources that are assigned but have not been used and reassign the resources when there are spare resources; letting the resource management allow itself to release the resource after a certain waiting time and reassign the resources after a certain delay; or many more other approaches. One of these functionalities must be specified in the requirements and be fulfilled by the model in later design cycles. However, modeling the detailed functions of these components was beyond the scope of this thesis so the model has not been modified and the executable model will be run with enough resources STATE SPACE ANALYSIS A State Space Report provides some key information about the behavior of the CPN. However, due to the complexity of this CPN model and the limitation of processing power and memory restrictions of the platform, a full state space report can not be generated. The state space report shown in this thesis is a partially generated report, which was obtained by setting the time criteria to stop calculating state space at 10 hours. The state space report has four parts. The first part of the state space report is shown in Figure 7.1. It contains the statistical information about the size of the state space. The state space has nodes and arcs. The information of the SCC-graph (Strongly Connected Components) [29] also shows that there are strongly connected components and arcs that start in one component and end in another. A strongly connected component is a maximal sub-graph in which it is possible to find a path from any node to another. The strongly connected components are less than the state space nodes in Figure 7.1. It means there are infinite occurrence sequences. As discussed earlier, in order to simulate the sensor collection, which is continually sending observations, a construct is used that keeps the Collect Sensor Obs transition continually firing and thus continuously generating tokens that represent sensor readings. There are also other similar transitions in the CPN model. Such transitions will cause infinite occurrences. This is the reason a stop point monitor was applied as discussed in Section 5.3.
112 100 Statistics State Space Nodes: Arcs: Secs: Status: Partial Scc Graph Nodes: Arcs: Secs: 56 Figure 7.1. State Space Report-Part 1 A partial section of the second part of the state space report is shown in Figure 7.2. The upper part shows the upper and lower integer bounds, which is the maximal and minimal number of tokens which the individual places may have. The middle and lower part show multi-set bounds. The upper multi-set bound of a place is the smallest multi-set which is larger than all reachable markings of the place. The lower multi-set bound is the largest multi-set which is smaller than all reachable markings of the place. Boundedness Properties Best Integer Bounds Upper Lower CollectAncillaryInfo'ArchiveMgt CollectAncillaryInfo'Catalog CollectAncillaryInfo'Catalog CollectObs'ObsSys CollectObs'PreProcess CollectObs'PreProcess Figure 7.2. State Space Report-Part 2
113 101 Best Upper Multi-set Bounds CollectAncillaryInfo'ArchiveMgt 1 1`([],("",0))++ 1`(["Bathymetric data-","climatological data-","historical sensor data-","ocean Forecast Product-"],("Ocean Forecast",1)) CollectAncillaryInfo'ArchiveMgt 2 1`([],("",0))++ 1`("Look for-","historical sensor data-",("ocean Forecast",1))++ 1`("Look for-","ocean Forecast Product-",("Ocean Forecast",1))++ 1`("Look for-","climatological data-",("ocean Forecast",1)) CollectAncillaryInfo'Catalog1 1 1`[] CollectAncillaryInfo'Catalog1 2 1`[]. Best Lower Multi-set Bounds CollectAncillaryInfo'ArchiveMgt 1 empty CollectAncillaryInfo'Catalog 1 empty CollectAncillaryInfo'Database1 1 empty CollectAncillaryInfo'WebsitePortals2 2 empty Computation'Computation_Resources2 1. Figure 7.2. State Space Report-Part 2 (cont.) The third part of the state space report is shown in Figure 7.3. This part provides information about home and liveness. A home marking is a marking which is reachable from all reachable markings, i.e., a marking which can always be reached irrespective of what has happened up to now. A dead marking is a marking with no enabled transitions. A dead transition is a transition that has not been enabled in a reachable marking. When there are dead markings there can not be any live transitions. Since the model contains transitions that infinitely generate tokens which will drive the system state to be continuously changing, the initial marking can not be home marking. Since this is a partially generated state space report, information about the dead marking and dead transition is not correct. For example, Figure 7.3 shows the Archive_Data transition on
114 102 page ArchiveData as a dead transition but after the execution of the CPN model, there are many tokens generated on the output places of this transition. It indicates that this transition must have been enabled many times and thus is not a dead transition. The fourth part of the state space report is shown in Figure 7.4. This part provides information about the fairness properties, i.e. how often the individual transitions occur. Home Properties Home Markings Initial Marking is not a home marking Liveness Properties Dead Markings [99999,99998,99997,99996,99995,...] Dead Transition Instances ArchiveData'Archive_Data 1 ArchiveData'Archive_Management 1 ArchiveData'Data_Transport 1. Figure 7.3. State Space Report-Part 3 Live Transition Instances None Fairness Properties ArchiveData'Receive_Data 1 Fair ArchiveData'Register_in_Catalog 1 Fair CollectAncillaryInfo'Accept_Task 1 No Fairness CollectAncillaryInfo'Access_Dt 1 Fair. Figure 7.4. State Space Report-Part 4
115 SYSTEM REFINEMENTS The proposed system was incrementally developed based on four use case scenarios. For each of them, there was an iterative process of architecture model development, simulation, and verification/validation. The former developed models were then used as a starting point when incorporating new use case scenarios. The modification of the system architecture occurred at both the process of developing executable models and the process of simulating the executable models thus built. In order to effectively modify the system architecture, the modification should follow some structured rules or methods. The methods presented in [42] give some insight into this modification. It should also be mentioned that the use of ARTiSAN studio greatly facilitated this modification and the incremental development process since any change to the model element is automatically propagated across all diagrams and textual descriptions, ensuring architectural consistency and completeness. As an example, the Configuration & Execution layer in the model developed for this thesis did not have a Workflow management component in the first version of the architecture design. During the simulation, it was found that the computation operation could not perform batch processing or assimilate multiple inputs, which are desired features. Upon closer examination, it was revealed that this resulted from the lack of a mechanism that coordinates batch tasks and multiple inputs. Therefore, a Workflow management component was defined and added to the architecture to address this problem.
116 CONCLUSIONS AND FUTURE WORK 8.1. CONCLUSIONS This research proposed an executable system architecting framework based on SysML-CPN transformation. Its feasibility and advantages have been demonstrated using an information system. This methodology should be able to generalize and be applied to a broad range of discrete-event driven, concurrent system designs, which may involve hardware, software, data, personnel, procedures and facilities. The contribution of this research is having developed a set of methodologies to help to achieve this framework. A formal procedure has been developed to convert a SysML model into a CPN model. The conversion is based on SysML sequence diagrams and also needs information from other SysML diagrams. A well-defined mapping between various SysML artifacts and CPN elements has been established. Concordances between various SysML artifacts are suggested. This procedure proved to be successful by the model developed in this thesis. Translating SysML-based specifications into CPNs is not difficult and permits the formal verification of SysML-based designs. A CPN model is developed according to the above procedure. This CPN model is capable of demonstrating the behavior of a distributed, multi-task, concurrent-processing system. Several use case scenarios have been employed to test this model. These use case scenarios can be executed individually or in any of their combinations. This allows for the examination of the correctness of the modeled system when it works under each single use case scenario or under a multi-task parallel processing environment. When executed in combination, the individual use case scenario can communicate with each other so these uses case are integrated in the model. It was demonstrated that the simulation based analysis can be used to verify and validate the behavior and functionality of the system to be built. The architecture of the system can be modified based on the simulation results. The executable model can also reveal the missing specification, and missing requirements in the architecture model, and thus provides a basis for system design refinement. The simulation is augmented by incorporating Graphic User Interface (GUI) animation tools. Interactive control during execution enables dynamic decisions to be
117 105 simulated, better representing the real-world scenarios. Real-time graphic feedback greatly facilitates the monitor of model execution. The Message Sequence Chart (MSC) provides an effective way to analyze and verify the model being built. This research has also demonstrated the use of SysML to model network centric systems. In order to address the challenges of such systems, including the management of distributed resources, the coordination among multi tasks, the integration of multi-platforms and diversified user interfaces, the continuous evolving of system components, and etc., the Model Driven Architecture (MDA) approach is advocated. This research shows that the MDA approach is ideal for addressing the above challenges. MDA designs portability, interoperability and extensibility into the system at the model level. A Model developed in this way is resilient to change and can support system evolvement very well. A SysML based process for developing architecture representation following the MDA paradigm is developed. This process demonstrates the feasibility of developing architecture descriptions based on the MDA paradigm in the systems engineering context. The process is illustrated on a specific example of an information system. It is reasonable to believe that this process can be generalized. In this process, SysML demonstrates advantages over UML in requirement management and behavior modeling. Finally, the process of modeling, simulating and performing analysis gives a dramatically improved understanding of the modeled system FUTURE WORK In this thesis, the modeling activities emphasize the functional aspect of the system. The SysML demonstrates its capability in this respect. There are some systems that the nonfunctional performances are so important that they must be modeled, tested and verified. However, some of the nonfunctional performances may be emergent behavior, which poses great challenges on both modeling and simulation. The simulation of such systems is more important for the purpose of verifying the nonfunctional performances. Therefore, the next step in this research can be adding the nonfunctional concerns to the system modeling and simulation tasks. The nonfunctional concerns can be time constraint, resource constraint, optimization under time/resource constraint or other criteria, dynamic
118 106 scheduling or scheduling under uncertainty, and system security concerns. These nonfunctional concerns are often coupled together. For example, under the resource constraints, multiple tasks may compete for resources. This can give rise to a couple of other concerns, such as task scheduling and priority of tasks. In the meantime, subjected to the availability of resources, the time needed for processing a task would be affected (to model this effect, a timed CPN must be employed). In addition, nonfunctional requirements can also impose constraints on the functional behavior. For example, security requirements in GEOSS increase substantially with sharing of physical resources for storage or computing, especially when the resources are distributed across multiple institutions. Introducing the security requirements into the system development may require the system to have components that carry out the registration, subscription, authorization and authentication services. In the meantime, the access ability of data and computational resources would need to be controlled and prioritized. In order to simulate the nonfunctional performance, some mathematic methods or computation intelligence tools might be integrated into the executable model, e.g. to solve the dynamic scheduling in stochastic environment. In this thesis, only one type of system architecture has been developed and subsequently validated. In the next step, several different designs can be developed and analyzed so that the best design alternative can be chosen based on simulations. It also can be tried to model other systems. The GEOSS is driven by single input, the observations, and multiple service (output) requests, the end-user applications within the identified social-economy benefit areas. The interaction between system components involves mainly information exchanges. For such systems, few unexpected things can happen in the simulation. In order to fully benefit from the model-based simulation, a system that has multiple inputs and multiple rules governing the cooperation of the system components is recommended. A good candidate is the Intelligent Transportation System (ITS). Unlike GEOSS, ITS is driven by multiple inputs, e.g. traffic in city street, road conditions on the high way, free parking spaces, and etc. The system can be divided into several distinct yet highly interconnected sub-systems according to the functions they perform, e.g. traffic management systems, commercial vehicle management system, traveler information system, and etc. The proper function of each sub-system relies on
119 107 intensive information communication between theses sub-systems. The services (i.e. the outputs of the system) that ITS provides and their qualities depend heavily on some pre-specified rules that govern the cooperation between the different components of the systems. The rules, in this context, have at least two aspects: the information exchanges and service request/response between interacting components. For GEOSS, in order to reveal something that can be called collaboration rules, the system has to be decomposed into low levels of abstraction which will dramatically increases the complexity of the system. The configuration and execution management layer modeled in this thesis does contain some collaboration rules but has not been specified in detail yet due to the complexity of the entire model. The development of MDA has shown evidence that a paradigm shift is occurring in the area of information system construction, i.e., from object and component technology to model technology. MDA designs also shows significance in other areas such as business process modeling. Therefore, it is necessary to further explore the MDA application in system engineering as well. In the next step, the model-based simulation can also be enhanced. For example, to develop a federation of simulations that represent different aspects of a system, e.g. business processes, communications networks, operational environment and performance measurements (amounts, costs, times, capacities, scheduling, and etc.). This may require new executable modeling tools. In order to more effectively modify the system architecture based on simulations, the modification should follow some structured rules or methods, which deserves further research.
120 108 APPENDIX A SYSML SPECIFICATIONS FOR GEOSS
121 109 INDEX APPENDIX A1: Requirements Diagram GEOSS Functional Requirements APPENDIX A2: Requirements Diagram GEOSS Nonfunctional Requirements APPENDIX A3: Use Case Diagram-GEOSS[ Top-level Use Case] APPENDIX A4: Use Case Diagram-GEOSS[ High-level Operational Use Case] APPENDIX A5: Use Case Diagram-GEOSS[ Mid-level Use Case] APPENDIX A6: Use Case Diagram-UC-GEOSS[Lower-level Use Case].MDI APPENDIX A7: Block Definition Diagram GEOSS Structure [Domain Breakdown] APPENDIX A8: Block Definition Diagram GEOSS Structure APPENDIX A9: Block Definition Diagram GEOSS Structure[UserInterface] APPENDIX A10: Block Definition Diagram GEOSS Structure[Application&Tools] APPENDIX A11: Block Definition Diagram GEOSSStructure[Configuration&ExecutionManagement APPENDIX A12: Block Definition Diagram GEOSS Structure[ResourceAccess] APPENDIX A13: Block Definition Diagram GEOSS Structure[Resources] APPENDIX A14: Block Definition Diagram GEOSS Structure[CommonServices] APPENDIX A15: Internal Block Diagram GEOSS High Level Operation APPENDIX A16: Block Definition Diagram GEOSS Interface Definitions APPENDIX A17: Internal Block Diagram GEOSS Infrastructure APPENDIX A18: Block Definition Diagram GEOSSInfrasture[InterfaceDefinitions] APPENDIX A19: Block Definition Diagram GEOSSFlowSpections APPENDIX A20: Sequence Diagram Five Day Ocean Forecast[Object Interaction] APPENDIX A21: Sequence Diagram Emergency Management[Object Interaction] APPENDIX A22: Sequence Diagram Forecast Improvement[Object Interaction] APPENDIX A23: Sequence Diagram Archive Data APPENDIX A24: Sequence Diagram Collect Ancillary Information APPENDIX A25: Sequence Diagram Collect Observation Data APPENDIX A26: Sequence Diagram Computation APPENDIX A27: Sequence Diagram Data Discovery & Access APPENDIX A28: Sequence Diagram Prepare Model Inputs
122 110 APPENDIX A29: Sequence Diagram Run Operational Model APPENDIX A30: Sequence Diagram Select & Config Compution Resources APPENDIX A31: Activity Diagram GEOSS[Serial Behavior Prototype] APPENDIX A32: Activity Diagram GEOSS[Continous Parallel Activities] APPENDIX A33: Activity Diagram Archive Data APPENDIX A34: Activity Diagram Collect Ancillary Information APPENDIX A35: Activity Diagram Collect Observation Data APPENDIX A36: Activity Diagram Computation APPENDIX A37: Activity Diagram Data Discovery & Access APPENDIX A38: Activity Diagram Prepare Model Inputs APPENDIX A39: Activity Diagram Run Operational Model APPENDIX A40: Activity Diagram Select & Config Compution Resources


123 111 APPENDIX A1: Requirements Diagram GEOSS Functional Requirements
124 112 APPENDIX A2: Requirements Diagram GEOSS Nonfunctional Requirements


125 113 APPENDIX A3: Use Case Diagram-GEOSS[ Top-level Use Case]


126 114 APPENDIX A4: Use Case Diagram-GEOSS[ High-level Operational Use Case]


127 115 APPENDIX A5: Use Case Diagram-GEOSS[ Mid-level Use Case]


128 116 APPENDIX A6: Use Case Diagram-UC-GEOSS[Lower-level Use Case].MDI
129 117 APPENDIX A7: Block Definition Diagram GEOSS Structure [Domain Breakdown]


130 118 APPENDIX A8: Block Definition Diagram GEOSS Structure

131 119 APPENDIX A9: Block Definition Diagram GEOSS Structure[UserInterface]


132 120 APPENDIX A10: Block Definition Diagram GEOSS Structure[Application&Tools]


133 121 APPENDIX A11: Block Definition Diagram GEOSS Structure[Configuration&ExecutionManagement


134 122 APPENDIX A12: Block Definition Diagram GEOSS Structure[ResourceAccess]

135 123 APPENDIX A13: Block Definition Diagram GEOSS Structure[Resources]


136 124 APPENDIX A14: Block Definition Diagram GEOSS Structure[CommonServices]


137 125 APPENDIX A15: Internal Block Diagram GEOSS High Level Operation


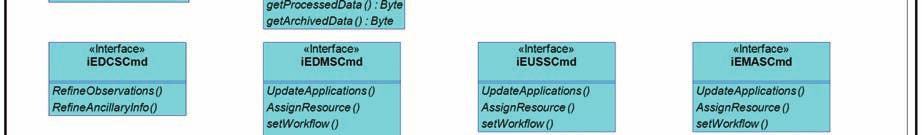

138 126 APPENDIX A16: Block Definition Diagram GEOSS Interface Definitions


139 127 APPENDIX A17: Internal Block Diagram GEOSS Infrastructure

140 128 APPENDIX A18: Block Definition Diagram GEOSSInfrasture[InterfaceDefinitions]
141 129 APPENDIX A19: Block Definition Diagram GEOSSFlowSpections

142 130 APPENDIX A20: Sequence Diagram Five Day Ocean Forecast[Object Interaction]
143 131 APPENDIX A21: Sequence Diagram Emergency Management[Object Interaction]
144 132 APPENDIX A22: Sequence Diagram Forecast Improvement[Object Interaction]
145 133 APPENDIX A23: Sequence Diagram Archive Data
146 134 APPENDIX A24: Sequence Diagram Collect Ancillary Information
147 135 APPENDIX A25: Sequence Diagram Collect Observation Data
148 136 APPENDIX A26: Sequence Diagram Computation
149 137 APPENDIX A27: Sequence Diagram Data Discovery & Access
150 138 APPENDIX A28: Sequence Diagram Prepare Model Inputs
151 139 APPENDIX A29: Sequence Diagram Run Operational Model
152 140 APPENDIX A30: Sequence Diagram Select & Config Compution Resources
153 141 APPENDIX A31: Activity Diagram GEOSS[Serial Behavior Prototype]
154 142 APPENDIX A32: Activity Diagram GEOSS[Continous Parallel Activities]


155 143 APPENDIX A33: Activity Diagram Archive Data


156 144 APPENDIX A34: Activity Diagram Collect Ancillary Information


157 145 APPENDIX A35: Activity Diagram Collect Observation Data


158 146 APPENDIX A36: Activity Diagram Computation

159 147 APPENDIX A37: Activity Diagram Data Discovery & Access


160 148 APPENDIX A38: Activity Diagram Prepare Model Inputs


161 149 APPENDIX A39: Activity Diagram Run Operational Model


162 150 APPENDIX A40: Activity Diagram Select & Config Compution Resources
163 151 APPENDIX B CPN MODEL FOR GEOSS
164 152 INDEX CPN PAGE NAME DESCRIPTION APPENDIX B1 UserInput Simulation setup APPENDIX B2 FiveDOceanForecast Five Day Ocean Forecast Use Case APPENDIX B3 EmergencyMgt Emergency Management Use Case APPENDIX B4 ModelUpdate Five-Day Ocean Forecast Pre-Operational Use Case APPENDIX B5 Improvement Characterize Improvements Use Case APPENDIX B6 ExternalControl External Control Port APPENDIX B7 Resources Resource Module APPENDIX B8 ArchiveData Data Archive Management Module APPENDIX B9 CollectObs Collect Observations Data Module APPENDIX B10 CollectAncillaryInfo Collect Ancillary Information Module APPENDIX B11 Prepare Md In Model Input Pre-processing Module APPENDIX B12 Computation Computation APPENDIX B13 Workflow Mgt Workflow Management Module APPENDIX B14 SltCfgCmpRsc Select and Configure Computing Resource Module APPENDIX B15 DataDiscvAccess Data Discovery and Access Module APPENDIX B Declarations
165 153 APPENDIX B1 CPN PAGE NAME: UserInput - DESCRIPTION: Simulation setup


166 154 APPENDIX B2 CPN PAGE NAME: FiveDOceanForecast - DESCRIPTION: Five Day Ocean Forecast Use Case

167 155 APPENDIX B3 CPN PAGE NAME: EmergencyMgt - DESCRIPTION: Emergency Management Use Case

168 156 APPENDIX B4 CPN PAGE NAME: ModelUpdate - DESCRIPTION: Five-Day Ocean Forecast Pre-Operational Use Case
SysML, It s Coming Are You Prepared?
 SysML, It s Coming Are You Prepared? Presentation for George Mason University Shana L. Lloyd The Aerospace Corporation 703-324-8877 Shana.l.lloyd@aero.org January 31, 07 1 Outline Introduction SysML Background
Modelling in Enterprise Architecture. MSc Business Information Systems
 Modelling in Enterprise Architecture MSc Business Information Systems Models and Modelling Modelling Describing and Representing all relevant aspects of a domain in a defined language. Result of modelling
Executive Summary. Round Trip Engineering of Space Systems. Change Log. Executive Summary. Visas
 Reference: egos-stu-rts-rp-1002 Page 1/7 Authors: Andrey Sadovykh (SOFTEAM) Contributors: Tom Ritter, Andreas Hoffmann, Jürgen Großmann (FHG), Alexander Vankov, Oleg Estekhin (GTI6) Visas Surname - Name
Vocabulary-Driven Enterprise Architecture Development Guidelines for DoDAF AV-2: Design and Development of the Integrated Dictionary
 Vocabulary-Driven Enterprise Architecture Development Guidelines for DoDAF AV-2: Design and Development of the Integrated Dictionary December 17, 2009 Version History Version Publication Date Author Description
Integration With the Business Modeler
 Decision Framework, J. Duggan Research Note 11 September 2003 Evaluating OOA&D Functionality Criteria Looking at nine criteria will help you evaluate the functionality of object-oriented analysis and design
Integrating TOGAF, Zachman and DoDAF Into A Common Process
 Integrating TOGAF, Zachman and DoDAF Into A Common Process Rolf Siegers Senior Principal Software Systems Engineer The Open Group Architecture Practitioner s Conference October 2003 Customer Success Is
Computation Independent Model (CIM): Platform Independent Model (PIM): Platform Specific Model (PSM): Implementation Specific Model (ISM):
: Platform Independent Model (PIM): Platform Specific Model (PSM): Implementation Specific Model (ISM):") viii Preface The software industry has evolved to tackle new approaches aligned with the Internet, object-orientation, distributed components and new platforms. However, the majority of the large information
viii Preface The software industry has evolved to tackle new approaches aligned with the Internet, object-orientation, distributed components and new platforms. However, the majority of the large information
10 Steps to Building an Architecture for Space Surveillance Projects. Eric A. Barnhart, M.S.
 10 Steps to Building an Architecture for Space Surveillance Projects Eric A. Barnhart, M.S. Eric.Barnhart@harris.com Howard D. Gans, Ph.D. Howard.Gans@harris.com Harris Corporation, Space and Intelligence
Minsoo Ryu. College of Information and Communications Hanyang University.
 Software Reuse and Component-Based Software Engineering Minsoo Ryu College of Information and Communications Hanyang University msryu@hanyang.ac.kr Software Reuse Contents Components CBSE (Component-Based
ASSURING DATA INTEROPERABILITY THROUGH THE USE OF FORMAL MODELS OF VISA PAYMENT MESSAGES (Category: Practice-Oriented Paper)
") ASSURING DATA INTEROPERABILITY THROUGH THE USE OF FORMAL MODELS OF VISA PAYMENT MESSAGES (Category: Practice-Oriented Paper) Joseph Bugajski Visa International JBugajsk@visa.com Philippe De Smedt Visa
ASSURING DATA INTEROPERABILITY THROUGH THE USE OF FORMAL MODELS OF VISA PAYMENT MESSAGES (Category: Practice-Oriented Paper) Joseph Bugajski Visa International JBugajsk@visa.com Philippe De Smedt Visa
SCOS-2000 Technical Note
 SCOS-2000 Technical Note MDA Study Prototyping Technical Note Document Reference: Document Status: Issue 1.0 Prepared By: Eugenio Zanatta MDA Study Prototyping Page: 2 Action Name Date Signature Prepared
UPDM 2 PLUGIN. version user guide
 UPDM 2 PLUGIN version 17.0.1 user guide No Magic, Inc. 2011 All material contained herein is considered proprietary information owned by No Magic, Inc. and is not to be shared, copied, or reproduced by
CHAPTER 1. Topic: UML Overview. CHAPTER 1: Topic 1. Topic: UML Overview
 CHAPTER 1 Topic: UML Overview After studying this Chapter, students should be able to: Describe the goals of UML. Analyze the History of UML. Evaluate the use of UML in an area of interest. CHAPTER 1:
cameo Enterprise Architecture UPDM / DoDAF / MODAF / SysML / BPMN / SoaML USER GUIDE version 17.0
 cameo Enterprise Architecture UPDM / DoDAF / MODAF / SysML / BPMN / SoaML USER GUIDE version 17.0 No Magic, Inc. 2010 All material contained herein is considered proprietary information owned by No Magic,
Enabling Component-Based Model Transformations with QVT. Li Dan
 Enabling Component-Based Model Transformations with QVT by Li Dan Doctor of Philosophy in Software Engineering 2013 Faculty of Science and Technology University of Macau Enabling Component-Based Model
UPDM PLUGIN. version user guide
 UPDM PLUGIN version 17.0 user guide No Magic, Inc. 2011 All material contained herein is considered proprietary information owned by No Magic, Inc. and is not to be shared, copied, or reproduced by any
Systems Analysis and Design in a Changing World, Fourth Edition
 Systems Analysis and Design in a Changing World, Fourth Edition Systems Analysis and Design in a Changing World, 4th Edition Learning Objectives Explain the purpose and various phases of the systems development
QoS-aware model-driven SOA using SoaML
 QoS-aware model-driven SOA using SoaML Niels Schot A thesis submitted for the degree of MSc Computer Science University of Twente EEMCS - TRESE: Software Engineering Group Examination committee: Luís Ferreira
Software Architectures
 Software Architectures Richard N. Taylor Information and Computer Science University of California, Irvine Irvine, California 92697-3425 taylor@ics.uci.edu http://www.ics.uci.edu/~taylor +1-949-824-6429
Software Architecture
 Software Architecture Does software architecture global design?, architect designer? Overview What is it, why bother? Architecture Design Viewpoints and view models Architectural styles Architecture asssessment
3rd Lecture Languages for information modeling
 3rd Lecture Languages for information modeling Agenda Languages for information modeling UML UML basic concepts Modeling by UML diagrams CASE tools: concepts, features and objectives CASE toolset architecture
Integrity 10. Curriculum Guide
 Integrity 10 Curriculum Guide Live Classroom Curriculum Guide Integrity 10 Workflows and Documents Administration Training Integrity 10 SCM Administration Training Integrity 10 SCM Basic User Training
The requirements engineering process
 3 rd Stage Lecture time: 8:30-12:30 AM Instructor: Ali Kadhum AL-Quraby Lecture No. : 5 Subject: Software Engineering Class room no.: Department of computer science Process activities The four basic process
Introduction. Chapter 1. What Is Visual Modeling? The Triangle for Success. The Role of Notation. History of the UML. The Role of Process
 Quatrani_Ch.01.fm Page 1 Friday, October 27, 2000 9:02 AM Chapter 1 Introduction What Is Visual Modeling? The Triangle for Success The Role of Notation History of the UML The Role of Process What Is Iterative
INTRODUCING A MULTIVIEW SOFTWARE ARCHITECTURE PROCESS BY EXAMPLE Ahmad K heir 1, Hala Naja 1 and Mourad Oussalah 2
 INTRODUCING A MULTIVIEW SOFTWARE ARCHITECTURE PROCESS BY EXAMPLE Ahmad K heir 1, Hala Naja 1 and Mourad Oussalah 2 1 Faculty of Sciences, Lebanese University 2 LINA Laboratory, University of Nantes ABSTRACT:
Lecture 1. Chapter 6 Architectural design
 Chapter 6 Architectural Design Lecture 1 1 Topics covered Architectural design decisions Architectural views Architectural patterns Application architectures 2 Software architecture The design process
Unified Modeling Language (UML)
") Unified Modeling Language (UML) Troy Mockenhaupt Chi-Hang ( Alex) Lin Pejman ( PJ ) Yedidsion Overview Definition History Behavior Diagrams Interaction Diagrams Structural Diagrams Tools Effect on Software
Unified Modeling Language (UML) Troy Mockenhaupt Chi-Hang ( Alex) Lin Pejman ( PJ ) Yedidsion Overview Definition History Behavior Diagrams Interaction Diagrams Structural Diagrams Tools Effect on Software
(Team Name) (Project Title) Software Design Document. Student Name (s):
 (Project Title) Software Design Document. Student Name (s):") (Team Name) (Project Title) Software Design Document Student Name (s): TABLE OF CONTENTS 1. INTRODUCTION 2 1.1Purpose 2 1.2Scope 2 1.3Overview 2 1.4Reference Material 2 1.5Definitions and Acronyms 2 2.
(Team Name) (Project Title) Software Design Document Student Name (s): TABLE OF CONTENTS 1. INTRODUCTION 2 1.1Purpose 2 1.2Scope 2 1.3Overview 2 1.4Reference Material 2 1.5Definitions and Acronyms 2 2.
Topic 01. Software Engineering, Web Engineering, agile methodologies.
 Topic 01 Software Engineering, Web Engineering, agile methodologies. 1 What is Software Engineering? 2 1 Classic Software Engineering The IEEE definition: Software Engineering is the application of a disciplined,
Raising the Level of Development: Models, Architectures, Programs
 IBM Software Group Raising the Level of Development: Models, Architectures, Programs Dr. James Rumbaugh IBM Distinguished Engineer Why Is Software Difficult? Business domain and computer have different
Software Design Document (SDD) Template (summarized from IEEE STD 1016)
 Template (summarized from IEEE STD 1016)") Software Design Document (SDD) Template (summarized from IEEE STD 1016) Software design is a process by which the software requirements are translated into a representation of software components, interfaces,
Software Design Document (SDD) Template (summarized from IEEE STD 1016) Software design is a process by which the software requirements are translated into a representation of software components, interfaces,
COMPUTATIONAL CHALLENGES IN HIGH-RESOLUTION CRYO-ELECTRON MICROSCOPY. Thesis by. Peter Anthony Leong. In Partial Fulfillment of the Requirements
 COMPUTATIONAL CHALLENGES IN HIGH-RESOLUTION CRYO-ELECTRON MICROSCOPY Thesis by Peter Anthony Leong In Partial Fulfillment of the Requirements for the Degree of Doctor of Philosophy California Institute
AUTOMATED BEHAVIOUR REFINEMENT USING INTERACTION PATTERNS
 MASTER THESIS AUTOMATED BEHAVIOUR REFINEMENT USING INTERACTION PATTERNS C.J.H. Weeïnk FACULTY OF ELECTRICAL ENGINEERING, MATHEMATICS AND COMPUTER SCIENCE SOFTWARE ENGINEERING EXAMINATION COMMITTEE dr.
Raytheon Mission Architecture Program (RayMAP) Topic 1: C2 Concepts, Theory, and Policy Paper #40
 Topic 1: C2 Concepts, Theory, and Policy Paper #40") Raytheon Mission Architecture Program (RayMAP) Topic 1: C2 Concepts, Theory, and Policy Paper #40 Dale Anglin Erik Baumgarten John Dinh Mark Hall Bert Schneider May 13, 2008 Cleared for public release
Raytheon Mission Architecture Program (RayMAP) Topic 1: C2 Concepts, Theory, and Policy Paper #40 Dale Anglin Erik Baumgarten John Dinh Mark Hall Bert Schneider May 13, 2008 Cleared for public release
SRI VENKATESWARA COLLEGE OF ENGINERRING AND TECHNOLOGY THIRUPACHUR,THIRUVALLUR UNIT I OOAD PART A
 SRI VENKATESWARA COLLEGE OF ENGINERRING AND TECHNOLOGY THIRUPACHUR,THIRUVALLUR UNIT I OOAD PART A 1. What is an object? An object is a combination of data and logic; the representation of some realworld
DoD Architecture Framework Version 2.0
 wreath stars Text DoD Architecture Framework Version 2.0 Volume 3: DoDAF Meta-model Physical Exchange Specification Developer s Guide 18 May 2009 This page left intentionally blank TABLE OF CONTENTS SECTION
1 Executive Overview The Benefits and Objectives of BPDM
 1 Executive Overview The Benefits and Objectives of BPDM This is an excerpt from the Final Submission BPDM document posted to OMG members on November 13 th 2006. The full version of the specification will
SWE 760 Lecture 1: Introduction to Analysis & Design of Real-Time Embedded Systems
 SWE 760 Lecture 1: Introduction to Analysis & Design of Real-Time Embedded Systems Hassan Gomaa References: H. Gomaa, Chapters 1, 2, 3 - Real-Time Software Design for Embedded Systems, Cambridge University
A number of optimizations are already in use by the majority of companies in industry, notably:
 1 Abstract Mechatronics products contain significant amounts of software. Most advances in embedded software development focus on specific phases of the development process. However, very little emphasis
Chapter 6 Architectural Design. Chapter 6 Architectural design
 Chapter 6 Architectural Design 1 Topics covered Architectural design decisions Architectural views Architectural patterns Application architectures 2 Software architecture The design process for identifying
A Comparison of the Booch Method and Shlaer-Mellor OOA/RD
 A Comparison of the Booch Method and Shlaer-Mellor OOA/RD Stephen J. Mellor Project Technology, Inc. 7400 N. Oracle Rd., Suite 365 Tucson Arizona 85704 520 544-2881 http://www.projtech.com 2 May 1993 The
Applying User Centered Design in the Development of Systems without User Interfaces
 Applying User Centered Design in the Development of Systems without User Interfaces National Defense Industrial Association 14 th Annual Systems Engineering Conference October 27, 2011 Dr. W. David Reese,
Chapter 6 Architectural Design
 Chapter 6 Architectural Design Chapter 6 Architectural Design Slide 1 Topics covered The WHAT and WHY of architectural design Architectural design decisions Architectural views/perspectives Architectural
Semantics-Based Integration of Embedded Systems Models
 Semantics-Based Integration of Embedded Systems Models Project András Balogh, OptixWare Research & Development Ltd. n 100021 Outline Embedded systems overview Overview of the GENESYS-INDEXYS approach Current
Chapter 6 Architectural Design. Lecture 1. Chapter 6 Architectural design
 Chapter 6 Architectural Design Lecture 1 1 Topics covered ² Architectural design decisions ² Architectural views ² Architectural patterns ² Application architectures 2 Software architecture ² The design
Software Reuse and Component-Based Software Engineering
 Software Reuse and Component-Based Software Engineering Minsoo Ryu Hanyang University msryu@hanyang.ac.kr Contents Software Reuse Components CBSE (Component-Based Software Engineering) Domain Engineering
for TOGAF Practitioners Hands-on training to deliver an Architecture Project using the TOGAF Architecture Development Method
 Course Syllabus for 3 days Expert led Enterprise Architect hands-on training "An Architect, in the subtlest application of the word, describes one able to engage and arrange all elements of an environment
Architectural Blueprint
 IMPORTANT NOTICE TO STUDENTS These slides are NOT to be used as a replacement for student notes. These slides are sometimes vague and incomplete on purpose to spark a class discussion Architectural Blueprint
Architectural Design
 Architectural Design Topics i. Architectural design decisions ii. Architectural views iii. Architectural patterns iv. Application architectures Chapter 6 Architectural design 2 PART 1 ARCHITECTURAL DESIGN
Introducing MESSIA: A Methodology of Developing Software Architectures Supporting Implementation Independence
 Introducing MESSIA: A Methodology of Developing Software Architectures Supporting Implementation Independence Ratko Orlandic Department of Computer Science and Applied Math Illinois Institute of Technology
History of object-oriented approaches
 Prof. Dr. Nizamettin AYDIN naydin@yildiz.edu.tr http://www.yildiz.edu.tr/~naydin Object-Oriented Oriented Systems Analysis and Design with the UML Objectives: Understand the basic characteristics of object-oriented
CONCENTRATIONS: HIGH-PERFORMANCE COMPUTING & BIOINFORMATICS CYBER-SECURITY & NETWORKING
 MAJOR: DEGREE: COMPUTER SCIENCE MASTER OF SCIENCE (M.S.) CONCENTRATIONS: HIGH-PERFORMANCE COMPUTING & BIOINFORMATICS CYBER-SECURITY & NETWORKING The Department of Computer Science offers a Master of Science
Model driven Engineering & Model driven Architecture
 Model driven Engineering & Model driven Architecture Prof. Dr. Mark van den Brand Software Engineering and Technology Faculteit Wiskunde en Informatica Technische Universiteit Eindhoven Model driven software
CC532 Collaborative System Design
 CC532 Collaborative Design Part I: Fundamentals of s Engineering 4. s Interoperation/Integration DoD Architecture Framework (DoDAF) 2 of 24 Architecture of a system The fundamental organization of a system
The Unified Modelling Language. Example Diagrams. Notation vs. Methodology. UML and Meta Modelling
 UML and Meta ling Topics: UML as an example visual notation The UML meta model and the concept of meta modelling Driven Architecture and model engineering The AndroMDA open source project Applying cognitive
Contemporary Design. Traditional Hardware Design. Traditional Hardware Design. HDL Based Hardware Design User Inputs. Requirements.
 Contemporary Design We have been talking about design process Let s now take next steps into examining in some detail Increasing complexities of contemporary systems Demand the use of increasingly powerful
2. Title : Re-Use of Integrated Dictionary Components for C4ISR Architectures. 7. This is a student paper; Asma Ali is a first semester PhD.
 1. Topic: C2 Decision Making & Cognitive Analysis 2. Title : Re-Use of Integrated Dictionary Components for C4ISR Architectures 3. Author: Asma T. Ali 4. Organization: C3I Center, George Mason University
Execution of UML models Present and Future of Research and Practice
 Execution of UML models Present and Future of Research and Practice Federico Ciccozzi, Ivano Malavolta, Bran Selic Mälardalen University, Vrije University, Malina Software Corp. Ericsson Modeling Days
Module 3. Overview of TOGAF 9.1 Architecture Development Method (ADM)
") Module 3 Overview of TOGAF 9.1 Architecture Development Method (ADM) TOGAF 9.1 Structure The Architecture Development Method (ADM) Needs of the business shape non-architectural aspects of business operation
Module 3 Overview of TOGAF 9.1 Architecture Development Method (ADM) TOGAF 9.1 Structure The Architecture Development Method (ADM) Needs of the business shape non-architectural aspects of business operation
SOFTWARE ENGINEERING. Curriculum in Software Engineering. Program Educational Objectives
 Software Engineering 1 SOFTWARE ENGINEERING For the undergraduate curriculum in Software Engineering (http:// www.se.iastate.edu) leading to the degree Bachelor of Science. This curriculum is accredited
Model Driven Architecture and Rhapsody
 Model Driven Architecture and Rhapsody Dr. Bruce Powel Douglass Chief Evangelist Telelogic Model Driven Architecture and Rhapsody Abstract MDA, short for Model Driven Architecture, is a unification by
Comparative analyses for the performance of Rational Rose and Visio in software engineering teaching
 Journal of Physics: Conference Series PAPER OPEN ACCESS Comparative analyses for the performance of Rational Rose and Visio in software engineering teaching To cite this article: Zhaojun Yu and Zhan Xiong
MINUTES Date 5/7/2015. Monthly Faculty Meeting Department of Electrical Engineering
 Monthly Faculty Meeting Department of Electrical Engineering Present: Roger Dougal, Chair Andrea Benigni Charles Brice MVS chandrashekhar Yinchao Chen Herbert Ginn Asif Khan Krishna Mandal Enrico Santi
Requirements and Design Overview
 Requirements and Design Overview Robert B. France Colorado State University Robert B. France O-1 Why do we model? Enhance understanding and communication Provide structure for problem solving Furnish abstractions
Designing High-Performance Data Structures for MongoDB
 Designing High-Performance Data Structures for MongoDB The NoSQL Data Modeling Imperative Danny Sandwell, Product Marketing, erwin, Inc. Leigh Weston, Product Manager, erwin, Inc. Learn More at erwin.com
G COURSE PLAN ASSISTANT PROFESSOR Regulation: R13 FACULTY DETAILS: Department::
 G COURSE PLAN FACULTY DETAILS: Name of the Faculty:: Designation: Department:: Abhay Kumar ASSOC PROFESSOR CSE COURSE DETAILS Name Of The Programme:: BTech Batch:: 2013 Designation:: ASSOC PROFESSOR Year
DoDAF 2.0 Viewpoint Definitions. DoDAF v2.0 Viewpoint Definitions
 DoDAF v2.0 Viewpoint Definitions i Copyright 2011-2016 Vitech Corporation. All rights reserved. No part of this document may be reproduced in any form, including, but not limited to, photocopying, translating
Software Life Cycle. Main issues: Discussion of different life cycle models Maintenance or evolution
 Software Life Cycle Main issues: Discussion of different life cycle models Maintenance or evolution Introduction software development projects are large and complex a phased approach to control it is necessary
Designing and documenting the behavior of software
 Chapter 8 Designing and documenting the behavior of software Authors: Gürcan Güleşir, Lodewijk Bergmans, Mehmet Akşit Abstract The development and maintenance of today s software systems is an increasingly
A SysML-Based Methodology for Model Testing of Cyber-Physical Systems
 A SysML-Based Methodology for Model Testing of Cyber-Physical Systems Carlos A. González, Mojtaba Varmazyar, Shiva Nejati and Lionel Briand Software Verification and Validation Department, SnT Centre University
An Integrated Test Framework to Reduce Embedded Software Lifecycle Costs
 White Paper An Integrated Test Framework to Reduce Embedded Software Lifecycle Costs Version 1.0: August 23, 2012 Presented by: Chris Domin, Business Dev. Mgr. Engineering Services, sales@danlawinc.com
A Role-based Use Case Model for Remote Data Acquisition Systems *
 A Role-based Use Case Model for Remote Acquisition Systems * Txomin Nieva, Alain Wegmann Institute for computer Communications and Applications (ICA), Communication Systems Department (DSC), Swiss Federal
Architectural Design
 Architectural Design Topics i. Architectural design decisions ii. Architectural views iii. Architectural patterns iv. Application architectures PART 1 ARCHITECTURAL DESIGN DECISIONS Recap on SDLC Phases
Component-Based Software Engineering TIP
 Component-Based Software Engineering TIP X LIU, School of Computing, Napier University This chapter will present a complete picture of how to develop software systems with components and system integration.
SOFTWARE LIFE-CYCLE MODELS 2.1
 SOFTWARE LIFE-CYCLE MODELS 2.1 Outline Software development in theory and practice Software life-cycle models Comparison of life-cycle models 2.2 Software Development in Theory Ideally, software is developed
5/9/2014. Recall the design process. Lecture 1. Establishing the overall structureof a software system. Topics covered
 Topics covered Chapter 6 Architectural Design Architectural design decisions Architectural views Architectural patterns Application architectures Lecture 1 1 2 Software architecture The design process
Proposed Revisions to ebxml Technical Architecture Specification v ebxml Business Process Project Team
 1 2 3 4 5 6 7 8 9 10 11 12 13 14 15 16 17 18 19 20 21 22 23 24 25 26 27 28 29 30 31 32 33 Proposed Revisions to ebxml Technical Architecture Specification v1.0.4 ebxml Business Process Project Team 11
Content Management for the Defense Intelligence Enterprise
 Gilbane Beacon Guidance on Content Strategies, Practices and Technologies Content Management for the Defense Intelligence Enterprise How XML and the Digital Production Process Transform Information Sharing
Module B1 An Introduction to TOGAF 9.1 for those familiar with TOGAF 8
 Informs the capability Ensures Realization of Business Vision Business needs feed into method Refines Understanding Informs the Business of the current state Sets targets, KPIs, budgets for architecture
CS SOFTWARE ENGINEERING QUESTION BANK SIXTEEN MARKS
 DEPARTMENT OF COMPUTER SCIENCE AND ENGINEERING CS 6403 - SOFTWARE ENGINEERING QUESTION BANK SIXTEEN MARKS 1. Explain iterative waterfall and spiral model for software life cycle and various activities
Practical Model-Driven Development with the IBM Software Development Platform
 IBM Software Group Practical Model-Driven Development with the IBM Software Development Platform Osmond Ng (ong@hk1.ibm.com) Technical Consultant, IBM HK SWG 2005 IBM Corporation Overview The Challenges
BPS Suite and the OCEG Capability Model. Mapping the OCEG Capability Model to the BPS Suite s product capability.
 BPS Suite and the OCEG Capability Model Mapping the OCEG Capability Model to the BPS Suite s product capability. BPS Contents Introduction... 2 GRC activities... 2 BPS and the Capability Model for GRC...
ENTITIES IN THE OBJECT-ORIENTED DESIGN PROCESS MODEL
 INTERNATIONAL DESIGN CONFERENCE - DESIGN 2000 Dubrovnik, May 23-26, 2000. ENTITIES IN THE OBJECT-ORIENTED DESIGN PROCESS MODEL N. Pavković, D. Marjanović Keywords: object oriented methodology, design process
Call for Participation in AIP-6
 Call for Participation in AIP-6 GEOSS Architecture Implementation Pilot (AIP) Issue Date of CFP: 9 February 2013 Due Date for CFP Responses: 15 March 2013 Introduction GEOSS Architecture Implementation
MASTER OF INFORMATION TECHNOLOGY (Structure B)
") PROGRAM INFO The MIT (Master of Information Technology) program aims at providing Master s Degree holders with advanced knowledge and skills in dealing with an organization s computing requirements and
PROGRAM INFO The MIT (Master of Information Technology) program aims at providing Master s Degree holders with advanced knowledge and skills in dealing with an organization s computing requirements and
Rational Software White paper
 Unifying Enterprise Development Teams with the UML Grady Booch Rational Software White paper 1 There is a fundamental paradox at play in contemporary software development. On the one hand, organizations
IMI WHITE PAPER INFORMATION MAPPING AND DITA: TWO WORLDS, ONE SOLUTION
 n ao in i f rpp a t IMI WHITE PAPER INFORMATION MAPPING AND DITA: TWO WORLDS, ONE SOLUTION Abstract Introduction Information Mapping is a structured writing method with a long and successful history. It
Best Practices for Model-Based Systems Engineering
 Seminar / Workshop Best Practices for Model-Based Systems Engineering Hans-Peter Hoffmann, Ph.D. Chief Systems Methodologist, IBM Rational Software hoffmape@us.ibm.com Overview Successfully delivering
ava with Object-Oriented Generic Programming+ Java Java with Object-Oriented + Generic Programming by Paul S. Wang sofpower.com
 J Java J with Object-Oriented Generic Programming+ ava Java with by Paul S. Wang Object-Oriented + Generic Programming sofpower.com Java with Object-oriented and Generic Programming Paul S. Wang Department
An Introduction to SySML
 An Introduction to SySML Ljerka Beus-Dukic University of Westminster, London, UK L.Beus-Dukic@wmin.ac.uk 2007, Ljerka Beus-Dukic 1 What is SySML? SysML is a graphical modelling language for Systems Engineering
College of Sciences. College of Sciences. Master s of Science in Computer Sciences Master s of Science in Biotechnology
 Master s of Science in Computer Sciences Master s of Science in Biotechnology Department of Computer Sciences 1. Introduction\Program Mission The Program mission is to prepare students to be fully abreast
UNIVERSITY OF CALGARY. Requirements Engineering for Software Product Lines. By Chethana Kuloor
 UNIVERSITY OF CALGARY Requirements Engineering for Software Product Lines By Chethana Kuloor A PROJECT REPORT SUBMITTED TO THE FACULTY OF GRADUATE STUDIES IN PARTIAL FULFILLMENT OF THE REQUIREMENTS FOR
PPOOA, An Architectural Style for Real Time Systems
 PPOOA, An Architectural Style for Real Time Systems José Luis Fernández Sánchez Industrial Engineering School Universidad Politécnica de Madrid e-mail: fernandezjl@acm.org September 2004 PPOOA-WP-01_2004.pdf
MDSE USE CASES. Chapter #3
 Chapter #3 MDSE USE CASES Teaching material for the book Model-Driven Software Engineering in Practice by Morgan & Claypool, USA, 2012. www.mdse-book.com MDSE GOES FAR BEYOND CODE-GENERATION www.mdse-book.com
UNIT I. 3. Write a short notes on process view of 4+1 architecture. 4. Why is object-oriented approach superior to procedural approach?
 Department: Information Technology Questions Bank Class: B.E. (I.T) Prof. Bhujbal Dnyaneshwar K. Subject: Object Oriented Modeling & Design dnyanesh.bhujbal11@gmail.com ------------------------------------------------------------------------------------------------------------
Topics on Web Services COMP6017
 Topics on Web Services COMP6017 Dr Nicholas Gibbins nmg@ecs.soton.ac.uk 2013-2014 Module Aims Introduce you to service oriented architectures Introduce you to both traditional and RESTful Web Services
DoD Architecture Framework Version 2.0
 wreath stars Text DoD Architecture Framework Version 2.0 Volume 2: Architectural Data and Models Architect s Guide 28 May 2009 This page left intentionally blank TABLE OF CONTENTS SECTION PAGE 1. INTRODUCTION...
Quantifying and Assessing the Merge of Cloned Web-Based System: An Exploratory Study
 Quantifying and Assessing the Merge of Cloned Web-Based System: An Exploratory Study Jadson Santos Department of Informatics and Applied Mathematics Federal University of Rio Grande do Norte, UFRN Natal,
Your Student s Head Start on Career Goals and College Aspirations
 Your Student s Head Start on Career Goals and College Aspirations INFORMATION TECHNOLOGY (IT) NETWORKING PATHWAY The Destinations Networking Pathway prepares students to test and evaluate computer network
Data Models: The Center of the Business Information Systems Universe
 Data s: The Center of the Business Information Systems Universe Whitemarsh Information Systems Corporation 2008 Althea Lane Bowie, Maryland 20716 Tele: 301-249-1142 Email: Whitemarsh@wiscorp.com Web: www.wiscorp.com