Copyright 2014 Regents of the University of Minnesota
|
|
|
- Scot Watts
- 5 years ago
- Views:
Transcription
1 Quality Control of Illumina Data using Galaxy Contents September 16, Introduction What is Galaxy? Galaxy at MSI Scope of this tutorial Where to get more information Getting Started With Galaxy Accessing Galaxy at MSI Import FASTQ Files From Data Library Set File Attributes Evaluating FASTQ File Quality Running FastQC Viewing and Understanding FastQC results Cleaning FASTQ Datasets Why Is Cleaning Required? Remove Low Quality Tails and Adapter Contamination with Trimmomatic Review FastQC Results From Cleaned Datasets 13 6 Paired End Data 15 7 Workflows Extract Workflow from Current History View and Edit the Workflow Running a Workflow Sharing Workflows and Histories Share a History Share a Workflow Cleaning Up Histories: Deleting Data From Galaxy Deleting Intermediate Files and Histories from Galaxy
2 1 Introduction 1.1 What is Galaxy? Galaxy is a web-based interface that allows users to create complex computational pipelines to analyze biological data. Galaxy is designed to help you create reproducible workflows that can be used with multiple datasets, shared with others and published. Common bioinformatics software such as BLAST, BWA and GATK can be accessed though the Galaxy interface along with many other tools for converting between different formats, manipulating data and basic statistics. 1.2 Galaxy at MSI There are many instances of Galaxy, the one available to you though MSI is maintained by MSI and connects directly to the computational resources at MSI. The tools available will vary depending on which instance of Galaxy you use. While transferring workflows from one instance of Galaxy to another is easy, MSI has no control over which tools are available in other Galaxy instances. If there is a tool that you have used in a different instance of Galaxy that is not available in the MSI instance send a request to help@msi.umn.edu. 1.3 Scope of this tutorial Give participants experience with the basic functionality of Galaxy Accessing Galaxy at MSI Galaxy layout Loading files into current Galaxy history Creating a workflow Sharing histories and workflows Where to get more information Basic processing and quality control on Illumina sequencing data Evaluating read quality Adapter removal Low quality read removal Read trimming 1.4 Where to get more information From other Galaxy users: From MSI: 2
3 2 Getting Started With Galaxy Sections of Galaxy Galaxy has three main sections; Tools Pane, Histories Pane, and the Center Pane. Tools Pane Found on the left side of the browser. Contains all of the different tools that can be used within Galaxy. These include tools that do simple text manipulations and arithmetic to tools with more complex functions specific to the analysis of next generation sequence data and statistics. Combining these different tools allows you to analyze your data. Tools are organized into several heading or they can be found using the search bar at the top of the pane. Histories Pane Found on the right side of the browser. Contains the history of the tools you have used and the results. Histories can be saved, shared and turned into workflows that can also be saved, shared and reused. Center Pane Found in the center of the browser. When using a tool the options for that tool and information about the tool will be in the Center Pane. Clicking on the Eye Icon in the history pane will give of view of the data in the Center Pane. 2.1 Accessing Galaxy at MSI a) Open a web browser and navigate to the MSI Galaxy galaxy.msi.umn.edu b) Log in with your MSI username and password c) Tools Pane d) Center pane e) History Pane f) The side panels can be collapsed via arrows in the bottom corner to provide a better view of the Center Panel. g) Search bar to find tools. 3

4 h) The total quantity of data your group has stored in Galaxy is displayed in the top right corner. i) You can always get back to the main screen using Analyze Data in the top menu bar. 2.2 Import FASTQ Files From Data Library Getting data into MSI Galaxy- Data Libraries Sequencing Data from UMGC Sequencing data from UMGC can be accessed in Galaxy though the creation of a data library. In general, each PI with access to Galaxy account will have one data library that can contain many different pieces of data. When you or your PI receives an from UMGC indicating that your sequencing data is available you can have that data moved into your PI s Galaxy data library by forwarding the to help@msi.umn.edu with a request to add the data to Galaxy. You can then access the sequencing data library from the Shared Data tab in the blue bar at the top of the Galaxy page. If your PI doesn t currently have a data library a new one will be created the first time you request to have data added to Galaxy. External Data The Get Data heading in the Tool Pane is a good resource for obtaining external data from public databases such as the UCSC genome browser and SRA. You can also upload small (<2GB) files directly from your computer. When data is uploaded using the tools under Get Data they will appear in your current history. 4
.")
5 Larger External Datasets Data files that are larger than 2GB will have to be placed into a data library to be accessed in Galaxy. In your groups home directory there is a galaxy folder (/home/yourgroup/galaxy). To get data into your PI s data library move it into the galaxy folder in your groups home directory then send a ticket to help@msi.umn.edu with the location of the data to be added to your PI s data library. a) At the top of the screen select Shared Data then in the menu Data Libraries b) Select QC Illumina Data from the list of data libraries c) Expand the FastQ folder and check the boxes next to the first file, RNA-Seq.fastq d) Select Go next to Import to current history below the data files to move the data to your current history. e) Select Analyze Data in the blue bar to move back to the main Galaxy view. 2.3 Set File Attributes Attributes Setting the file attributes will tell the different tools in Galaxy what format the data is in. Galaxy does some work to auto detect the files that can be used as inputs for different tools. If you find that the file you want to use as an input is not available in a drop down menu check to see if you have set the file attributes. Information about different files types can be found though the USCS genome browser and from Current Protocols in Bioinformatics. Special note about FASTQ FASTQ files contain quality information for each sequenced base encoded using the characters found in the fourth line of each block. The preferred encoding for MSI Galaxy is Sanger. If you are looking at Illumina data created in 2012 or later your FASTQ files already using the Sanger encoding. If you sequencing was done before 2012 then you should use FASTQ Groomer to convert to the Sanger encoding (Sanger & Illumina 1.8+). 5
6 Canonical genomes Both Mouse (mm9) and Human (hg19, hg18) have canonical versions in Galaxy. For most NGS analyses you will want to use the canonical versions of the genome if available. These genomes contain only the standard chromosomes (i.e., somatic, sex and mitochondria ) and do not include parts of the genome that have unknown locations, haplotype specific chromosomes or random chromosomes. a) In the History Pane click on the pencil icon next to RNA-Seq.fastq. This will bring up the files Attributes in the Center Pane. b) This is a human dataset so select Human hg19 in GATK canonical in the drop down menu under Database/Build:. You can scroll or if you begin to type hg19 then you will only see the options with hg19 in the name. c) Click Save d) Switch to the Datatype tab by selecting it from the top of the Center Pane e) Select fastqsanger from the drop down menu. You can scroll or if you begin to type faster then you will see the options with fastq in the name. NOTE: do not select fastqcsanger. f) Click Save 6

7 3 Evaluating FASTQ File Quality FASTQ Format and Quality Scores This tutorial is geared towards Illumina data in FASTQ format, other sequencing methods (i.e., Roche 454) may produce reads with a different patterns of errors or a different file format. Quality control tools for other NGS data types can be found under the NGS: QC and manipulation heading in the Tool Pane. A sequence record in a FASTQ file consist of four lines 1) line 2) sequence data 3) + place holder line 4) quality score line. FASTQ quality scores encode the estimated chance of a miscalled base at each location. Single ASCII characters are used to encode the quality scores, as opposed to raw numbers, so that there is always a 1-to-1 relationship between the number of bases in the read and the length of the quality score. Quality score reflect the probability that a base call was incorrect, calculated as a Phred quality score ( Phred Q = -10log(p), where p is the probability that the inferred base is incorrect). The higher the Phred score the smaller the probability that the base call was incorrect. A Phred score of 10 indicates a 1 in 10 chance of an incorrect base call while a oared score of 50 indicates a 1 in 100,000 chance of an incorrect base call. 7
8 Unfortunately, FASTQ files from different sources sometimes encode quality scores slightly differently. Sanger and current Illumina FASTQ format uses a Phred+33 encoding, which means that the lowest Phred score of 0 is encoded as ASCII character 33 (!), while Solexa and pre-2012 Illumina software uses Phred+64 encoding (Phred 0 encoded But in all cases, the higher the Phred quality scores the higher quality the base call. In Galaxy you can use FASTQ Groomer to ensure your data is in the Sanger/Illumina encoding. FastQC Metrics Basic Statistics Gives the name of the input file, encoding used for the quality score, total sequence count, average sequence length and GC content (%). Per Base Sequence Quality A important figure showing the average quality score at each position across all reads. In general, quality scores are lower at the start and each of reads. Sudden dips in the middle of a read can signify failed cycles in the sequencing run (machine errors). Per Tile Sequence Quality Gives quality information based on the location of the read on the flowcell tile. A good plot will be blue all over, red color indicates cells with low quality reads. Per Sequence Quality Scores Histogram charting the average quality across a read. Low quality reads can be removed but a majority (at least 75%) of you data should be of high quality. Per Base Sequence Content The frequency of each nucleotide at each position across all of the reads. Extremely high nucleotide bias can be a sign of trouble, short stretches with high bias can be caused by the presence of linkers, barcodes or adapter contamination. There is usually some minor bias in the first 11-13bp of RNA-seq data due to not-quite random hexamer sequence priming but this bias is accounted for in the downstream analysis. Per Sequence GC Content This figure will show you both the theoretical distribution of GC content and the GC content of your data. These distributions should be similar. Per Base N Content Rate of ambitious base calls (N) for each position along the reads. This count should be very low (<10), to many N calls indicates issues with the sequencing run (usually machine errors). Sequence Length Distributions Histogram of the sequence lengths. Illumina reads that have not been trimmed will all have the same length, once trimmed you want a majority of your reads to be full length and a small percentage to be shorter. 8

9 Sequence Duplication Levels Frequency of exact sequence duplicates in the dataset. High duplication rates can be caused by PCR artifacts and/or low library diversity. Low levels of duplication can be removed but, high levels indicate issues with the library preparation. Overrepresented Sequences A list of overrepresented sequences if they exist in the data. These are the sequences that are contributing to the data in the Sequence Duplication Level graph. Adapter Content While the Overrepresented Sequences analysis will pick up adapter contamination the results can often be unclear. This plot looks specifically for a set of Illumina adapters and gives a plot indicating the the total proportion of your lib ray which contain these adapters. K-mer Content Shows the amount (% of reads) and sequence of overrepresented K-mers. High levels of overrepresented sequences usually arise from adapter contamination and these levels should drop after adapters are removed from your data. 3.1 Running FastQC a) From the Tools Pane select the MSI header. b) Select the FastQC: Read QC tool. c) Alternatively, use the search bar at the top of the tool pane to find FastQC. d) Make sure that you are using FastQC:ReadQC (version 0.60). e) Select the file to analyze from the drop-down menu: RNA-Seq.fastq f) Rename the output file to something meaningful such as Precleaning. g) Select Execute 9
 Scroll to the Per base sequence quality.")
 Scroll to Per sequence quality scores. f) The over all quality of the reads is high with a vast majority of the reads having quality scores over 30. g) Scroll to Sequence duplication levels.")
10 3.2 Viewing and Understanding FastQC results a) In the History Pane select the Eye Icon next to the name of the output from using the FastQC: ReadQC tool. This will allow you to view the results in the Center Pane. b) Scroll to the Per base sequence quality. c) Note how the quality of the reads drops towards the 3 ends of the reads d) The per tile sequence quality is all blue because the overall quality of the reads is good. e) Scroll to Per sequence quality scores. f) The over all quality of the reads is high with a vast majority of the reads having quality scores over 30. g) Scroll to Sequence duplication levels. h) Note the presence of a small number of highly duplicated reads. The duplicated sequences and counts can be found in the Overrepresented Sequences (J) table. i) The high count and percentage values for the top three sequences in the Overrepresented Sequences list represent adapter contamination in this dataset and need to be removed. j) Scroll down to Kmer content k) These very spiky regions of over represented Kmers are common and often are biological and not a data quality issue 10

11 4 Cleaning FASTQ Datasets 4.1 Why Is Cleaning Required? Low Quality Tails and Failed Cycles For a variety of reasons, including decay of reagents as they sit on the sequencing machine, the quality of base calls tends to decrease as sequencing progresses. As a result the 5 ends will tend to have higher quality than the 3 ends and forward reads will tend to have better quality than reverse 11

12 reads. Low quality base calls can impair the accuracy of mapping algorithms so it is important to to remove them. Low quality tails can be removed though the removal of the 3 ends from all of the reads but, that would result in the removal of many reads that were of higher quality as well. More sophisticated methods only remove the tails that show evidence of low quality. In Galaxy there are tools that can accomplish either style of read trimming. Cycles fail because of sequencing machine error, such as failure to incorporate a base, or failure to image a specific region. For most analysis failed cycles can be ignored as they will not have large effects. Adapter Contamination Illumina libraries consist of the DNA of interest (green) with ligated adapter (red + yellow) on the 5 and 3 ends to proved priming site for the sequencing reactions. The forward adapter (left) provides a region that binds to the Illumina flow cell plate (blue) and a region to which the sequencing primer binds to start the sequencing reactions. The reverse adapter (right) has the same structure with the addition of a barcode sequence (yellow). Adapter contamination occurs when the DNA fragment of interest is shorter than the length of the sequencing read. This results in the opposite primer included in the sequence of the final read, leading to adapter contamination. Removal of adapter contamination in Galaxy can be accomplished using CutAdapt and the sequence of the primers. 4.2 Remove Low Quality Tails and Adapter Contamination with Trimmomatic a) Under the NGS: QC and manipulation header select Trimmomatic b) Select Single End Mode in the top drop down menu. c) Select RNA-Seq.fastq from the second drop down menu. d) Trimmomatic allows you to build a list of modules to complete all of your clean-up steps at once. e) The first module ILLUMINACLIP will identify and remove adapter contamination. f) Select TruSeq2-SE from the adapters drop down menu. 12
 Select LEADING from the task drop down menu, the page with refresh and new options associated with the LEADING module will appear. Use the default settings.")
13 g) To add another module select Add new Task at the bottom of the module. h) Select LEADING from the task drop down menu, the page with refresh and new options associated with the LEADING module will appear. Use the default settings. i) Next add the TRAILING module, SLIDINGWINDOW and the MINLEN module. The default settings will work for all of these modules. j) Once all of the modules have been added select Execute. 5 Review FastQC Results From Cleaned Datasets In this section we will compare the results from FastQC between the original FASTQ file and the quality and adapter trimmed FASTQ files. You should always examine the results post FASTQ file clean up before moving forward with more complex analysis. Here we will be showing both the results from the original FASTQ files as well as those from the quality and adapter trimmed FASTQ files. 13
 Scroll down to Sequence Length Distribution. Note the degree of trimming that has occurred.")
14 a) Use FastQC to examine the quality statistics for the quality and adapter trimmed FASTQ files. Select the Eye Icon to view the results. b) Scroll down to Per base sequence quality. Note the improvement in the average quality of the read tails. c) Scroll down to Sequence Length Distribution. Note the degree of trimming that has occurred. A vast majority of your data is still full length with only a very limited number of sequences that are between 36 and 40bp. Changing the MINLEN settings during trimming will change this distribution. d) Scroll down to Sequence Duplication Levels. Note the removal of the highly repeated sequences. e) Scroll down to the list of Overrepresented Sequences. The percentage of your data that is an overrepresented is now greatly reduced. 14
 Select Shared Data then Data Libraries from the top header bar. c) Select QC of Illumina Data from the list of data libraries. Remember the search bar! d) Import Tutorial file R1.")
15 6 Paired End Data This section will guide you though using FastQC and Trimmomatic on Paired end data. a) Using the gear icon at the top of the History Pane create a new history. b) Select Shared Data then Data Libraries from the top header bar. c) Select QC of Illumina Data from the list of data libraries. Remember the search bar! d) Import Tutorial file R1.fastq and Tutorial file R2.fastq into your new history. e) Run FastQC on the new fastq files. You will have to run the tool on each fastq individually. f) Use Trimmomatic in Paired End Mode with TruSeq2-PE adapters to trim the data. Use the ILLUMINACLIP, LEADING, TRAILING, SLIDINGWINDOW and MINLEN modules with the default settings. g) Notice there are 4 Trimmomatic outputs: forward paired, forward unpaired, reverse paired and reverse unpaired. h) Run FastQC on the forward paired and reverse paired data to see the effect of your trimming. 15

16 7 Workflows Creating a Workflow The ability to create, reuse, share and publish workflows is on of Galaxy s largest strengths. Creating workflows allows you and anyone you want to collaborate with to exactly recreate analysis. You can think of workflows as your computational lab notebook, they are how you document your computational work. Workflows are also handy when you have to clean up your Galaxy space. Saving the raw input data and the workflow that leads to a final result allows you to delete the intermediate files yet retain the ability to recreate the entire analysis at any time. Workflows 16
17 can be extracted from histories or created from scratch. Either method will result in a useable workflow so how you choose to build one is up to you. Workflows are made up of connected tools, each tool is represented as a box and data moving from one tool to another is represented by the arrows. The inputs required for the tool can be found above the horizontal line in the box while the possible outputs are found below the line. Outputs from each tool can be saved and/or used as in the input for the next tool. Selecting the box will display the settings associated with the tool allowing you to preset parameters to reuse each time the workflow is run. 7.1 Extract Workflow from Current History a) Select the Gear Icon from the top of the history pane. b) Select Extract Workflow from the menu. c) In Workflow name enter QC and Cleanup. d) Select Create Workflow. 7.2 View and Edit the Workflow a) Select Workflow from the top bar. b) Select the workflow that you just created and select Edit from the drop down menu. c) The initial view of the workflow may be very messy. You can drag the boxes around on the screen to make the workflow easier to interpret. You can also move the blue box in the bottom right corner to view other sections of the workflow. 17
 Select a FastQC:Read QC box which will open the Details Pane on the right. Is this for the Left or Right reads?")
18 d) The workflow will follow the same logic as the history you created it from. Can you trace the steps you took for each initial FASTQ file though the QC and clean up process? e) Select a FastQC:Read QC box which will open the Details Pane on the right. Is this for the Left or Right reads? f) Select the Input dataset box that is attached (connected arrows) to the FastQC:Read QC box you just viewed. g) Label the Input dataset either Left or Right to correspond with the information from the FastQC:Read QC box you just viewed. h) Do the same for the other Input dataset. i) The next time you need to run QC and clean up FASTQ data you might need to use different adapter sequences. Selecting the Trimmomatic box to view the options in the Details Pane. j) In the Details Pane for Trimmomatic change the adapter sequence to Set at runtime using the small arrow next to fastawithadapters. k) Select the Gear Icon then Save from the menu. 7.3 Running a Workflow a) Select Analyze Data from the top bar to return to the main Galaxy screen. b) Create a new history by selecting the Gear Icon then Create New from the menu. c) Name the history Workflow Test 18
19 d) Import Tutorial file workflow R1.fastq and Tutorial file workflow R2.fastq into the current Workflow Test history from the data library(section 2.2. Don t forget to set the file attributes (Section 2.3). e) Select Workflow from the top bar to display your saved workflow from the data library. f) Select the QC and Cleanup workflow you just created then select Run from the drop down menu. g) Set the input datasets and the adapter using the drop down menus. h) Scroll to the bottom of the main view and select Run workflow i) Select Analyze Data in the top bar to return to the main Galaxy view. j) You will be able to watch the progress of the workflow in the History Pane. 8 Sharing Workflows and Histories It is possible to share workflow and histories with other Galaxy users. This allows you to share data, results and methods with collaborators or anyone who might want to recreate your methodology. Galaxy histories and workflows can be shared via a link or they can be saved as stand alone files that can then be uploaded to any Galaxy instance. 8.1 Share a History a) To share your current history select the Gear Icon then Share or Publish b) To share the history though a web link select Make History Accessible via Link. You can share this link with anyone who has access to Galaxy at MSI allowing them to view the history and the data in it. c) Make History Accessible and Publish will also create a link to the history but it will also publish the history making it public to anyone with access to Galaxy at MSI under the Shared Data tab. 19

20 8.2 Share a Workflow a) When you select a workflow from the list one of the options is Share or Publish b) To share the workflow though a web link select Make Workflow Accessible via Link. You can share this link with anyone who has access to Galaxy at MSI allowing them to view and use the workflow. c) Make Workflow Accessible and Publish also creates a link to the workflow but it will also publish the workflow making it public to anyone with access to Galaxy at MSI under the Shared Data tab. d) You can also download a workflow to be imported into another Galaxy instance or to be archived by selecting Download or Export. 20
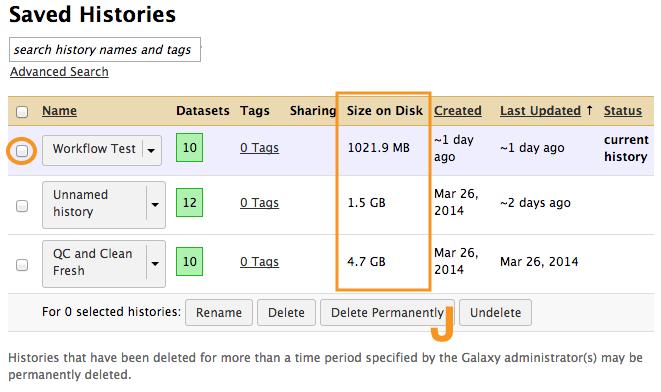
21 9 Cleaning Up Histories: Deleting Data From Galaxy Galaxy is a shared resource so the amount of data you and your group can have in Galaxy is limited. We estimate that even a relatively simple RNAN-seq analysis will use 4-5 times the storage of the raw sequencing files. Many of these files are intermediate and can be discarded once the analysis is complete. Also, since Galaxy allows you to create workflows it is easy to recreate intermediate files if they are needed later. It is good practice to extract workflows from histories then discard the histories once you have completed the analyses. Your groups current Galaxy usage is displayed in the top bar on the far right. You can view the size of your different Galaxy histories when you view you saved Galaxy histories using the Gear Icon and below the name of your current history. If you delete a Galaxy history before you extract a workflow you will not be able to do so later. 9.1 Deleting Intermediate Files and Histories from Galaxy a) Select Analyze Data in the top bar to get to the main Galaxy view. b) Select the Gear Icon and then Saved Histories from the menu. c) Select the history you created when you tested your workflow then select Switch to open the history in the Galaxy History Pane. d) To delete specific pieces of data from a Galaxy history you can select the X. e) Notice that when the data set is deleted that the size of the history does not change. This is because Galaxy has a recycling bin type function. f) To permanently delete a dataset first unhide the hidden datasets by selecting the Gear Icon then Include Deleted Datasets. g) Select the here link displayed in the history pane for the data you would like to delete. This will actually reduce the size of the history. 21

22 h) You can delete an entire history from the same page where you can view your saved histories. i) Select the Gear Icon then Saved Histories j) Select the history that you want to delete. Delete Permanently will remove the history immediately while Delete will place the history in the recycling bin. k) While data can be restored from the recycle bin MSI will clear out the recycle bin monthly so if you choose to delete a history you should just Delete Permanently. 22
23 23
Copyright 2014 Regents of the University of Minnesota
 Quality Control of Illumina Data using Galaxy August 18, 2014 Contents 1 Introduction 2 1.1 What is Galaxy?..................................... 2 1.2 Galaxy at MSI......................................
NGS : reads quality control
 NGS : reads quality control Data used in this tutorials are available on https:/urgi.versailles.inra.fr/download/tuto/ngs-readsquality-control. Select genome solexa.fasta, illumina.fastq, solexa.fastq
Understanding and Pre-processing Raw Illumina Data
 Understanding and Pre-processing Raw Illumina Data Matt Johnson October 4, 2013 1 Understanding FASTQ files After an Illumina sequencing run, the data is stored in very large text files in a standard format
Analyzing ChIP- Seq Data in Galaxy
 Analyzing ChIP- Seq Data in Galaxy Lauren Mills RISS ABSTRACT Step- by- step guide to basic ChIP- Seq analysis using the Galaxy platform. Table of Contents Introduction... 3 Links to helpful information...
Galaxy Platform For NGS Data Analyses
 Galaxy Platform For NGS Data Analyses Weihong Yan wyan@chem.ucla.edu Collaboratory Web Site http://qcb.ucla.edu/collaboratory Collaboratory Workshops Workshop Outline ü Day 1 UCLA galaxy and user account
Sequence Data Quality Assessment Exercises and Solutions.
 Sequence Data Quality Assessment Exercises and Solutions. Starting Note: Please do not copy and paste the commands. Characters in this document may not be copied correctly. Please type the commands and
ChIP-seq hands-on practical using Galaxy
 ChIP-seq hands-on practical using Galaxy In this exercise we will cover some of the basic NGS analysis steps for ChIP-seq using the Galaxy framework: Quality control Mapping of reads using Bowtie2 Peak-calling
Tutorial: De Novo Assembly of Paired Data
 : De Novo Assembly of Paired Data September 20, 2013 CLC bio Silkeborgvej 2 Prismet 8000 Aarhus C Denmark Telephone: +45 70 22 32 44 Fax: +45 86 20 12 22 www.clcbio.com support@clcbio.com : De Novo Assembly
ITMO Ecole de Bioinformatique Hands-on session: smallrna-seq N. Servant 21 rd November 2013
 ITMO Ecole de Bioinformatique Hands-on session: smallrna-seq N. Servant 21 rd November 2013 1. Data and objectives We will use the data from GEO (GSE35368, Toedling, Servant et al. 2011). Two samples were
Importing your Exeter NGS data into Galaxy:
 Importing your Exeter NGS data into Galaxy: The aim of this tutorial is to show you how to import your raw Illumina FASTQ files and/or assemblies and remapping files into Galaxy. As of 1 st July 2011 Illumina
Quality assessment of NGS data
 Quality assessment of NGS data Ines de Santiago July 27, 2015 Contents 1 Introduction 1 2 Checking read quality with FASTQC 1 3 Preprocessing with FASTX-Toolkit 2 3.1 Preprocessing with FASTX-Toolkit:
Colorado State University Bioinformatics Algorithms Assignment 6: Analysis of High- Throughput Biological Data Hamidreza Chitsaz, Ali Sharifi- Zarchi
 Colorado State University Bioinformatics Algorithms Assignment 6: Analysis of High- Throughput Biological Data Hamidreza Chitsaz, Ali Sharifi- Zarchi Although a little- bit long, this is an easy exercise
INF-BIO5121/ Oct 7, Analyzing mirna data using Lifeportal PRACTICALS
 INF-BIO5121/9121 - Oct 7, 2014 Analyzing mirna data using Lifeportal PRACTICALS In this experiment we have mirna data from the livers of baboons (Papio Hamadryas) before and after they are given a high
Helpful Galaxy screencasts are available at:
 This user guide serves as a simplified, graphic version of the CloudMap paper for applicationoriented end-users. For more details, please see the CloudMap paper. Video versions of these user guides and
BGGN-213: FOUNDATIONS OF BIOINFORMATICS (Lecture 14)
") BGGN-213: FOUNDATIONS OF BIOINFORMATICS (Lecture 14) Genome Informatics (Part 1) https://bioboot.github.io/bggn213_f17/lectures/#14 Dr. Barry Grant Nov 2017 Overview: The purpose of this lab session is
BGGN-213: FOUNDATIONS OF BIOINFORMATICS (Lecture 14) Genome Informatics (Part 1) https://bioboot.github.io/bggn213_f17/lectures/#14 Dr. Barry Grant Nov 2017 Overview: The purpose of this lab session is
Using Galaxy for NGS Analyses Luce Skrabanek
 Using Galaxy for NGS Analyses Luce Skrabanek Registering for a Galaxy account Before we begin, first create an account on the main public Galaxy portal. Go to: https://main.g2.bx.psu.edu/ Under the User
RNA-Seq in Galaxy: Tuxedo protocol. Igor Makunin, UQ RCC, QCIF
 RNA-Seq in Galaxy: Tuxedo protocol Igor Makunin, UQ RCC, QCIF Acknowledgments Genomics Virtual Lab: gvl.org.au Galaxy for tutorials: galaxy-tut.genome.edu.au Galaxy Australia: galaxy-aust.genome.edu.au
Tutorial. De Novo Assembly of Paired Data. Sample to Insight. November 21, 2017
 De Novo Assembly of Paired Data November 21, 2017 Sample to Insight QIAGEN Aarhus Silkeborgvej 2 Prismet 8000 Aarhus C Denmark Telephone: +45 70 22 32 44 www.qiagenbioinformatics.com AdvancedGenomicsSupport@qiagen.com
ChIP-seq hands-on practical using Galaxy
 ChIP-seq hands-on practical using Galaxy In this exercise we will cover some of the basic NGS analysis steps for ChIP-seq using the Galaxy framework: Quality control Mapping of reads using Bowtie2 Peak-calling
CLC Server. End User USER MANUAL
 CLC Server End User USER MANUAL Manual for CLC Server 10.0.1 Windows, macos and Linux March 8, 2018 This software is for research purposes only. QIAGEN Aarhus Silkeborgvej 2 Prismet DK-8000 Aarhus C Denmark
QIAseq Targeted RNAscan Panel Analysis Plugin USER MANUAL
 QIAseq Targeted RNAscan Panel Analysis Plugin USER MANUAL User manual for QIAseq Targeted RNAscan Panel Analysis 0.5.2 beta 1 Windows, Mac OS X and Linux February 5, 2018 This software is for research
NGS Data Visualization and Exploration Using IGV
 1 What is Galaxy Galaxy for Bioinformaticians Galaxy for Experimental Biologists Using Galaxy for NGS Analysis NGS Data Visualization and Exploration Using IGV 2 What is Galaxy Galaxy for Bioinformaticians
Next Generation Sequencing quality trimming (NGSQTRIM)
") Next Generation Sequencing quality trimming (NGSQTRIM) Danamma B.J 1, Naveen kumar 2, V.G Shanmuga priya 3 1 M.Tech, Bioinformatics, KLEMSSCET, Belagavi 2 Proprietor, GenEclat Technologies, Bengaluru 3
Next Generation Sequencing quality trimming (NGSQTRIM) Danamma B.J 1, Naveen kumar 2, V.G Shanmuga priya 3 1 M.Tech, Bioinformatics, KLEMSSCET, Belagavi 2 Proprietor, GenEclat Technologies, Bengaluru 3
Galaxy workshop at the Winter School Igor Makunin
 Galaxy workshop at the Winter School 2016 Igor Makunin i.makunin@uq.edu.au Winter school, UQ, July 6, 2016 Plan Overview of the Genomics Virtual Lab Introduce Galaxy, a web based platform for analysis
Performing a resequencing assembly
 BioNumerics Tutorial: Performing a resequencing assembly 1 Aim In this tutorial, we will discuss the different options to obtain statistics about the sequence read set data and assess the quality, and
De novo genome assembly
 BioNumerics Tutorial: De novo genome assembly 1 Aims This tutorial describes a de novo assembly of a Staphylococcus aureus genome, using single-end and pairedend reads generated by an Illumina R Genome
Pre-processing and quality control of sequence data. Barbera van Schaik KEBB - Bioinformatics Laboratory
 Pre-processing and quality control of sequence data Barbera van Schaik KEBB - Bioinformatics Laboratory b.d.vanschaik@amc.uva.nl Topic: quality control and prepare data for the interesting stuf Keep Throw
QIAseq DNA V3 Panel Analysis Plugin USER MANUAL
 QIAseq DNA V3 Panel Analysis Plugin USER MANUAL User manual for QIAseq DNA V3 Panel Analysis 1.0.1 Windows, Mac OS X and Linux January 25, 2018 This software is for research purposes only. QIAGEN Aarhus
Dr. Gabriela Salinas Dr. Orr Shomroni Kaamini Rhaithata
 Analysis of RNA sequencing data sets using the Galaxy environment Dr. Gabriela Salinas Dr. Orr Shomroni Kaamini Rhaithata Microarray and Deep-sequencing core facility 30.10.2017 RNA-seq workflow I Hypothesis
Protocol: peak-calling for ChIP-seq data / segmentation analysis for histone modification data
 Protocol: peak-calling for ChIP-seq data / segmentation analysis for histone modification data Table of Contents Protocol: peak-calling for ChIP-seq data / segmentation analysis for histone modification
EpiGnome Methyl Seq Bioinformatics User Guide Rev. 0.1
 EpiGnome Methyl Seq Bioinformatics User Guide Rev. 0.1 Introduction This guide contains data analysis recommendations for libraries prepared using Epicentre s EpiGnome Methyl Seq Kit, and sequenced on
ChIP-Seq Tutorial on Galaxy
 1 Introduction ChIP-Seq Tutorial on Galaxy 2 December 2010 (modified April 6, 2017) Rory Stark The aim of this practical is to give you some experience handling ChIP-Seq data. We will be working with data
Function. Description
 Function Check In Get / Checkout Description Checking in a file uploads the file from the user s hard drive into the vault and creates a new file version with any changes to the file that have been saved.
DNA / RNA sequencing
 Outline Ways to generate large amounts of sequence Understanding the contents of large sequence files Fasta format Fastq format Sequence quality metrics Summarizing sequence data quality/quantity Using
Using the Galaxy Local Bioinformatics Cloud at CARC
 Using the Galaxy Local Bioinformatics Cloud at CARC Lijing Bu Sr. Research Scientist Bioinformatics Specialist Center for Evolutionary and Theoretical Immunology (CETI) Department of Biology, University
Mapping RNA sequence data (Part 1: using pathogen portal s RNAseq pipeline) Exercise 6
 Exercise 6") Mapping RNA sequence data (Part 1: using pathogen portal s RNAseq pipeline) Exercise 6 The goal of this exercise is to retrieve an RNA-seq dataset in FASTQ format and run it through an RNA-sequence analysis
Mapping RNA sequence data (Part 1: using pathogen portal s RNAseq pipeline) Exercise 6 The goal of this exercise is to retrieve an RNA-seq dataset in FASTQ format and run it through an RNA-sequence analysis
Cyverse tutorial 1 Logging in to Cyverse and data management. Open an Internet browser window and navigate to the Cyverse discovery environment:
 Cyverse tutorial 1 Logging in to Cyverse and data management Open an Internet browser window and navigate to the Cyverse discovery environment: https://de.cyverse.org/de/ Click Log in with your CyVerse
Fusion Detection Using QIAseq RNAscan Panels
 Fusion Detection Using QIAseq RNAscan Panels June 11, 2018 Sample to Insight QIAGEN Aarhus Silkeborgvej 2 Prismet 8000 Aarhus C Denmark Telephone: +45 70 22 32 44 www.qiagenbioinformatics.com ts-bioinformatics@qiagen.com
Preparation of alignments for variant calling with GATK: exercise instructions for BioHPC Lab computers
 Preparation of alignments for variant calling with GATK: exercise instructions for BioHPC Lab computers Data used in the exercise We will use D. melanogaster WGS paired-end Illumina data with NCBI accessions
Tutorial. Identification of Variants in a Tumor Sample. Sample to Insight. November 21, 2017
 Identification of Variants in a Tumor Sample November 21, 2017 Sample to Insight QIAGEN Aarhus Silkeborgvej 2 Prismet 8000 Aarhus C Denmark Telephone: +45 70 22 32 44 www.qiagenbioinformatics.com AdvancedGenomicsSupport@qiagen.com
Talend Data Preparation Free Desktop. Getting Started Guide V2.1
 Talend Data Free Desktop Getting Guide V2.1 1 Talend Data Training Getting Guide To navigate to a specific location within this guide, click one of the boxes below. Overview of Data Access Data And Getting
Trimming and quality control ( )
") Trimming and quality control (2015-06-03) Alexander Jueterbock, Martin Jakt PhD course: High throughput sequencing of non-model organisms Contents 1 Overview of sequence lengths 2 2 Quality control 3 3
Trimming and quality control (2015-06-03) Alexander Jueterbock, Martin Jakt PhD course: High throughput sequencing of non-model organisms Contents 1 Overview of sequence lengths 2 2 Quality control 3 3
README _EPGV_DataTransfer_Illumina Sequencing
 README _EPGV_DataTransfer_Illumina Sequencing I. Delivered files / Paired-ends (PE) sequences... 2 II. Flowcell (FC) Nomenclature... 2 III. Quality Control Process and EPGV Cleaning Version 1.7... 4 A.
Tutorial. Find Very Low Frequency Variants With QIAGEN GeneRead Panels. Sample to Insight. November 21, 2017
 Find Very Low Frequency Variants With QIAGEN GeneRead Panels November 21, 2017 Sample to Insight QIAGEN Aarhus Silkeborgvej 2 Prismet 8000 Aarhus C Denmark Telephone: +45 70 22 32 44 www.qiagenbioinformatics.com
Microsoft Office 365 includes the entire Office Suite (Word, Excel, PowerPoint, Access, Publisher, Lync, Outlook, etc ) and an OneDrive account.
 and an OneDrive account.") Microsoft Office 365 Contents What is Office 365?... 2 What is OneDrive?... 2 What if you already have a Microsoft Account?... 2 Download Office for FREE... 3 How to Access OneDrive... 4 Office Online...
Microsoft Office 365 Contents What is Office 365?... 2 What is OneDrive?... 2 What if you already have a Microsoft Account?... 2 Download Office for FREE... 3 How to Access OneDrive... 4 Office Online...
Using Galaxy-P Documentation
 Using Galaxy-P Documentation Release 0.1 John Chilton, Pratik Jagtap October 26, 2015 Contents 1 Introduction 1 2 Galaxy-P 101 - Building Up and Using a Proteomics Workflow 3 2.1 What Are We Trying to
ASAP - Allele-specific alignment pipeline
 ASAP - Allele-specific alignment pipeline Jan 09, 2012 (1) ASAP - Quick Reference ASAP needs a working version of Perl and is run from the command line. Furthermore, Bowtie needs to be installed on your
User Guide For LabCollector Workflow Manager
 User Guide For LabCollector Workflow Manager Version: July 2017 2017 AgileBio. www.agilebio.com & www.labcollector.com Summary 1- INTRODUCTION... 4 2- INSTALLATION... 5 2-1. Manual mode... 5 2-2. Automatic
NGS Analyses with Galaxy
 1 NGS Analyses with Galaxy Introduction Every living organism on our planet possesses a genome that is composed of one or several DNA (deoxyribonucleotide acid) molecules determining the way the organism
ChIP-seq Analysis Practical
 ChIP-seq Analysis Practical Vladimir Teif (vteif@essex.ac.uk) An updated version of this document will be available at http://generegulation.info/index.php/teaching In this practical we will learn how
Nevada Genomics Center
 Nevada Genomics Center These are general instructions on how to use dnatools to submit Sanger sequencing samples to be run on the ABI Prism 3730 DNA analyzer. We here at the Nevada Genomics Center feel
Tutorial: RNA-Seq Analysis Part II (Tracks): Non-Specific Matches, Mapping Modes and Expression measures
: Non-Specific Matches, Mapping Modes and Expression measures") : RNA-Seq Analysis Part II (Tracks): Non-Specific Matches, Mapping Modes and February 24, 2014 Sample to Insight : RNA-Seq Analysis Part II (Tracks): Non-Specific Matches, Mapping Modes and : RNA-Seq Analysis
: RNA-Seq Analysis Part II (Tracks): Non-Specific Matches, Mapping Modes and February 24, 2014 Sample to Insight : RNA-Seq Analysis Part II (Tracks): Non-Specific Matches, Mapping Modes and : RNA-Seq Analysis
Genome 373: Mapping Short Sequence Reads III. Doug Fowler
 Genome 373: Mapping Short Sequence Reads III Doug Fowler What is Galaxy? Galaxy is a free, open source web platform for running all sorts of computational analyses including pretty much all of the sequencing-related
m6aviewer Version Documentation
 m6aviewer Version 1.6.0 Documentation Contents 1. About 2. Requirements 3. Launching m6aviewer 4. Running Time Estimates 5. Basic Peak Calling 6. Running Modes 7. Multiple Samples/Sample Replicates 8.
Genome Browsers - The UCSC Genome Browser
 Genome Browsers - The UCSC Genome Browser Background The UCSC Genome Browser is a well-curated site that provides users with a view of gene or sequence information in genomic context for a specific species,
High-throughput sequencing: Alignment and related topic. Simon Anders EMBL Heidelberg
 High-throughput sequencing: Alignment and related topic Simon Anders EMBL Heidelberg Established platforms HTS Platforms Illumina HiSeq, ABI SOLiD, Roche 454 Newcomers: Benchtop machines 454 GS Junior,
Excel 2013 Intermediate
 Instructor s Excel 2013 Tutorial 2 - Charts Excel 2013 Intermediate 103-124 Unit 2 - Charts Quick Links Chart Concepts Page EX197 EX199 EX200 Selecting Source Data Pages EX198 EX234 EX237 Creating a Chart
Tutorial: Resequencing Analysis using Tracks
 : Resequencing Analysis using Tracks September 20, 2013 CLC bio Silkeborgvej 2 Prismet 8000 Aarhus C Denmark Telephone: +45 70 22 32 44 Fax: +45 86 20 12 22 www.clcbio.com support@clcbio.com : Resequencing
Release Notes. Version Gene Codes Corporation
 Version 4.10.1 Release Notes 2010 Gene Codes Corporation Gene Codes Corporation 775 Technology Drive, Ann Arbor, MI 48108 USA 1.800.497.4939 (USA) +1.734.769.7249 (elsewhere) +1.734.769.7074 (fax) www.genecodes.com
Accessible, Transparent and Reproducible Analysis with Galaxy
 Accessible, Transparent and Reproducible Analysis with Galaxy Application of Next Generation Sequencing Technologies for Whole Transcriptome and Genome Analysis ABRF 2013 Saturday, March 2, 2013 Palm Springs,
Evoq 9 Content Managers Training Manual
 Evoq 9 Content Managers Training Manual Table of Contents Chapter 1: User Login... 2 User Login...2 User Login Screen...2 User Logout...2 Chapter 2: Navigating within Evoq 9...3 Editing Bar...3 Dashboard...4
Agilent Genomic Workbench Lite Edition 6.5
 Agilent Genomic Workbench Lite Edition 6.5 SureSelect Quality Analyzer User Guide For Research Use Only. Not for use in diagnostic procedures. Agilent Technologies Notices Agilent Technologies, Inc. 2010
Next generation Confirmation (NGC) module
 module") QUICK REFERENCE Next generation Confirmation (NGC) module Catalog Number A28221 Pub. No. MAN0015891 Rev. A.0 Product description The Applied Biosystems Next generation Confirmation (NGC) module analyzes
QUICK REFERENCE Next generation Confirmation (NGC) module Catalog Number A28221 Pub. No. MAN0015891 Rev. A.0 Product description The Applied Biosystems Next generation Confirmation (NGC) module analyzes
Get comfortable using computers
 Mouse A computer mouse lets us click buttons, pick options, highlight sections, access files and folders, move around your computer, and more. Think of it as your digital hand for operating a computer.
Welcome to MAPHiTS (Mapping Analysis Pipeline for High-Throughput Sequences) tutorial page.
 tutorial page.") Welcome to MAPHiTS (Mapping Analysis Pipeline for High-Throughput Sequences) tutorial page. In this page you will learn to use the tools of the MAPHiTS suite. A little advice before starting : rename your
Welcome to MAPHiTS (Mapping Analysis Pipeline for High-Throughput Sequences) tutorial page. In this page you will learn to use the tools of the MAPHiTS suite. A little advice before starting : rename your
sforce Web Services Enterprise API sforce Object Query Language sforce Custom Objects... 40
 Release Notes Winter 04 Major Announcements Dashboards... 2 Workflow Automation... 8 Advanced Page Layout Wizard... 12 Dynamic Page Layouts and Field-Level Security... 14 Team-Based Account Management...
How To: Run the ENCODE histone ChIP- seq analysis pipeline on DNAnexus
 How To: Run the ENCODE histone ChIP- seq analysis pipeline on DNAnexus Overview: In this exercise, we will run the ENCODE Uniform Processing ChIP- seq Pipeline on a small test dataset containing reads
Molecular Identifier (MID) Analysis for TAM-ChIP Paired-End Sequencing
 Analysis for TAM-ChIP Paired-End Sequencing") Molecular Identifier (MID) Analysis for TAM-ChIP Paired-End Sequencing Catalog Nos.: 53126 & 53127 Name: TAM-ChIP antibody conjugate Description Active Motif s TAM-ChIP technology combines antibody directed
Molecular Identifier (MID) Analysis for TAM-ChIP Paired-End Sequencing Catalog Nos.: 53126 & 53127 Name: TAM-ChIP antibody conjugate Description Active Motif s TAM-ChIP technology combines antibody directed
TECH NOTE Improving the Sensitivity of Ultra Low Input mrna Seq
 TECH NOTE Improving the Sensitivity of Ultra Low Input mrna Seq SMART Seq v4 Ultra Low Input RNA Kit for Sequencing Powered by SMART and LNA technologies: Locked nucleic acid technology significantly improves
Analyzing Variant Call results using EuPathDB Galaxy, Part II
 Analyzing Variant Call results using EuPathDB Galaxy, Part II In this exercise, we will work in groups to examine the results from the SNP analysis workflow that we started yesterday. The first step is
Cascade User Guide. Introduction. Key System Features. User Interface
 Cascade User Guide Introduction Key System Features User Interface Menus and Moving Through the System Files and Pages Working with Existing Pages File Action Menu Version Control Deleting files Restoring
Expression Analysis with the Advanced RNA-Seq Plugin
 Expression Analysis with the Advanced RNA-Seq Plugin May 24, 2016 Sample to Insight CLC bio, a QIAGEN Company Silkeborgvej 2 Prismet 8000 Aarhus C Denmark Telephone: +45 70 22 32 44 www.clcbio.com support-clcbio@qiagen.com
Microsoft Office SharePoint Reference Guide for Site Owners
 Microsoft Office SharePoint Reference Guide for Site Owners Table of Contents INTRODUCTION...3 REQUESTING A NEW SITE...3 FOLLOWING A SITE...4 NAVIGATION...5 LISTS AND LIBRARIES...6 ADDING PEOPLE TO A SITE...6
User s Guide. Using the R-Peridot Graphical User Interface (GUI) on Windows and GNU/Linux Systems
 on Windows and GNU/Linux Systems") User s Guide Using the R-Peridot Graphical User Interface (GUI) on Windows and GNU/Linux Systems Pitágoras Alves 01/06/2018 Natal-RN, Brazil Index 1. The R Environment Manager...
User s Guide Using the R-Peridot Graphical User Interface (GUI) on Windows and GNU/Linux Systems Pitágoras Alves 01/06/2018 Natal-RN, Brazil Index 1. The R Environment Manager...
 Information Technology Virtual EMS Help https://msum.bookitadmin.minnstate.edu/ For More Information Please contact Information Technology Services at support@mnstate.edu or 218.477.2603 if you have questions
ScholarOne Manuscripts. COGNOS Reports User Guide
 ScholarOne Manuscripts COGNOS Reports User Guide 1-May-2018 Clarivate Analytics ScholarOne Manuscripts COGNOS Reports User Guide Page i TABLE OF CONTENTS USE GET HELP NOW & FAQS... 1 SYSTEM REQUIREMENTS...
Microsoft Windows SharePoint Services
 Microsoft Windows SharePoint Services SITE ADMIN USER TRAINING 1 Introduction What is Microsoft Windows SharePoint Services? Windows SharePoint Services (referred to generically as SharePoint) is a tool
SharePoint 2010 Tutorial
 SharePoint 2010 Tutorial TABLE OF CONTENTS Introduction... 1 Basic Navigation... 2 Navigation Buttons & Bars... 3 Ribbon... 4 Library Ribbon... 6 Recycle Bin... 7 Permission Levels & Groups... 8 Create
Using Microsoft Word. Paragraph Formatting. Displaying Hidden Characters
 Using Microsoft Word Paragraph Formatting Every time you press the full-stop key in a document, you are telling Word that you are finishing one sentence and starting a new one. Similarly, if you press
User Guide. v Released June Advaita Corporation 2016
 User Guide v. 0.9 Released June 2016 Copyright Advaita Corporation 2016 Page 2 Table of Contents Table of Contents... 2 Background and Introduction... 4 Variant Calling Pipeline... 4 Annotation Information
Exeter Sequencing Service
 Exeter Sequencing Service A guide to your denovo RNA-seq results An overview Once your results are ready, you will receive an email with a password-protected link to them. Click the link to access your
EXCEL 2003 DISCLAIMER:
 EXCEL 2003 DISCLAIMER: This reference guide is meant for experienced Microsoft Excel users. It provides a list of quick tips and shortcuts for familiar features. This guide does NOT replace training or
QPCR User Guide. Version 1.8. Create Date Sep 25, 2007 Last modified Jan 26, 2010 by Stephan Pabinger
 User Guide Version 1.8 Create Date Sep 25, 2007 Last modified Jan 26, 2010 by Table of content Table of content... 2 1 Introduction... 4 1.1 Purpose... 4 1.2 Hints for using the software... 4 1.3 Example
These will serve as a basic guideline for read prep. This assumes you have demultiplexed Illumina data.
 These will serve as a basic guideline for read prep. This assumes you have demultiplexed Illumina data. We have a few different choices for running jobs on DT2 we will explore both here. We need to alter
Molecular Identifier (MID) Analysis for TAM-ChIP Paired-End Sequencing
 Analysis for TAM-ChIP Paired-End Sequencing") Molecular Identifier (MID) Analysis for TAM-ChIP Paired-End Sequencing Catalog Nos.: 53126 & 53127 Name: TAM-ChIP antibody conjugate Description Active Motif s TAM-ChIP technology combines antibody directed
Molecular Identifier (MID) Analysis for TAM-ChIP Paired-End Sequencing Catalog Nos.: 53126 & 53127 Name: TAM-ChIP antibody conjugate Description Active Motif s TAM-ChIP technology combines antibody directed
GenomeStudio Software Release Notes
 GenomeStudio Software 2009.2 Release Notes 1. GenomeStudio Software 2009.2 Framework... 1 2. Illumina Genome Viewer v1.5...2 3. Genotyping Module v1.5... 4 4. Gene Expression Module v1.5... 6 5. Methylation
Tutorial. OTU Clustering Step by Step. Sample to Insight. June 28, 2018
 OTU Clustering Step by Step June 28, 2018 Sample to Insight QIAGEN Aarhus Silkeborgvej 2 Prismet 8000 Aarhus C Denmark Telephone: +45 70 22 32 44 www.qiagenbioinformatics.com ts-bioinformatics@qiagen.com
srna Detection Results
 srna Detection Results Summary: This tutorial explains how to work with the output obtained from the srna Detection module of Oasis. srna detection is the first analysis module of Oasis, and it examines
Tumor-Specific NeoAntigen Detector (TSNAD) v2.0 User s Manual
 v2.0 User s Manual") Tumor-Specific NeoAntigen Detector (TSNAD) v2.0 User s Manual Zhan Zhou, Xingzheng Lyu and Jingcheng Wu Zhejiang University, CHINA March, 2016 USER'S MANUAL TABLE OF CONTENTS 1 GETTING STARTED... 1 1.1
Tumor-Specific NeoAntigen Detector (TSNAD) v2.0 User s Manual Zhan Zhou, Xingzheng Lyu and Jingcheng Wu Zhejiang University, CHINA March, 2016 USER'S MANUAL TABLE OF CONTENTS 1 GETTING STARTED... 1 1.1
see also:
 ESSENTIALS OF NEXT GENERATION SEQUENCING WORKSHOP 2014 UNIVERSITY OF KENTUCKY AGTC Class 3 Genome Assembly Newbler 2.9 Most assembly programs are run in a similar manner to one another. We will use the
Tutorial. OTU Clustering Step by Step. Sample to Insight. March 2, 2017
 OTU Clustering Step by Step March 2, 2017 Sample to Insight QIAGEN Aarhus Silkeborgvej 2 Prismet 8000 Aarhus C Denmark Telephone: +45 70 22 32 44 www.qiagenbioinformatics.com AdvancedGenomicsSupport@qiagen.com
Illumina Experiment Manager: Narration Transcript
 1 Illumina Experiment Manager: Transcript... 1 Illumina Experiment Manager: Transcript Welcome Course Navigation Course Objectives Overview Downloading the Software Sample Sheets and Sample Plates Terms
EXERCISE: GETTING STARTED WITH SAV
 Sequencing Analysis Viewer (SAV) Overview 1 EXERCISE: GETTING STARTED WITH SAV Purpose This exercise explores the following topics: How to load run data into SAV How to explore run metrics with SAV Getting
Peter Schweitzer, Director, DNA Sequencing and Genotyping Lab
 The instruments, the runs, the QC metrics, and the output Peter Schweitzer, Director, DNA Sequencing and Genotyping Lab Overview Roche/454 GS-FLX 454 (GSRunbrowser information) Evaluating run results Errors
ChIP-seq practical: peak detection and peak annotation. Mali Salmon-Divon Remco Loos Myrto Kostadima
 ChIP-seq practical: peak detection and peak annotation Mali Salmon-Divon Remco Loos Myrto Kostadima March 2012 Introduction The goal of this hands-on session is to perform some basic tasks in the analysis
On the Web sun.com/aboutsun/comm_invest STAROFFICE 8 DRAW
 STAROFFICE 8 DRAW Graphics They say a picture is worth a thousand words. Pictures are often used along with our words for good reason. They help communicate our thoughts. They give extra information that
Microsoft Office SharePoint. Reference Guide for Contributors
 Microsoft Office SharePoint Reference Guide for Contributors SharePoint: Reference Guide for Contributors Table of Contents INTRODUCTION... 3 FOLLOWING A SITE... 3 NAVIGATION... 4 LISTS AND LIBRARIES...
Sequence Preprocessing: A perspective
 Sequence Preprocessing: A perspective Dr. Matthew L. Settles Genome Center University of California, Davis settles@ucdavis.edu Why Preprocess reads We have found that aggressively cleaning and processing
Supplementary Figure 1. Fast read-mapping algorithm of BrowserGenome.
 Supplementary Figure 1 Fast read-mapping algorithm of BrowserGenome. (a) Indexing strategy: The genome sequence of interest is divided into non-overlapping 12-mers. A Hook table is generated that contains
Tutorial. Variant Detection. Sample to Insight. November 21, 2017
 Resequencing: Variant Detection November 21, 2017 Map Reads to Reference and Sample to Insight QIAGEN Aarhus Silkeborgvej 2 Prismet 8000 Aarhus C Denmark Telephone: +45 70 22 32 44 www.qiagenbioinformatics.com