Data Reduction in CrysAlis Pro
|
|
|
- Quentin Shannon Parrish
- 5 years ago
- Views:
Transcription


1 Data Reduction in CrysAlis Pro Daniel Baker Agilent Technologies UK Mathias Meyer Agilent Technologies Poland Oliver Presly Agilent Technologies UK
2 Layout Introduction: CrysAlis Pro overview Part I: Automatic data reduction Part II: Manual data reduction Part III: Refinalisation Part IV: Twin data reduction Part V: Protein data reduction Part VI: Advanced features (Incommensurate, HP, batch processing, synchrotron, external formats) Conclusion: Summary 2
3 Layout Introduction: CrysAlis Pro overview Part I: Automatic data reduction Part II: Manual data reduction Part III: Refinalisation Part IV: Twin data reduction Part V: Protein data reduction Part VI: Advanced features (Incommensurate, HP, batch processing, synchrotron, external formats) Conclusion: Summary 3


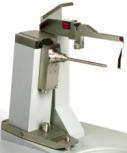


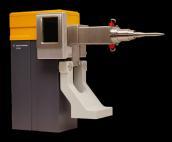


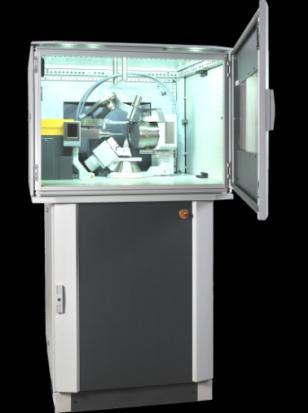


4 X-ray Product Configurations Modular Products - Tuned to Application 4-circle Goniometer X-ray Sources CCD Detectors 4


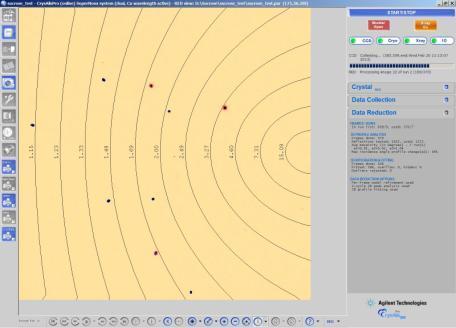
5 Crystallographic Software: CrysAlis Pro CrysAlis Pro has been designed to be as simple to use as possible: User friendly GUI Simple workflow Fully integrated platform Supporting SM and PX Highly automated......but full of manual features for those who want them SM PX 5


6 A Perfect Tool from Crystal to Structure! Mounting Screen/Pre Strategy Experiment Structure 6
7 Layout Introduction: CrysAlis Pro overview Part I: Automatic data reduction Part II: Manual data reduction Part III: Refinalisation Part IV: Twin data reduction Part V: Protein data reduction Part VI: Advanced features (Incommensurate, HP, batch processing, synchrotron, external formats) Conclusion: Summary 7
, processing information file (*.lst) and crystal summary info file (*.")
8 Automatic Data Reduction How it works Turns raw experimental data into a format that allows for structure solution and refinement Requires unit cell Produces reflection file (*.hkl), processing information file (*.lst) and crystal summary info file (*.sum) Uses unit cell to predict where peaks should appear on each frame Automatic profiling calculation followed by masking of peaks to collect intensity for.hkl file h k l F 2 obs sf 2 obs
 Excellent R int and R 1 with zero user")
9 Automatic Data Reduction Example Sucrose crystal 13 minute experiment Every 25 frames data reduction takes place AutoChem gets structure before experiment has finished (if installed) Excellent R int and R 1 with zero user intervention 9
10 Automatic Data Reduction Example Automatic data reduction and structure solution R 1 = 2.86% R int = 1.40% R int = 1.48% R 1 = 2.22% I/s =
11 Automatic vs. Manual Data Reduction Why do a manual data reduction? Can do concurrent automatic processing of twins or incommensurate structures Can visually analyse any diffuse scatter present Can apply additional corrections to improve data Presence of weakly-diffracting peaks may make automatic selection of space group difficult e.g. weak superstructure reflections Sometimes the user knows best! 11
12 Layout Introduction: CrysAlis Pro overview Part I: Automatic data reduction Part II: Manual data reduction Part III: Refinalisation Part IV: Twin data reduction Part V: Protein data reduction Part VI: Advanced features (Incommensurate, HP, batch processing, synchrotron, external formats) Conclusion: Summary 12

13 Manual Data Reduction Introduction CrysAlis Pro allows the user full control of the data reduction procedure Data reduction wizard steps the user through the various steps 13


14 Manual Data Reduction Inputs View orientation matrix for unit cell to be used Twin/incommensurate features Quasi-crystals 14

15 Manual Data Reduction Inputs Choose which runs to use for data reduction 15
 Sample slippage Access to special")
16 Manual Data Reduction Reflection model & special options Automatic model refinement Sample wobbling (cold stream) Sample slippage Access to special parameters 16


17 Manual Data Reduction Model refinement options No need to decide now program does it for you! PROFFIT For every run Global cell & model refinement Per-run refinement Per-frame refinement Model 1 Model 2 Prediction accuracy evaluation Prediction accuracy evaluation Choose more accurate approach Integration Frame1 Frame2 17


18 Manual Data Reduction Sample slippage example Superficially gives impression of twin Twin indexing matches 96.8% of reflections but twin integration doesn t help 18 7/4/2013


19 Manual Data Reduction Sample slippage example 19 7/4/2013


20 Manual Data Reduction Sample slippage example 20 7/4/2013
 R int (%) 1.6 14.7 1.6 I/σ 22.0 5.0 22.9 R 1 (%) 3.32 43.88 3.46 Comp (%) 98.5 95.2% 98.")
21 Manual Data Reduction Sample slippage example No slip Intentional sample slip Reference data Slip Data (Pre-Treatment) Slip Data (Post-Treatment) R int (%) I/σ R 1 (%) Comp (%) % 98.4% 21 7/4/2013


22 Manual Data Reduction Reflection model & special options Several special features for: Weak samples adjust masks according to prediction uncertainty Twin data Increase/decrease mask size Protein Single wavelength only integration High pressure Bad profile rejection Also useful for twins, multicrystals, iced samples, SM/PX etc. 22
 for samples with varying background features Can t be used for twin data")
23 Manual Data Reduction Background correction Choice of background correction: Average background Define range and frequency Smart background Combination of local and average background Improves statistics (I/s) for samples with varying background features Can t be used for twin data (yet ) 23


24 Manual Data Reduction Background correction example 100μm Well-mounted sample Standard peak-hunting produces many non-lattice peaks. 100μm Intentionally badly-mounted sample 24 7/4/2013
25 Manual Data Reduction Background correction example Well-mounted Badly-mounted Reference Data Auto analysis Smart Background Time 3h 8m 16h 18m 16h 18m Diff. Limit R int (%) I/σ R 1 (%) Comp (%) /4/2013

26 Space Group Determination (GRAL) Monoclinic cell choices Automatic selection from 3 possible cell choices for particular monoclinic space groups (GRAL) - In Auto mode, a setting with β angle closest to 90 is selected - In Interactive mode, all 3 choices are presented with the same default as in Auto mode 26

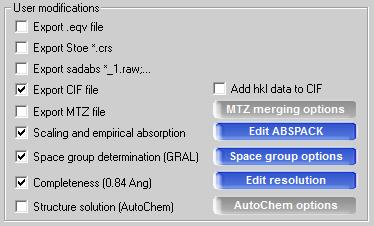
27 Data Reduction Tab Summary of information regarding the data reduction process Shortcuts to Frame/run list, absorption options window, and space group options Information updates after every automatic data reduction cycle during experiment, or after any manual re-finalisation 27

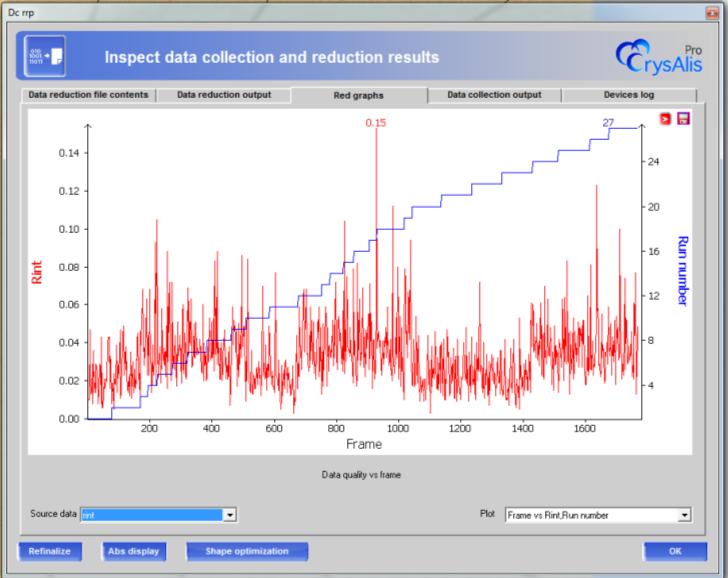
28 Data Reduction Output 28

29 Data Reduction Output graphs Scale factor Sample temperature 29
30 Layout Introduction: CrysAlis Pro overview Part I: Automatic data reduction Part II: Manual data reduction Part III: Refinalisation Part IV: Twin data reduction Part V: Protein data reduction Part VI: Advanced features (Incommensurate, HP, batch processing, synchrotron, external formats) Conclusion: Summary 30

31 Refinalisation Introduction Refinalisation is a repeat of the finalisation step of the data reduction Able to apply several additional corrections Absorption Filters Resolution Space group change 31

32 Refinalisation Face-indexing Two different methods (point or drag) to quickly draw shape of crystal Video guide coming soon on user forum 32


33 Refinalisation Absorption correction No problem running large crystal with micro-focus source 33

34 Refinalisation ABSPACK 34


35 Refinalisation Filters Main filters: R int / d-spacing / I/s Used to remove outliers and improve data 35

36 Refinalisation New window teaser 36
37 Layout Introduction: CrysAlis Pro overview Part I: Automatic data reduction Part II: Manual data reduction Part III: Refinalisation Part IV: Twin data reduction Part V: Protein data reduction Part VI: Advanced features (Incommensurate, HP, batch processing, synchrotron, external formats) Conclusion: Summary 37

38 Twin Data Reduction Introduction 53% indexed as single crystal 91% indexed as twin Software recognises that sample is modelled as twin 38
39 Twin Data Refinalisation Example HKLF4 no twin modelling R int = 4.15% R 1 = 14.29% HKLF5 twin data reduction R int = 3.9% R 1 = 4.52% I/s = 11.1 I/s =


 4:00 pm CET")
40 Twinning and Incommensurate Data Processing in CrysAlis Pro Dr Fraser White Agilent Technologies UK September 18 th :00 am ET (Americas) 4:00 pm CET (Europe)
41 Layout Introduction: CrysAlis Pro overview Part I: Automatic data reduction Part II: Manual data reduction Part III: Refinalisation Part IV: Twin data reduction Part V: Protein data reduction Part VI: Advanced features (Incommensurate, HP, batch processing, synchrotron, external formats) Conclusion: Summary 41


42 Protein Data Reduction CrysAlis Pro has a dedicated PX mode for running protein experiments Extra features specifically for protein samples.mtz files A/B scale factors Import/export of data 42


43 Protein Data Reduction A/B-factor refinement F2 New correction in ABSPACK Designed for correcting crystal decay in time Added extra factor to ABSPACK scaling model: Theta CrysAlis Pro only! 43
44 Protein Data Reduction A/B-factor refinement A/B-coefficients plots show decay of the sample Example from beamline protein data B A No decay correction With decay correction 44
45 Protein Data Reduction A/B-factor refinement Unexpected usefulness for some high theta small molecule data: can correct for some resolution-dependent effects, e.g. prediction uncertainty at high angle Without B-factor With B-factor R % 3.77% R int 7.5% 7.2% 45
46 Layout Introduction: CrysAlis Pro overview Part I: Automatic data reduction Part II: Manual data reduction Part III: Refinalisation Part IV: Twin data reduction Part V: Protein data reduction Part VI: Advanced features (Incommensurate, HP, batch processing, synchrotron, external formats) Conclusion: Summary 46


47 Advanced Features Incommensurates Output a.hklmno file for structure solution in external programs More in the next webinar! 47


48 Advanced Features High pressure Designed primarily for high-pressure data for filtering out reflections overlapped by diamond diffraction spots 48
 9% Profile agreement No filter Profile agreement = 0.")
49 Advanced Features High pressure Example HP data: Structure unsolvable although data seem to be of sufficient quality (R int ) After filtering structure solved no. of reflections No filtering With filtering R int 6.4% 10% R 1 34% (no structure) 9% Profile agreement No filter Profile agreement = 0.8 I/s= 10 With filter Higher value for R int after filtering! Diamond reflections are symmetrically equivalent and falsify R int value. Standard outlier rejection filter fails. 49

 50")
50 Bad Profile Rejection SM example Simulation of cryo-failure (shield flow turned off) 50 7/4/2013
51 Bad Profile Rejection SM example No ice Large ice build-up Reference Data Auto analysis d range and run Filtering Bad profile filtering R int (%) I/σ R 1 (%) Comp (%) /4/2013

52 Advanced Features Batch processing Multi-temperature experiments problem there are many data sets to process 52

53 Advanced Features Batch processing XX PROFFITBATCH Browse for the folder Set PROFFIT parameters Click Finish A script proffitbatch.mac gets created in the directory selected at the start You can edit it or run as is using SCRIPT command 53

54 Advanced Features Synchrotron/External frame formats Massive dataset from synchrotron: 4 runs of 10,000 images each; making a total of 40,000 images Possible to read in a large variety of external frame formats into CrysAlis Pro Full auto-analysis on protein sample successful even with very small diffraction spots More details on Protein Webinar and future applications note! 54
55 Layout Introduction: CrysAlis Pro overview Part I: Automatic data reduction Part II: Manual data reduction Part III: Refinalisation Part IV: Twin data reduction Part V: Protein data reduction Part VI: Advanced features (Incommensurate, HP, batch processing, synchrotron, external formats) Conclusion: Summary 55
56 Summary Automatic data reduction during experiment Full override control in manual mode Fully accessible statistics from tables and graphs Easy-to-use face-indexing tool Many options in data reduction and re-finalisation to improve data quality Can handle twins, incommensurates, HP data, SM, PX, synchrotron etc. Outputs everything you need for structure solution/refinement Read in many external formats Come along to the Agilent booth at the ACA in Hawaii we can process your data for you with our software Constantly being updated and improved 56

57 Software Updates CrysAlis Pro is frequently updated with fixes for known problems New features are introduced in annual major updates All updates are Free and available from our user forum, Free multi-user, multi-site license 57


58 Q&A New applications note on data recovery Go to and click on the Library tab, and the Literature link. Search for CrysAlisPro to find relevant app notes Please type your question into the chat box. Send a direct chat to the Host which is private, or a chat to All Participants which is public 58


59 Thank you for listening! All feedback and comments are welcome The live CrysAlis Pro Webinar series continues on September 18 th 2013 Register at: 59
CrysAlis Pro Proteins, Large Unit Cells and Difficult Data Sets
 CrysAlis Pro Proteins, Large Unit Cells and Difficult Data Sets Tadeusz Skarzynski Agilent Technologies UK Mathias Meyer Agilent Technologies Poland Oliver Presly Agilent Technologies UK Seminar Layout
CrysAlis Pro. User Manual. Data Collection and Processing Software for Agilent X-ray Diffractometers
 Data Collection and Processing Software for Agilent X-ray Diffractometers User Manual Read the main diffractometer user manual, in particular the Health and Safety information, before operating with the
Apex 3/D8 Venture Quick Guide
 Apex 3/D8 Venture Quick Guide Login Sample Login Enter in Username (group name) and Password Create New Sample Sample New Enter in sample name, be sure to check white board or cards to establish next number
proteindiffraction.org Select
 This tutorial will walk you through the steps of processing the data from an X-ray diffraction experiment using HKL-2000. If you need to install HKL-2000, please see the instructions at the HKL Research
Twins? and TwinSolve
 Twins? and TwinSolve Joseph D. Ferrara, Ph. D. CSO, RAC, USA VP XRL, RC, Japan Copyright 2013 Rigaku Corporation and its Global Subsidiaries. All Rights Reserved. Acknowledgements Pat Carroll, University
1
 In the following tutorial we will determine by fitting the standard instrumental broadening supposing that the LaB 6 NIST powder sample broadening is negligible. This can be achieved in the MAUD program
Collect and Reduce Intensity Data -- APEX
 Collect and Reduce Intensity Data -- APEX General Steps in Collecting Intensity Data Note that the steps outlined below are generally followed when using all modern automated diffractometers, regardless
BCH 6744C: Macromolecular Structure Determination by X-ray Crystallography. Practical 3 Data Processing and Reduction
 BCH 6744C: Macromolecular Structure Determination by X-ray Crystallography Practical 3 Data Processing and Reduction Introduction The X-ray diffraction images obtain in last week s practical (P2) is the
SUPPLEMENTARY INFORMATION
 doi:10.1038/nature09750 "#$%&'($)* #+"%%*,-.* /&01"2*$3* &)(4&"* 2"3%"5'($)#* 6&%'(7%(5('8* 9$07%"'": )"##*,;.*
Collect and Reduce Intensity Data Photon II
 Collect and Reduce Intensity Data Photon II General Steps in Collecting Intensity Data Note that the steps outlined below are generally followed when using all modern automated diffractometers, regardless
Rietveld refinements collection strategies!
 Rietveld refinements collection strategies! Luca Lutterotti! Department of Materials Engineering and Industrial Technologies! University of Trento - Italy! Quality of the experiment! A good refinement,
Fundamentals of Rietveld Refinement III. Additional Examples
 Fundamentals of Rietveld Refinement III. Additional Examples An Introduction to Rietveld Refinement using PANalytical X Pert HighScore Plus v3.0d Scott A Speakman, Ph.D. MIT Center for Materials Science
Data Processing with XDS
 WIR SCHAFFEN WISSEN HEUTE FÜR MORGEN Dr. Tim Grüne :: Paul Scherrer Institut :: tim.gruene@psi.ch Data Processing with XDS CCP4 / APS School Chicago 2017 19 th June 2017 1 - X-ray Diffraction in a Nutshell
Twinning. Zaragoza Andrea Thorn
 Twinning Zaragoza 2012 Andrea Thorn OVERVIEW Introduction: Definitions, origins of twinning Merohedral twins: Recognition, statistical analysis: H plot, Yeates-Padilla plot Example Refinement and R values
Recent developments in TWINABS
 Recent developments in TWINABS Göttingen, April 19th 2007 George M. Sheldrick, Göttingen University http://shelx.uni-ac.gwdg.de/shelx/ Strategy for twinned crystals 1. Find orientation matrices for all
Advanced Crystal Structure Analysis Using XDS with Small Molecule Data. Tim Grüne Georg-August-Universität Institut für Strukturchemie
 Advanced Crystal Structure Analysis Using XDS with Small Molecule Data Tim Grüne Georg-August-Universität Institut für Strukturchemie tt s 1 7t tg@shelx.uni-ac.gwdg.de November 13, 2013 Tim Grüne XDS:
Fundamentals of Rietveld Refinement III. Refinement of a Mixture
 Fundamentals of Rietveld Refinement III. Refinement of a Mixture An Introduction to Rietveld Refinement using PANalytical X Pert HighScore Plus v3.0e Scott A Speakman, Ph.D. MIT Center for Materials Science
Fundamentals of Rietveld Refinement II. Refinement of a Single Phase
 Fundamentals of Rietveld Refinement II. Refinement of a Single Phase An Introduction to Rietveld Refinement using PANalytical X Pert HighScore Plus v3.0a Scott A Speakman, Ph.D. MIT Center for Materials
Introduction to XDisp Qt The New HKL-2000 and HKL-3000 Diffraction Image Display
 Introduction to XDisp Qt The New HKL-2000 and HKL-3000 Diffraction Image Display HKL-2000 and HKL-3000 have a new, sleeker way of displaying your diffraction data, because HKL is now distributed with XDisp
HKL2000. Data processing X-ray data processing = changing detector output to estimate of square of structure factors amplitudes
 HKL000 Dominika Borek UT Southwestern Medical Center at Dallas Data processing X-ray data processing = changing detector output to estimate of square of structure factors amplitudes F Data processing in
Data Processing with XDS
 WIR SCHAFFEN WISSEN HEUTE FÜR MORGEN Dr. Tim Grüne :: Paul Scherrer Institut :: tim.gruene@psi.ch Data Processing with XDS 2017 30 th November 2017 1 - Quick Start on XDS 30 th November 2017 Data Processing
Table S1 Comparison of CypA observed Bragg data vs. calculated from Normal Modes.
 Table S1 Comparison of CypA observed Bragg data vs. calculated from Normal Modes. Resolution (Å) R-factor CC 44.560-11.070 0.5713 0.4144 11.070-8.698 0.3325 0.6957 8.697-6.834 0.2987 0.7324 6.831-5.369
X-ray Powder Diffraction
 X-ray Powder Diffraction Chemistry 754 Solid State Chemistry Lecture #8 April 15, 2004 Single Crystal Diffraction Diffracted Beam Incident Beam Powder Diffraction Diffracted Beam Incident Beam In powder
Multivariate Calibration Quick Guide
 Last Updated: 06.06.2007 Table Of Contents 1. HOW TO CREATE CALIBRATION MODELS...1 1.1. Introduction into Multivariate Calibration Modelling... 1 1.1.1. Preparing Data... 1 1.2. Step 1: Calibration Wizard
PETS process electron tilt series: a brief tutorial
 PETS process electron tilt series: a brief tutorial 1. Introduction PETS is a program for processing a series of diffraction images. It is intended for electron diffraction. In principle it could be used
LECTURE 15. Dr. Teresa D. Golden University of North Texas Department of Chemistry
 LECTURE 15 Dr. Teresa D. Golden University of North Texas Department of Chemistry Typical steps for acquisition, treatment, and storage of diffraction data includes: 1. Sample preparation (covered earlier)
Using APEX2 to Analyze Twinned Crystals
 Using APEX2 to Analyze Twinned Crystals Bruce Noll Michael Ruf Tuesday, May 3, 2011 Senior Application scientist Product Manager Crystallography Innovation with Integrity Welcome What are twins? Types
CCP4-BGU workshop 2018 The X-ray Diffraction Experiment Diffraction Geometry and Data Collection Strategy. Andrew GW Leslie, MRC LMB, Cambridge, UK
 CCP4-BGU workshop 2018 The X-ray Diffraction Experiment Diffraction Geometry and Data Collection Strategy Andrew GW Leslie, MRC LMB, Cambridge, UK Definition of a crystal and the unit cell Crystal: An
Chromeleon software orientation
 Chromeleon software orientation Upon opening of Chromeleon shortcut, a blue screen should appear (called control panel). If this does not occur, the green circled shortcut will open this screen. To ensure
ANOMALOUS SCATTERING FROM SINGLE CRYSTAL SUBSTRATE
 177 ANOMALOUS SCATTERING FROM SINGLE CRYSTAL SUBSTRATE L. K. Bekessy, N. A. Raftery, and S. Russell Faculty of Science, Queensland University of Technology, GPO Box 2434, Brisbane, Queensland, Australia
Twinning OVERVIEW. CCP4 Fukuoka Is this a twin? Definition of twinning. Andrea Thorn
 OVERVIEW CCP4 Fukuoka 2012 Twinning Andrea Thorn Introduction: Definitions, origins of twinning Merohedral twins: Recognition, statistical analysis: H plot, Yeates-Padilla plot Example Refinement and R
How to Analyze Materials
 INTERNATIONAL CENTRE FOR DIFFRACTION DATA How to Analyze Materials A PRACTICAL GUIDE FOR POWDER DIFFRACTION To All Readers This is a practical guide. We assume that the reader has access to a laboratory
X-ray Diffraction from Materials
 X-ray Diffraction from Materials 2008 Spring Semester Lecturer; Yang Mo Koo Monday and Wednesday 14:45~16:00 8. Experimental X-ray Diffraction Procedures 8.1 Diffraction Experiments using Films 8.1.1 Laue
3.014 Derivative Structures Data Analysis using PANalytical X Pert HighScore Plus v3.0
 3.014 Derivative Structures Data Analysis using PANalytical X Pert HighScore Plus v3.0 For most analyses, you will need to open the data and the corresponding entry in the reference database. You will
Praticals : Absorption Correction : J. Reibenspies V 1.1_2009
 Praticals : Absorption Correction : J. Reibenspies V 1.1_2009 Files required *.RAW -- data*m.raw Start : Command Line : type sadabs APEXII : SCALE Command Line : SADABS -- Instructions --- Beginner Notes
Crystallography & Cryo-electron microscopy
 Crystallography & Cryo-electron microscopy Methods in Molecular Biophysics, Spring 2010 Sample preparation Symmetries and diffraction Single-particle reconstruction Image manipulation Basic idea of diffraction:
Data scaling with the Bruker programs SADABS and TWINABS
 Data scaling with the Bruker programs SADABS and TWINABS ACA Philadelphia, July 28 th 2015 George M. Sheldrick http://shelx.uni-ac.gwdg.de/shelx/ SADABS strategy 1. Determine scaling and absorption parameters
Data integration and scaling
 Data integration and scaling Harry Powell MRC Laboratory of Molecular Biology 3rd February 2009 Abstract Processing diffraction images involves three basic steps, which are indexing the images, refinement
MOSFLM tutorial for the new Interface
 1. Introduction MOSFLM tutorial for the new Interface 1.1 Background MOSFLM can process diffraction images from a wide range of detectors and produces, as output, an MTZ file of reflection indices with
automated collection of data (DNA) Software Package
 Software Package") automated collection of data (DNA) Software Package A quick tutorial for version 1.1 23.05.2007 Evangelia Kapetaniou 1, Kristian Koski 2, Kyriakos Petratos 1, Rikkert Wierenga 2 1 IMBB, FORTH, Heraklion,
automated collection of data (DNA) Software Package A quick tutorial for version 1.1 23.05.2007 Evangelia Kapetaniou 1, Kristian Koski 2, Kyriakos Petratos 1, Rikkert Wierenga 2 1 IMBB, FORTH, Heraklion,
Tutorial: Crystal structure refinement of oxalic acid dihydrate using GSAS
 Tutorial: Crystal structure refinement of oxalic acid dihydrate using GSAS The aim of this tutorial is to use GSAS to locate hydrogen in oxalic acid dihydrate and refine the crystal structure. By no means
3.014 Short Range Order Data Analysis using PANalytical X Pert HighScore Plus v3.0
 3.014 Short Range Order Data Analysis using PANalytical X Pert HighScore Plus v3.0 1) Before using the program HighScore Plus to analyze your data, you need to copy data from the instrument computer to
Chapter 6 : Results and Discussion
 Refinement and Verification of the Virginia Tech Doppler Global Velocimeter (DGV) 86 Chapter 6 : Results and Discussion 6.1 Background The tests performed as part of this research were the second attempt
To Plot a Graph in Origin. Example: Number of Counts from a Geiger- Müller Tube as a Function of Supply Voltage
 To Plot a Graph in Origin Example: Number of Counts from a Geiger- Müller Tube as a Function of Supply Voltage 1 Digression on Error Bars What entity do you use for the magnitude of the error bars? Standard
cief Data Analysis Chapter Overview Chapter 12:
 page 285 Chapter 12: cief Data Analysis Chapter Overview Analysis Screen Overview Opening Run Files How Run Data is Displayed Viewing Run Data Data Notifications and Warnings Checking Your Results Group
v Importing Rasters SMS 11.2 Tutorial Requirements Raster Module Map Module Mesh Module Time minutes Prerequisites Overview Tutorial
 v. 11.2 SMS 11.2 Tutorial Objectives This tutorial teaches how to import a Raster, view elevations at individual points, change display options for multiple views of the data, show the 2D profile plots,
Lesson 6 Profex Graphical User Interface for BGMN and Fullprof
 Lesson 6 Profex Graphical User Interface for BGMN and Fullprof Nicola Döbelin RMS Foundation, Bettlach, Switzerland June 07 09, 2017, Oslo, N Background Information Developer: License: Founded in: 2003
Cover Page. The handle holds various files of this Leiden University dissertation
 Cover Page The handle http://hdl.handle.net/1887/48877 holds various files of this Leiden University dissertation Author: Li, Y. Title: A new method to reconstruct the structure from crystal images Issue
ACCURATE TEXTURE MEASUREMENTS ON THIN FILMS USING A POWDER X-RAY DIFFRACTOMETER
 ACCURATE TEXTURE MEASUREMENTS ON THIN FILMS USING A POWDER X-RAY DIFFRACTOMETER MARK D. VAUDIN NIST, Gaithersburg, MD, USA. Abstract A fast and accurate method that uses a conventional powder x-ray diffractometer
DETERMINATION OF THE ORIENTATION OF AN EPITAXIAL THIN FILM BY A NEW COMPUTER PROGRAM CrystalGuide
 The Rigaku Journal Vol. 16/ number 1/ 1999 Technical Note DETERMINATION OF THE ORIENTATION OF AN EPITAXIAL THIN FILM BY A NEW COMPUTER PROGRAM CrystalGuide R. YOKOYAMA AND J. HARADA X-Ray Research Laboratory,
Natl. Cancer Inst. & Argonne Natl. Lab
 CCP4/GMCA Workshop 6/200 Data collec ction strategy Zbigniew Dauter Natl. Cancer Inst. & Argonne Natl. Lab Advance preparations 1. Crystals must be prepared p 2. You must be prepared Advance preparations
Using Optical Character Recognition on Scanned Text
 Using Optical Character Recognition on Scanned Text This document describes how to use the optical character recognition software OmniPage Professional 15 to convert scanned documents into computer-editable
Thin film solar cell simulations with FDTD
 Thin film solar cell simulations with FDTD Matthew Mishrikey, Prof. Ch. Hafner (IFH) Dr. P. Losio (Oerlikon Solar) 5 th Workshop on Numerical Methods for Optical Nano Structures July 7 th, 2009 Problem
The PLATON/TwinRotMat Tool for Twinning Detection
 The PLATON/TwinRotMat Tool for Twinning Detection Ton Spek National Single Crystal Service Facility, Utrecht University, The Netherlands. Delft, 29-Sept-2008 Viewpoints on Twinning (I) Macroscopic - Mineralogy
GOOGLE APPS. If you have difficulty using this program, please contact IT Personnel by phone at
 : GOOGLE APPS Application: Usage: Program Link: Contact: is an electronic collaboration tool. As needed by any staff member http://www.google.com or http://drive.google.com If you have difficulty using
Agilent CytoGenomics 2.0 Feature Extraction for CytoGenomics
 Agilent CytoGenomics 2.0 Feature Extraction for CytoGenomics Quick Start Guide What is Agilent Feature Extraction for CytoGenomics software? 2 Getting Help 4 Starting the program 6 Setting up a Standard
LECTURE 16. Dr. Teresa D. Golden University of North Texas Department of Chemistry
 LECTURE 16 Dr. Teresa D. Golden University of North Texas Department of Chemistry A. Evaluation of Data Quality An ICDD study found that 50% of x-ray labs overestimated the accuracy of their data by an
PANALYTICAL X PERT PRO XRD
 STANDARD OPERATING PROCEDURE: PANALYTICAL X PERT PRO XRD Purpose of this Instrument: Identification of signal-phase materials and multi-phase mixture; Quantitative determination of amounts of different
Using HKL3000R for Data Collection
 Using HKL3000R for Data Collection Hardware Note Our system has a Rigaku microfocus generator (MicroMax-007HF), great Osmic optics (Varimax HF) and, in addition to the traditional R-Axis IV++ image plate
Modeling Custom Surface Roughness with LucidShape 2D Scatter Curve BSDF Material
 WHITE PAPER Modeling Custom Surface Roughness with LucidShape 2D Scatter Curve BSDF Material Author Andreas Bielawny, Ph.D. CAE Synopsys, Inc. Abstract LucidShape accurately simulates how light interacts
Single crystal X-ray diffractometer. The World s Fastest Diffractometer
 Single crystal X-ray diffractometer The World s Fastest Diffractometer The World s Fastest Diffractom Weak and strong refl ections can be measured simultaneously on the same frame, thus reducing overall
Crystal Quality Analysis Group
 Crystal Quality Analysis Group Contents Contents 1. Overview...1 2. Measurement principles...3 2.1 Considerations related to orientation and diffraction conditions... 3 2.2 Rocking curve measurement...
1. Introduction 1 2. Starting the SAED pattern indexing 1 3. Analyzing the indexing solutions 8 4. Remarks 10 Contents
 SAED PATTERN INDEXING USING JEMS P. STADELMANN CIME-EPFL STATION 12 CH-1015 LAUSANNE SWITZERLAND 1. Introduction 1 2. Starting the SAED pattern indexing 1 3. Analyzing the indexing solutions 8 4. Remarks
PaNSIG (PaNData), and the interactions between SB-IG and PaNSIG
, and the interactions between SB-IG and PaNSIG") PaNSIG (PaNData), and the interactions between SB-IG and PaNSIG Erica Yang erica.yang@stfc.ac.uk Scientific Computing Department STFC Rutherford Appleton Laboratory Structural Biology IG 27 March 2014
PaNSIG (PaNData), and the interactions between SB-IG and PaNSIG Erica Yang erica.yang@stfc.ac.uk Scientific Computing Department STFC Rutherford Appleton Laboratory Structural Biology IG 27 March 2014
Diffraction geometry and integration of diffraction images
 Diffraction geometry and integration of diffraction images Phil Evans Okinawa December 2011 MRC Laboratory of Molecular Biology Cambridge UK Integration h k l I σ(i)... Image series Reflection intensity
General Information. Hardware and software environment. The program runs on any PC. Operating systems: Windows, Linux and Macintosh (Mac OS)
") General Information XBroad is public domain program designed for easy-to-use determination of basic microstructural information from XRD powder data. Nowadays, preparation of nanomaterials with controlled
General Information XBroad is public domain program designed for easy-to-use determination of basic microstructural information from XRD powder data. Nowadays, preparation of nanomaterials with controlled
Fast, Intuitive Structure Determination II: Crystal Indexing and Data Collection Strategy. April 2,
 Fast, Intuitive Structure Determination II: Crystal Indexing and Data Collection Strategy April 2, 2013 1 Welcome I I Dr. Michael Ruf Product Manager Crystallography Bruker AXS Inc. Madison, WI, USA Bruce
Experiment 5: Polarization and Interference
 Experiment 5: Polarization and Interference Nate Saffold nas2173@columbia.edu Office Hour: Mondays, 5:30PM-6:30PM @ Pupin 1216 INTRO TO EXPERIMENTAL PHYS-LAB 1493/1494/2699 Introduction Outline: Review
Manual for the MAPS software package
 Manual for the MAPS software package Stefan Vogt*, Martin de Jonge, Barry Lai, Joerg Maser X-ray Science Division \ Advanced Photon Source Argonne National Laboratory * vogt@aps.anl.gov Last update of
Martin Dove s RMC Workflow Diagram
 Martin Dove s RMC Workflow Diagram Erica Yang e-science centre Rutherford Appleton Laboratory Science and Technology Facilities Council (erica.yang@stfc.ac.uk) July 7, 2010 1 Background The RMC diagram,
PROTEUM3 Software. User Manual. Innovation with Integrity SC-XRD. Part Number: DOC-M86-EXX242 V1 Publication Date: 06 June 2017
 PROTEUM3 Software User Manual Part Number: DOC-M86-EXX242 V1 Publication Date: 06 June 2017 Innovation with Integrity SC-XRD PROTEUM3 User Manual This document covers the PROTEUM3 software suite. References
MOSFLM tutorial for the new Interface
 MOSFLM tutorial for the new Interface 1. Introduction 1.1 Background MOSFLM can process diffraction images from a wide range of detectors and produces, as output, an MTZ file of reflection indices with
Structure-Reactivity Relationships of Zwitterionic 1,3-Diaza-Claisen Rearrangements. Supporting Information
 Structure-Reactivity Relationships of Zwitterionic 1,3-Diaza-Claisen Rearrangements Rachel A. Potter, Amy Bowser, Yanbo Yang and José S. Madalengoitia, * Joseph W. Ziller * Department of Chemistry, University
Quantification and Processing of SAED Pattern. (QSAED3d) User s manual. X.Z. LI, Ph. D. (November 27, 2017)
 User s manual. X.Z. LI, Ph. D. (November 27, 2017)") Quantification and Processing of SAED Pattern (QSAED3d) User s manual X.Z. LI, Ph. D (November 27, 2017) Copyright 2011-2017 LANDYNE All Right Reserved 1 Contents 1. Introduction... 3 1.1 Version history...
Quantification and Processing of SAED Pattern (QSAED3d) User s manual X.Z. LI, Ph. D (November 27, 2017) Copyright 2011-2017 LANDYNE All Right Reserved 1 Contents 1. Introduction... 3 1.1 Version history...
Chapter 7 Inserting Spreadsheets, Charts, and Other Objects
 Impress Guide Chapter 7 Inserting Spreadsheets, Charts, and Other Objects OpenOffice.org Copyright This document is Copyright 2007 by its contributors as listed in the section titled Authors. You can distribute
Preparing for remote data collection at NE-CAT
 Preparing for remote data collection at NE-CAT Important Note: The beamtime and remote login privileges are intended just for you and your group. You are not allowed to share these with any other person
Class 11 Introduction to Surface BRDF and Atmospheric Scattering. Class 12/13 - Measurements of Surface BRDF and Atmospheric Scattering
 University of Maryland Baltimore County - UMBC Phys650 - Special Topics in Experimental Atmospheric Physics (Spring 2009) J. V. Martins and M. H. Tabacniks http://userpages.umbc.edu/~martins/phys650/ Class
Note: Act Today provide this KB article as a courtesy however accept no responsibility for content or the recipient performing these steps
 Note: Act Today provide this KB article as a courtesy however accept no responsibility for content or the recipient performing these steps How To Download and Apply Sage ACT! 2011 Premium Service Pack
Grazing Angle 2 Theta Phase Analysis
 Page 1 of 7 Grazing Angle 2 Theta Phase Analysis 1. Log into the User Log System on the SMIF web site Hardware Setup X-Ray Tube The line focus configuration of the x-ray tube is used. This is the default
Agilent MassHunter Workstation Software Report Designer Add-in
 Agilent MassHunter Workstation Software Report Designer Add-in Quick Start Guide What is the Agilent MassHunter Workstation Software Report Designer Add-in? 2 Report Designer UI elements 3 Getting Started
0 Graphical Analysis Use of Excel
 Lab 0 Graphical Analysis Use of Excel What You Need To Know: This lab is to familiarize you with the graphing ability of excels. You will be plotting data set, curve fitting and using error bars on the
Machine Learning : supervised versus unsupervised
 Machine Learning : supervised versus unsupervised Neural Networks: supervised learning makes use of a known property of the data: the digit as classified by a human the ground truth needs a training set,
Fundamentals of Rietveld Refinement II. Refinement of a Single Phase
 Fundamentals of Rietveld Refinement II. Refinement of a Single Phase An Introduction to Rietveld Refinement using PANalytical X Pert HighScore Plus v3.0e Scott A Speakman, Ph.D. MIT Center for Materials
Assessing the homo- or heterogeneity of noisy experimental data. Kay Diederichs Konstanz, 01/06/2017
 Assessing the homo- or heterogeneity of noisy experimental data Kay Diederichs Konstanz, 01/06/2017 What is the problem? Why do an experiment? because we want to find out a property (or several) of an
Supplementary Figure S1. 19 F NMR spectra of the reaction of 5e with XeF 2 in toluene-d 8.
 Supplementary Figure S1. 19 F NMR spectra of the reaction of 5e with XeF 2 in toluene-d 8. Supplementary Figure S2. 31 P NMR spectra of 5e and the reaction of 5e with XeF 2 in toluene-d 8. Supplementary
Lecture 3: Geometric and Signal 3D Processing (and some Visualization)
") Lecture 3: Geometric and Signal 3D Processing (and some Visualization) Chandrajit Bajaj Algorithms & Tools Structure elucidation: filtering, contrast enhancement, segmentation, skeletonization, subunit
Lecture 3: Geometric and Signal 3D Processing (and some Visualization) Chandrajit Bajaj Algorithms & Tools Structure elucidation: filtering, contrast enhancement, segmentation, skeletonization, subunit
Condenser Optics for Dark Field X-Ray Microscopy
 Condenser Optics for Dark Field X-Ray Microscopy S. J. Pfauntsch, A. G. Michette, C. J. Buckley Centre for X-Ray Science, Department of Physics, King s College London, Strand, London WC2R 2LS, UK Abstract.
WorldShip Import Customer Addresses. Table of Contents
 Table of Contents using the Import/Export Wizard... 2 using the Connection Assistant... 9 Copyright 2016, United Parcel Service of America, Inc. All rights reserved. 1 using the Import/Export Wizard Note:
Basics of X-Area for image plates
 Basics of X-Area for image plates Commercial software to process single-crystal and powder x-ray data from STOE image plates and PILATUS detectors Andrzej Grzechnik 1 & Karen Friese 2 1 Institute of Crystallography,
Download installation package and documentation Installation procedure. Network installation Installing updates
 -Manual d-basics I Manual d-basics Table of Contents Chapter I Introduction 1 Chapter II Installation 3 1... Download installation package and documentation 4 2... Installation procedure 4 3... Registration
 %58.(5Ã$'9$1&('Ã;5$
 Reading: Graphing Techniques Revised 1/12/11 GRAPHING TECHNIQUES
 GRAPHING TECHNIQUES Mathematical relationships between variables are determined by graphing experimental data. For example, the linear relationship between the concentration and the absorption of dilute
CCP4 CSE. CCP for Protein Crystallography. Much of this talk prepared by Martyn Winn. Computational Science & Engineering Department
 CCP4 CCP for Protein Crystallography Much of this talk prepared by Martyn Winn CSE Computational Science & Engineering Department Overview of Protein Crystallography Crystallisation e-htpx Data Collection
ENV Laboratory 2: Graphing
 Name: Date: Introduction It is often said that a picture is worth 1,000 words, or for scientists we might rephrase it to say that a graph is worth 1,000 words. Graphs are most often used to express data
3. Image formation, Fourier analysis and CTF theory. Paula da Fonseca
 3. Image formation, Fourier analysis and CTF theory Paula da Fonseca EM course 2017 - Agenda - Overview of: Introduction to Fourier analysis o o o o Sine waves Fourier transform (simple examples of 1D
Analysis of small-angle X-ray scattering (SAXS) data
 data") EASYSAXS SOFTWARE Analysis of small-angle X-ray scattering (SAXS) data Determination of nanoscale structures and dimensions EasySAXS - Simply powerful Advanced software for the analysis of small-angle
EASYSAXS SOFTWARE Analysis of small-angle X-ray scattering (SAXS) data Determination of nanoscale structures and dimensions EasySAXS - Simply powerful Advanced software for the analysis of small-angle
Lauetools. A software package for Laue microdiffraction data analysis. https://sourceforge.net/projects/lauetools /
 Lauetools A software package for Laue microdiffraction data analysis https://sourceforge.net/projects/lauetools / Motivations Motivations ImageJ LAUE raw data XMAS fit2d Some codes Motivations LAUE raw
Package Comparison Guide
 Package Comparison Guide UK BASED P R O VID E R Converse Monitor Engage Contents Standard, Professional or Enterprise, this document provides a detailed view of the features and functionality available
The walkthrough is available at /
 The walkthrough is available at https://downloads.openmicroscopy.org/presentations/2018/gbi-sydney / Description We will demonstrate a number of features of the OMERO platform using an OMERO server based
MRMPROBS tutorial. Hiroshi Tsugawa RIKEN Center for Sustainable Resource Science
 MRMPROBS tutorial Edited in 2014/10/6 Introduction MRMPROBS is a tool for the analysis of data from multiple reaction monitoring (MRM)- or selected reaction monitoring (SRM)-based metabolomics studies.