ANNOUNCING THE RELEASE OF LISREL VERSION BACKGROUND 2 COMBINING LISREL AND PRELIS FUNCTIONALITY 2 FIML FOR ORDINAL AND CONTINUOUS VARIABLES 3
|
|
|
- Adelia Hardy
- 6 years ago
- Views:
Transcription
1 ANNOUNCING THE RELEASE OF LISREL VERSION BACKGROUND 2 COMBINING LISREL AND PRELIS FUNCTIONALITY 2 FIML FOR ORDINAL AND CONTINUOUS VARIABLES 3 THREE-LEVEL MULTILEVEL GENERALIZED LINEAR MODELS 3 FOUR AND FIVE-LEVEL MULTILEVEL LINEAR MODELS FOR CONTINUOUS OUTCOME VARIABLES 4 NEW FILENAME EXTENSIONS 4 RUNNING LISREL IN BATCH MODE 4 DOCUMENTATION 5 EXAMPLES 6 Example 1: Analysis of ordinal data using quadrature (\ls9ex) 7 Example 2: Analysis of ordinal data using imputation and ACM (\ls9ex) 9 Example 3: Three-level Generalized Linear Model (\mglimex) 12 Example 4: A level-4 model with continuous outcome variable (\mlevelex) 14 Example 5: Observational Residuals (\obsresex) 16 COST AND ORDERING INFORMATION 17 1
2 Announcing the release of LISREL version 9.1 SSI has enjoyed great success over the years in the development and publishing of statistical software and is proud to announce the release of LISREL 9.1. In an effort to meet the growing demands of our LISREL 8 user community, SSI has developed LISREL 9.1, which is on the cutting edge of current technology. The program has been tested extensively on the Microsoft Windows platform with Windows7, Vista and XP operating systems. The development of LISREL was partially supported by an SBIR grant R43 AA from NIAAA. Background Structural equation modeling (SEM) was introduced initially as a way of analyzing a covariance or correlation matrix. Typically, one would read this matrix into LISREL and estimate the model by maximum likelihood. If raw data was available without missing values, one could also use PRELIS first to estimate an asymptotic covariance matrix to obtain robust estimates of standard errors and chi-squares. The new LISREL features are summarized next. Combining LISREL and PRELIS functionality Modern structural equation modeling is based on raw data. With LISREL 9.1, if raw data is available in a LISREL data system file or in a text file, one can read the data into LISREL and formulate the model using either SIMPLIS syntax or LISREL syntax. It is no longer necessary to estimate an asymptotic covariance matrix with PRELIS and read this into LISREL. The estimation of the asymptotic covariance matrix and the model is now done in LISREL9. One can also use the EM or MCMC multiple imputation methods in LISREL to fit a model to the imputed data. If requested, LISREL 9.1 will automatically perform robust estimation of standard errors and chisquare goodness of fit measures under non-normality. If the data contain missing values, LISREL 9 will automatically use Full information maximum likelihood (FIML) to estimate the model. Alternatively, users may choose to impute the missing values by EM or MCMC and estimate the model based on the imputed data. Several new sections of the output are also included. Examples in the folder \ls9ex illustrate these new features. 2
3 FIML for ordinal and continuous variables LISREL 9.1 supports Structural Equation Modeling for a mixture of ordinal and continuous variables for simple random samples and complex survey data. The LISREL implementation allows for the use of design weights to fit SEM models to a mixture of continuous and ordinal manifest variables with or without missing values with optional specification of stratum and/or cluster variables. It also deals with the issue of robust standard error estimation and the adjustment of the chi-square goodness of fit statistic. This method is based on adaptive quadrature and a user can specify any one of the following four link functions: o Logit o Probit o Complementary Log-log o Log-Log Examples to illustrate this feature are given in the folders \orfimlex and \ls9ex. Three-level Multilevel Generalized Linear Models Cluster or multi-stage samples designs are frequently used for populations with an inherent hierarchical structure. Ignoring the hierarchical structure of data has serious implications. The use of alternatives such as aggregation and disaggregation of information to another level can induce an increase in co-linearity among predictors and large or biased standard errors for the estimates. The collection of models called Generalized Linear Models (GLIMs) have become important, and practical, statistical tools. The basic idea of GLIMs is an adaption of standard regression to quite different kinds of data. The variables may be dichotomous, ordinal (as with a 5-point Likert scale), counts (number of arrest records), or nominal. The motivation is to tailor the regression relationship connecting the outcome to relevant independent variables so that it is appropriate to the properties of the dependent variable. The statistical theory and methods for fitting Generalized Linear Models (GLIMs) to survey data was implemented in LISREL 8.8. Researchers from the social and economic sciences are often applying these methods to multilevel data and consequently, inappropriate results are obtained. The LISREL 9.1 statistical module for the analysis of multilevel data allows for design weights. Two estimation methods, MAP (maximization of the posterior distribution) and QUAD (adaptive quadrature) for fitting generalized linear models to multilevel data are available. The LISREL module allows for a wide variety of sampling distributions and link functions. Examples in the folder \mglimex illustrate these new features. 3
4 Four and Five-level Multilevel Linear Models for continuous outcome variables Social science research often entails the analysis of data with a hierarchical structure. A frequently cited example of multilevel data is a dataset containing measurements on children nested within schools, with schools nested within education departments. The need for statistical models that take account of the sampling scheme is well recognized and it has been shown that the analysis of survey data under the assumption of a simple random sampling scheme may give rise to misleading results. Multilevel models are particularly useful in the modeling of data from complex surveys. Cluster or multi-stage samples designs are frequently used for populations with an inherent hierarchical structure. Ignoring the hierarchical structure of data has serious implications. The use of alternatives such as aggregation and disaggregation of information to another level can induce an increase in co-linearity among predictors and large or biased standard errors for the estimates. In order to address concerns regarding the appropriate analyses of survey data, the LISREL multilevel module for continuous data now also handles up to five levels and features an option for users to include design weights on levels 1, 2, 3, 4 or 5 of the hierarchy. Examples are given in the \mlevelex folder. New filename extensions All LISREL syntax files have extension.lis (previously.ls8), all PRELIS syntax files have extension.prl (previously.pr2). The LISREL spreadsheet has been renamed LISREL data system file and has extension.lsf (previously.psf) To ensure backwards compatibility, users can still run previously created syntax files using a.psf file, but to open an existing.psf file using the graphical user s interface, the user has to rename it to.lsf. Running LISREL in batch mode Any of the LISREL programs can be run into batch mode by using a.bat file with the following script: "c:\program files (x86)\lisrel9\mlisrel9" <program name> <syntax file> <output file> where Program name = LISREL, PRELIS, MULTILEV, MAPGLIM or SURVEYGLIM 4
 are given in the \ls9ex folder. These batch files will run all the LISREL and SIMPLIS syntax files in this folder.")
 o PRELIS Examples Guide o LISREL Examples Guide o Multilevel (Hierarchical Linear) Modeling Guide o Complex")
5 Example: Syntax File = "c:\lisrel9 examples\ls9ex\npv1a.spl" Output File = "c:\lisrel9 examples\ls9ex\npv1a.out" Examples of batch files (RunLISREL.bat and RunSIMPLIS.bat) are given in the \ls9ex folder. These batch files will run all the LISREL and SIMPLIS syntax files in this folder. Documentation Program documentation is available as PDFs via the Help menu. A list of PDF guides, accessible via the online Help menu is given below. o New features in LISREL 9 o The LISREL Graphical User s Interface (GUI) o PRELIS Examples Guide o LISREL Examples Guide o Multilevel (Hierarchical Linear) Modeling Guide o Complex Survey Sampling o Generalized Linear Modeling Guide o Multilevel Generalized Linear Modeling Guide o LISREL Syntax Guide 5
 for continuous variables and SEM for a mixture of")
6 o SIMPLIS Syntax Guide o PRELIS Syntax Guide o Additional Topics Guide Documentation of the LISREL graphical user s interface is also available as an online Help file. The Help file has features that simplify navigation across topics: The complex Survey Sampling Guide includes structural equation modeling (SEM) for continuous variables and SEM for a mixture of ordinal and continuous variables. LISREL uses full information maximum likelihood under complex survey data with data missing at random. The Additional Topics Guide includes sections on Multiple Imputation, Multilevel Structural Equation Modeling and Multilevel non-linear regression. Examples The syntax and data files for the examples are installed in the folder C:\LISREL9 Examples\. A selection of examples, illustrating some of the new features is given below. 6
 PROBIT GR(5) Latent Variables Efficacy Respons Relationships NOSAY - NOCARE = Efficacy NOCARE - INTEREST = Respons Path Diagram End of Problem")
7 Example 1: Analysis of ordinal data using quadrature (\ls9ex) Efficacy3a.spl: Model 2 Estimated by FIML Raw Data from file EFFICACY.LSF $ADAPQ(8) PROBIT GR(5) Latent Variables Efficacy Respons Relationships NOSAY - NOCARE = Efficacy NOCARE - INTEREST = Respons Path Diagram End of Problem Path Diagram Representation 7

8 Path Diagram (Standardized Solution) Portion of output file The last part of the output file is shown below. For the moment we note the value of the deviance statistic 2 ln L = Since there is no value of 2 ln L for a saturated model, it is impossible to say whether this is large or small in some absolute sense. The deviance statistic can therefore only be used to compare different models for the same data. To illustrate, the difference between the deviance statistic for this model and the deviance statistic for a model with one latent variable (Efficacy2a.spl) is =76.51, which suggests that the two-dimensional model fits the data much better than the unidimensional model. The output also gives estimates of the thresholds, their standard errors and z-values. The thresholds are parameters of the model but are seldom useful in analysis of a single sample. 8

9 Example 2: Analysis of ordinal data using imputation and ACM (\ls9ex) Efficacy4a.spl: Model 2 Estimated by Robust Diagonally Weighted Least Squares Raw Data from file EFFICACY.LSF Multiple Imputation with MC Latent Variables Efficacy Respons Relationships NOSAY COMPLEX NOCARE = Efficacy NOCARE - INTEREST = Respons Robust Estimation Method of Estimation: Diagonally Weighted Least Squares Path Diagram End of Problem 9
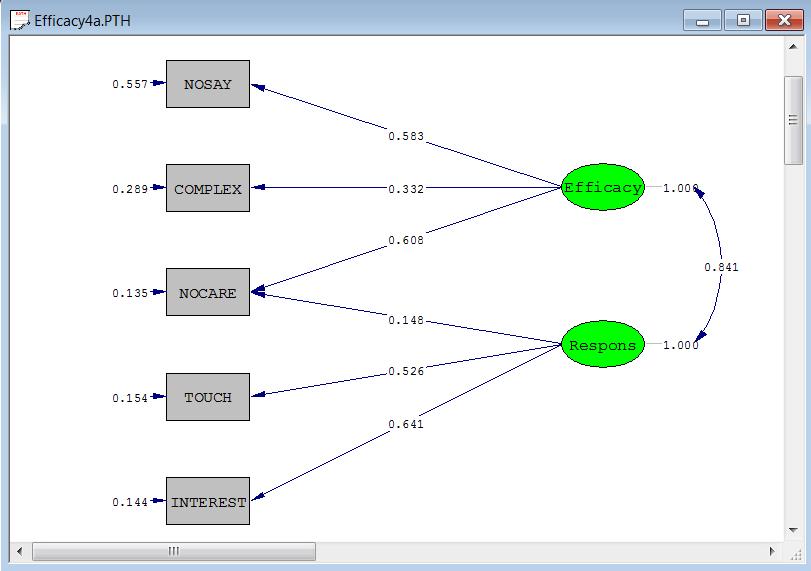
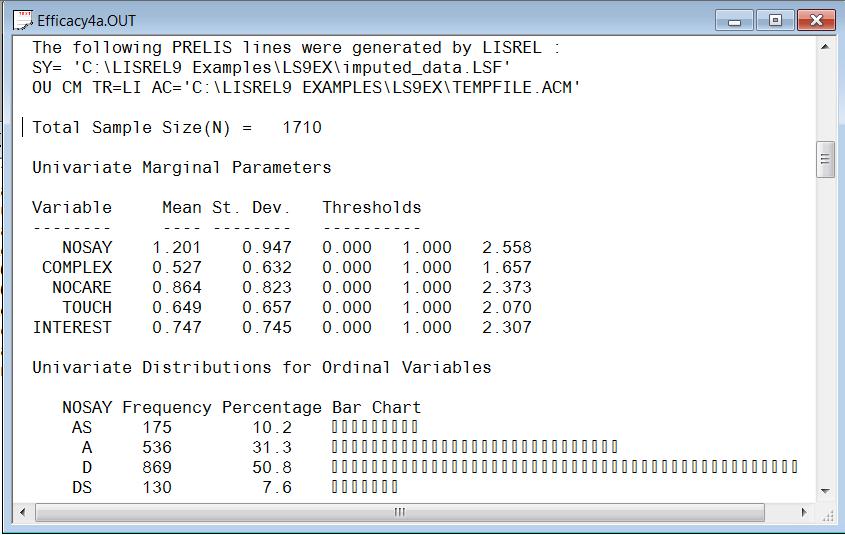
10 Path Diagram Representation Descriptive statistics 10


11 Parameter Estimates Goodness of Fit Statistics The last portion of the output file is a summary of fit statistics and confidence intervals. These statistics are discussed in the Appendix of the New Features in LISREL 9 guide, available in PDF format via the LISREL online Help menu. 11

12 Fit Statistics Example 3: Three-level Generalized Linear Model (\mglimex) MGlimOptions Converge= MaxIter=500 MissingCode= Method=Quad NQUADPTS=6; Title=Level-3 Ordinal Model, random intercept and slope at level-2; SY=tvsfpors.lsf; ID2=Class; ID3=School;! Syntax file name is Tvsfpors_ORDINAL.prl! The data for this example is from the Television School and! Family Smoking Prevention! and Cessation Project (TVSFP) and was downloaded from 12

13 ! A description of the data is given in mixorcm.pdf, available! from the URL above. Distribution=MUL; Link=OLOGIT; DepVar=THKSord; CoVars=PreTHKS CC TV 'CC*TV'; RANDOM2=intcept PreTHKS; RANDOM3=intcept; Selected portions of the output file are displayed below. Parameter Estimates and Odds Ratios Estimated variance components Estimates of the variance components on levels 2 and 3 and the associated p-values indicate that the PreTHKS coefficient does not vary significantly over classes. Note however, that the covariance term is almost significant. The level-3 intercept effect is also not significant. These results seem to indicate a level-2 model random intercept model as being more appropriate. 13

14 Example 4: A level-4 model with continuous outcome variable (\mlevelex)! Measurements made on 1,192 participants at three occasions.! In the case of some of the participants, measurements were! made on only one or two occasions. OPTIONS OLS=YES CONVERGE= MAXITER=15 OUTPUT=STANDARD; TITLE=Analysis of level-4 repeated measurements data; SY='Therapis_L4.lsf'; ID4=site; ID3=therapis; ID2=particip; RESPONSE=assesmt; FIXED=gender occasion thera1 thera2 thera3 thera4; RANDOM1=intcept; RANDOM2=intcept; RANDOM3=intcept; RANDOM4=intcept; Data for the first 10 participants on most of the variables are shown below in the form of a LISREL spreadsheet file, named therapist_l4.lsf. 14
. o assesmt is a score assigned by a therapist to a particular participant on occasion 0, 1 or 2.")
15 The variables of interest are: o site is the level-4 identification variable (49 units in total). o therapis is the level-3 identification variable (187 units in total). o particip is the level-2 identification variable (1192 units in total). o assesmt is a score assigned by a therapist to a particular participant on occasion 0, 1 or 2. o gender is a gender indicator, with a value of 0 indicating a male participant and 1 a female participant. o occasion is a predictor variable coded 0, 1 and 2. o thera1 - thera4 are dummy coded variables indicating four types of therapy. Only selected parts of the output are shown. The output describing the estimated fixed effects after convergence is shown first. From the z-values and associated exceedance probabilities, we see that except for the coefficient associated with gender, the remaining coefficients are all highly significant. A study of the random part of the model shows that all the intercept effects are highly significant, except for the level-3 (therapists) intercept. From this, we conclude that intercept estimates vary significantly over sites, but not over therapists. 15
 Raw Data from file POLIDEMstd.")
16 Example 5: Observational Residuals (\obsresex)! Run ba4.prl first to obtain POLIDEMstdnew.LSF! LSFfile Command is to create a new lsf file containing latent! variable scores! Estimate Residuals Command is to add estimated residuals to the new! lsf file. Name of the new file is POLIDEMstdnew.LSF Industrialization-Democracy Example (ba1da.spl) Raw Data from file POLIDEMstd.LSF Latent Variables: Dem60 Dem65 Indus Relationships: Y1= Dem60 Y2-Y4 = Dem60 Y5 = Dem65 16

17 Y6-Y8 = Dem65 X9 = Indus X10-X11 = Indus Dem60 = Indus Dem65 = Dem60 Indus Set Dem60 -> Y2 = Dem65 -> Y6 Set Dem60 -> Y3 = Dem65 -> Y7 Set Dem60 -> Y4 = Dem65 -> Y8 Let the errors of Y5 and Y1 be correlated let the errors of Y6 and Y2 be correlated Let the errors of Y7 and Y3 be correlated Let the errors of Y8 and Y4 be correlated LSFfile POLIDEMstd.LSF Estimate Residuals LISREL Output Path Diagram End of Problem The LSFfile command is to create a new lsf file containing latent variable scores. The Estimate Residuals command is to add estimated residuals to the new lsf file. The name of the new file is POLIDEMstdnew.LSF. The first ten cases of this file are shown below. Cost and ordering information The software can be ordered from our online website and will be delivered electronically. Single user licenses, concurrent licenses, and rental licenses (6 or 12 months) are available. All pricing information is available on the site. 17
LISREL 10.1 RELEASE NOTES 2 1 BACKGROUND 2 2 MULTIPLE GROUP ANALYSES USING A SINGLE DATA FILE 2
 LISREL 10.1 RELEASE NOTES 2 1 BACKGROUND 2 2 MULTIPLE GROUP ANALYSES USING A SINGLE DATA FILE 2 3 MODELS FOR GROUPED- AND DISCRETE-TIME SURVIVAL DATA 5 4 MODELS FOR ORDINAL OUTCOMES AND THE PROPORTIONAL
Multilevel generalized linear modeling
 Multilevel generalized linear modeling 1. Introduction Many popular statistical methods are based on mathematical models that assume data follow a normal distribution. The most obvious among these are
1 SIMPLIS Syntax... 3
 Table of Contents 1 SIMPLIS... 3 1.1 The structure of the SIMPLIS syntax file... 3 1.2 $ADAPQ(n) command... 6 1.3 $CLUSTER command... 7 1.4 $PREDICT command... 8 1.5 ANALYZE CORRELATIONS COMMAND... 8 1.6
CHAPTER 1 INTRODUCTION
 Introduction CHAPTER 1 INTRODUCTION Mplus is a statistical modeling program that provides researchers with a flexible tool to analyze their data. Mplus offers researchers a wide choice of models, estimators,
CHAPTER 7 EXAMPLES: MIXTURE MODELING WITH CROSS- SECTIONAL DATA
 Examples: Mixture Modeling With Cross-Sectional Data CHAPTER 7 EXAMPLES: MIXTURE MODELING WITH CROSS- SECTIONAL DATA Mixture modeling refers to modeling with categorical latent variables that represent
A Beginner's Guide to. Randall E. Schumacker. The University of Alabama. Richard G. Lomax. The Ohio State University. Routledge
 A Beginner's Guide to Randall E. Schumacker The University of Alabama Richard G. Lomax The Ohio State University Routledge Taylor & Francis Group New York London About the Authors Preface xv xvii 1 Introduction
Handbook of Statistical Modeling for the Social and Behavioral Sciences
 Handbook of Statistical Modeling for the Social and Behavioral Sciences Edited by Gerhard Arminger Bergische Universität Wuppertal Wuppertal, Germany Clifford С. Clogg Late of Pennsylvania State University
Introduction to Mplus
 Introduction to Mplus May 12, 2010 SPONSORED BY: Research Data Centre Population and Life Course Studies PLCS Interdisciplinary Development Initiative Piotr Wilk piotr.wilk@schulich.uwo.ca OVERVIEW Mplus
Introduction to Mixed Models: Multivariate Regression
 Introduction to Mixed Models: Multivariate Regression EPSY 905: Multivariate Analysis Spring 2016 Lecture #9 March 30, 2016 EPSY 905: Multivariate Regression via Path Analysis Today s Lecture Multivariate
Supplementary Notes on Multiple Imputation. Stephen du Toit and Gerhard Mels Scientific Software International
 Supplementary Notes on Multiple Imputation. Stephen du Toit and Gerhard Mels Scientific Software International Part A: Comparison with FIML in the case of normal data. Stephen du Toit Multivariate data
An Introduction to Growth Curve Analysis using Structural Equation Modeling
 An Introduction to Growth Curve Analysis using Structural Equation Modeling James Jaccard New York University 1 Overview Will introduce the basics of growth curve analysis (GCA) and the fundamental questions
CHAPTER 11 EXAMPLES: MISSING DATA MODELING AND BAYESIAN ANALYSIS
 Examples: Missing Data Modeling And Bayesian Analysis CHAPTER 11 EXAMPLES: MISSING DATA MODELING AND BAYESIAN ANALYSIS Mplus provides estimation of models with missing data using both frequentist and Bayesian
Ronald H. Heck 1 EDEP 606 (F2015): Multivariate Methods rev. November 16, 2015 The University of Hawai i at Mānoa
: Multivariate Methods rev. November 16, 2015 The University of Hawai i at Mānoa") Ronald H. Heck 1 In this handout, we will address a number of issues regarding missing data. It is often the case that the weakest point of a study is the quality of the data that can be brought to bear
Ronald H. Heck 1 In this handout, we will address a number of issues regarding missing data. It is often the case that the weakest point of a study is the quality of the data that can be brought to bear
Generalized least squares (GLS) estimates of the level-2 coefficients,
 estimates of the level-2 coefficients,") Contents 1 Conceptual and Statistical Background for Two-Level Models...7 1.1 The general two-level model... 7 1.1.1 Level-1 model... 8 1.1.2 Level-2 model... 8 1.2 Parameter estimation... 9 1.3 Empirical
Contents 1 Conceptual and Statistical Background for Two-Level Models...7 1.1 The general two-level model... 7 1.1.1 Level-1 model... 8 1.1.2 Level-2 model... 8 1.2 Parameter estimation... 9 1.3 Empirical
Also, for all analyses, two other files are produced upon program completion.
 MIXOR for Windows Overview MIXOR is a program that provides estimates for mixed-effects ordinal (and binary) regression models. This model can be used for analysis of clustered or longitudinal (i.e., 2-level)
Show how the LG-Syntax can be generated from a GUI model. Modify the LG-Equations to specify a different LC regression model
 Tutorial #S1: Getting Started with LG-Syntax DemoData = 'conjoint.sav' This tutorial introduces the use of the LG-Syntax module, an add-on to the Advanced version of Latent GOLD. In this tutorial we utilize
PSY 9556B (Jan8) Design Issues and Missing Data Continued Examples of Simulations for Projects
 Design Issues and Missing Data Continued Examples of Simulations for Projects") PSY 9556B (Jan8) Design Issues and Missing Data Continued Examples of Simulations for Projects Let s create a data for a variable measured repeatedly over five occasions We could create raw data (for each
PSY 9556B (Jan8) Design Issues and Missing Data Continued Examples of Simulations for Projects Let s create a data for a variable measured repeatedly over five occasions We could create raw data (for each
THE ANALYSIS OF CONTINUOUS DATA FROM MULTIPLE GROUPS
 THE ANALYSIS OF CONTINUOUS DATA FROM MULTIPLE GROUPS 1. Introduction In practice, many multivariate data sets are observations from several groups. Examples of these groups are genders, languages, political
Using HLM for Presenting Meta Analysis Results. R, C, Gardner Department of Psychology
 Data_Analysis.calm: dacmeta Using HLM for Presenting Meta Analysis Results R, C, Gardner Department of Psychology The primary purpose of meta analysis is to summarize the effect size results from a number
From Bayesian Analysis of Item Response Theory Models Using SAS. Full book available for purchase here.
 From Bayesian Analysis of Item Response Theory Models Using SAS. Full book available for purchase here. Contents About this Book...ix About the Authors... xiii Acknowledgments... xv Chapter 1: Item Response
Correctly Compute Complex Samples Statistics
 SPSS Complex Samples 15.0 Specifications Correctly Compute Complex Samples Statistics When you conduct sample surveys, use a statistics package dedicated to producing correct estimates for complex sample
Hierarchical Generalized Linear Models
 Generalized Multilevel Linear Models Introduction to Multilevel Models Workshop University of Georgia: Institute for Interdisciplinary Research in Education and Human Development 07 Generalized Multilevel
GETTING STARTED WITH THE STUDENT EDITION OF LISREL 8.51 FOR WINDOWS
 GETTING STARTED WITH THE STUDENT EDITION OF LISREL 8.51 FOR WINDOWS Gerhard Mels, Ph.D. mels@ssicentral.com Senior Programmer Scientific Software International, Inc. 1. Introduction The Student Edition
Multidimensional Latent Regression
 Multidimensional Latent Regression Ray Adams and Margaret Wu, 29 August 2010 In tutorial seven, we illustrated how ConQuest can be used to fit multidimensional item response models; and in tutorial five,
PRI Workshop Introduction to AMOS
 PRI Workshop Introduction to AMOS Krissy Zeiser Pennsylvania State University klz24@pop.psu.edu 2-pm /3/2008 Setting up the Dataset Missing values should be recoded in another program (preferably with
Motivating Example. Missing Data Theory. An Introduction to Multiple Imputation and its Application. Background
 An Introduction to Multiple Imputation and its Application Craig K. Enders University of California - Los Angeles Department of Psychology cenders@psych.ucla.edu Background Work supported by Institute
Correctly Compute Complex Samples Statistics
 PASW Complex Samples 17.0 Specifications Correctly Compute Complex Samples Statistics When you conduct sample surveys, use a statistics package dedicated to producing correct estimates for complex sample
PSY 9556B (Feb 5) Latent Growth Modeling
 Latent Growth Modeling") PSY 9556B (Feb 5) Latent Growth Modeling Fixed and random word confusion Simplest LGM knowing how to calculate dfs How many time points needed? Power, sample size Nonlinear growth quadratic Nonlinear growth
PSY 9556B (Feb 5) Latent Growth Modeling Fixed and random word confusion Simplest LGM knowing how to calculate dfs How many time points needed? Power, sample size Nonlinear growth quadratic Nonlinear growth
Using Mplus Monte Carlo Simulations In Practice: A Note On Non-Normal Missing Data In Latent Variable Models
 Using Mplus Monte Carlo Simulations In Practice: A Note On Non-Normal Missing Data In Latent Variable Models Bengt Muth en University of California, Los Angeles Tihomir Asparouhov Muth en & Muth en Mplus
Analysis of Panel Data. Third Edition. Cheng Hsiao University of Southern California CAMBRIDGE UNIVERSITY PRESS
 Analysis of Panel Data Third Edition Cheng Hsiao University of Southern California CAMBRIDGE UNIVERSITY PRESS Contents Preface to the ThirdEdition Preface to the Second Edition Preface to the First Edition
STATISTICS (STAT) Statistics (STAT) 1
 Statistics (STAT) 1") Statistics (STAT) 1 STATISTICS (STAT) STAT 2013 Elementary Statistics (A) Prerequisites: MATH 1483 or MATH 1513, each with a grade of "C" or better; or an acceptable placement score (see placement.okstate.edu).
Statistics (STAT) 1 STATISTICS (STAT) STAT 2013 Elementary Statistics (A) Prerequisites: MATH 1483 or MATH 1513, each with a grade of "C" or better; or an acceptable placement score (see placement.okstate.edu).
Regression. Dr. G. Bharadwaja Kumar VIT Chennai
 Regression Dr. G. Bharadwaja Kumar VIT Chennai Introduction Statistical models normally specify how one set of variables, called dependent variables, functionally depend on another set of variables, called
Analysis of Complex Survey Data with SAS
 ABSTRACT Analysis of Complex Survey Data with SAS Christine R. Wells, Ph.D., UCLA, Los Angeles, CA The differences between data collected via a complex sampling design and data collected via other methods
REALCOM-IMPUTE: multiple imputation using MLwin. Modified September Harvey Goldstein, Centre for Multilevel Modelling, University of Bristol
 REALCOM-IMPUTE: multiple imputation using MLwin. Modified September 2014 by Harvey Goldstein, Centre for Multilevel Modelling, University of Bristol This description is divided into two sections. In the
The linear mixed model: modeling hierarchical and longitudinal data
 The linear mixed model: modeling hierarchical and longitudinal data Analysis of Experimental Data AED The linear mixed model: modeling hierarchical and longitudinal data 1 of 44 Contents 1 Modeling Hierarchical
xxm Reference Manual
 xxm Reference Manual February 21, 2013 Type Package Title Structural Equation Modeling for Dependent Data Version 0.5.0 Date 2013-02-06 Author Paras Mehta Depends Maintainer
Upgrade Manual. for Latent GOLD 5.1 1
 Upgrade Manual for Latent GOLD 5.1 1 Jeroen K. Vermunt and Jay Magidson Version: January 9, 2016 Statistical Innovations Inc. www.statisticalinnovations.com 1 This document should be cited as J.K. Vermunt
Introduction to Hierarchical Linear Model. Hsueh-Sheng Wu CFDR Workshop Series January 30, 2017
 Introduction to Hierarchical Linear Model Hsueh-Sheng Wu CFDR Workshop Series January 30, 2017 1 Outline What is Hierarchical Linear Model? Why do nested data create analytic problems? Graphic presentation
Mean Tests & X 2 Parametric vs Nonparametric Errors Selection of a Statistical Test SW242
 Mean Tests & X 2 Parametric vs Nonparametric Errors Selection of a Statistical Test SW242 Creation & Description of a Data Set * 4 Levels of Measurement * Nominal, ordinal, interval, ratio * Variable Types
Missing Data Techniques
 Missing Data Techniques Paul Philippe Pare Department of Sociology, UWO Centre for Population, Aging, and Health, UWO London Criminometrics (www.crimino.biz) 1 Introduction Missing data is a common problem
Missing Data. SPIDA 2012 Part 6 Mixed Models with R:
 The best solution to the missing data problem is not to have any. Stef van Buuren, developer of mice SPIDA 2012 Part 6 Mixed Models with R: Missing Data Georges Monette 1 May 2012 Email: georges@yorku.ca
Ludwig Fahrmeir Gerhard Tute. Statistical odelling Based on Generalized Linear Model. íecond Edition. . Springer
 Ludwig Fahrmeir Gerhard Tute Statistical odelling Based on Generalized Linear Model íecond Edition. Springer Preface to the Second Edition Preface to the First Edition List of Examples List of Figures
An introduction to SPSS
 An introduction to SPSS To open the SPSS software using U of Iowa Virtual Desktop... Go to https://virtualdesktop.uiowa.edu and choose SPSS 24. Contents NOTE: Save data files in a drive that is accessible
Statistical Matching using Fractional Imputation
 Statistical Matching using Fractional Imputation Jae-Kwang Kim 1 Iowa State University 1 Joint work with Emily Berg and Taesung Park 1 Introduction 2 Classical Approaches 3 Proposed method 4 Application:
CHAPTER 5. BASIC STEPS FOR MODEL DEVELOPMENT
 CHAPTER 5. BASIC STEPS FOR MODEL DEVELOPMENT This chapter provides step by step instructions on how to define and estimate each of the three types of LC models (Cluster, DFactor or Regression) and also
Missing Data Missing Data Methods in ML Multiple Imputation
 Missing Data Missing Data Methods in ML Multiple Imputation PRE 905: Multivariate Analysis Lecture 11: April 22, 2014 PRE 905: Lecture 11 Missing Data Methods Today s Lecture The basics of missing data:
Regression on SAT Scores of 374 High Schools and K-means on Clustering Schools
 Regression on SAT Scores of 374 High Schools and K-means on Clustering Schools Abstract In this project, we study 374 public high schools in New York City. The project seeks to use regression techniques
Example Using Missing Data 1
 Ronald H. Heck and Lynn N. Tabata 1 Example Using Missing Data 1 Creating the Missing Data Variable (Miss) Here is a data set (achieve subset MANOVAmiss.sav) with the actual missing data on the outcomes.
RESEARCH ARTICLE. Growth Rate Models: Emphasizing Growth Rate Analysis through Growth Curve Modeling
 RESEARCH ARTICLE Growth Rate Models: Emphasizing Growth Rate Analysis through Growth Curve Modeling Zhiyong Zhang a, John J. McArdle b, and John R. Nesselroade c a University of Notre Dame; b University
Right-click on whatever it is you are trying to change Get help about the screen you are on Help Help Get help interpreting a table
 Q Cheat Sheets What to do when you cannot figure out how to use Q What to do when the data looks wrong Right-click on whatever it is you are trying to change Get help about the screen you are on Help Help
Didacticiel - Études de cas
 Subject In some circumstances, the goal of the supervised learning is not to classify examples but rather to organize them in order to point up the most interesting individuals. For instance, in the direct
Exponential Random Graph Models for Social Networks
 Exponential Random Graph Models for Social Networks ERGM Introduction Martina Morris Departments of Sociology, Statistics University of Washington Departments of Sociology, Statistics, and EECS, and Institute
Coding Categorical Variables in Regression: Indicator or Dummy Variables. Professor George S. Easton
 Coding Categorical Variables in Regression: Indicator or Dummy Variables Professor George S. Easton DataScienceSource.com This video is embedded on the following web page at DataScienceSource.com: DataScienceSource.com/DummyVariables
Chapter 1. Getting Started. 1.1 Importing Data
 Chapter 1 Getting Started All data analyses begin with raw data in one form or another. In LISREL one can work with data in plain text (ASCII) form. But for most analysis with LISREL it is convenient to
Package glmmml. R topics documented: March 25, Encoding UTF-8 Version Date Title Generalized Linear Models with Clustering
 Encoding UTF-8 Version 1.0.3 Date 2018-03-25 Title Generalized Linear Models with Clustering Package glmmml March 25, 2018 Binomial and Poisson regression for clustered data, fixed and random effects with
ConstructMap v4.4.0 Quick Start Guide
 ConstructMap v4.4.0 Quick Start Guide Release date 9/29/08 Document updated 12/10/08 Cathleen A. Kennedy Mark R. Wilson Karen Draney Sevan Tutunciyan Richard Vorp ConstructMap v4.4.0 Quick Start Guide
Multiple Imputation with Mplus
 Multiple Imputation with Mplus Tihomir Asparouhov and Bengt Muthén Version 2 September 29, 2010 1 1 Introduction Conducting multiple imputation (MI) can sometimes be quite intricate. In this note we provide
Clustering Lecture 5: Mixture Model
 Clustering Lecture 5: Mixture Model Jing Gao SUNY Buffalo 1 Outline Basics Motivation, definition, evaluation Methods Partitional Hierarchical Density-based Mixture model Spectral methods Advanced topics
Multiple-imputation analysis using Stata s mi command
 Multiple-imputation analysis using Stata s mi command Yulia Marchenko Senior Statistician StataCorp LP 2009 UK Stata Users Group Meeting Yulia Marchenko (StataCorp) Multiple-imputation analysis using mi
Mixed Effects Models. Biljana Jonoska Stojkova Applied Statistics and Data Science Group (ASDa) Department of Statistics, UBC.
 Department of Statistics, UBC.") Mixed Effects Models Biljana Jonoska Stojkova Applied Statistics and Data Science Group (ASDa) Department of Statistics, UBC March 6, 2018 Resources for statistical assistance Department of Statistics
Mixed Effects Models Biljana Jonoska Stojkova Applied Statistics and Data Science Group (ASDa) Department of Statistics, UBC March 6, 2018 Resources for statistical assistance Department of Statistics
Tutorial #1: Using Latent GOLD choice to Estimate Discrete Choice Models
 Tutorial #1: Using Latent GOLD choice to Estimate Discrete Choice Models In this tutorial, we analyze data from a simple choice-based conjoint (CBC) experiment designed to estimate market shares (choice
SAS Structural Equation Modeling 1.3 for JMP
 SAS Structural Equation Modeling 1.3 for JMP SAS Documentation The correct bibliographic citation for this manual is as follows: SAS Institute Inc. 2012. SAS Structural Equation Modeling 1.3 for JMP. Cary,
Multiple Linear Regression
 Multiple Linear Regression Rebecca C. Steorts, Duke University STA 325, Chapter 3 ISL 1 / 49 Agenda How to extend beyond a SLR Multiple Linear Regression (MLR) Relationship Between the Response and Predictors
Predict Outcomes and Reveal Relationships in Categorical Data
 PASW Categories 18 Specifications Predict Outcomes and Reveal Relationships in Categorical Data Unleash the full potential of your data through predictive analysis, statistical learning, perceptual mapping,
The Mplus modelling framework
 The Mplus modelling framework Continuous variables Categorical variables 1 Mplus syntax structure TITLE: a title for the analysis (not part of the syntax) DATA: (required) information about the data set
JMP Book Descriptions
 JMP Book Descriptions The collection of JMP documentation is available in the JMP Help > Books menu. This document describes each title to help you decide which book to explore. Each book title is linked
CHAPTER 2. GENERAL PROGRAM STRUCTURE
 CHAPTER 2. GENERAL PROGRAM STRUCTURE Windows Latent GOLD contains a main window called the Viewer. Viewer. When you estimate a model, all statistical results, tables and plots are displayed in the Viewer.
Statistical Package for the Social Sciences INTRODUCTION TO SPSS SPSS for Windows Version 16.0: Its first version in 1968 In 1975.
 Statistical Package for the Social Sciences INTRODUCTION TO SPSS SPSS for Windows Version 16.0: Its first version in 1968 In 1975. SPSS Statistics were designed INTRODUCTION TO SPSS Objective About the
Last updated January 4, 2012
 Last updated January 4, 2012 This document provides a description of Mplus code for implementing mixture factor analysis with four latent class components with and without covariates described in the following
Chapter 15 Mixed Models. Chapter Table of Contents. Introduction Split Plot Experiment Clustered Data References...
 Chapter 15 Mixed Models Chapter Table of Contents Introduction...309 Split Plot Experiment...311 Clustered Data...320 References...326 308 Chapter 15. Mixed Models Chapter 15 Mixed Models Introduction
D-Optimal Designs. Chapter 888. Introduction. D-Optimal Design Overview
 Chapter 888 Introduction This procedure generates D-optimal designs for multi-factor experiments with both quantitative and qualitative factors. The factors can have a mixed number of levels. For example,
WESTMORELAND COUNTY PUBLIC SCHOOLS Integrated Instructional Pacing Guide and Checklist Algebra, Functions & Data Analysis
 WESTMORELAND COUNTY PUBLIC SCHOOLS 2013 2014 Integrated Instructional Pacing Guide and Checklist Algebra, Functions & Data Analysis FIRST QUARTER and SECOND QUARTER (s) ESS Vocabulary A.4 A.5 Equations
Machine Learning: An Applied Econometric Approach Online Appendix
 Machine Learning: An Applied Econometric Approach Online Appendix Sendhil Mullainathan mullain@fas.harvard.edu Jann Spiess jspiess@fas.harvard.edu April 2017 A How We Predict In this section, we detail
Statistical Analysis Using Combined Data Sources: Discussion JPSM Distinguished Lecture University of Maryland
 Statistical Analysis Using Combined Data Sources: Discussion 2011 JPSM Distinguished Lecture University of Maryland 1 1 University of Michigan School of Public Health April 2011 Complete (Ideal) vs. Observed
Opening Windows into the Black Box
 Opening Windows into the Black Box Yu-Sung Su, Andrew Gelman, Jennifer Hill and Masanao Yajima Columbia University, Columbia University, New York University and University of California at Los Angels July
Estimating Variance Components in MMAP
 Last update: 6/1/2014 Estimating Variance Components in MMAP MMAP implements routines to estimate variance components within the mixed model. These estimates can be used for likelihood ratio tests to compare
Acknowledgments. Acronyms
 Acknowledgments Preface Acronyms xi xiii xv 1 Basic Tools 1 1.1 Goals of inference 1 1.1.1 Population or process? 1 1.1.2 Probability samples 2 1.1.3 Sampling weights 3 1.1.4 Design effects. 5 1.2 An introduction
Study Guide. Module 1. Key Terms
 Study Guide Module 1 Key Terms general linear model dummy variable multiple regression model ANOVA model ANCOVA model confounding variable squared multiple correlation adjusted squared multiple correlation
Multiple Imputation for Multilevel Models with Missing Data Using Stat-JR
 Multiple Imputation for Multilevel Models with Missing Data Using Stat-JR Introduction In this document we introduce a Stat-JR super-template for 2-level data that allows for missing values in explanatory
JMP Clinical. Release Notes. Version 5.0
 JMP Clinical Version 5.0 Release Notes Creativity involves breaking out of established patterns in order to look at things in a different way. Edward de Bono JMP, A Business Unit of SAS SAS Campus Drive
CS 229 Midterm Review
 CS 229 Midterm Review Course Staff Fall 2018 11/2/2018 Outline Today: SVMs Kernels Tree Ensembles EM Algorithm / Mixture Models [ Focus on building intuition, less so on solving specific problems. Ask
SENSITIVITY ANALYSIS IN HANDLING DISCRETE DATA MISSING AT RANDOM IN HIERARCHICAL LINEAR MODELS VIA MULTIVARIATE NORMALITY
 Virginia Commonwealth University VCU Scholars Compass Theses and Dissertations Graduate School 6 SENSITIVITY ANALYSIS IN HANDLING DISCRETE DATA MISSING AT RANDOM IN HIERARCHICAL LINEAR MODELS VIA MULTIVARIATE
SPSS QM II. SPSS Manual Quantitative methods II (7.5hp) SHORT INSTRUCTIONS BE CAREFUL
 SHORT INSTRUCTIONS BE CAREFUL") SPSS QM II SHORT INSTRUCTIONS This presentation contains only relatively short instructions on how to perform some statistical analyses in SPSS. Details around a certain function/analysis method not covered
SPSS QM II SHORT INSTRUCTIONS This presentation contains only relatively short instructions on how to perform some statistical analyses in SPSS. Details around a certain function/analysis method not covered
Introduction to Data Science
 Introduction to Data Science CS 491, DES 430, IE 444, ME 444, MKTG 477 UIC Innovation Center Fall 2017 and Spring 2018 Instructors: Charles Frisbie, Marco Susani, Michael Scott and Ugo Buy Author: Ugo
Missing Data Analysis with SPSS
 Missing Data Analysis with SPSS Meng-Ting Lo (lo.194@osu.edu) Department of Educational Studies Quantitative Research, Evaluation and Measurement Program (QREM) Research Methodology Center (RMC) Outline
Goals of the Lecture. SOC6078 Advanced Statistics: 9. Generalized Additive Models. Limitations of the Multiple Nonparametric Models (2)
") SOC6078 Advanced Statistics: 9. Generalized Additive Models Robert Andersen Department of Sociology University of Toronto Goals of the Lecture Introduce Additive Models Explain how they extend from simple
SOC6078 Advanced Statistics: 9. Generalized Additive Models Robert Andersen Department of Sociology University of Toronto Goals of the Lecture Introduce Additive Models Explain how they extend from simple
Bayesian Model Averaging over Directed Acyclic Graphs With Implications for Prediction in Structural Equation Modeling
 ing over Directed Acyclic Graphs With Implications for Prediction in ing David Kaplan Department of Educational Psychology Case April 13th, 2015 University of Nebraska-Lincoln 1 / 41 ing Case This work
SOS3003 Applied data analysis for social science Lecture note Erling Berge Department of sociology and political science NTNU.
 SOS3003 Applied data analysis for social science Lecture note 04-2009 Erling Berge Department of sociology and political science NTNU Erling Berge 2009 1 Missing data Literature Allison, Paul D 2002 Missing
Applied Regression Modeling: A Business Approach
 i Applied Regression Modeling: A Business Approach Computer software help: SPSS SPSS (originally Statistical Package for the Social Sciences ) is a commercial statistical software package with an easy-to-use
LG-Syntax TM User s Manual. LG Choice Modeling Extensions via the LG-Syntax Module
 LG-Syntax TM User s Manual LG Choice Modeling Extensions via the LG-Syntax Module 1 This document should be cited as: Vermunt, J.K., and Magidson, J. (2011). LG-Syntax User s Guide: LG Choice Modeling
Big Data Methods. Chapter 5: Machine learning. Big Data Methods, Chapter 5, Slide 1
 Big Data Methods Chapter 5: Machine learning Big Data Methods, Chapter 5, Slide 1 5.1 Introduction to machine learning What is machine learning? Concerned with the study and development of algorithms that
Replication Note for A Bayesian Poisson Vector Autoregression Model
 Replication Note for A Bayesian Poisson Vector Autoregression Model Patrick T. Brandt pbrandt@utdallas.edu Todd Sandler tsandler@utdallas.edu School of Economic, Political and Policy Sciences The University
Statistical Analysis of List Experiments
 Statistical Analysis of List Experiments Kosuke Imai Princeton University Joint work with Graeme Blair October 29, 2010 Blair and Imai (Princeton) List Experiments NJIT (Mathematics) 1 / 26 Motivation
- 1 - Fig. A5.1 Missing value analysis dialog box
 WEB APPENDIX Sarstedt, M. & Mooi, E. (2019). A concise guide to market research. The process, data, and methods using SPSS (3 rd ed.). Heidelberg: Springer. Missing Value Analysis and Multiple Imputation
Statistical Methods for the Analysis of Repeated Measurements
 Charles S. Davis Statistical Methods for the Analysis of Repeated Measurements With 20 Illustrations #j Springer Contents Preface List of Tables List of Figures v xv xxiii 1 Introduction 1 1.1 Repeated
Frequently Asked Questions Updated 2006 (TRIM version 3.51) PREPARING DATA & RUNNING TRIM
 PREPARING DATA & RUNNING TRIM") Frequently Asked Questions Updated 2006 (TRIM version 3.51) PREPARING DATA & RUNNING TRIM * Which directories are used for input files and output files? See menu-item "Options" and page 22 in the manual.
Frequently Asked Questions Updated 2006 (TRIM version 3.51) PREPARING DATA & RUNNING TRIM * Which directories are used for input files and output files? See menu-item "Options" and page 22 in the manual.
Package EMLRT. August 7, 2014
 Package EMLRT August 7, 2014 Type Package Title Association Studies with Imputed SNPs Using Expectation-Maximization-Likelihood-Ratio Test LazyData yes Version 1.0 Date 2014-08-01 Author Maintainer
Basic concepts and terms
 CHAPTER ONE Basic concepts and terms I. Key concepts Test usefulness Reliability Construct validity Authenticity Interactiveness Impact Practicality Assessment Measurement Test Evaluation Grading/marking
Robust Linear Regression (Passing- Bablok Median-Slope)
") Chapter 314 Robust Linear Regression (Passing- Bablok Median-Slope) Introduction This procedure performs robust linear regression estimation using the Passing-Bablok (1988) median-slope algorithm. Their
Chapter 314 Robust Linear Regression (Passing- Bablok Median-Slope) Introduction This procedure performs robust linear regression estimation using the Passing-Bablok (1988) median-slope algorithm. Their
Blimp User s Guide. Version 1.0. Brian T. Keller. Craig K. Enders.
 Blimp User s Guide Version 1.0 Brian T. Keller bkeller2@ucla.edu Craig K. Enders cenders@psych.ucla.edu September 2017 Developed by Craig K. Enders and Brian T. Keller. Blimp was developed with funding