The PEPA Eclipse Plug-in
|
|
|
- Sara Blair
- 6 years ago
- Views:
Transcription
1 The PEPA Eclipse Plug-in A modelling, analysis and verification platform for PEPA Adam Duguid, Stephen Gilmore, Michael Smith and Mirco Tribastone Wednesday 01 December 2010 Abstract: This user manual describes the PEPA Eclipse Plug-in, a modelling environment for the high-level modelling language Performance Evaluation Process Algebra, PEPA [ The PEPA Eclipse Plug-in allows modellers to analyse their PEPA models using Markov chain theory, model-checking, and discrete or continuous simulation. The conversion from models in the PEPA process algebra to Markov chain models, simulation models, or differential equation models is entirely automatic. Analysis results are returned to the user in the form of graphs, charts and time series plots. A version of this document suitable for printing is available online [
2 Contents 1 Introduction Getting Started The PEPA Perspective Editing PEPA models The PEPA Editor Basic Syntax Views The Abstract Syntax Tree View Graph View Markovian analysis State Space Derivation State Space View Filtering the State Space Single Step Navigator Exporting the State Space Steady-State Analysis Performance analysis Performance Evaluation View Experimentation Discrete and continuous simulation Time Series Analysis Importing UML models Importing from UML
3 Chapter 1 Introduction 1.1 Getting Started This guide provides a step by step description of the PEPA plugin. It shows how you can edit PEPA models, carry out static analysis, obtain the underlying Continuous Time Markov Chain for steady-state analysis or perform time series analysis using Stochastic Simulation Algorithms or Ordinary Differential Equations. This guide will also describe how to use import/export tools for data exchange with third-party applications. Familiarity with PEPA is assumed. To learn more about PEPA visit the PEPA web site [ 1.2 The PEPA Perspective The plugin provides an editor for PEPA model input files. The editor contributes a top-level menu item to the workbench bar through which all the PEPA-related tools are accessible. Additional information is provided via workbench views. The PEPA perspective provides a customisable layout for those views in the workbench. To open the PEPA Perspective, select Window > Open Perspective > Other. Then select PEPA and press OK to finish. 2
4 Chapter 2 Editing PEPA models 2.1 The PEPA Editor The PEPA Editor lets you edit PEPA input model files. It is associated to open files with the.pepa extension in the workbench. In order for to open a PEPA input file in the Eclipse workbench, a project container has to be chosen. To create a new project, select File > New > Project.... Then select General > Project. Choose a name and press Finish to complete. To create a new file, right click the project and select File > New > File. Give the new file the extension.pepa The input is parsed when the file is saved. If the parsing is successful static analysis is then carried out. Warning and errors generated by both the parser and the static analysis tool are shown in the Eclipse Properties View. 3

5 2.2 Basic Syntax Rate Assignments must precede any process definition. A rate identifier is valid if it is a valid Java identifier starting with a lowercase letter. Rate assignments support expressions. They must end with a semicolon r1 = 1.0; r2 = 2.0 * r1-0.05; Process Assignments A process identifier is valid if it is a valid Java identifier starting with an uppercase letter. As usual an identifier can represent a Choice or a Prefix. It can also identify subparts of the system when it is assigned a cooperation. Process assignments must end with a semicolon P1 = (a, r1).p1 + (b, r2).p1; Passive Rates can be specified as either infty or T. Weights can be assigned as integer numbers. Weights however cannot be rate identifiers. If no weight is specified, the default value 1 is assumed. (a, T).P (b, infty).p (a, 3 * infty).p 4
6 Cooperation Sets are enclosed by. Cooperations with empty action set can be alternately specified with the parallel operation. P <a,b,c> Q P P Aggregation is partially supported by the plugin. If a cooperation on an empty action set between n is declared as P[n] then a canonical form representation for the process is considered during state space derivation of the underlying Markov chain. 5

7 Chapter 3 Views 3.1 The Abstract Syntax Tree View The AST View is a read-only Eclipse view for navigating the Abstract Syntax Tree of the model. The view is always associated to the currently active editor in the workbench. 3.2 Graph View The Graph View is a tab-based view responsible for the management of all the graphs produced by the PEPA plugin. It is automatically opened when a new graph is requested. If you want to open it explicitely, select Window > Show View > Other... and then select PEPA > Graph View. The view support tools for editing graph properties such as background color, line thickness and legends. In addition, it provides a number of exporters to save the image to graphic formats such as PNG or serialise the data to file. 6

8 To edit the graph, right click it and select Properties.... To serialise the data, click the drop-down button in the toolbar menu of the view in the topright corner of the view and select the desired format. A wizard will guide you through the process of setting exporter options and selecting target resources. 7
9 Chapter 4 Markovian analysis 4.1 State Space Derivation Once a model is successfully parsed, Markovian analysis can begin via state space derivation of the underlying Markov chain. To derive the state space of the model in the active editor in the workbench, select PEPA > CTMC > Derive. A tabular representation of the derived state space is shown in the State Space View 4.2 State Space View The State Space View allows you to navigate the underlying CTMC of a PEPA model. After a model is derived, the view presents a tabular representation of the state space. The first column shows the state number, then there are as many columns as the number of top-level components. An additional column shows the steady-state probability of the state after the model is solved. 8
10 4.3 Filtering the State Space The view provides filters for the state space. Here are the filter rules available. States with unnamed sequential components. States whose steady-state probability is in a given range. States matching a given pattern. States which have a top-level component in a given state. A number of rules can be grouped into a collection. The collection is assigned a name which is unique within the model s rule sets. You can specify any number of rule sets. However, only one rule set can be applied at a time. The rule setting are persistent across workbench sessions. To open the filter rule editor, click the drop-down arrow in the State Space View toolbar. 9

11 The State Space Filters dialog box will show the currently available filter sets for the model. 10


12 Click New... to edit a new set of rules. You are required to give it a name. The two radio buttons let you select between matching any or all of the defined rules. The rules are shown in the list box. To manage the rule list, right click the list box. Click New to show the supported rules. 11

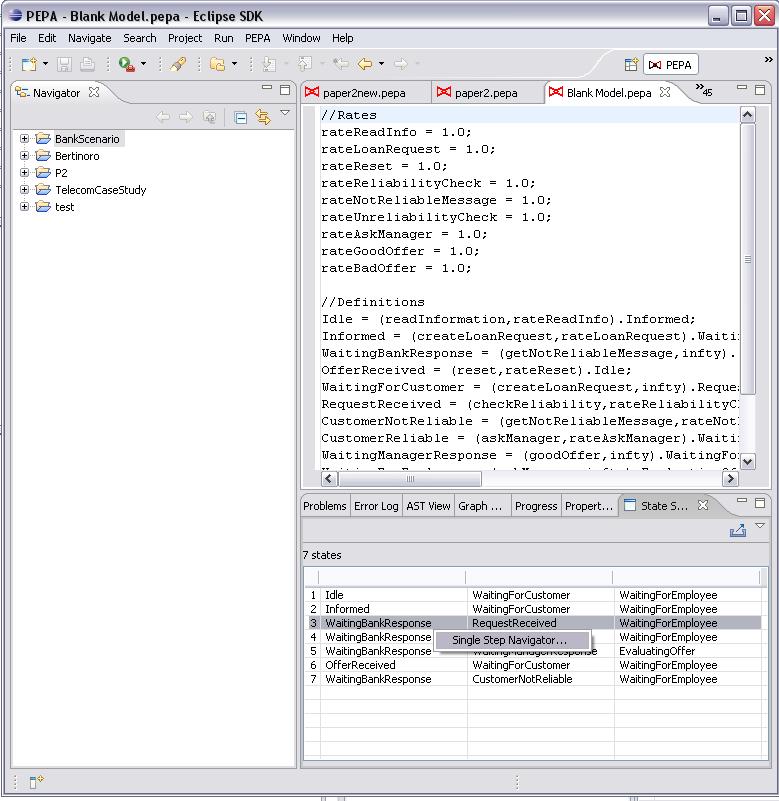
13 4.4 Single Step Navigator The Single Step Navigator is tool for walking the state space graphically. It is particularly useful for debugging purposes. It consists of two tables containing the list of incoming and outgoing states. The sequential components which cause the transition to be performed are highlighted and an option allows you to make filtered states not walkable. To open the navigator, right click a state in the state space view and select Single Step Navigator. The tool will be shown in a separate dialog box. 12
14 13
 files.")
15 Double click a state to set the new current state in the navigator. 4.5 Exporting the State Space The State Space View provides a wizard to export the state space into a csv (comma-separated values) files. To open the wizard, click the export button in the top right corner of the state space view. 14

16 The wizard will produce two files, the generator matrix and the state space in the form of an ordered list of strings. The separator character will be used to delimit the values in the generator matrix files. If the Include state number option is checked, the state number will be prepended to state. The state can be represented fully or as an array of separated top level components. Moreover, if the steady-state solution is available, the steady state probability can be included in the state space file. The values of the state space files will be delimited using the separator character of the generator matrix. Click Next to select the destination for the target files. The wizard doesn t allow to overwrite existing files. 4.6 Steady-State Analysis To obtain the steady-state probability distribution of the underlying Markov chain of a PEPA model, click PEPA > CTMC > Steady State Analysis. The item is not be enabled if the state space is not derived. 15

17 The wizard will guide you through the process of selecting a solver and setting its parameters. You can choose between a direct solver and a range of iterative solvers for which a number of preconditioners is available. Once the model is solved, the State Space View will be updated with a column showing the steady-state probability of each column. In addition, throughput and utilisation analysis will be carried out automatically and results will be available in the Performance Evaluation View. 16
18 17

19 Chapter 5 Performance analysis 5.1 Performance Evaluation View The Performance Evaluation View shows information about throughput and utilisation analysis. The view is automatically updated when the model in the active editor is solved. The Throughput Analysis tab lists the rate at which the actions of the PEPA model are performed at steady-state. A bar plot can be obtained by right-click the list and selecting Show graph. The corresponding graph will be shown in the Graph View. The Utilisation Analysis tab is a tree-based view showing the long-run utilisation of each top-level component of the model. For each component, it shows the percentage of time it is in a particular local state. A pie chart of a component can be obtained by right-clicking the desired component in the tree and selecting Show graph. The corresponding graph will be shown in the Graph View. 18
20 5.2 Experimentation The plugin features support for experimentation, i.e. running a model with values for its parameters varying across desired ranges. The results of the experiment are plotted in the Graph View and a number of exporters is available for data serialisation. To launch the experimentation wizard on the model of the active PEPA editor, select PEPA > CTMC > Experimentation... The first page of the wizard lists the model parameters on which experimentation can be run. This will include the rate definitions as well as all the aggregation operators included in the model system equation. 19


21 After Next is pressed, a wizard page for each selected parameter will let the user set the desidered range to be used in the experiments. Range can be specified in two different ways. For a uniform sampling over a given interval you may want to click the Specify an interval button. Otherwise, a comma separated list of values can be directly specified if the Specify comma-separated list is pressed. The last page of the wizard lets you create the experiments with the specified parameters. The plugin currently supports two types of experiments. A basic 2D graph plotting a performance metric against a parameter. A parametrised 20

22 2D graph plots a number of lines a performance metric against a parameter, a line for each value in the desired range of a second parameter. The performance metrics available are: action throughput, sequential state utilisation, or steady-state probability of a subset of the state space as specified by a filter in the filter rule editor of the model. To create a new experiment for a basic 2D graph, right click the list-box on the left of the wizard page and select New > XYPlot. The right hand side of the page will be dinamically updated with the widgetry for defining the experiment. 21
23 The name of the experiment will be shown as the title of the generated graph. The X Axis combo box lists the available model parameters and selection on the performance metric combo box will update the user interface with an additional section related to that performance metric. In the case of throughput, for example, a combo box lets the user select the action type. To create a new experiment for a parametrised 2D graph, right click the listbox on the left of the wizard page and select New > Parametrised XYPlot. The user interface is very similar to that of the basic 2D graph, except for an additional combo box requiring the user to specify the second parameter. 22
24 To delete an experiment, right-click the experiment on the list box and select Delete When you are done setting up the experiments, you can run them by pressing the Finish button of the wizard. The experiments will be run in the background and the results will be shown in the Graph View. 23
25 Chapter 6 Discrete and continuous simulation 6.1 Time Series Analysis Time series analysis can be carried out on a PEPA model via two different techniques: ODE and SSA. The former is the result of the mapping of a PEPA model to a set of Ordinary Differential Equation, the latter runs Stochastic Simulation Algorithms on a PEPA model. These functionalities are available under the PEPA > Time Series Analysis menu and they share parts of the user interface. To perform ODE analysis, click PEPA > Time Series Analysis > ODE.... You will be provided with a dialog box for configuring the ODE solver. On the left hand side you are required to check the components you want to investigate. The time series of each component will be shown as a different line on the 2D graph for this analysis. On the right hand side you are asked to select the ODE solver and set its main parameters (start time, stop time, step and tolerance). Output options are available to export the data model to disk. The wizard also let you save the intermediate CMDL file, which is the format used by the underlying library featuring the ODE solvers. To perform SSA analysis, click PEPA > Time Series Analysis > SSA.... You will be provided with a similar dialog box to the ODE one. An important SSA-related parameter to set here is the number of replications used during the simulation. 24
26 Chapter 7 Importing UML models 7.1 Importing from UML To import a PEPA model from a UML model, right click the.uml file in the Navigator view and click Generate PEPA Model.... You will be provided with a wizard dialog asking you which collaboration line stereotype application you want to import and the destination file. 25
12 The PEPA Plug-in for Eclipse
 12 The PEPA Plug-in for Eclipse In this lecture note we introduce the tool support which is available when modelling with PEPA. Undertaking modelling studies of any reasonable size is only possible if
A New Generation PEPA Workbench
 A New Generation PEPA Workbench Mirco Tribastone Stephen Gilmore Abstract We present recent developments on the implementation of a new PEPA Workbench, a cross-platform application for editing, analysing,
A QUICK OVERVIEW OF THE OMNeT++ IDE
 Introduction A QUICK OVERVIEW OF THE OMNeT++ IDE The OMNeT++ Integrated Development Environment is based on the Eclipse platform, and extends it with new editors, views, wizards, and additional functionality.
The PALOMA Eclipse Plug-in User Manual
 The PALOMA Eclipse Plug-in User Manual Cheng Feng April 28, 2015 Contents 1 Installation Instructions 2 2 Creating a New Project 4 3 Parse a PALOMA Model 4 4 Time-series Analysis 5 4.1 Performing stochastic
EXCEL IMPORT user guide
 18.2 user guide No Magic, Inc. 2015 All material contained herein is considered proprietary information owned by No Magic, Inc. and is not to be shared, copied, or reproduced by any means. All information
DNS Server Status Dashboard
 The Cisco Prime IP Express server status dashboard in the web user interface (web UI) presents a graphical view of the system status, using graphs, charts, and tables, to help in tracking and diagnosis.
Partial Evaluation of PEPA Models for Fluid-flow Analysis
 Partial Evaluation of PEPA Models for Fluid-flow Analysis Allan Clark, Adam Duguid, Stephen Gilmore and Mirco Tribastone LFCS, University of Edinburgh Abstract. We present an application of partial evaluation
Moving From Studio to Atelier. Wouter Dupré Sales Engineer
 Moving From Studio to Atelier Wouter Dupré Sales Engineer Before we start the journey Introduction Atelier: What is it? Atelier is a modern IDE for applications developers Implemented as a plug-in to Eclipse
SAS Visual Analytics 8.2: Getting Started with Reports
 SAS Visual Analytics 8.2: Getting Started with Reports Introduction Reporting The SAS Visual Analytics tools give you everything you need to produce and distribute clear and compelling reports. SAS Visual
Multi-Sponsor Environment. SAS Clinical Trial Data Transparency User Guide
 Multi-Sponsor Environment SAS Clinical Trial Data Transparency User Guide Version 6.0 01 December 2017 Contents Contents 1 Overview...1 2 Setting up Your Account...3 2.1 Completing the Initial Email and
Introduction to CS graphs and plots in Excel Jacek Wiślicki, Laurent Babout,
 MS Excel 2010 offers a large set of graphs and plots for data visualization. For those who are familiar with older version of Excel, the layout is completely different. The following exercises demonstrate
Test/Debug Guide. Reference Pages. Test/Debug Guide. Site Map Index
 Site Map Index HomeInstallationStartAuthoringStreamSQLTest/DebugAPI GuideAdminAdaptersSamplesStudio GuideReferences Current Location: Home > Test/Debug Guide Test/Debug Guide The following topics explain
Enterprise Miner Version 4.0. Changes and Enhancements
 Enterprise Miner Version 4.0 Changes and Enhancements Table of Contents General Information.................................................................. 1 Upgrading Previous Version Enterprise Miner
Partial Evaluation of PEPA Models for Fluid-Flow Analysis
 Partial Evaluation of PEPA Models for Fluid-Flow Analysis Allan Clark, Adam Duguid, Stephen Gilmore, and Mirco Tribastone LFCS, University of Edinburgh Abstract. We present an application of partial evaluation
Advanced Application Reporting USER GUIDE
 Advanced Application Reporting USER GUIDE CONTENTS 1.0 Preface: About This Document 5 2.0 Conventions 5 3.0 Chapter 1: Introducing Advanced Application Reporting 6 4.0 Features and Benefits 7 5.0 Product
MicroStrategy Desktop
 MicroStrategy Desktop Quick Start Guide MicroStrategy Desktop is designed to enable business professionals like you to explore data, simply and without needing direct support from IT. 1 Import data from
Embarcadero DB Optimizer 1.5 Evaluation Guide. Published: March 16, 2009
 Embarcadero DB Optimizer 1.5 Evaluation Guide Published: March 16, 2009 Contents INTRODUCTION TO DB OPTIMIZER... 4 Product Benefits... 4 ABOUT THIS EVALUATION GUIDE... 6 SESSION 1: GETTING STARTED WITH
Choreographer Platform User Guide. The Laboratory for Foundations of Computer Science School of Informatics University of Edinburgh
 Choreographer Platform User Guide N.V. Haenel, {valentin.haenel@gmx.de} The Laboratory for Foundations of Computer Science School of Informatics University of Edinburgh First Edition: January 11, 2005
UNIT 4. Research Methods in Business
 UNIT 4 Preparing Data for Analysis:- After data are obtained through questionnaires, interviews, observation or through secondary sources, they need to be edited. The blank responses, if any have to be
Server Status Dashboard
 The Cisco Prime Network Registrar server status dashboard in the web user interface (web UI) presents a graphical view of the system status, using graphs, charts, and tables, to help in tracking and diagnosis.
At the shell prompt, enter idlde
 IDL Workbench Quick Reference The IDL Workbench is IDL s graphical user interface and integrated development environment. The IDL Workbench is based on the Eclipse framework; if you are already familiar
Objective 1: Familiarize yourself with basic database terms and definitions. Objective 2: Familiarize yourself with the Access environment.
 Beginning Access 2007 Objective 1: Familiarize yourself with basic database terms and definitions. What is a Database? A Database is simply defined as a collection of related groups of information. Things
Smart Tool Suite. Documentation. Users Manual. Version 1.0
 Smart Tool Suite Documentation Users Manual Version 1.0 1 Smart Tool Suite Users Manual Smart Tool Suite Description Installation Supported Operation Systems and Additional Licenses Installation Instructions
Importing source database objects from a database
 Importing source database objects from a database We are now at the point where we can finally import our source database objects, source database objects. We ll walk through the process of importing from
Excel For Algebra. Conversion Notes: Excel 2007 vs Excel 2003
 Excel For Algebra Conversion Notes: Excel 2007 vs Excel 2003 If you re used to Excel 2003, you re likely to have some trouble switching over to Excel 2007. That s because Microsoft completely reworked
Mend for Eclipse quick start guide local analysis
 The Semmle Mend for Eclipse plugin allows users to view Semmle results in Eclipse. This document describes how to install and use the plugin for local analysis. You can install the plugin using a Semmle
MODELLING AND PREFORMANCE ANALYSIS FOR VIDEO ON DEMAND PRIOR STORING SERVER
 MODELLING AND PREFORMANCE ANALYSIS FOR VIDEO ON DEMAND PRIOR STORING SERVER Tony Tsang and Ho Fong Fun Centre of International Education, Hong Kong College of Technology, Hong Kong ABSTRACT To handle the
NICK COLLIER - REPAST DEVELOPMENT TEAM
 DATA COLLECTION FOR REPAST SIMPHONY JAVA AND RELOGO NICK COLLIER - REPAST DEVELOPMENT TEAM 0. Before We Get Started This document is an introduction to the data collection system introduced in Repast Simphony
RK4. Version 2.0 (updated 5/30/2005) 2001, 2005 Tomas Co. Michigan Technological University Houghton, MI 49931
 2001, 2005 Tomas Co. Michigan Technological University Houghton, MI 49931") RK4 Version 2.0 (updated 5/30/2005) 2001, 2005 Tomas Co Michigan Technological University Houghton, MI 49931 Table of Contents Description 3 Rationale 3 Special Features 3 Installing the RK4 Add-In 4 Activating/Deactivating
RK4 Version 2.0 (updated 5/30/2005) 2001, 2005 Tomas Co Michigan Technological University Houghton, MI 49931 Table of Contents Description 3 Rationale 3 Special Features 3 Installing the RK4 Add-In 4 Activating/Deactivating
KIN 147 Lab Practical Mid-term: Tibial Acceleration Data Analysis Excel analyses work much better on PCs than on Macs (especially older Macs)
") KIN 147 Lab Practical Mid-term: Tibial Acceleration Data Analysis Excel analyses work much better on PCs than on Macs (especially older Macs) Your goal is to correctly analyze accelerometer data Analyzing
KIN 147 Lab Practical Mid-term: Tibial Acceleration Data Analysis Excel analyses work much better on PCs than on Macs (especially older Macs) Your goal is to correctly analyze accelerometer data Analyzing
1 Overview. 1 Overview. Contents. 1.1 Table of Contents Table of Contents
 1 Overview Contents 1. 1.1 Table of Contents 1 Overview Papyrus is an environment for editing any kind of EMF model, particularly supporting UML 2 ( Unified Modeling Language (UML) version 2.4.1 ) and
Math 227 EXCEL / MEGASTAT Guide
 Math 227 EXCEL / MEGASTAT Guide Introduction Introduction: Ch2: Frequency Distributions and Graphs Construct Frequency Distributions and various types of graphs: Histograms, Polygons, Pie Charts, Stem-and-Leaf
EDIT 2014 Users Manual
 EUROPEAN COMMISSION EUROSTAT Directorate B: Methodology; corporate statistical and IT Services Unit B-3: IT for statistical production EDIT 2014 Users Manual Date: 03.12.2014 Version: 01.20 Commission
download instant at
 CHAPTER 1 - LAB SESSION INTRODUCTION TO EXCEL INTRODUCTION: This lab session is designed to introduce you to the statistical aspects of Microsoft Excel. During this session you will learn how to enter
Question: How do I move my mobile account from the Corporate to my Personal Account?
 Question: How do I move my mobile account from the Corporate to my Personal Account? Answer: A user leaving Nortel can move his/her account off of the corporate program and into a personal liable account.
Contents Part I: Background Information About This Handbook... 2 Excel Terminology Part II: Advanced Excel Tasks...
 Version 3 Updated November 29, 2007 Contents Contents... 3 Part I: Background Information... 1 About This Handbook... 2 Excel Terminology... 3 Part II:... 4 Advanced Excel Tasks... 4 Export Data from
DNS Server Status Dashboard
 The Cisco Prime Network Registrar server status dashboard in the web user interface (web UI) presents a graphical view of the system status, using graphs, charts, and tables, to help in tracking and diagnosis.
EXCEL 2003 DISCLAIMER:
 EXCEL 2003 DISCLAIMER: This reference guide is meant for experienced Microsoft Excel users. It provides a list of quick tips and shortcuts for familiar features. This guide does NOT replace training or
KIN 147 Lab 02: Acceleration Data Analysis
 KIN 147 Lab 02: Acceleration Data Analysis Excel analyses work much better on PCs than on Macs (especially older Macs) Your goal is to correctly analyze accelerometer data Analyzing the Acceleration Data
QDA Miner. Addendum v2.0
 QDA Miner Addendum v2.0 QDA Miner is an easy-to-use qualitative analysis software for coding, annotating, retrieving and reviewing coded data and documents such as open-ended responses, customer comments,
Topaz Workbench Data Visualizer User Guide
 Topaz Workbench Data Visualizer User Guide Table of Contents Displaying Properties... 1 Entering Java Regular Expressions in Filter Fields... 3 Related Topics... 3 Exporting the Extract Trace Events View...
WPS Workbench. user guide. "To help guide you through using the WPS user interface (Workbench) to create, edit and run programs"
 to create, edit and run programs") WPS Workbench user guide "To help guide you through using the WPS user interface (Workbench) to create, edit and run programs" Version: 3.1.7 Copyright 2002-2018 World Programming Limited www.worldprogramming.com
WPS Workbench user guide "To help guide you through using the WPS user interface (Workbench) to create, edit and run programs" Version: 3.1.7 Copyright 2002-2018 World Programming Limited www.worldprogramming.com
Steady-State and Transient Thermal Analysis of a Circuit Board
 Steady-State and Transient Thermal Analysis of a Circuit Board Problem Description The circuit board shown below includes three chips that produce heat during normal operation. One chip stays energized
UNIVERSITI TEKNIKAL MALAYSIA MELAKA FAKULTI KEJURUTERAAN ELEKTRONIK DAN KEJURUTERAAN KOMPUTER
 UNIVERSITI TEKNIKAL MALAYSIA MELAKA FAKULTI KEJURUTERAAN ELEKTRONIK DAN KEJURUTERAAN KOMPUTER FAKULTI KEJURUTERAAN ELEKTRONIK DAN KEJURUTERAAN KOMPUTER BENC 2113 DENC ECADD 2532 ECADD LAB SESSION 6/7 LAB
Separate Text Across Cells The Convert Text to Columns Wizard can help you to divide the text into columns separated with specific symbols.
 Chapter 7 Highlights 7.1 The Use of Formulas and Functions 7.2 Creating Charts 7.3 Using Chart Toolbar 7.4 Changing Source Data of a Chart Separate Text Across Cells The Convert Text to Columns Wizard
Getting Started with Code Coverage/Eclipse
 Getting Started with Code Coverage/Eclipse Code Coverage/Eclipse is the modernized GUI for Compuware s Xpediter/Code Coverage product. With it, users can create reports detailing testing efficiency and
Chapter 4 Determining Cell Size
 Chapter 4 Determining Cell Size Chapter 4 Determining Cell Size The third tutorial is designed to give you a demonstration in using the Cell Size Calculator to obtain the optimal cell size for your circuit
File Importing - Text Files
 File Importing - Text Files With this tutorial we are going to go through the basic elements of importing a text file that contains several records (lines) each containing several fields. Sample Data -
4. In the Change Chart Type dialog box, click the type of chart to which you want to change. 5. Click the chart style. 6. Click OK.
 PROCEDURES LESSON 21: BUILDING BASIC CHARTS Creating a Chart 1 Select the range of data you want to chart 2 Click the INSERT tab Charts Group 3 Click the desired chart category button 4 In the gallery,
RK4. Version 3.0. (updated 12/1/2006) 2001, 2005, 2006 Tomas Co. Michigan Technological University Houghton, MI 49931
 2001, 2005, 2006 Tomas Co. Michigan Technological University Houghton, MI 49931") RK4 Version 3.0 (updated 12/1/2006) 2001, 2005, 2006 Tomas Co Michigan Technological University Houghton, MI 49931 Table of Contents Description 3 Rationale 3 Special Features 3 Installing the RK4 Add-In
RK4 Version 3.0 (updated 12/1/2006) 2001, 2005, 2006 Tomas Co Michigan Technological University Houghton, MI 49931 Table of Contents Description 3 Rationale 3 Special Features 3 Installing the RK4 Add-In
Embarcadero DB Optimizer 1.0 Evaluation Guide. Published: July 14, 2008
 Published: July 14, 2008 Embarcadero Technologies, Inc. 100 California Street, 12th Floor San Francisco, CA 94111 U.S.A. This is a preliminary document and may be changed substantially prior to final commercial
Interwrite Response v. 6 with PRS or CPS Pulse
 Interwrite Response v. 6 with PRS or CPS Pulse What is PRS/Response?... 2 How PRS/Response Works... 2 Using the PRS/Response Clicker... 2 Using the CPS Pulse/Response Clicker... 3 Response Software...
Business Intelligence and Reporting Tools
 Business Intelligence and Reporting Tools Release 1.0 Requirements Document Version 1.0 November 8, 2004 Contents Eclipse Business Intelligence and Reporting Tools Project Requirements...2 Project Overview...2
Following a tour is the easiest way to learn Prism.
 Page 1 of 25 A tour of Prism Following a tour is the easiest way to learn Prism. View a movie Watch and listen to a ten minute introductory movie from Prism's Welcome dialog. Or view it on the web. Read
SAS Report Viewer 8.2 Documentation
 SAS Report Viewer 8.2 Documentation About SAS Report Viewer SAS Report Viewer (the report viewer) enables users who are not report designers to view a report using a web browser. To open a report in the
DiskSavvy Disk Space Analyzer. DiskSavvy DISK SPACE ANALYZER. User Manual. Version Dec Flexense Ltd.
 DiskSavvy DISK SPACE ANALYZER User Manual Version 10.3 Dec 2017 www.disksavvy.com info@flexense.com 1 1 Product Overview...3 2 Product Versions...7 3 Using Desktop Versions...8 3.1 Product Installation
12/22/11. Java How to Program, 9/e. Help you get started with Eclipse and NetBeans integrated development environments.
 Java How to Program, 9/e Education, Inc. All Rights Reserved. } Java application programming } Use tools from the JDK to compile and run programs. } Videos at www.deitel.com/books/jhtp9/ Help you get started
University of North Dakota PeopleSoft Finance Tip Sheets. Utilizing the Query Download Feature
 There is a custom feature available in Query Viewer that allows files to be created from queries and copied to a user s PC. This feature doesn t have the same size limitations as running a query to HTML
You can import data from a CSV file into an existing table or to a new table. The steps are almost identical:
 Importing Table Data Only in DbVisualizer Pro This feature is only available in the DbVisualizer Pro edition. You can import data using the Import Table Data wizard. Input File Format and Other Options
Technical Documentation Version 7.2 Multiple Run Management
 Technical Documentation Version 7.2 Multiple Run Management These documents are copyrighted by the Regents of the University of Colorado. No part of this document may be reproduced, stored in a retrieval
Workplace Planner Error Fixes by Version
 Workplace Planner Error Fixes by Version 5.2.0.0 1. AutoCAD 2018 Support. 5.1.1.0 2. Bugfix for localization issue on non-english operating system with the RLM licensing system. 5.1.0.0 Fixed on 11/13/2015,
Enterprise Architect. User Guide Series. Portals. Author: Sparx Systems. Date: 19/03/2018. Version: 1.0 CREATED WITH
 Enterprise Architect User Guide Series Portals Author: Sparx Systems Date: 19/03/2018 Version: 1.0 CREATED WITH Table of Contents Portals 3 Perspective Portal 6 Workspace Portal 7 Window Portal 9 Status
lab MS Excel 2010 active cell
 MS Excel is an example of a spreadsheet, a branch of software meant for performing different kinds of calculations, numeric data analysis and presentation, statistical operations and forecasts. The main
jmetrik 2.1 What is jmetrik? Obtaining and installing the software Formatting and importing your data
 Software Corner jmetrik 2.1 Aaron Olaf Batty abatty@sfc.keio.ac.jp Keio University Many researchers are curious about Rasch analysis and would like to try it with their own data, and most have a need for
DITAworks Guide for Authors
 DITAworks Guide for Authors instinctools GmbH, Sophienstr. 17, D - 70178 Stuttgart Phone: +49 711 99338590, E-mail: contact@instinctools.com, www.instinctools.com, www.ditaworks.com Copyright 2009 * instinctools
Enterprise Architect. User Guide Series. Portals
 Enterprise Architect User Guide Series Portals What are Portals? In Sparx Systems Enterprise Architect, each Portal is a high-level logical grouping of common tools, custom searches, window layouts and
The Cantor Handbook. Alexander Rieder
 Alexander Rieder 2 Contents 1 Introduction 5 2 Using Cantor 6 2.1 Cantor features....................................... 6 2.2 The Cantor backends.................................... 7 2.3 The Cantor Workspace...................................
Instrument Toolkit Instructional Manual
 Instrument Toolkit Instructional Manual Installation The following instructions will walk you through installing Instrument Toolkit. First, you will need to install the Full Install version of Instrument
Industrial Data Forwarder for Splunk Kepware, Inc.
 Industrial Data Forwarder for Splunk 2016 Kepware, Inc. Industrial Data Forwarder for Splunk 2 Table of Contents Table of Contents 2 Industrial Data Forwarder for Splunk 3 Overview 3 User Interface 4 Quick
Halcyon Spooled File Manager GUI. v8.0 User Guide
 Halcyon Spooled File Manager GUI v8.0 User Guide Copyright Copyright HelpSystems, LLC. All rights reserved. www.helpsystems.com US: +1 952-933-0609 Outside the U.S.: +44 (0) 870 120 3148 IBM, AS/400, OS/400,
ZENworks Reporting System Reference. January 2017
 ZENworks Reporting System Reference January 2017 Legal Notices For information about legal notices, trademarks, disclaimers, warranties, export and other use restrictions, U.S. Government rights, patent
Console Guide. Version 4.4
 Console Guide Version 4.4 Table of Contents Preface 4 Who Should Use This Guide 4 How This Guide is Organized 4 Document Feedback 4 Document Conventions Used in This Guide 5 Connecting to the Database
Infor LN Studio Application Development Guide
 Infor LN Studio Application Development Guide Copyright 2016 Infor Important Notices The material contained in this publication (including any supplementary information) constitutes and contains confidential
Online Help StruxureWare Data Center Expert
 Online Help StruxureWare Data Center Expert Version 7.2.7 What's New in StruxureWare Data Center Expert 7.2.x Learn more about the new features available in the StruxureWare Data Center Expert 7.2.x release.
QlikView Full Browser User Manual. User Manual
 QlikView Full Browser User Manual User Manual Henrik Steen 8-13-2014 2014-08-13 2014-10-28 Henrik Steen 01 1 Table of Content 1 Introduction... 3 2 QlikView AccessPoint... 3 3 Interface... 3 3.1 Object...
OrgPublisher Photos, Logos, and Legends
 OrgPublisher Photos, Logos, and Legends Table of Contents Table of Contents Photos... 3 Inserting Photos... 3 Photo Wait Time... 5 Logos... 7 Adding a Logo... 7 Adding a Background Image... 8 Legends...
Excel Tutorial 4: Analyzing and Charting Financial Data
 Excel Tutorial 4: Analyzing and Charting Financial Data Microsoft Office 2013 Objectives Use the PMT function to calculate a loan payment Create an embedded pie chart Apply styles to a chart Add data labels
CREATING ACCESSIBLE SPREADSHEETS IN MICROSOFT EXCEL 2010/13 (WINDOWS) & 2011 (MAC)
 & 2011 (MAC)") CREATING ACCESSIBLE SPREADSHEETS IN MICROSOFT EXCEL 2010/13 (WINDOWS) & 2011 (MAC) Screen readers and Excel Users who are blind rely on software called a screen reader to interact with spreadsheets. Screen
CREATING ACCESSIBLE SPREADSHEETS IN MICROSOFT EXCEL 2010/13 (WINDOWS) & 2011 (MAC) Screen readers and Excel Users who are blind rely on software called a screen reader to interact with spreadsheets. Screen
APPLICATION USER GUIDE
 APPLICATION USER GUIDE Application: Analytics Version: 1.0 Description: Analytics provides a complete view of your website analytics and usage. Page 2 of 59 Analytics 1.0 Summary Contents 1 ANALYTICS...
Spreadsheet View and Basic Statistics Concepts
 Spreadsheet View and Basic Statistics Concepts GeoGebra 3.2 Workshop Handout 9 Judith and Markus Hohenwarter www.geogebra.org Table of Contents 1. Introduction to GeoGebra s Spreadsheet View 2 2. Record
Using the Subscriber Manager GUI Tool
 CHAPTER 11 Using the Subscriber Manager GUI Tool Published: December 23, 2013, Introduction This chapter describes how to use the Subscriber Manager (SM) graphical user interface (GUI) tool to configure
Dependable and Secure Systems Dependability
 Dependable and Secure Systems Dependability Master of Science in Embedded Computing Systems Quantitative Dependability Analysis with Stochastic Activity Networks: the Möbius Tool Andrea Domenici DII, Università
Podium Plus Data Analysis Software. User Manual. SWIS10 Version
 SWIS10 Version Issue 1.10 February 2005 Contents 1 Introduction 6 1.1 What is Podium Plus? 6 1.2 About This Manual 6 1.3 Typographical Conventions 7 1.4 Getting Technical Support 7 2 Getting Started 8
SAS Report Viewer 8.3 Documentation
 SAS Report Viewer 8.3 Documentation About SAS Report Viewer Introduction to SAS Report Viewer SAS Report Viewer (the report viewer) enables users who are not report designers to view a report using a web
SAS Visual Analytics 8.2: Working with Report Content
 SAS Visual Analytics 8.2: Working with Report Content About Objects After selecting your data source and data items, add one or more objects to display the results. SAS Visual Analytics provides objects
Text version 15-Aug-12. for Q-CHECKER V4, V5 and V6
 Text version 15-Aug-12 Q-MONITOR V4 for Q-CHECKER V4, V5 and V6 USERS GUIDE Orientation Symbols used in the manual For better orientation in the manual the following symbols are used: Warning symbol Tip
Java Program Structure and Eclipse. Overview. Eclipse Projects and Project Structure. COMP 210: Object-Oriented Programming Lecture Notes 1
 COMP 210: Object-Oriented Programming Lecture Notes 1 Java Program Structure and Eclipse Robert Utterback In these notes we talk about the basic structure of Java-based OOP programs and how to setup and
WinFlexOne - Importer MHM Resources LLC
 WinFlexOne - Importer 2008 MHM Resources LLC WinFlexOne Importer - Employee 2 This module provides: Overview Log In Source File Importer Profile Download Activate Import Source File WinFlexOne Importer
Embarcadero PowerSQL 1.1 Evaluation Guide. Published: July 14, 2008
 Embarcadero PowerSQL 1.1 Evaluation Guide Published: July 14, 2008 Contents INTRODUCTION TO POWERSQL... 3 Product Benefits... 3 Product Benefits... 3 Product Benefits... 3 ABOUT THIS EVALUATION GUIDE...
CHAPTER 1 GETTING STARTED
 CHAPTER 1 GETTING STARTED Configuration Requirements This design of experiment software package is written for the Windows 2000, XP and Vista environment. The following system requirements are necessary
Microsoft Excel 2007
 Microsoft Excel 2007 1 Excel is Microsoft s Spreadsheet program. Spreadsheets are often used as a method of displaying and manipulating groups of data in an effective manner. It was originally created
To access Contacts view, locate and select the Contacts View tab in the lower-left corner of the screen. Contacts view will appear.
 Outlook 2010 Managing Contacts Introduction Contacts view is the central place for all your contacts in Outlook 2010. Maintaining a detailed contacts list will make sending emails and scheduling meetings
1. SQL Server Integration Services. What Is Microsoft BI? Core concept BI Introduction to SQL Server Integration Services
 1. SQL Server Integration Services What Is Microsoft BI? Core concept BI Introduction to SQL Server Integration Services Product History SSIS Package Architecture Overview Development and Management Tools
Integrating Word, Excel, Access, and PowerPoint
 Integrating Word, Excel, Access, and PowerPoint Microsoft Office 2013 Session 1: Integrating Word and Excel Objectives: Embed an Excel chart in a Word document Edit an Excel chart in a Word document Link
Drools Tools Reference Guide. Version: CR1
 Drools Tools Reference Guide Version: 5.0.0.CR1 1. Introduction... 1 1.1. What is Drools?... 1 1.2. Drools Tools Key Features... 1 1.3. Other relevant resources on the topic... 2 2. Creating a New Drools
EAXML Demonstration Platform on Artop/Sphinx.
 Grant Agreement 260057 Model-based Analysis & Engineering of Novel Architectures for Dependable Electric Vehicles Report type Report name Deliverable D5.3.1 EAXML Demonstration Platform on Artop/Sphinx.
Version: Copyright World Programming Limited
 Version: 3.0.7.0.650 Copyright 2002-2017 World Programming Limited www.teamwpc.co.uk Contents Introduction... 5 About This Guide... 5 About WPS...5 Users of SAS Software...6 Getting Started... 8 Workbench
Access Intermediate
 Access 2010 - Intermediate 103-134 Unit 6 - Data Integration Quick Links & Text References Overview Pages AC418 AC419 Showing Data on the Web Pages AC420 AC423 CSV Files Pages AC423 AC428 XML Files Pages
1. Basic Steps for Data Analysis Data Editor. 2.4.To create a new SPSS file
 1 SPSS Guide 2009 Content 1. Basic Steps for Data Analysis. 3 2. Data Editor. 2.4.To create a new SPSS file 3 4 3. Data Analysis/ Frequencies. 5 4. Recoding the variable into classes.. 5 5. Data Analysis/
SYNTHESYS MANAGEMENT APPLICATIONS
 SYNTHESYS MANAGEMENT APPLICATIONS CUSTOMER RELATIONSHIP MANAGEMENT CRM Maintenance Table CRM Properties Table 1 SYNTHESYS APPLICATIONS: CRM EDITOR Introduction... 3 Using CRM Details in a Synthesys Webflow...