JVM Performance Study Comparing Java HotSpot to Azul Zing Using Red Hat JBoss Data Grid
|
|
|
- Branden Dawson
- 6 years ago
- Views:
Transcription
1 JVM Performance Study Comparing Java HotSpot to Azul Zing Using Red Hat JBoss Data Grid
2 Legal Notices JBoss, Red Hat and their respective logos are trademarks or registered trademarks of Red Hat, Inc. Azul Systems, Zing and the Azul logo are trademarks or registered trademarks of Azul Systems, Inc. Linux is a registered trademark of Linus Torvalds. CentOS is the property of the CentOS project. Oracle, Java, and HotSpot are trademarks or registered trademarks of Oracle Corporation and/or its affiliates. Intel and Intel Xeon are trademarks or registered trademarks of Intel Corporation or its subsidiaries in the United States and other countries. Solarflare is a trademark or registered trademark of Solarflare Communications, Inc. GitHub is a registered trademark of GitHub, Inc. Other marks are the property of their respective owners and are used here only for identification purposes 2 of 23
3 Table of Contents Legal Notices Executive Summary Background Testing Environment Testing Methodology Results Conclusion References Appendix of 23
4 1 Executive Summary While new In-memory Computing (IMC) techniques hold the promise of better scalability and performance, ensuring consistent, low latency performance isn t a guarantee for all Java applications. Careful attention to product choices, runtime components and deployment topologies are essential to maximizing the values of these new IMC solutions, including In-memory Data Grids (IMDGs). This benchmark study compares the response time performance of two different JVMs, namely Azul Zing and Java HotSpot, while running Red Hat JBoss Data Grid at different node sizes. All benchmark results were derived using the open source RadarGun framework and the jhiccup measurement tool. The testing methodology was designed to measure response time consistency and throughput of the data grid nodes at different JVM heap sizes. The data grid was configured for distributed mode with one data node and one backup node replicated across two physical servers (4 nodes total). The jhiccup measurement tool was used to capture and graph the response time distribution of the two JVMs during all benchmark runs. The results of the benchmark clearly show that response time distributions and runtime consistency vary widely between the two JVMs. For Java HotSpot, which employs a stop-the-world young generation collector, response time variance was more than 250x across individual runs (i.e. was not measurable using standard deviation). In contrast the Azul Zing runtime showed highly predictable response time consistency across the entire distribution. At 5 9s (i.e %) Zing had a maximum response time of only 23 milliseconds when the grid was deployed using a 200 GB node. In addition, Java HotSpot, which reported response time outliers exceeding multiple seconds at 100 GB, was not able to complete the benchmark run at 200 GB because of system saturation due to consecutive garbage collections. The profound difference in response time profile of the two JVMs suggests that for Java deployments that require low latency SLAs, large individual instances (e.g. 20+ GB heaps), or higher sustained throughput, only the Zing JVM can keep up with object allocation rates without stalling the application. For data grid deployments, this could mean 1) lower node response times (<50 msec), 2) greater resistance to node failures due to heavy load and 3) larger node capacity with support for Java heaps up to 340 GB. This paper describes the testing environment, testing methodology and resulting response time profiles of two different JVMs while running JBoss Data Grid. Companies deploying or running Java applications including IMDGs can use this information to make more informed JVM choices to meet their specific business use case or they can leverage this benchmark to design their own testing scenarios. 4 of 23
5 2 Background Red Hat JBoss Data Grid, based on the Infinispan open source community project, is a distributed in-memory grid, supporting local, replicated, invalidation and distributed modes, While JBoss Data Grid can be configured in a number of different topologies, it is typically deployed as a data tier to provide faster read/write behavior and data replication while offloading the database or persistent data store. As an in-memory schema-less key/value store, JBoss Data Grid can provide a simple and flexible means to storing different objects without a fixed data model. Because the JBoss Data Grid is a Java application, it requires a Java Virtual Machine (JVM) for runtime deployment. Since not all JVMs are the same and employ different garbage collection algorithms (e.g. Concurrent Mark Sweep), the benchmark was configured to capture JVM response time variances for different Java heap sizes, live set sizes, objection allocation rates, mutation rates and other application-specific characteristics. For this performance study, the RadarGun benchmarking framework coupled with the jhiccup measurement tool was used to simulate load and measure response times of the JVMs. Originally designed to compare the performance of different data grid products, RadarGun provides a reproducible way to simulate a specific transaction load and measure the performance of the individual data grid nodes. To ensure accurate runtime measurements, even during long garbage collection (GC) pauses, jhiccup was added to the benchmark. Designed to measure only JVM responsiveness, jhiccup shows the best possible response time the application or data grid could have experienced during the benchmark run. jhiccup is not an end-toend performance measurement tool and does not capture the additional overhead of the application or data grid transaction logic. 3 Testing Environment The test environment consisted of two nearly identical Iron Systems servers; Node Servers A and B. Each server had 4 Intel Xeon processors with 512 GB of memory, running Red Hat Enterprise Linux 6 and JBoss Data Grid version 6.2. The two machines were directly interconnected using Solarflare Communications Solarstorm SFC GbE network cards. The exact configurations are listed below: Machine Configuration Node Server A Manufacturer Iron Systems Processors (x 4) Intel Xeon CPU 2.00GHz Memory (x 32) 16GB RDIMM, 1066MHz, Low Volt, Dual Rank Networking 1 x Solarflare Communications SFC9020 OS Red Hat Enterprise Linux Server release of 23
6 Machine Configuration Node Server B Manufacturer Iron Systems Processors (x 4) Intel Xeon CPU E Memory (x 32) 16GB RDIMM, 1333MHz, Low Volt, Dual Rank Networking 1 x Solarflare Communications SFC9020 OS Red Hat Enterprise Linux Server release 6.2 The data grid was configured on the two servers in distributed mode with 1 backup or copy node replicated on the other system (i.e. 4 nodes in total). The RadarGun benchmark was configured with a master process on Node Server A which communicated directly with all 4 nodes via an in-process client which in turn issued requests to individual data grid nodes. jhiccup version was used to launch the RadarGun benchmark, capturing JVM response times across all 4 grid nodes and then graphing the response time distribution up to the th percentile. Both servers where configured to support both JVMs. The Java HotSpot JVM was configured to use the CMS collector with the following flags: -XX:NewRatio=3 -XX:+UseConcMarkSweepGC -XX:+UseParNewGC -XX:MaxPermSize=512m -XX:+PrintGCDetails -XX:+PrintGCTimeStamps -XX:+UseLargePages The Azul Zing runtime did not employ any runtime flags and used the default C4 collector. For both Zing and Java HotSpot, the RHEL operating system was configured to use LargePages: -XX:+UseLargePages Java Configuration Azul Zing Java HotSpot JVM Version Azul Systems Zing java version "1.7.0-zing_ " Zing Runtime Environment for Java Applications (build zing_ b4) Zing 64-Bit Tiered VM (build zing_ b15-product-azlinuxM-X86_64, mixed mode) Java HotSpot java version "1.7.0_05" Java SE Runtime Environment (build 1.7.0_05-b06) Java HotSpot 64-Bit Server VM (build 23.1-b03, mixed mode) 6 of 23
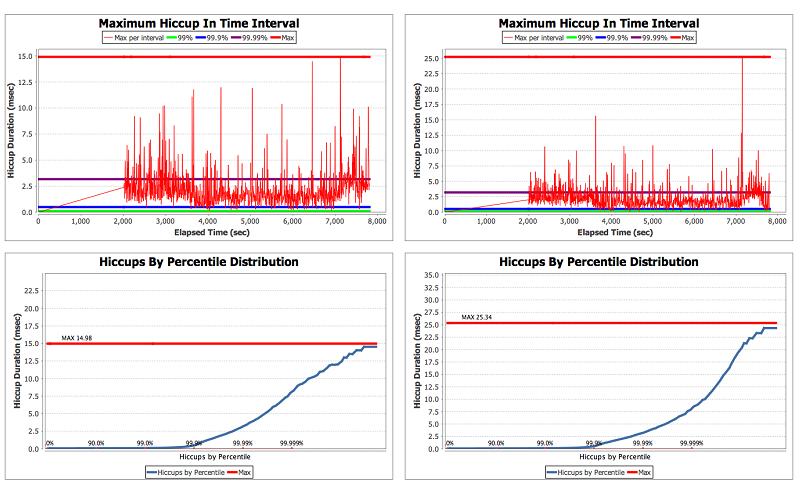
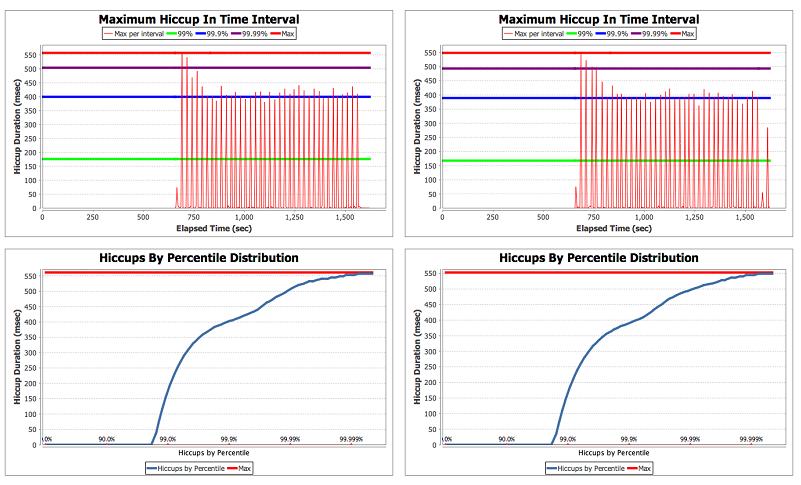
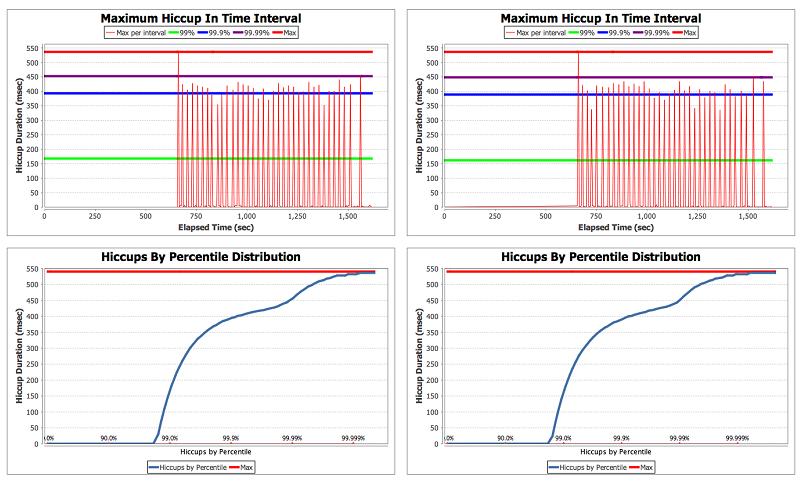
7 4 Testing Methodology The benchmark was designed to measure JVM response times and throughput of JBoss Data Grid at multiple JVM heap sizes. Performance runs at 20, 40, 60, 100 and 200 GB heaps were repeated on both the Azul Zing and Java HotSpot JVMs. JBoss Data Grid was configured in distributed mode with just a single copy of the data and a backup replicated across two physical servers. In order to simulate real world conditions, the individual grid nodes and corresponding JVM memory heaps, were primed by the RadarGun benchmark for each test and before jhiccup measurements were taken. Initial data loads were approximately 40% of the maximum heap size for each run. In order to approximate typical Java HotSpot response times and maximum outliers during this short duration benchmark (i.e minutes), the default NewRatio=3 was used to avoid full garbage collection pauses during the measurement period 1. This ratio resulted in 25% of the heap allocated to the young generation and 75% dedicated to the old generation. In addition to priming the data nodes, the benchmark utilized multiple object sizes (i.e. 15% 1K, 35% 2K and 50% 4K) to better simulate real world scenarios. For the first 3 Java heap sizes (20, 40, and 60 GB), the transactional mix of the RadarGun benchmark was set to a ratio of 67% read, 32% write, 1% remove. However, in order to accelerate the priming of the data notes to 40% for the 100 and 200 GB runs, the transactional mix was set to 39% read, 60% write, and 1% remove. Because the RadarGun benchmark was primarily designed to measure the throughput of individual grid nodes for a given load, the open source jhiccup tool was added to capture and graph the responsiveness of the JVMs during the benchmark runs. The tool captured the JVM response times for all 4 nodes and then combined the distributions into a single graph or Hiccup Chart. The graphs shown below are the individual Hiccup Charts for the Java HotSpot test at 60 GB: 1 The test was configured to simulate a well-tuned Java HotSpot JVM, that is, to delay or prevent a full garbage collection (with resulting application pauses) as long as possible. This is how an application would normally be configured in production. Without this additional tuning, Java HotSpot maximum response times were likely to be orders of magnitude larger than they were in our test. 7 of 23

8 Figure 1 Individual Hiccup Chart for Java HotSpot using 60 GB heaps The benchmark ran the same transaction loads on each JVM at different Java heap sizes (20, 40, 60, 100 and 200 GB). Both JVM response times and RadarGun throughput metrics were captured for each run. Below is the RadarGun configuration for the 20 GB heap test. RadarGun Benchmark Configuration 20GB heap test Benchmark Duration 15 minute runs Message Payload Sizes 15% 1024 bytes, 35% 2048 bytes, 50% 4096 bytes Mode of Data Grid Operation Distributed Heap Priming 35 45% Transactions 50,000 Transaction mix 67% read, 32% write, 1% remove Number of threads 30 8 of 23
9 5 Results By overlaying the different Hiccup Charts for all the Azul Zing and Java HotSpot runs, we can clearly see that response time consistency is vastly different for the two JVMs. While Java HotSpot performed well approximately 90% or the time (or 9 out of every 10 transactions), it starts to encounter response time delays at the 95 th percentile directly associated with its young generation CMS (Concurrent Mark Sweep) collector. Pauses for Java HotSpot at 20 GB approach 500 milliseconds (or ½ second) at the 99.9 th percentile. At 40 GB Java HotSpot approaches 1 second pauses, and at 60 GB, the JVM stalls approach 2 seconds. On even larger heaps Java HotSpot outliers start to dramatically increase (i.e. 5 seconds at 100 GB) and the JVM could not complete the benchmark at 200 GB because of severe thrashing. Figure 2 Aggregated Hiccup Chart Showing Pauses in Milliseconds From the graph in figure 2 Azul Zing shows highly consistent response time behavior across the entire benchmark spectrum. Whether at 20 GB or 200 GB, Zing response times were less than 30 milliseconds, with only a few outliers in the tails of the distributions as shown in Figure 3: 9 of 23

10 Figure 3 Hiccup Chart for Azul Zing using 200 GB heap When comparing the performance and consistency of the two JVMs, Azul Zing showed 22x better max outliers than Java HotSpot at 20 GB and more than a 250x advantage at 100 GB. While response time profiles of the two JVMs where very different, the throughput of the date grid as measured by RadarGun were much closer, with only a slight advantage to Zing (about 1 3% across the nodes) over the short duration of this benchmark (i.e minutes). 6 Conclusion This benchmark study demonstrates that application performance and runtime consistency can be greatly affected by the choice of JVM. Not all JVMs are the same and employ different GC algorithms that can impact application response time profiles. For applications that have explicit or even implicit SLAs, careful attention to application characteristics, such as heap size, live set size, objection allocation rates, and mutation rates are important factors when choosing a JVM that can meet deployment requirements. When metrics such as Sustained Throughput (i.e. a throughput value which never exceeds a specific response time SLA), and time-to-production are important, Azul Zing provides better runtime metrics with less JVM tuning and heap resizing in order to avoid potentially devastating pauses. For In-Memory Computing (IMC) solutions such as in-memory data grids (IMGDs), that benefit from larger Java heaps, Azul Zing provides a viable alternative with greater runtime consistency. When IMDGs are deployed with strict SLAs below milliseconds, only Azul Zing will guarantee success. For IMDG configurations where node timeouts needs to be very low (e.g. under 50 milliseconds), only the Zing runtime can guarantee response times that will not cause nodes to go offline. 10 of
11 7 References Red Hat JBoss Data Grid Azul Systems C4 Continuously Concurrent Compacting Collector (ISMM paper) Understanding Java Garbage Collection White Paper RadarGun Framework Tutorial on Github JHiccup open source performance measurement tool Azul Inspector Azul Systems Zing FAQ Contact Azul Systems Phone: Red Hat Phone: REDHAT1 WebForm: of
12 8 Appendix 8.1 Test Durations and Settings RadarGun Benchmark Configuration 20GB heap test Benchmark Duration 15 minute runs Message Payload Sizes 15% 1024 bytes, 35% 2048 bytes, 50% 4096 bytes Mode of Data Grid Operation Distributed Heap Priming 35 45% Transactions 50,000 Transaction mix 67% read, 32% write, 1% remove Number of threads 30 RadarGun Benchmark Configuration 40GB heap test Benchmark Duration 15 minute runs Message Payload Sizes 15% 1024 bytes, 35% 2048 bytes, 50% 4096 bytes Mode of Data Grid Operation Distributed Heap Priming 35 45% Transactions 50,000 Transaction mix 67% read, 32% write, 1% remove Number of threads 60 RadarGun Benchmark Configuration 60GB heap test Benchmark Duration 35 minute runs Message Payload Sizes 15% 1024 bytes, 35% 2048 bytes, 50% 4096 bytes Mode of Data Grid Operation Distributed Heap Priming 35 45% Transactions 50,000 Transaction mix 67% read, 32% write, 1% remove Number of threads of
13 RadarGun Benchmark Configuration 100GB heap test Benchmark Duration 60 minute runs Message Payload Sizes 15% 1024 bytes, 35% 2048 bytes, 50% 4096 bytes Mode of Data Grid Operation Distributed Heap Priming 35 45% Transactions 100,000 Transaction mix 39% read, 60% write, 1% remove Number of threads 100 RadarGun Benchmark Configuration 200GB heap test Benchmark Duration 120 minute runs Message Payload Sizes 15% 1024 bytes, 35% 2048 bytes, 50% 4096 bytes Mode of Data Grid Operation Distributed Heap Priming 35 45% Transactions 200,000 Transaction mix 39% read, 60% write, 1% remove Number of threads of

14 8.2 Hiccup Charts for All Runs Note that the 4 graphs in each section represent 4 nodes, each with its own set of data. Zing 200 GB 14 of

15 Zing 100 GB 15 of

16 Zing 60 GB 16 of
17 Zing 40 GB 17 of

18 Zing 20 GB 18 of


19 Java HotSpot 100 GB 19 of


20 Java HotSpot 60 GB 20 of

21 Java HotSpot 40 GB 21 of


22 Java HotSpot 20 GB 22 of
23 23 of
JVM Performance Study Comparing Oracle HotSpot and Azul Zing Using Apache Cassandra
 JVM Performance Study Comparing Oracle HotSpot and Azul Zing Using Apache Cassandra Legal Notices Apache Cassandra, Spark and Solr and their respective logos are trademarks or registered trademarks of
Java Without the Jitter
 TECHNOLOGY WHITE PAPER Achieving Ultra-Low Latency Table of Contents Executive Summary... 3 Introduction... 4 Why Java Pauses Can t Be Tuned Away.... 5 Modern Servers Have Huge Capacities Why Hasn t Latency
Understanding Application Hiccups
 Understanding Application Hiccups and what you can do about them An introduction to the Open Source jhiccup tool Gil Tene, CTO & co-founder, Azul Systems About me: Gil Tene co-founder, CTO @Azul Systems
Diffusion TM 5.0 Performance Benchmarks
 Diffusion TM 5.0 Performance Benchmarks Contents Introduction 3 Benchmark Overview 3 Methodology 4 Results 5 Conclusion 7 Appendix A Environment 8 Diffusion TM 5.0 Performance Benchmarks 2 1 Introduction
How NOT to Measure Latency
 How NOT to Measure Latency Matt Schuetze Product Management Director, Azul Systems QCon NY Brooklyn, New York 1 @azulsystems Understanding Latency and Application Responsiveness Matt Schuetze Product Management
Finally! Real Java for low latency and low jitter
 Finally! Real Java for low latency and low jitter Gil Tene, CTO & co-founder, Azul Systems High level agenda Java in a low latency application world Why Stop-The-World is a problem (Duh?) Java vs. actual,
Enabling Java in Latency Sensitive Environments
 Enabling Java in Latency Sensitive Environments Gil Tene, CTO & co-founder, Azul Systems 2011 Azul Systems, Inc. High level agenda Intro, jitter vs. JITTER Java in a low latency application world The (historical)
Java Performance Tuning and Optimization Student Guide
 Java Performance Tuning and Optimization Student Guide D69518GC10 Edition 1.0 June 2011 D73450 Disclaimer This document contains proprietary information and is protected by copyright and other intellectual
How NOT to Measure Latency
 How NOT to Measure Latency Matt Schuetze South Bay (LA) Java User Group Product Management Director, Azul Systems El Segundo, California 1 @azulsystems Understanding Latency and Application Responsiveness
Understanding Latency and Response Time Behavior
 Understanding Latency and Response Time Behavior Pitfalls, Lessons and Tools Matt Schuetze Director of Product Management Azul Systems Latency Behavior Latency: The time it took one operation to happen
Understanding Java Garbage Collection
 Understanding Java Garbage Collection and what you can do about it A presentation to the New York Java Special Interest Group March 27, 2014 Matt Schuetze, Director of Product Management Azul Systems This
Azul Pauseless Garbage Collection
 TECHNOLOGY WHITE PAPER Azul Pauseless Garbage Collection Providing continuous, pauseless operation for Java applications Executive Summary Conventional garbage collection approaches limit the scalability
Understanding Java Garbage Collection
 Understanding Java Garbage Collection A Shallow Dive into the Deep End of the JVM A presentation to the Detroit JUG November 3, 2014 Matt Schuetze, Director of Product Management Azul Systems This Talk
IBM Power Systems solution for SugarCRM
 IBM Power Systems solution for SugarCRM Performance and scaling overview of Sugar on IBM Power Systems running Linux featuring the new IBM POWER8 technology Steve Pratt, Mark Nellen IBM Systems and Technology
OS-caused Long JVM Pauses - Deep Dive and Solutions
 OS-caused Long JVM Pauses - Deep Dive and Solutions Zhenyun Zhuang LinkedIn Corp., Mountain View, California, USA https://www.linkedin.com/in/zhenyun Zhenyun@gmail.com 2016-4-21 Outline q Introduction
Java Performance Tuning
 443 North Clark St, Suite 350 Chicago, IL 60654 Phone: (312) 229-1727 Java Performance Tuning This white paper presents the basics of Java Performance Tuning and its preferred values for large deployments
Understanding Java Garbage Collection
 Understanding Java Garbage Collection A Shallow Dive into the Deep End of the JVM A presentation to the Philadelphia JUG April 14, 2014 Matt Schuetze, Director of Product Management Azul Systems This Talk
Oracle Event Processing Extreme Performance on Sparc T5
 Oracle Event Processing Extreme Performance on Sparc T5 An Oracle Event Processing (OEP) Whitepaper ORACLE WHITE PAPER AUGUST 2014 Table of Contents Introduction 2 OEP Architecture 2 Server Architecture
JVM and application bottlenecks troubleshooting
 JVM and application bottlenecks troubleshooting How to find problems without using sophisticated tools Daniel Witkowski, EMEA Technical Manager, Azul Systems Daniel Witkowski - About me IT consultant and
High-Performance Lustre with Maximum Data Assurance
 High-Performance Lustre with Maximum Data Assurance Silicon Graphics International Corp. 900 North McCarthy Blvd. Milpitas, CA 95035 Disclaimer and Copyright Notice The information presented here is meant
Page 2 of 6 SUT Model Form Factor CPU CPU Characteristics Number of Systems 1 Nodes Per System 1 Chips Per System 2 Hardware hw_1 Cores Per System 44
 Page 1 of 6 SPECjbb2015 Copyright 2015-2016 Standard Performance Evaluation Corporation Cisco Systems Cisco UCS C220 M4 Tested by: Cisco Systems SPEC license #: 9019 94667 SPECjbb2015-Multi max-jops 71951
JVM Memory Model and GC
 JVM Memory Model and GC Developer Community Support Fairoz Matte Principle Member Of Technical Staff Java Platform Sustaining Engineering, Copyright 2015, Oracle and/or its affiliates. All rights reserved.
Scaling Up Performance Benchmarking
 Scaling Up Performance Benchmarking -with SPECjbb2015 Anil Kumar Runtime Performance Architect @Intel, OSG Java Chair Monica Beckwith Runtime Performance Architect @Arm, Java Champion FaaS Serverless Frameworks
HP SAS benchmark performance tests
 HP SAS benchmark performance tests technology brief Abstract... 2 Introduction... 2 Test hardware... 2 HP ProLiant DL585 server... 2 HP ProLiant DL380 G4 and G4 SAS servers... 3 HP Smart Array P600 SAS
Understanding Garbage Collection
 Understanding Garbage Collection Gil Tene, CTO Azul Systems High level agenda Some GC fundamentals, terminology & mechanisms Classifying current commercially available collectors Why Stop-The-World is
JVM Troubleshooting MOOC: Troubleshooting Memory Issues in Java Applications
 JVM Troubleshooting MOOC: Troubleshooting Memory Issues in Java Applications Poonam Parhar JVM Sustaining Engineer Oracle Lesson 1 HotSpot JVM Memory Management Poonam Parhar JVM Sustaining Engineer Oracle
About Terracotta Ehcache. Version 10.1
 About Terracotta Ehcache Version 10.1 October 2017 This document applies to Terraco a Ehcache Version 10.1 and to all subsequent releases. Specifications contained herein are subject to change and these
Comparison of Storage Protocol Performance ESX Server 3.5
 Performance Study Comparison of Storage Protocol Performance ESX Server 3.5 This study provides performance comparisons of various storage connection options available to VMware ESX Server. We used the
Optimising Multicore JVMs. Khaled Alnowaiser
 Optimising Multicore JVMs Khaled Alnowaiser Outline JVM structure and overhead analysis Multithreaded JVM services JVM on multicore An observational study Potential JVM optimisations Basic JVM Services
How Not to Measure Latency
 How Not to Measure Latency An attempt to confer wisdom... Gil Tene, CTO & co-founder, Azul Systems This Talk s Purpose / Goals This is not a there is only one right way talk This is a talk about the common
Accelerating Enterprise Search with Fusion iomemory PCIe Application Accelerators
 WHITE PAPER Accelerating Enterprise Search with Fusion iomemory PCIe Application Accelerators Western Digital Technologies, Inc. 951 SanDisk Drive, Milpitas, CA 95035 www.sandisk.com Table of Contents
Java & Coherence Simon Cook - Sales Consultant, FMW for Financial Services
 Java & Coherence Simon Cook - Sales Consultant, FMW for Financial Services with help from Adrian Nakon - CMC Markets & Andrew Wilson - RBS 1 Coherence Special Interest Group Meeting 1 st March 2012 Presentation
Runtime Application Self-Protection (RASP) Performance Metrics
 Performance Metrics") Product Analysis June 2016 Runtime Application Self-Protection (RASP) Performance Metrics Virtualization Provides Improved Security Without Increased Overhead Highly accurate. Easy to install. Simple to
Product Analysis June 2016 Runtime Application Self-Protection (RASP) Performance Metrics Virtualization Provides Improved Security Without Increased Overhead Highly accurate. Easy to install. Simple to
10/26/2017 Universal Java GC analysis tool - Java Garbage collection log analysis made easy
 Analysis Report GC log le: atlassian-jira-gc-2017-10-26_0012.log.0.current Duration: 14 hrs 59 min 51 sec System Time greater than User Time In 25 GC event(s), 'sys' time is greater than 'usr' time. It's
TECHNOLOGY WHITE PAPER. Azul Pauseless Garbage Collection. Providing continuous, pauseless operation for Java applications
 TECHNOLOGY WHITE PAPER Azul Pauseless Garbage Collection Providing continuous, pauseless operation for Java applications The garbage collection process automatically frees the heap space used by objects
Low Latency Java in the Real World
 Low Latency Java in the Real World LMAX Exchange and the Zing JVM Mark Price, Senior Developer, LMAX Exchange Gil Tene, CTO & co-founder, Azul Systems Low Latency in the Java Real World LMAX Exchange and
Zing Vision. Answering your toughest production Java performance questions
 Zing Vision Answering your toughest production Java performance questions Outline What is Zing Vision? Where does Zing Vision fit in your Java environment? Key features How it works Using ZVRobot Q & A
Accelerate Database Performance and Reduce Response Times in MongoDB Humongous Environments with the LSI Nytro MegaRAID Flash Accelerator Card
 Accelerate Database Performance and Reduce Response Times in MongoDB Humongous Environments with the LSI Nytro MegaRAID Flash Accelerator Card The Rise of MongoDB Summary One of today s growing database
Oracle Database 12c: JMS Sharded Queues
 Oracle Database 12c: JMS Sharded Queues For high performance, scalable Advanced Queuing ORACLE WHITE PAPER MARCH 2015 Table of Contents Introduction 2 Architecture 3 PERFORMANCE OF AQ-JMS QUEUES 4 PERFORMANCE
WebSphere Application Server 6.1 Base Performance September WebSphere Application Server 6.1 Base Performance
 WebSphere Application Server 6.1 Base Performance September 2008 WebSphere Application Server 6.1 Base Performance Table of Contents Introduction to the WebSphere Application Server performance tests...
TPC-E testing of Microsoft SQL Server 2016 on Dell EMC PowerEdge R830 Server and Dell EMC SC9000 Storage
 TPC-E testing of Microsoft SQL Server 2016 on Dell EMC PowerEdge R830 Server and Dell EMC SC9000 Storage Performance Study of Microsoft SQL Server 2016 Dell Engineering February 2017 Table of contents
EMC XTREMCACHE ACCELERATES VIRTUALIZED ORACLE
 White Paper EMC XTREMCACHE ACCELERATES VIRTUALIZED ORACLE EMC XtremSF, EMC XtremCache, EMC Symmetrix VMAX and Symmetrix VMAX 10K, XtremSF and XtremCache dramatically improve Oracle performance Symmetrix
New Java performance developments: compilation and garbage collection
 New Java performance developments: compilation and garbage collection Jeroen Borgers @jborgers #jfall17 Part 1: New in Java compilation Part 2: New in Java garbage collection 2 Part 1 New in Java compilation
The G1 GC in JDK 9. Erik Duveblad Senior Member of Technical Staf Oracle JVM GC Team October, 2017
 The G1 GC in JDK 9 Erik Duveblad Senior Member of Technical Staf racle JVM GC Team ctober, 2017 Copyright 2017, racle and/or its affiliates. All rights reserved. 3 Safe Harbor Statement The following is
Cisco Prime Home 6.X Minimum System Requirements: Standalone and High Availability
 White Paper Cisco Prime Home 6.X Minimum System Requirements: Standalone and High Availability White Paper August 2014 2014 Cisco and/or its affiliates. All rights reserved. This document is Cisco Public
IBM Daeja ViewONE Virtual Performance and Scalability
 Summary White Paper January 2016 IBM Daeja ViewONE Virtual 4.1.5 Performance and Scalability Copyright IBM Corporation 2016 Enterprise Content Management www.ibm.com No part of this document may be reproduced
Enabling Java-based VoIP backend platforms through JVM performance tuning
 Enabling Java-based VoIP backend platforms through JVM performance tuning (Bruno Van Den Bossche, Filip De Turck, April 3rd 2006) 3 April, 2006, 1 Outline Introduction Java 4 Telecom Evaluation Setup Hardware
Introduction. Architecture Overview
 Performance and Sizing Guide Version 17 November 2017 Contents Introduction... 5 Architecture Overview... 5 Performance and Scalability Considerations... 6 Vertical Scaling... 7 JVM Heap Sizes... 7 Hardware
IBM Rational ClearCase Remote Client Version 7.1 Performance Report (Windows)
") IBM Rational ClearCase Remote Client Version 7.1 Performance Report (Windows) This report compares Rational ClearCase Remote Client (CCRC) server performance and scalability for the 7.0.1 and 7.1 releases.
IBM Rational ClearCase Remote Client Version 7.1 Performance Report (Windows) This report compares Rational ClearCase Remote Client (CCRC) server performance and scalability for the 7.0.1 and 7.1 releases.
Optimizing Fusion iomemory on Red Hat Enterprise Linux 6 for Database Performance Acceleration. Sanjay Rao, Principal Software Engineer
 Optimizing Fusion iomemory on Red Hat Enterprise Linux 6 for Database Performance Acceleration Sanjay Rao, Principal Software Engineer Version 1.0 August 2011 1801 Varsity Drive Raleigh NC 27606-2072 USA
The C4 Collector. Or: the Application memory wall will remain until compaction is solved. Gil Tene Balaji Iyengar Michael Wolf
 The C4 Collector Or: the Application memory wall will remain until compaction is solved Gil Tene Balaji Iyengar Michael Wolf High Level Agenda 1. The Application Memory Wall 2. Generational collection
DELL EMC ISILON F800 AND H600 I/O PERFORMANCE
 DELL EMC ISILON F800 AND H600 I/O PERFORMANCE ABSTRACT This white paper provides F800 and H600 performance data. It is intended for performance-minded administrators of large compute clusters that access
The Z Garbage Collector Scalable Low-Latency GC in JDK 11
 The Z Garbage Collector Scalable Low-Latency GC in JDK 11 Per Lidén (@perliden) Consulting Member of Technical Staff Java Platform Group, Oracle October 24, 2018 Safe Harbor Statement The following is
Real Time: Understanding the Trade-offs Between Determinism and Throughput
 Real Time: Understanding the Trade-offs Between Determinism and Throughput Roland Westrelin, Java Real-Time Engineering, Brian Doherty, Java Performance Engineering, Sun Microsystems, Inc TS-5609 Learn
2011 Oracle Corporation and Affiliates. Do not re-distribute!
 How to Write Low Latency Java Applications Charlie Hunt Java HotSpot VM Performance Lead Engineer Who is this guy? Charlie Hunt Lead JVM Performance Engineer at Oracle 12+ years of
An Oracle White Paper September Oracle Utilities Meter Data Management Demonstrates Extreme Performance on Oracle Exadata/Exalogic
 An Oracle White Paper September 2011 Oracle Utilities Meter Data Management 2.0.1 Demonstrates Extreme Performance on Oracle Exadata/Exalogic Introduction New utilities technologies are bringing with them
PRESERVE DATABASE PERFORMANCE WHEN RUNNING MIXED WORKLOADS
 PRESERVE DATABASE PERFORMANCE WHEN RUNNING MIXED WORKLOADS Testing shows that a Pure Storage FlashArray//m storage array used for Microsoft SQL Server 2016 helps eliminate latency and preserve productivity.
Contents Overview of the Gateway Performance and Sizing Guide... 5 Primavera Gateway System Architecture... 7 Performance Considerations...
 Gateway Performance and Sizing Guide for On-Premises Version 17 July 2017 Contents Overview of the Gateway Performance and Sizing Guide... 5 Prerequisites... 5 Oracle Database... 5 WebLogic... 6 Primavera
Blade : A Datacenter Garbage Collector
 Blade : A Datacenter Garbage Collector David Terei CS244b Project Abstract Most systems software and distributed systems are still written in non-type-safe languages such as C or C++. The primary reason
Contents Overview of the Performance and Sizing Guide... 5 Architecture Overview... 7 Performance and Scalability Considerations...
 Unifier Performance and Sizing Guide for On-Premises Version 17 July 2017 Contents Overview of the Performance and Sizing Guide... 5 Architecture Overview... 7 Performance and Scalability Considerations...
SAP SD Benchmark with DB2 and Red Hat Enterprise Linux 5 on IBM System x3850 M2
 SAP SD Benchmark using DB2 and Red Hat Enterprise Linux 5 on IBM System x3850 M2 Version 1.0 November 2008 SAP SD Benchmark with DB2 and Red Hat Enterprise Linux 5 on IBM System x3850 M2 1801 Varsity Drive
Understanding Java Garbage Collection
 Understanding Java Garbage Collection and what you can do about it Gil Tene, CTO & co-founder, Azul Systems 1 This Talk s Purpose / Goals This talk is focused on GC education This is not a how to use flags
SUMMARY OF RESULTS BENCHMARK PROFILE. server.
 O RACLE E-BUSINESS B ENCHMARK R EV. 1.1 E-BUSINESS SUITE APPLICATIONS R12 (FAMILY PACK C) PRODUCT INFORMATION MANAGEMENT (PIM) (500 MILLION ITEM RECORDS) BENCHMARK - USING ORACLE10g ON IBM System x3850
Virtual Switch Acceleration with OVS-TC
 WHITE PAPER Virtual Switch Acceleration with OVS-TC HARDWARE ACCELERATED OVS-TC PROVIDES BETTER CPU EFFICIENCY, LOWER COMPLEXITY, ENHANCED SCALABILITY AND INCREASED NETWORK PERFORMANCE COMPARED TO KERNEL-
Oracle JD Edwards EnterpriseOne Object Usage Tracking Performance Characterization Using JD Edwards EnterpriseOne Object Usage Tracking
 Oracle JD Edwards EnterpriseOne Object Usage Tracking Performance Characterization Using JD Edwards EnterpriseOne Object Usage Tracking ORACLE WHITE PAPER JULY 2017 Disclaimer The following is intended
Concurrent Garbage Collection
 Concurrent Garbage Collection Deepak Sreedhar JVM engineer, Azul Systems Java User Group Bangalore 1 @azulsystems azulsystems.com About me: Deepak Sreedhar JVM student at Azul Systems Currently working
vsan 6.6 Performance Improvements First Published On: Last Updated On:
 vsan 6.6 Performance Improvements First Published On: 07-24-2017 Last Updated On: 07-28-2017 1 Table of Contents 1. Overview 1.1.Executive Summary 1.2.Introduction 2. vsan Testing Configuration and Conditions
A High-Performance Storage and Ultra- High-Speed File Transfer Solution for Collaborative Life Sciences Research
 A High-Performance Storage and Ultra- High-Speed File Transfer Solution for Collaborative Life Sciences Research Storage Platforms with Aspera Overview A growing number of organizations with data-intensive
A Rational software Whitepaper 05/25/03. IBM Rational Rapid Developer Scalability and Performance Benchmark
 A Rational software Whitepaper 05/25/03 IBM Rational Rapid Developer Scalability and Performance Benchmark 1 Executive Summary This document describes a performance benchmark for Rational s estore application
Garbage Collection. Hwansoo Han
 Garbage Collection Hwansoo Han Heap Memory Garbage collection Automatically reclaim the space that the running program can never access again Performed by the runtime system Two parts of a garbage collector
Oracle Business Activity Monitoring 12c Best Practices ORACLE WHITE PAPER DECEMBER 2015
 Oracle Business Activity Monitoring 12c Best Practices ORACLE WHITE PAPER DECEMBER 2015 Disclaimer The following is intended to outline our general product direction. It is intended for information purposes
Oracle JD Edwards EnterpriseOne Object Usage Tracking Performance Characterization Using JD Edwards EnterpriseOne Object Usage Tracking
 Oracle JD Edwards EnterpriseOne Object Usage Tracking Performance Characterization Using JD Edwards EnterpriseOne Object Usage Tracking ORACLE WHITE PAPER NOVEMBER 2017 Disclaimer The following is intended
How to keep capacity predictions on target and cut CPU usage by 5x
 How to keep capacity predictions on target and cut CPU usage by 5x Lessons from capacity planning a Java enterprise application Kansas City, Sep 27 2016 Stefano Doni stefano.doni@moviri.com @stef3a linkedin.com/in/stefanodoni
Deploy a High-Performance Database Solution: Cisco UCS B420 M4 Blade Server with Fusion iomemory PX600 Using Oracle Database 12c
 White Paper Deploy a High-Performance Database Solution: Cisco UCS B420 M4 Blade Server with Fusion iomemory PX600 Using Oracle Database 12c What You Will Learn This document demonstrates the benefits
Azul Disrupts the ROI Equation for High Performance Applications
 Azul Disrupts the ROI Equation for High Performance Applications Table of Contents Executive Summary... 3 Challenges of the Real-time Enterprise... 4 The ROI Conundrum with Java... 4 Introducing Zing:
Dell PowerEdge R720xd with PERC H710P: A Balanced Configuration for Microsoft Exchange 2010 Solutions
 Dell PowerEdge R720xd with PERC H710P: A Balanced Configuration for Microsoft Exchange 2010 Solutions A comparative analysis with PowerEdge R510 and PERC H700 Global Solutions Engineering Dell Product
Extreme Storage Performance with exflash DIMM and AMPS
 Extreme Storage Performance with exflash DIMM and AMPS 214 by 6East Technologies, Inc. and Lenovo Corporation All trademarks or registered trademarks mentioned here are the property of their respective
PERFORMANCE ANALYSIS AND OPTIMIZATION OF SKIP LISTS FOR MODERN MULTI-CORE ARCHITECTURES
 PERFORMANCE ANALYSIS AND OPTIMIZATION OF SKIP LISTS FOR MODERN MULTI-CORE ARCHITECTURES Anish Athalye and Patrick Long Mentors: Austin Clements and Stephen Tu 3 rd annual MIT PRIMES Conference Sequential
Understanding Java Garbage Collection
 Understanding Java Garbage Collection and what you can do about it Gil Tene, CTO & co-founder, Azul Systems This Talk s Purpose / Goals This talk is focused on GC education This is not a how to use flags
The Garbage-First Garbage Collector
 The Garbage-First Garbage Collector Tony Printezis, Sun Microsystems Paul Ciciora, Chicago Board Options Exchange #TS-9 Trademarks And Abbreviations (to get them out of the way...) Java Platform, Standard
Infor M3 on IBM POWER7+ and using Solid State Drives
 Infor M3 on IBM POWER7+ and using Solid State Drives IBM Systems & Technology Group Robert Driesch cooter@us.ibm.com This document can be found on the web, Version Date: January 31, 2014 Table of Contents
Supra-linear Packet Processing Performance with Intel Multi-core Processors
 White Paper Dual-Core Intel Xeon Processor LV 2.0 GHz Communications and Networking Applications Supra-linear Packet Processing Performance with Intel Multi-core Processors 1 Executive Summary Advances
Red Hat Ceph Storage and Samsung NVMe SSDs for intensive workloads
 Red Hat Ceph Storage and Samsung NVMe SSDs for intensive workloads Power emerging OpenStack use cases with high-performance Samsung/ Red Hat Ceph reference architecture Optimize storage cluster performance
Technical Paper. Performance and Tuning Considerations for SAS on Dell EMC VMAX 250 All-Flash Array
 Technical Paper Performance and Tuning Considerations for SAS on Dell EMC VMAX 250 All-Flash Array Release Information Content Version: 1.0 April 2018 Trademarks and Patents SAS Institute Inc., SAS Campus
Performance and Scalability with Griddable.io
 Performance and Scalability with Griddable.io Executive summary Griddable.io is an industry-leading timeline-consistent synchronized data integration grid across a range of source and target data systems.
Vertical Scaling of Oracle 10g Performance on Red Hat
 Vertical Scaling of Oracle 10g Performance on Red Hat Enterprise Linux 5 on Intel Xeon-Based Servers Oracle 10g Red Hat Enterprise Linux 5 Intel Xeon-based servers 3 1. Introduction and executive summary
Netronome 25GbE SmartNICs with Open vswitch Hardware Offload Drive Unmatched Cloud and Data Center Infrastructure Performance
 WHITE PAPER Netronome 25GbE SmartNICs with Open vswitch Hardware Offload Drive Unmatched Cloud and NETRONOME AGILIO CX 25GBE SMARTNICS SIGNIFICANTLY OUTPERFORM MELLANOX CONNECTX-5 25GBE NICS UNDER HIGH-STRESS
IBM Cognos ReportNet and the Java Heap
 Proven Practice IBM Cognos ReportNet and the Java Heap Product(s): IBM Cognos ReportNet, IBM Cognos 8 Area of Interest: Performance 2 Copyright Copyright 2008 Cognos ULC (formerly Cognos Incorporated).
Exploiting the Behavior of Generational Garbage Collector
 Exploiting the Behavior of Generational Garbage Collector I. Introduction Zhe Xu, Jia Zhao Garbage collection is a form of automatic memory management. The garbage collector, attempts to reclaim garbage,
Accelerating Microsoft SQL Server 2016 Performance With Dell EMC PowerEdge R740
 Accelerating Microsoft SQL Server 2016 Performance With Dell EMC PowerEdge R740 A performance study of 14 th generation Dell EMC PowerEdge servers for Microsoft SQL Server Dell EMC Engineering September
SCALING UP VS. SCALING OUT IN A QLIKVIEW ENVIRONMENT
 SCALING UP VS. SCALING OUT IN A QLIKVIEW ENVIRONMENT QlikView Technical Brief February 2012 qlikview.com Introduction When it comes to the enterprise Business Discovery environments, the ability of the
webmethods Task Engine 9.9 on Red Hat Operating System
 webmethods Task Engine 9.9 on Red Hat Operating System Performance Technical Report 1 2015 Software AG. All rights reserved. Table of Contents INTRODUCTION 3 1.0 Benchmark Goals 4 2.0 Hardware and Software
IBM Emulex 16Gb Fibre Channel HBA Evaluation
 IBM Emulex 16Gb Fibre Channel HBA Evaluation Evaluation report prepared under contract with Emulex Executive Summary The computing industry is experiencing an increasing demand for storage performance
Red Hat JBoss Enterprise Application Platform 7.1
 Red Hat JBoss Enterprise Application Platform 7.1 Introduction to JBoss EAP For Use with Red Hat JBoss Enterprise Application Platform 7.1 Last Updated: 2018-02-08 Red Hat JBoss Enterprise Application
The Z Garbage Collector An Introduction
 The Z Garbage Collector An Introduction Per Lidén & Stefan Karlsson HotSpot Garbage Collection Team FOSDEM 2018 Safe Harbor Statement The following is intended to outline our general product direction.
An Oracle White Paper June Exadata Hybrid Columnar Compression (EHCC)
") An Oracle White Paper June 2011 (EHCC) Introduction... 3 : Technology Overview... 4 Warehouse Compression... 6 Archive Compression... 7 Conclusion... 9 Introduction enables the highest levels of data compression
An Oracle White Paper June 2011 (EHCC) Introduction... 3 : Technology Overview... 4 Warehouse Compression... 6 Archive Compression... 7 Conclusion... 9 Introduction enables the highest levels of data compression
Release Notes for Cisco Insight Reporter, v3.1
 November 2011 This document describes the operating environment and the defects and caveats that were identified as part of internal testing and during the live trials. It assumes the reader has a good
Hierarchical PLABs, CLABs, TLABs in Hotspot
 Hierarchical s, CLABs, s in Hotspot Christoph M. Kirsch ck@cs.uni-salzburg.at Hannes Payer hpayer@cs.uni-salzburg.at Harald Röck hroeck@cs.uni-salzburg.at Abstract Thread-local allocation buffers (s) are
Low latency & Mechanical Sympathy: Issues and solutions
 Low latency & Mechanical Sympathy: Issues and solutions Jean-Philippe BEMPEL Performance Architect @jpbempel http://jpbempel.blogspot.com ULLINK 2016 Low latency order router pure Java SE application FIX
JAVA PERFORMANCE. PR SW2 S18 Dr. Prähofer DI Leopoldseder
 JAVA PERFORMANCE PR SW2 S18 Dr. Prähofer DI Leopoldseder OUTLINE 1. What is performance? 1. Benchmarking 2. What is Java performance? 1. Interpreter vs JIT 3. Tools to measure performance 4. Memory Performance