Visual System Implementation
|
|
|
- Dominic Austin
- 5 years ago
- Views:
Transcription
1 Visual System Implementation Shamal AL-Dohuki and Ye Zhao


2 Shamal AL-Dohuki Ph.D. candidate in the Department of Computer Science at Kent State University, Ohio, USA. Software Development Lead of TrajAnalytics My current research interest includes: Implementing visual analytics of big urban data Urban data management and visualization Visual query of trajectory data Semantic data query and analytics
3 Overview Exploratory visualization systems for urban trajectory data Efficient user interaction Instant visual feedback. Support practitioners, researchers, and decision-makers to store, query and visualize the data


4 Overview Cont. The system should integrate scalable data management visualization with powerful computational capability. and interactive Powerful computing platform. Easy access gateway. Scalable data storage and management. Exploratory visualization.
5 Web based Visual System Web browser based visual analytics is the trend Cost effective and fit for multiple platforms Easy installation and maintenance Secure with easy account management and access control Built on client-server scheme Data uploading and remote management We focus on web-based visual system in this tutorial
6 Web System Challenges Web Services are web accessible applications and application components that exchange data, share tasks, and automate processes over the Internet. To build a web service for visual exploration of trajectory data, researchers face some general issues: How to transfer data between the client and the server and in what format? How to visualize trajectory data on the client side? What views and interactions are needed? What server side and database supports are needed?
7 Client and Server Scheme Datasets are stored and controlled by the remote data server. Users send requests and receive information from the server via a client. Some functions are performed on both server and client side. There is a trade-off between performing functions on the database server and on the client side.

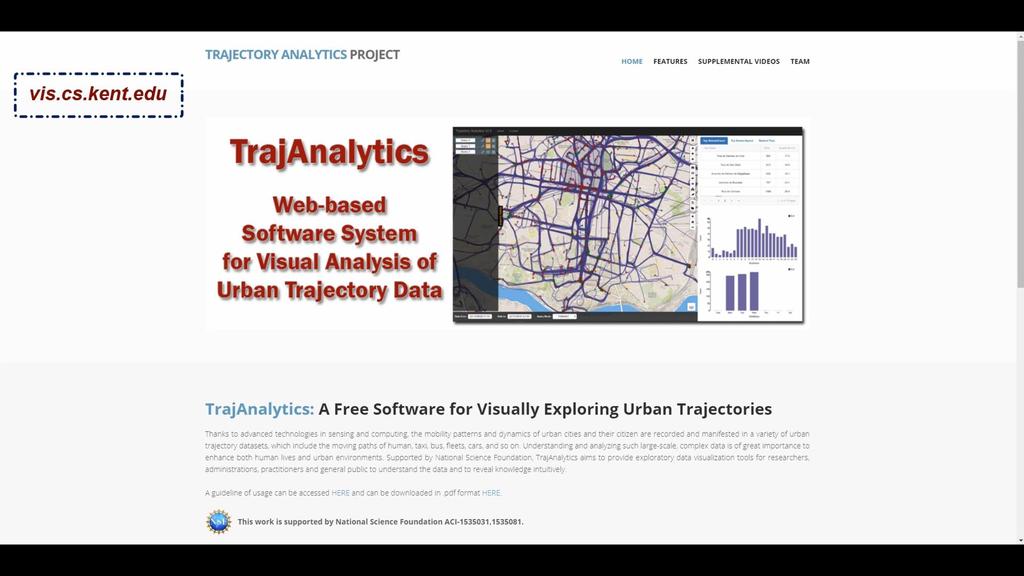
8 An Example Web-based Software System TrajAnalytics is a web based software for visually exploring urban trajectories
9 TrajAnalytics Features A cloud-based software which can be accessed through Web browsers. Users can Load raw trajectory data Perform map matching and aggregation Conduct extensive visual analysis at any time A downloadable version is available for users to use it in local machines Localhost is used
10 TrajAnalytics Demo

11 Visual System Implementation In next slides, we describe the details of implementing web based visualization system for urban trajectory datasets Mostly based on our work in TrajAnalytics design and implementation
12 Web Based System Server: Spatial Database with Spatial Indexing. PostgreSQL, MySQL, MongoDB Client: HTML, PHP with HTTP, accessing with any internet browser. Data Transfer: jquery AJAX request to PHP and PostgreSQL. The data will be restored in the.json object and will be transferred to the client side. Web interface: JavaScript with multiple libraries. Leaflet.js, D3.js, and more.
13 PostgreSQL Database PostgreSQL is an object-relational database system. It has the features of a traditional proprietary database system with enhancements to be found in next-generation DBMS systems. PostgreSQL has most features that are present in large proprietary DBMSs, like transactions, sub selects, triggers, views, foreign key referential integrity, and sophisticated locking.
14 PostGIS for Spatial Datasets PostgreSQL also offers some special features like user-defined types, inheritance, rules, and multi-version concurrency control to reduce lock contention. PostGIS is a spatial database extender for PostgreSQL. It adds support for geographic objects allowing location queries to be run in SQL. SELECT superhero.name FROM city, superhero WHERE ST_Contains(city.geom, superhero.geom) AND city.name = 'Gotham';
15 Network Communication Challenging issues: How to connect the client with the database (PostgreSQL). How to extract data from the database and transfer the data to the client side. PHP and the Apache server are used for this purpose. Trajectory data in the database are read by PHP through the Apache server. The data will be restored in the.json object and will be transferred via the internet to the client side.

16 System Structure PostgreSQL Database PHP Middleware Apache Server Clients Internet Connecting with the database by using PHP and Apache server
17 Web Servers There are many types of web servers available. Apache server is the most common server around, very easy to set up, and compatible with all major operating systems. On Linux: Installation and configuration of Apache webserver can be done in one step.» sudo apt-get install apache2
18 Web Servers On Mac OS: Apache is installed by default. All you need to do is turn it on. Go to Terminal and run the following command to turn on your already pre-installed Apache web server.» sudo apachectl start On Windows: there are several install wizards that bundle things like Apache, MySQL, and PHP together to make our lives easier. One of them is XAMPP. Note: XAMPP is available for Linux and Mac OS X too. (Recommended)
. PHP is open source software and widely used for making dynamic and interactive Web pages.")
19 XAMPP and PHP XAMPP bundle tools like Apache, MySQL, and PHP together. PHP stands for Hypertext Preprocessor. PHP is a server side scripting language, like Microsoft s Active server page (ASP). PHP is open source software and widely used for making dynamic and interactive Web pages. PHP uses pg_connect to speak to the PostgreSQL database on the server.

20 XAMPP Control XAMPP Control Panel: Bundle Apache, MySQL, and PHP together
21 Connect to Database To connect to PostgreSQL database using PHP, a pg_connect function with connection strings that consists of host name, name of the database, user and password was performed. The following codes describe how to connect to PostgreSQL using PHP: <?php $db_connection = pg_connect("host=localhost dbname=dbname user=username password=password"); $result = pg_query($db_connection, "SELECT lastname FROM employees");?>

22 Data Queries and Transfer In a web based visual exploration of trajectory data, jquery AJAX request to PHP and PostgreSQL could be used. The data will be restored as a JSON object and will be transferred to the client side.
23 Data Queries and Transfer Cont. Ajax (also AJAX) short for "Asynchronous JavaScript And XML. Set of Web development techniques using many Web technologies on the client side to create asynchronous Web applications. With Ajax, Web applications can send and retrieve data from a server asynchronously (in the background) without interfering with the display and behavior of the existing page. Modern implementations commonly utilize JSON instead of XML due to the advantages of JSON being native to JavaScript.

24 Data Queries and Transfer Cont. Normal HTTP request VS. Ajax Request


25 Data Queries Example Example: Using AJAX to do Region Query Temporal Constraint Spatial Constraint

26 Data Queries Example Cont. Connect to the Database Insert Your Query here The received response is JSON object query.php

27 Data Queries Results The parsed JSON object is visualized by using different visualization methods TrajAnalytics: A Free Software for Visually Exploring Urban Trajectories

28 Data Queries: Demo


29 Map Visualization and Tools The common visualization method used for urban trajectory data is static and animated maps. This method provides some interaction techniques as well. Creating a good web map is not an easy task but over the years we ve seen plenty of amazing geovisualization examples. All of them have been developed with the use of one of the following tools, APIs or libraries.

30 CARTO CARTO previously known as CartoDB is the best platform for complex and dynamic geospatial data visualization and analysis. example: Flights around the world

31 ArcGIS ArcGIS Online: Esri has monopolized the field of GIS and is also one of the most popular geo visualization platforms. example: 5 years of drought

32 Data Lens Here Data Lens is a set of APIs that provide a seamless developer experience for creation & deployment cool data visualizations. example: Billboard analytics tool demo


33 Mapbox Mapbox is a geo-visualization platform that gives easy to use set of tool for creating beautiful web and mobile maps. example: 1.5 Million Walks, Runs, and Bike Rides from RunKeeper mapped on Mapbox

34 Google Maps Google Maps offers a set of APIs for different mapping purposes. It offers access to Google s mapping data that includes StreetView among others. example: GeoGuessr StreetView based game?

35 D3 D3.js is a JavaScript library that offers powerful data visualization features for producing dynamic, interactive data visualizations in web browsers. example: Earth wind visualization

36 OpenLayers OpenLayers is an open source JavaScript library for displaying map data in web browsers. It provides an API for building web-based geographic app. Similar to Google Maps but for free. example: Bike sharing map

37 Leaflet Leaflet.js API an open source JavaScript library for mobilefriendly interactive maps. It offers really powerful mapping features that commonly used for the best and most beautiful maps. example: Travel times map HERE Isoline + Leaftet (Recommended)
38 Leaflet Cont. Leaflet is the leading open-source JavaScript library for mobile-friendly interactive maps. It works efficiently across all major desktop and mobile platforms. It has a beautiful, easy to use and well-documented API and a simple, readable source code that is a joy to contribute to.
39 Leaflet Cont. Example: Create a map in the 'map' div, add tiles of our choice, and then add a marker with some text in a popup:

40 Leaflet Cont. Example: Create a map in the 'map' div, add tiles of our choice, and then add a marker with some text in a popup

41 Leaflet Cont. For more map tiles, check the link below: This page shows mini maps for all the layers available in Leaflet-providers.
42 Leaflet Cont. Besides tiles layers, you can easily add other things to your map, including markers, polylines, polygons, circles, and popups. Markers can be used to visualize POI on the map. Polylines can be used to visualize trajectories and road network on the map. Polygons can be used to visualize zip code regions on the map. Circles can be used to visualize pick-up and drop-off locations on the map. Popups can be used to show some semantic information on the map.
43 Leaflet Cont. To add a marker: Adding a circle is the same (except for specifying the radius in meters as a second argument), but lets you control how it looks by passing options as the last argument when creating the object:


44 Leaflet Cont. Adding a polygon is as easy: Popups are usually used when you want to attach some information to a particular object on a map. Leaflet has a very handy shortcut for this:
45 GeoJson GeoJSON is a format for encoding a variety of geographic data structures. GeoJSON is becoming a very popular data format among many GIS technologies and services. A GeoJSON object may represent a geometry, a feature, or a collection of features. For instance, the road network that extracted from OSM. GeoJSON uses the JSON standard. Leaflet Map is quite good at handling it.

46 GeoJson Cont. In this example, we check the "party" property and style our polygons accordingly:
47 Heatmap Leaflet Heatmap is a plugin to create a heatmap layer for Leaflet map.

48 Heatmap Cont.

49 Markers Marker Clustering plugin for Leaflet Provides Beautiful Animated Marker Clustering functionality for Leaflet, a JS library for interactive maps. Check this Example

50 Mapbox Bloomberg New Energy Finance relaunched their Energy Asset maps to visualize everything from power plant capacity to distribution of gas pipelines and biofuel production. Using Mapbox.js with the Leaflet Marker Cluster plugin, the map reveals more information as you zoom in. Drilling down on wind versus hydro versus nuclear power with Bloomberg New Energy Finance maps.
51 Data Attributes Visualization Urban trajectory data consists of time/location/other properties (e.g. Speed). The common visualization method used for location is static and animated maps. Creating charts and infographics for other attributes can be time-consuming. Many APIs have been implemented to make this process easier. D3.js, Chart.js, Google Charts, Highcharts, Plotly and others. Next, we will show some of the recommended tools that can make the tedious task of making beautiful charts easier:

52 D3.js D3.js is a JavaScript library that uses HTML, SVG, and CSS to render some amazing diagrams and charts from a variety of data sources including Urban Trajectory Data.
53 Chart.js Although armed with only six chart types, open source library Chart.js is the perfect data visualization tool for hobbies and small projects. (Recommended)
 The")


54 Leaflet DVF Leaflet Data Visualization Framework (DVF) The Leaflet DVF is an extension to the Leaflet JavaScript mapping library. The primary goal of the framework is to simplify data visualization on the map. Allow the user to draw different types of glyphs on the map.

55 Interactions Interactive visualizations can add an impressive animation to plain and boring datasets. It allows users to select specific data points to visualize the story in the way they choose. One of the most powerful ways to accomplish this is through JavaScript. Created by Joanna S. Kao

56 Interactions Cont. Example: Building an interactive visualization of geospatial data by Adil Moujahid

57 Interactions Cont. A web service that allows users to search for businesses within a radius of a specific point that has received reviews within a specified date range. The interaction is provided for both map visualization and information visualization. Interaction is linked to both views. SpaceTime Reviews Data from Yelp Open Dataset


58 Interaction Example Leaflet.js - Event Handling The Leaflet JavaScript program can respond to various events generated by the user. Example: Add Marker to the map when user click on the map
 query over the map canvas, there is a need to provide users with the ability to draw")
59 Interaction Example Leaflet.draw To do spatial (region) query over the map canvas, there is a need to provide users with the ability to draw different shapes (polygons, bounding box, circle, line) on the map to define the spatial constraints.
60 Interaction Example Leaflet.draw is designed to help users to: Draw shapes on your map with easy to use drawing tools. Edit and delete vectors and markers. Super customizable: Customize the styles of each shape to fit in with your maps theme. Pick and choose the which tools you want to use. Roll your own by simply using the drawing and editing handlers. Event based system allows you to perform any necessary actions when shapes are created, edited or deleted.
61 Interaction Example Cont. Leaflet.draw is very simple to drop into you Leaflet application. The following example will add both the draw and edit toolbars to a map:
62 Interaction Example Cont. Once you have successfully added the Leaflet.draw plugin to your map, you will want to respond to the different actions users can trigger. For instance, do a point query


63
Contact: Ye Zhao, Professor Phone: Dept. of Computer Science, Kent State University, Ohio 44242
 Table of Contents I. Overview... 2 II. Trajectory Datasets and Data Types... 3 III. Data Loading and Processing Guide... 5 IV. Account and Web-based Data Access... 14 V. Visual Analytics Interface... 15
Building OSM based web app from scratch
 Building OSM based web app from scratch How to find the way through the open source jungle? Nils Vierus, Berlin osm-maps.eu What is my technical background? First programming language: ALGOL 60 (late 70
Open Source Software: What and Why?
 ESRI and Open Source A Love Story Presented by Bates Rambow Open Source Software: What and Why? What Software that has its source code published for anyone to inspect the source code. Generally released
BROWSER. LuciadRIA DATA SHEET
 BROWSER LuciadRIA DATA SHEET V2017 V2017.0 DATA SHEET LuciadRIA is the answer to today s demands for powerful, lightweight applications in the browser. Driven by today s most advanced web technologies,
Etanova Enterprise Solutions
 Etanova Enterprise Solutions Front End Development» 2018-09-23 http://www.etanova.com/technologies/front-end-development Contents HTML 5... 6 Rich Internet Applications... 6 Web Browser Hardware Acceleration...
Visualizing Crime in San Francisco During the 2014 World Series
 Visualizing Crime in San Francisco During the 2014 World Series John Semerdjian and Bill Chambers Description The scope and focus of our project evolved over the course of its lifetime. Our goals were
MAP SCRIPTING 101. AH Example-Driven Guide to Building Interactive MapA with Sing, Yahoo!, and Google MapA. by Adam DuVander.
 MAP SCRIPTING 101 AH Example-Driven Guide to Building Interactive MapA with Sing, Yahoo!, and Google MapA by Adam DuVander no starch press San Francisco CONTENTS IN DETAIL ACKNOWLEDGMENTS INTRODUCTION
Princess Nourah bint Abdulrahman University. Computer Sciences Department
 Princess Nourah bint Abdulrahman University Computer Sciences Department 1 And use http://www.w3schools.com/ PHP Part 1 Objectives Introduction to PHP Computer Sciences Department 4 Introduction HTML CSS
Implementing Web GIS Solutions
 Implementing Web GIS Solutions using open source software Karsten Vennemann Seattle Talk Overview Talk Overview Why and What What is Open Source (GIS)? Why use it? Application Components Overview of Web
Introduction to Autodesk MapGuide EnterpriseChapter1:
 Chapter 1 Introduction to Autodesk MapGuide EnterpriseChapter1: In this chapter, you review the high-level key components that comprise Autodesk MapGuide Enterprise. The Autodesk MapGuide Studio, an integral
Introduction to Autodesk MapGuide EnterpriseChapter1:
 Chapter 1 Introduction to Autodesk MapGuide EnterpriseChapter1: In this chapter, you review the high-level key components that make up Autodesk MapGuide Enterprise. The Autodesk MapGuide Studio, an integral
VINEPILOT. Project Design Specification. v2.0 - The Savvy-gnon Team
 VINEPILOT Project Design Specification v2.0 - The Savvy-gnon Team Amy Chen hsuanchen@umail.ucsb.edu Iris Eleni Moridis iriselenimoridis@gmail.com Richard Waltman rtwaltman@umail.ucsb.edu Chien Wang chienkaiwang0827@gmail.com
May 22, 2013 Ronald Reagan Building and International Trade Center Washington, DC USA
 May 22, 2013 Ronald Reagan Building and International Trade Center Washington, DC USA 1 Introduction to MapViewer & Tools for Your Business Apps and Mobile Devices Albert Godfrind Oracle Spatial Architect
City of Mobile GIS Web Mapping Applications: New Technology, New Expectations
 City of Mobile GIS Web Mapping Applications: New Technology, New Expectations Presenters : Scott Kearney GIS Manager Patricia Creamer GIS Analyst Background: GIS Department Developing web mapping apps
County of Los Angeles. Chief Information Office Preferred Technologies for Geographic Information Systems (GIS) Version 2 May 2015
 Version 2 May 2015") County of Los Angeles Chief Information Office Preferred Technologies for Geographic Information Systems (GIS) Version 2 May 2015 CIO Preferred Technologies for GIS This document lists the preferred Geographic
County of Los Angeles Chief Information Office Preferred Technologies for Geographic Information Systems (GIS) Version 2 May 2015 CIO Preferred Technologies for GIS This document lists the preferred Geographic
Web GIS Development using Open Source Leaflet and Geoserver Toolkit
 Web GIS Development using Open Source Leaflet and Geoserver Toolkit 1 Taranjot Singh Bhatia, 2 Harpinder Singh, 3 P.K Litoria, 4 Brijendra Pateriya 1,2,3,4 Punjab Remote Sensing Centre, Ludhiana, Punjab,
pgrouting extends the postgis/postgresql geospatial database to provide geospatial routing and other network analysis functionality.
 Workshop: 1 pgrouting extends the postgis/postgresql geospatial database to provide geospatial routing and other network analysis functionality. Attendee s previous knowledge: SQL (PostgreSQL, PostGIS)
Cleveland State University Department of Electrical and Computer Engineering. CIS 408: Internet Computing
 Cleveland State University Department of Electrical and Computer Engineering CIS 408: Internet Computing Catalog Description: CIS 408 Internet Computing (-0-) Pre-requisite: CIS 265 World-Wide Web is now
Esri and MarkLogic: Location Analytics, Multi-Model Data
 Esri and MarkLogic: Location Analytics, Multi-Model Data Ben Conklin, Industry Manager, Defense, Intel and National Security, Esri Anthony Roach, Product Manager, MarkLogic James Kerr, Technical Director,
Introduction THE OPENGEO ARCHITECTURE
 Introduction Putting maps on the web used to be very very difficult. It required specialized software, and more important, specialized knowledge about the kinds of data and processes used to create cartographic
Basics of Web. First published on 3 July 2012 This is the 7 h Revised edition
 First published on 3 July 2012 This is the 7 h Revised edition Updated on: 03 August 2015 DISCLAIMER The data in the tutorials is supposed to be one for reference. We have made sure that maximum errors
An Overview of FMW MapViewer
 An Overview of FMW MapViewer Agenda What is MapViewer Select Features Getting Started Additional Resources 2 Copyright 2013, Oracle and/or its affiliates. All rights reserved. Oracle
ArcGIS GeoEvent Server: Making 3D Scenes Come Alive with Real-Time Data
 ArcGIS GeoEvent Server: Making 3D Scenes Come Alive with Real-Time Data Morakot Pilouk, Ph.D. Senior Software Developer, Esri mpilouk@esri.com @mpesri Agenda 1 2 3 4 5 6 3D for ArcGIS Real-Time GIS Static
Create-A-Page Design Documentation
 Create-A-Page Design Documentation Group 9 C r e a t e - A - P a g e This document contains a description of all development tools utilized by Create-A-Page, as well as sequence diagrams, the entity-relationship
TrajAnalytics: A software system for visual analysis of urban trajectory data
 TrajAnalytics: A software system for visual analysis of urban trajectory data Ye Zhao Computer Science, Kent State University Xinyue Ye Geography, Kent State University Jing Yang Computer Science, University
Exploring Open Source GIS Programming. Scott Parker, Katie Urey, Jack Newlevant, Mele Sax-Barnett
 Exploring Open Source GIS Programming Scott Parker, Katie Urey, Jack Newlevant, Mele Sax-Barnett When to write a program When you expect your tool to have multiple uses and/or multiple iterations Something
Lecture Topic Projects
 Lecture Topic Projects 1 Intro, schedule, and logistics 2 Applications of visual analytics, basic tasks, data types 3 Introduction to D3, basic vis techniques for non-spatial data Project #1 out 4 Visual
Jquery Ajax Json Php Mysql Data Entry Example
 Jquery Ajax Json Php Mysql Data Entry Example Then add required assets in head which are jquery library, datatable js library and css By ajax api we can fetch json the data from employee-grid-data.php.
Product Data Sheet: Ignition 8 Industrial Application Platform. A Whole New View
 Product Data Sheet: Ignition 8 Industrial Application Platform A Whole New View With the powerful tools, web technologies, and next-generation visualization system we re building in Ignition 8, you ll
3D in the Browser with WebGL. Chris Andrews 3D Product Manager Javier Gutierrez 3D Product Engineer
 3D in the Browser with WebGL Chris Andrews 3D Product Manager Javier Gutierrez 3D Product Engineer Just sayin This is not a programming class Goal is to help you learn about a technology area that impacts
OPEN SOURCE SOLUTIONS FOR SURVEYORS
 2 nd Sabah International Surveyors Congress 11 th 12 th March 2014 OPEN SOURCE SOLUTIONS FOR SURVEYORS Presented By : Sr Alexander Chong Director, Jurukur Antarabangsa The Benefits Of Closed Proprietary
Introduction to Geodatabase and Spatial Management in ArcGIS. Craig Gillgrass Esri
 Introduction to Geodatabase and Spatial Management in ArcGIS Craig Gillgrass Esri Session Path The Geodatabase - What is it? - Why use it? - What types are there? - What can I do with it? Query Layers
JSN PageBuilder 3 Configuration Manual Introduction
 JSN PageBuilder 3 Configuration Manual Introduction About JSN PageBuilder 3 JSN PageBuilder 3 is the latest innovation of Joomla! PageBuilder with great improvements in the interface, features, and user
DATABASE SYSTEMS. Database programming in a web environment. Database System Course, 2016
 DATABASE SYSTEMS Database programming in a web environment Database System Course, 2016 AGENDA FOR TODAY Advanced Mysql More than just SELECT Creating tables MySQL optimizations: Storage engines, indexing.
PHP. MIT 6.470, IAP 2010 Yafim Landa
 PHP MIT 6.470, IAP 2010 Yafim Landa (landa@mit.edu) LAMP We ll use Linux, Apache, MySQL, and PHP for this course There are alternatives Windows with IIS and ASP Java with Tomcat Other database systems
When learning coding, be brave
 Who am I? Web Technology Overview with a focus on JavaScript-based technologies Lawrence Yao l.yao@unsw.edu.au Lawrence Yao UNSW casual staff Developer Analyst at YTML Consulting Email me if you need technical
Development of an e-library Web Application
 Development of an e-library Web Application Farrukh SHAHZAD Assistant Professor al-huda University, Houston, TX USA Email: dr.farrukh@alhudauniversity.org and Fathi M. ALWOSAIBI Information Technology
Real-Time & Big Data GIS: Leveraging the spatiotemporal big data store
 Real-Time & Big Data GIS: Leveraging the spatiotemporal big data store Suzanne Foss Product Manager, Esri sfoss@esri.com Ricardo Trujillo Real-Time & Big Data GIS Developer, Esri rtrujillo@esri.com @rtrujill007
DATABASE SYSTEMS. Introduction to web programming. Database Systems Course, 2016
 DATABASE SYSTEMS Introduction to web programming Database Systems Course, 2016 AGENDA FOR TODAY Client side programming HTML CSS Javascript Server side programming: PHP Installing a local web-server Basic
ORACLE FUSION MIDDLEWARE MAPVIEWER
 ORACLE FUSION MIDDLEWARE MAPVIEWER 10.1.3.3 MAPVIEWER KEY FEATURES Component of Fusion Middleware Integration with Oracle Spatial, Oracle Locator Support for two-dimensional vector geometries stored in
Homework 8: Ajax, JSON and Responsive Design Travel and Entertainment Search (Bootstrap/Angular/AJAX/JSON/jQuery /Cloud Exercise)
") Homework 8: Ajax, JSON and Responsive Design Travel and Entertainment Search (Bootstrap/Angular/AJAX/JSON/jQuery /Cloud Exercise) 1. Objectives Get familiar with the AJAX and JSON technologies Use a combination
Homework 8: Ajax, JSON and Responsive Design Travel and Entertainment Search (Bootstrap/Angular/AJAX/JSON/jQuery /Cloud Exercise) 1. Objectives Get familiar with the AJAX and JSON technologies Use a combination
Review. Fundamentals of Website Development. Web Extensions Server side & Where is your JOB? The Department of Computer Science 11/30/2015
 Fundamentals of Website Development CSC 2320, Fall 2015 The Department of Computer Science Review Web Extensions Server side & Where is your JOB? 1 In this chapter Dynamic pages programming Database Others
Desktop Mapping: Creating Vector Tiles. Craig Williams
 Desktop Mapping: Creating Vector Tiles Craig Williams Edie Punt @williamscraigm @epunt Overview Why vector tiles? Vector tiles in ArcGIS ArcGIS vector tile basemaps Consuming and styling vector tiles Overview
Bringing your Data to Life in the ArcGIS API for JavaScript: Vector Tiles. Craig Williams &
 Bringing your Data to Life in the ArcGIS API for JavaScript: Vector Tiles Craig Williams & Rene Rubalcava @williamscraigm @odoenet Overview Why vector tiles? Vector tiles in ArcGIS ArcGIS vector tile basemaps
US Geo-Explorer User s Guide. Web:
 US Geo-Explorer User s Guide Web: http://usgeoexplorer.org Updated on October 26, 2016 TABLE OF CONTENTS Introduction... 3 1. System Interface... 5 2. Administrative Unit... 7 2.1 Region Selection... 7
CS474 MULTIMEDIA TECHNOLOGY
 CS474 MULTIMEDIA TECHNOLOGY Pr. G. Tziritas, Spring 2018 SVG Animation Tutorial G. Simantiris (TA) OVERVIEW Introduction Definitions SVG Creating SVGs SVG basics Examples Animation using software Examples
Getting Started with the ArcGIS Server JavaScript API
 Getting Started with the ArcGIS Server JavaScript API Agenda Introduction ArcGIS Server services and mashups REST API Services Directory JavaScript API ArcGIS Server Resource Center Dojo Maps, layers,
Php And Mysql Manual Simple Yet Powerful Web Programming
 Php And Mysql Manual Simple Yet Powerful Web Programming It allows you to create anything from a simpledownload EBOOK. Beginning PHP 6, Apache, MySQL 6 Web Development Free Ebook Offering a gentle learning
Real time Mobile GIS For Transportation
 Real time Mobile GIS For Transportation MATT VON WAHLDE GEONETICS, INC BOSTON, MA Boston, MA Introduction Matt von Wahlde Chief Operating Officer, Geonetics, Inc. Custom Application Development Services
Modern and Responsive Mobile-enabled Web Applications
 Available online at www.sciencedirect.com ScienceDirect Procedia Computer Science 110 (2017) 410 415 The 12th International Conference on Future Networks and Communications (FNC-2017) Modern and Responsive
Introduction to JavaScript. Evan Caldwell & James Tedrick
 Introduction to JavaScript Evan Caldwell & James Tedrick Agenda Getting Started - Meet the Esri API for JavaScript! - Meet Dojo! - Tools of the trade My First App JS API fundamentals How JS apps work Where
[ ]..,ru. GeoServer Beginner's Guide. open source^ software server. Share and edit geospatial data with this open source.
![[ ]..,ru. GeoServer Beginner's Guide. open source^ software server. Share and edit geospatial data with this open source.](/thumbs/80/80955530.jpg "[ ]..,ru. GeoServer Beginner's Guide. open source^ software server. Share and edit geospatial data with this open source.") GeoServer Beginner's Guide Share and edit geospatial data with this open source software server Stefano lacovella Brian Youngblood [ ]..,ru open source^ PUBLISHING community experience distilled BIRMINGHAMMUMBAI
GeoServer Beginner's Guide Share and edit geospatial data with this open source software server Stefano lacovella Brian Youngblood [ ]..,ru open source^ PUBLISHING community experience distilled BIRMINGHAMMUMBAI
_ LUCIADRIA V PRODUCT DATA SHEET _ LUCIADRIA PRODUCT DATA SHEET
 _ LUCIADRIA PRODUCT DATA SHEET V2016 LuciadRIA offers browser-based geospatial situational awareness with the fluidity and speed of a desktop application. The software components of LuciadRIA have been
Best Practices for Designing Effective Map Services
 2013 Esri International User Conference July 8 12, 2013 San Diego, California Technical Workshop Best Practices for Designing Effective Map Services Ty Fitzpatrick Tanu Hoque What s in this session Map
Chapter 6. Building Maps with ArcGIS Online
 Chapter 6 Building Maps with ArcGIS Online Summary: ArcGIS Online is an on-line mapping software that allows you to upload tables with latitude and longitude geographic coordinates to create map layers
Creating an Online Catalogue Search for CD Collection with AJAX, XML, and PHP Using a Relational Database Server on WAMP/LAMP Server
 CIS408 Project 5 SS Chung Creating an Online Catalogue Search for CD Collection with AJAX, XML, and PHP Using a Relational Database Server on WAMP/LAMP Server The catalogue of CD Collection has millions
Building Mashups Using the ArcGIS APIs for FLEX and JavaScript. Shannon Brown Lee Bock
 Building Mashups Using the ArcGIS APIs for FLEX and JavaScript Shannon Brown Lee Bock Agenda Introduction Mashups State of the Web Client ArcGIS Javascript API ArcGIS API for FLEX What is a mashup? What
STRANDS AND STANDARDS
 STRANDS AND STANDARDS Course Description Web Development is a course designed to guide students in a project-based environment in the development of up-to-date concepts and skills that are used in the
Basic Steps for Creating an Application with the ArcGIS Server API for JavaScript
 Chapter 4: Working with Maps and Layers Now that you have a taste of ArcGIS Server and the API for JavaScript it s time to actually get to work and learn how to build some great GIS web applications! The
May 22, 2013 Ronald Reagan Building and International Trade Center Washington, DC USA
 May 22, 2013 Ronald Reagan Building and International Trade Center Washington, DC USA 1 Building Applications with Oracle MapViewer LJ Qian (lj.qian@oracle.com) Director, Software Development The following
DATABASE SYSTEMS. Database programming in a web environment. Database System Course,
 DATABASE SYSTEMS Database programming in a web environment Database System Course, 2016-2017 AGENDA FOR TODAY The final project Advanced Mysql Database programming Recap: DB servers in the web Web programming
Open Source Cloud Map User Guide
 Open Source Cloud Map User Guide Table of Contents Map Page... 1 Static Mercator Map... 1 Customizable Map... 1 Title Bar... 2 Toolbar... 2 Non Toolbar Navigation... 3 Map Window... 3 Layers / Legend Window...
PHP Online Training. PHP Online TrainingCourse Duration - 45 Days. Call us: HTML
 PHP Online Training PHP is a server-side scripting language designed for web development but also used as a generalpurpose programming language. PHP is now installed on more than 244 million websites and
Getting Started with the ArcGIS API for JavaScript. Julie Powell, Paul Hann
 Getting Started with the ArcGIS API for JavaScript Julie Powell, Paul Hann Esri Developer Summit Berlin November 19 2012 Getting Started with the ArcGIS API for JavaScript ArcGIS for Server Is a Platform
Chapter 8: Using Toolbars
 Chapter 8: Using Toolbars As a GIS web application developer you want to focus on building functionality specific to the application you are constructing. Spending valuable time and effort adding basic
Using Development Tools to Examine Webpages
 Chapter 9 Using Development Tools to Examine Webpages Skills you will learn: For this tutorial, we will use the developer tools in Firefox. However, these are quite similar to the developer tools found
Building Basemaps: MapCaches and VectorTiles. Matthias Schenker Gerhard Trichtl
 Building Basemaps: MapCaches and VectorTiles Matthias Schenker Gerhard Trichtl What are Basemaps for Basemaps provide a optimal background and orientation for displaying your data on top Should be - Fast
Advance Mobile& Web Application development using Angular and Native Script
 Advance Mobile& Web Application development using Angular and Native Script Objective:- As the popularity of Node.js continues to grow each day, it is highly likely that you will use it when you are building
3D in the ArcGIS Platform. Chris Andrews
 3D in the ArcGIS Platform Chris Andrews Geospatial 3D is already all around us 3D is expanding the GIS community s opportunity to provide value 3D City & Infrastructure Models Generated 3D features Photogrammetrc
THE DATA ANALYTICS BOOT CAMP
 THE DATA ANALYTICS BOOT CAMP CURRICULUM OVERVIEW Over the course of the past decade, the explosion of data has transformed nearly every industry known to man. Whether it s in marketing, healthcare, government,
CSS. HTML5,CSS3,JS & PHP Simplified. Smart Course for Absolute Beginners. REGISTER AT:
 SKILLHUB MOB +91 9881 0455 39 FREE INDUSTRIAL TRAINING PROGRAM (Web And Mobile) Register before 15 July 2018 *Limited Seats Only Free HTML CSS JS PHP HTML5,CSS3,JS & PHP Simplified Smart Course for Absolute
Lab 4. Accessing Secondary Data with CartoDB
 Lab 4 Accessing Secondary Data with CartoDB What You Will Learn How To Access a wide variety of geographic data sources Perform queries on data Digitize your own data Screen-scape from web pages Georeference
Full Stack boot camp
 Name Full Stack boot camp Duration (Hours) JavaScript Programming 56 Git 8 Front End Development Basics 24 Typescript 8 React Basics 40 E2E Testing 8 Build & Setup 8 Advanced JavaScript 48 NodeJS 24 Building
Visualization with ArcGlobe. Brady Hoak
 Visualization with ArcGlobe Brady Hoak Contents What is ArcGlobe? 3D Mapping and ArcGlobe Displaying data in ArcGlobe ArcGlobe tools Tips for constructing ArcGlobe documents New at ArcGIS 9.3 ArcGIS integration
Technical Architecture & Analysis
 Technical Architecture & Analysis HS2 Technical Architecture & Analysis 15 October 2012 Anton Palitsyn 020 7426 8920 anton.palitsyn@precedent.co.uk Contents Contents... 2 Document info... 3 Authors...
Creating Web Mapping Applications. Nikki Golding
 Creating Web Mapping Applications Nikki Golding Agenda Web Mapping and Map Services Fundamentals ArcGIS Web Mapping Applications - ArcGIS.com Viewer - ArcGIS Explorer Online - ArcGIS Viewer for Flex -
Project Title REPRESENTATION OF ELECTRICAL NETWORK USING GOOGLE MAP API. Submitted by: Submitted to: SEMANTA RAJ NEUPANE, Research Assistant,
 - 1 - Project Title REPRESENTATION OF ELECTRICAL NETWORK USING GOOGLE MAP API Submitted by: SEMANTA RAJ NEUPANE, Research Assistant, Department of Electrical Energy Engineering, Tampere University of Technology
Deliverable D3.12. Contract number: OJEU 2010/S Deliverable: D3.12 Author: Igor Antolovic Date: Version: Final
 Deliverable D3.12 Final and public version of the implemented web site with full functionality that hosts all relevant information on the Climate Atlas of the Carpathian Region, including a public download
MapInfo2Leaflet. User Guide TWIAV.NL
 MapInfo2Leaflet User Guide TWIAV.NL Version 0.35 7 November 2014 Table of Contents 1. Introduction... 2 2. Export a MapInfo Table to a Web Map Application using Leaflet... 3 2.1. Preparation: open a table
Syllabus INFO-GB Design and Development of Web and Mobile Applications (Especially for Start Ups)
") Syllabus INFO-GB-3322 Design and Development of Web and Mobile Applications (Especially for Start Ups) Fall 2015 Stern School of Business Norman White, KMEC 8-88 Email: nwhite@stern.nyu.edu Phone: 212-998
Syllabus INFO-GB-3322 Design and Development of Web and Mobile Applications (Especially for Start Ups) Fall 2015 Stern School of Business Norman White, KMEC 8-88 Email: nwhite@stern.nyu.edu Phone: 212-998
Fundamentals of Web Development. Web Development. Fundamentals of. Global edition. Global edition. Randy Connolly Ricardo Hoar
 Connolly Hoar This is a special edition of an established title widely used by colleges and universities throughout the world. Pearson published this exclusive edition for the benefit of students outside
Leveraging OGC Services in ArcGIS Server. Satish Sankaran, Esri Yingqi Tang, Esri
 Leveraging OGC Services in ArcGIS Server Satish Sankaran, Esri Yingqi Tang, Esri GIS Creating and Managing Geo Information Products - Proprietary - Open Specifications - Standards Dissemination of Geo
Regarding the quality attributes, the architecture of the system must be:
 The SDSS System Overview This chapter gives an overview of the software architecture of the RiskChanges SDSS system. One of the objectives within the project is the development of a SDSS system for probabilistic
ArcWeb Services (APIs, GIS Content and Functionality)
") ArcWeb Services SOAP API Deep Dive Marwa Mabrouk: Saravanan Rajaram: ArcWeb Development Manager ArcWeb Senior QA Engineer Developer Summit 2007 1 Topics Quick Overview Location services Spatial analysis
ArcWeb Services SOAP API Deep Dive Marwa Mabrouk: Saravanan Rajaram: ArcWeb Development Manager ArcWeb Senior QA Engineer Developer Summit 2007 1 Topics Quick Overview Location services Spatial analysis
COURSE OUTLINE MOC 20480: PROGRAMMING IN HTML5 WITH JAVASCRIPT AND CSS3
 COURSE OUTLINE MOC 20480: PROGRAMMING IN HTML5 WITH JAVASCRIPT AND CSS3 MODULE 1: OVERVIEW OF HTML AND CSS This module provides an overview of HTML and CSS, and describes how to use Visual Studio 2012
Introduction to Sencha Ext JS
 Introduction to Sencha Ext JS Olga Petrova olga@sencha.com Sales Engineer EMEA Agenda Use Case How It Works Advantages Demo Use case Ext JS a Javascript framework for building enterprise data-intensive
Introduction to Databases
 Introduction to Databases Lecture 1 Robb T. Koether Hampden-Sydney College Mon, Jan 15, 2018 Robb T. Koether (Hampden-Sydney College) Introduction to Databases Mon, Jan 15, 2018 1 / 16 1 Overview of the
Standard 1 The student will author web pages using the HyperText Markup Language (HTML)
") I. Course Title Web Application Development II. Course Description Students develop software solutions by building web apps. Technologies may include a back-end SQL database, web programming in PHP and/or
I. Course Title Web Application Development II. Course Description Students develop software solutions by building web apps. Technologies may include a back-end SQL database, web programming in PHP and/or
DEVELOPMENT OF A MOBILE DATA COLLECTION AND MANAGEMENT SYSTEM
 DEVELOPMENT OF A MOBILE DATA COLLECTION AND MANAGEMENT SYSTEM Nguyen Mai Dung* 1 and Tran Trung Chuyen 1, Nguyen Truong Xuan 1, Tran Truong Giang 1, Le Hong Anh 1, Dao Ngoc Long 2 1 Falculty of Information
INFO216: Advanced Modelling
 INFO216: Advanced Modelling Theme, spring 2017: Modelling and Programming the Web of Data Andreas L. Opdahl Session 6: Visualisation Themes: visualisation data/visualisation types
Hands-on: Using ArcGIS and QGIS. GIS Mapping for Linguistic Research Jennifer Cramer University of Kentucky
 Hands-on: Using ArcGIS and QGIS GIS Mapping for Linguistic Research Jennifer Cramer University of Kentucky Hands on! I think last week went well! Like last week, I ll do a quick run through of the assignment,
Ajax On Rails: Build Dynamic Web Applications With Ruby By Scott Raymond READ ONLINE
 Ajax On Rails: Build Dynamic Web Applications With Ruby By Scott Raymond READ ONLINE Let's take a look at how we can accomplish this with AJAX in Rails. Overall, I was quite surprised at how easy it is
Advanced PHP and MySQL
 COURSE SYLLABUS Advanced PHP and MySQL Industrial Training (3 MONTHS) PH : 0481 2411122, 09495112288 E-Mail : info@faithinfosys.com www.faithinfosys.com Marette Tower Near No. 1 Pvt. Bus Stand Vazhoor
Working with Javascript Building Responsive Library apps
 Working with Javascript Building Responsive Library apps Computers in Libraries April 15, 2010 Arlington, VA Jason Clark Head of Digital Access & Web Services Montana State University Libraries Overview
Introduction to XML. Asst. Prof. Dr. Kanda Runapongsa Saikaew Dept. of Computer Engineering Khon Kaen University
 Introduction to XML Asst. Prof. Dr. Kanda Runapongsa Saikaew Dept. of Computer Engineering Khon Kaen University http://gear.kku.ac.th/~krunapon/xmlws 1 Topics p What is XML? p Why XML? p Where does XML
DATA SCIENCE NORTHWESTERN BOOT CAMP CURRICULUM OVERVIEW DATA SCIENCE BOOT CAMP
 DATA SCIENCE BOOT CAMP NORTHWESTERN DATA SCIENCE BOOT CAMP CURRICULUM OVERVIEW Over the past decade, the explosion of data has transformed nearly every industry known to man. Whether it s marketing, healthcare,
Desktop Mapping: Creating Vector Tiles. Craig Williams &
 Desktop Mapping: Creating Vector Tiles Craig Williams & Edie Punt @williamscraigm @epunt Overview Why vector tiles? Vector tiles in ArcGIS ArcGIS vector tile basemaps Consuming and styling vector tiles
Feed Your Inner Data Scientist JAVASCRIPT TOOLS FOR DATA VISUALIZATION AND ANALYSIS
 Feed Your Inner Data Scientist JAVASCRIPT TOOLS FOR DATA VISUALIZATION AND ANALYSIS GOAL For Today Big Data Health Gov t Financial Dev Ops IOT Sensors Stats Bio Doug Mair Doug.Mair@gmail.com @doug_mair
SEXTANT 1. Purpose of the Application
 SEXTANT 1. Purpose of the Application Sextant has been used in the domains of Earth Observation and Environment by presenting its browsing and visualization capabilities using a number of link geospatial
ICIT. Brian Hiller ESRI Account Manger. What s new in ArcGIS 10
 ICIT Brian Hiller ESRI Account Manger What s new in ArcGIS 10 ArcGIS 10 Fast Easy Powerful Everywhere late June 2010 ArcGIS System for Geographic Information Desktop Server Mobile Online A System A Complete