Chapter 6. Building Maps with ArcGIS Online
|
|
|
- Alexandra Bell
- 6 years ago
- Views:
Transcription
1 Chapter 6 Building Maps with ArcGIS Online Summary: ArcGIS Online is an on-line mapping software that allows you to upload tables with latitude and longitude geographic coordinates to create map layers that can then be combined with other features, or linked to other layers and base maps. Like Fusion Tables, you can publicly share and then embed them into your stories. Unlike Fusion Tables, ArcGIS visualizations can be sized to suit the device of your choosing. There are many other advantages. For instance, you can turn layers on and off, use different kinds of base maps, create actual stories with maps using photographs, and use a greater variety of options to make your visualizations come to life. In short, ArcGIS is an extremely versatile online tool worth taking the time to learn. ArcGIS Online was developed by ESRI, a North American company that has a large influence in the world of mapping software and is the home of something called GIS (Geographic Information Systems). What you will learn: 1. How to sign up. 2. Getting started with web maps. 3. Uploading files. 4. Symbolizing the files. 5. Sharing and embedding the files. Task 1: How to sign up Use a compatible web browser. For the best performance, ArcGIS recommends that you use Mozilla Firefox 2, Google Chrome or Internet Explorer 8 or higher. Earlier

2 versions of Explorer are not supported. You can find more details and the ArcGIS Online Help Section. If you don t have an account, you ll have to create one by going to the ArcGIS homepage and signing up. Select Try ArcGIS, where you ll be taken to a Sign Up page. Enter your First Name. Enter your Last Name. Enter your address, and re-enter your address to confirm.

3 Select your industry from the drop-down menu. Click on the START TRIAL button. A confirmation page will appear and an activation will be sent to the account that you provided. Check for the activation , and select the activation link to start creating your ArcGIS Online account. Enter a username, between 6 and 128 characters in length and containing letters, numbers or a combination of both. You can also use the following special characters:.(dot), _(underscore) sign). Other special characters and spaces are forbidden. Your user name is also case-sensitive. Signing up and creating passwords can be tricky and frustrating. So be ready to exercise a bit of patience. Enter a password that is at least eight characters in length, containing at least one letter and one numbers. As is the case with your user name, special characters and spaces are not allowed. Your password is also case-sensitive. Re-enter your password to confirm.

4 If your address is not populated in the Address field, be sure to enter it. Plug in the name of your Organization, which can always be altered later. Select a Security Question from the drop-down menu, and type an answer in the Answer field. Read the ArcGIS Online Terms of Use and select the box to accept the terms and conditions Click on the Create My Account button. Now you must establish an organizational account to complete the setup process. Organization Name will appear on the home page, which you can alter. Organization Short Name is an acronym or abbreviation (avoid special characters and spaces). This will become part of your organization s URL and cannot be altered later. The maximum number of characters for the short name is 16. For Language, choose a default language of English or French. For Region, select a region to determine the default base _map gallery. Your choice of region also controls other feature such as the scale bar. For instance, selecting the United States produces units in miles and feet; Canada sets the unit in metres and kilometres.

5 For Security, uncheck the box to Allow access to the organization through HTTPS only and click OK to the warning. Leave Link as default. Once you re done, you ll be guided to your organization s account. A welcome message will appear to show you how to access other ready-to-use apps. Click on the Continue with ArcGIS Online button. Task 2: Getting started with web maps. Once you ve set up an account, you can sign into ArcGIS Online ( using your username and password. You ll notice a menu across the top. To begin the process of uploading content, select My Content. Click the Create tab, and select Map option from the drop-down menu, which produces a dialogue box.
 and then click")
6 Enter a name in the Title box, and a few tags, (Summary is optional) and then click OK.

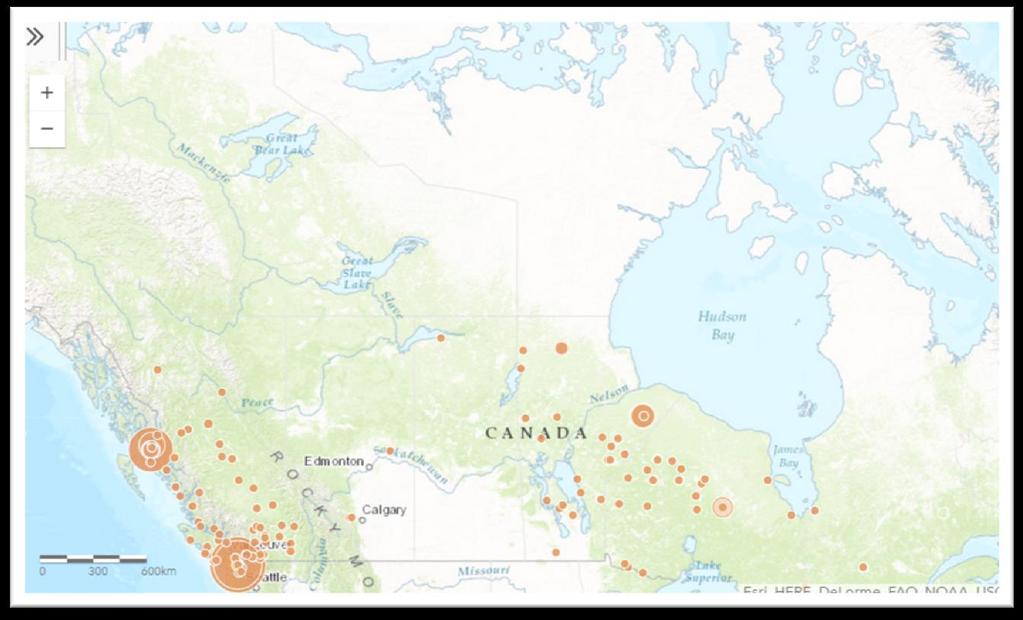
7 Task 3: Uploading files. Click on the Add icon and select the Add layer from file option. Now this is the base map that we will use to display the federal contaminated waste file that we used for Fusion Table tutorial. As was the case with Fusion Tables, you ll notice that there are many columns. Not to worry. Once we upload the file, we can de-select the columns that we don t want to show in the pop-up box. Scrolling to the right takes us to the geographic coordinates.

8 ArcGIS will the contaminated sites latitude and longitude coordinates to place them on the map. Close the CSV file. Go back to your empty map on ArcGIS Online.


9 Zoom so that Canada is visible. Pan to the map so that Canada is centred by clicking on the map and dragging it with your mouse. Now we re ready to add the contaminated sites locations.


10 Click the Add icon to the left of the map.
11 Select Add Layer from File and browse for the csv file.

12 Import the layer. ArcGIS Online has automatically located the fields within your dataset related to location. That being said, ArcGIS Online can also handle many datasets with columns that might have other geographic information such as country, city, or a local address. So, you will need to specify which one you d like to use. In the screen shot above, all the data has been added to the map with the default symbology, which we ll modify later in this tutorial. Before we continue, a word about symbology. To symbolize a feature, means assigning colours, markers, sizes, widths, angles, patterns, transparency, and other properties that will make them recognizable on a map. All features in layers added to ArcGIS Online possess the same symbology. In this case, the contaminated sites locations are displayed as small circles. Now, back to the task at hand.

13 Task 4. Symbolizing the files. Importing the contaminated sites layer also produces a Change Style menu to the left. Step number 1 allows you to choose the attribute or column you want to show. Since ArcGIS Online has already used the longitude and latitudes to place the sites, you don t have to bother with this for now. However, if you wanted to display a value that denotes the level of contamination for each site, selecting that column would produce circles that would be sized proportionately to the contamination s surface area.

14 For instance, choosing the column Estimated Tons Contaminated, produces a circles representing surface area the contamination covers. The pop-up box just below the map provides a legend.

15 Clicking on step 2 produces more options for changing the symbology. For instance, you can change the actual symbol by hovering your mouse above the Symbols icon. By adjusting the slider to the left of the Symbols icon, you can alter the range of values, perhaps eliminating the ones that you don t want displayed on the map. And by using the vertical scroll bar to the right, you ll locate other options lower down on the menu.

16 Because we can also change the symbology even after the layer has been added, select the OK and then the DONE tabs. Hovering your mouse over the new csv layer produces a menu of icons immediately below.

17 Show Legend produces the values that you ve chosen to display when importing the dataset, in this case, Estimated Tons Contaminated.
18


19 Selecting the Show Table icon produces a view of the table right below the map. Hovering your mouse over the titles allows for sorting the column s values in ascending or descending order, a step handy for checking that everything has been imported. Click on the X at the table s top-right corner to hide it.

20 The Change Style option allows for the same kinds of changes to the symbology that we described earlier.

21 Use the vertical scroll bar to the right to see more options such as the ability to make a heat map, which is described in Chapter 6 on pages 127 and 128.

22 If you don t have an account, your interface will not contain the icon that allows you to conduct analysis such as spatial joins.

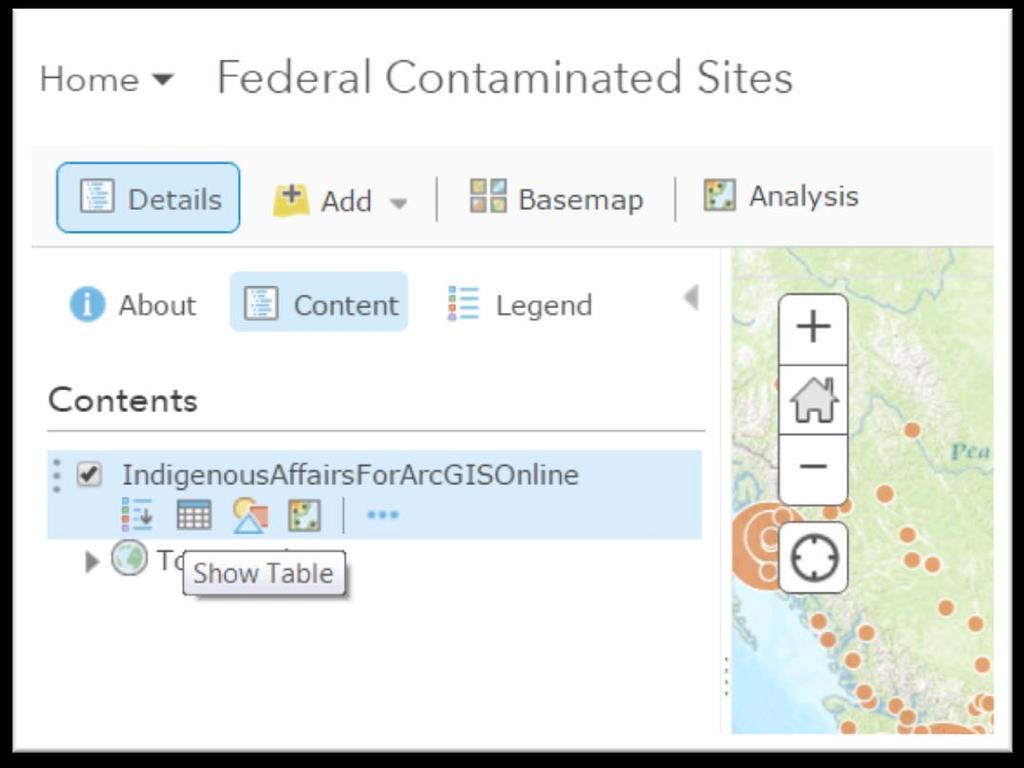
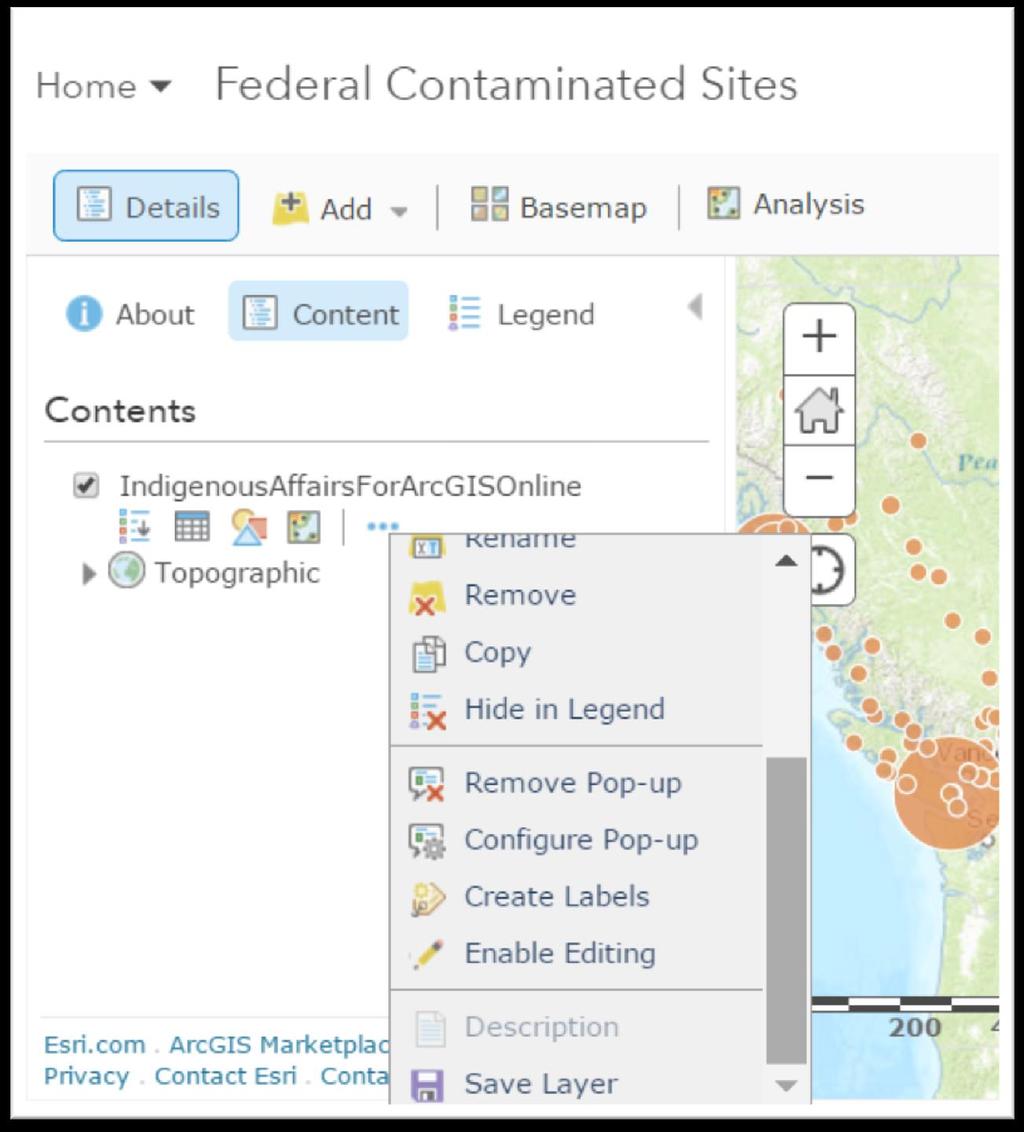
23 More Options produces a drop-down menu. The menu allows you to perform tasks such as reconfiguring the pop-up up menus, which you can see by using the vertical scroll bar to navigate towards the bottom of
24 the menu.. By now you ve probably also noticed the icons above the Contents menu. Clicking on Details makes the menu to the left appear and disppear. As we ve seen Add permits us to add layers, either from our hard drive, the web, or the ArgGIS Online archive. Basemap produces a gallery of maps.

25 The Topographic map is the one we re using.


26 For instance, selecting the Dark Gray Canvas produces a starker result. To return to our original map, return to your basemap section and select the topographical map. As previously mentioned, only paid accounts provide opportunities for analysis. The Save icon allows you to save the map, a necessary step being able to share it, which the icon to the immediate right allows you do do. So let s save what we ve done so far.

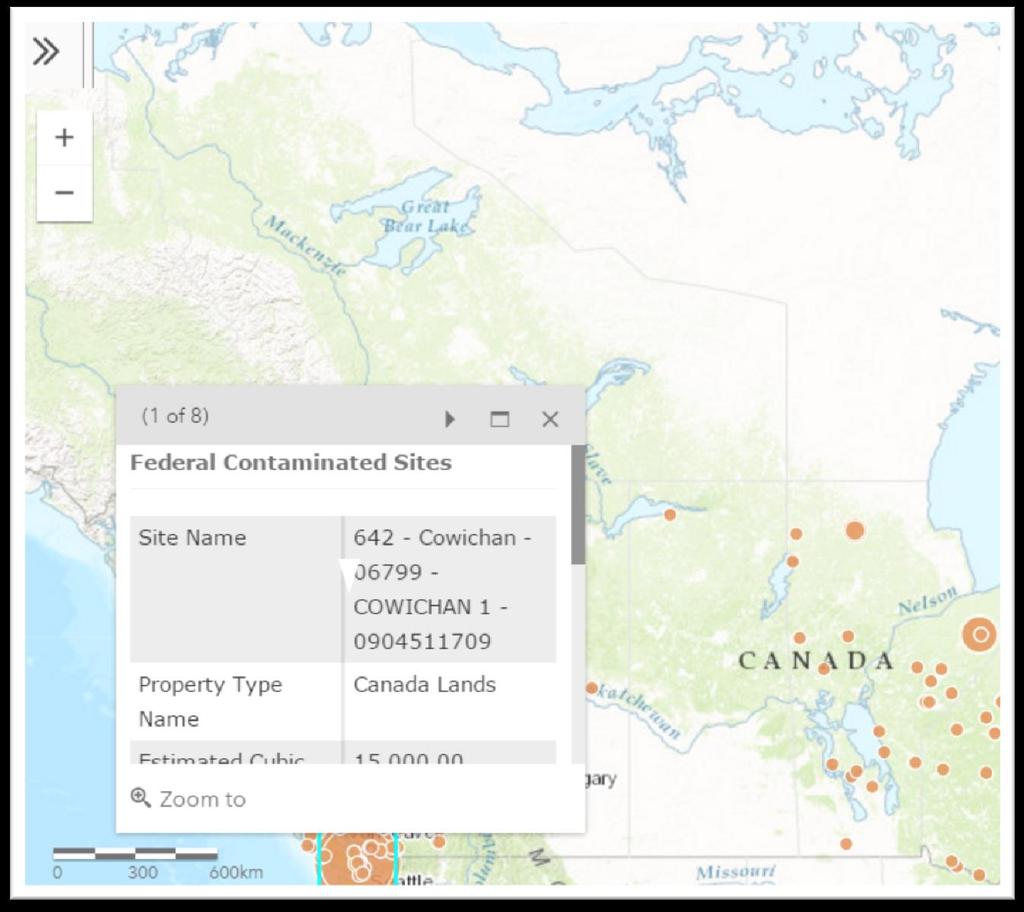
27 Next, we ll reconfigure the pop-up boxes. Click on any circle on the map.


28 The vertical scroll bar allows you to see the remaining columns in the first view. Clicking the arrow pointing to the right, produces the remaining columns. Unless there s a specific reason to do so, there s no need to burden viewers with all these details. Deciding which ones to show is an editorial decision. For the sake of this exercise, let s whittle down the selection by returning to the More Options menu.
29

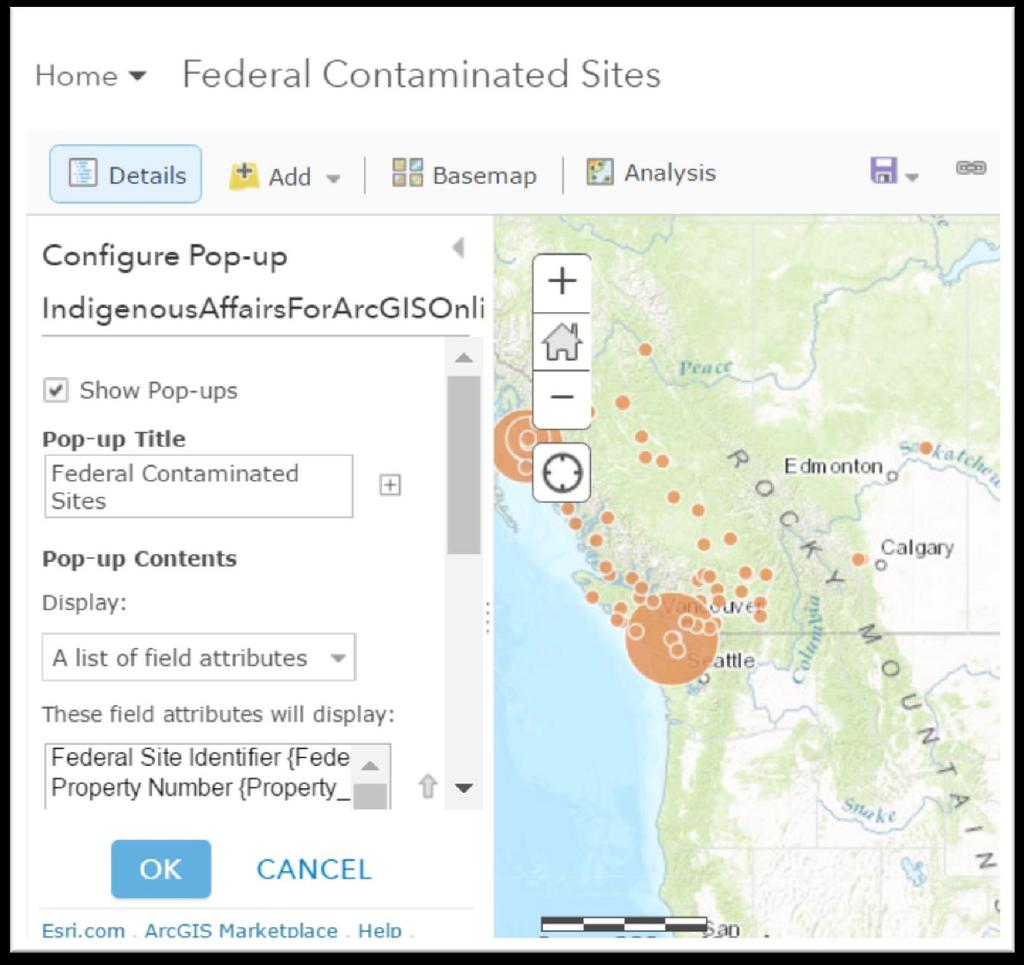
30 Select Reconfigue Pop-up, which produces a menu to the left. Let s begin by givingt the pop-up a title, Federal Contaminated Sites.
31

32 Now use the vertical scroll bar to the menu s right to navigate a little further downward.
33 Select Configure Attributes. Here, we can de-select the fields we want to hide, and give the ones we want to display new labels by clicking on the titles in the Field Alias column. (NOTE: We learned about alias when discussing MySQL in Chapter 5.)

34 There are also other options. For instance, by clicking on the ADD tab, you get options for adding charts or images to your pop-up box.

35 Select Bar Chart. We may decide that a bar chart would help to display other values in our dataset such as the pollution s estimated surface area. So let s call the bar chart Magnitude of Pollution. And you can also give it a caption, just like you would for a photograph. You should also choose the fields that contain the values you want dispayed in your


36 chart. Select OK, and then the second OK tab. Now select pop-up box for the same area, and maximize it so we can see all the contents. If you need to edit the caption or title, return to the Configure Pop-up menu and double-click on the title you ve given the pop-up box, which once again produces the Configure Bar Chart dialogue box. Once you re finished and happy with the result, you ll have a pop-up box that s easier to read and conveys more information. Close the pop-up box and save the result.
37 Task 5. Sharing and embedding the files. Now if you re ready to embed this visualization into your blog post, you must share it by clicking the Share icon. The share icon produces a dialogue box. Make the map public, and then click the EMBED IN WEBSITE tab at the bottom of the dialogue box. Select the map options that you want your readers to exercise. Copy the embed code. (NOTE: You can also exercise other options under by clicking on the Add Symbol tab at the top.)
38 You can check out the Map Preview to the right to see how the map will appear once embedded into your online story. If you re satisfied with the options you ve chosen, select the DONE tab.

39 Embed the map into your blog.
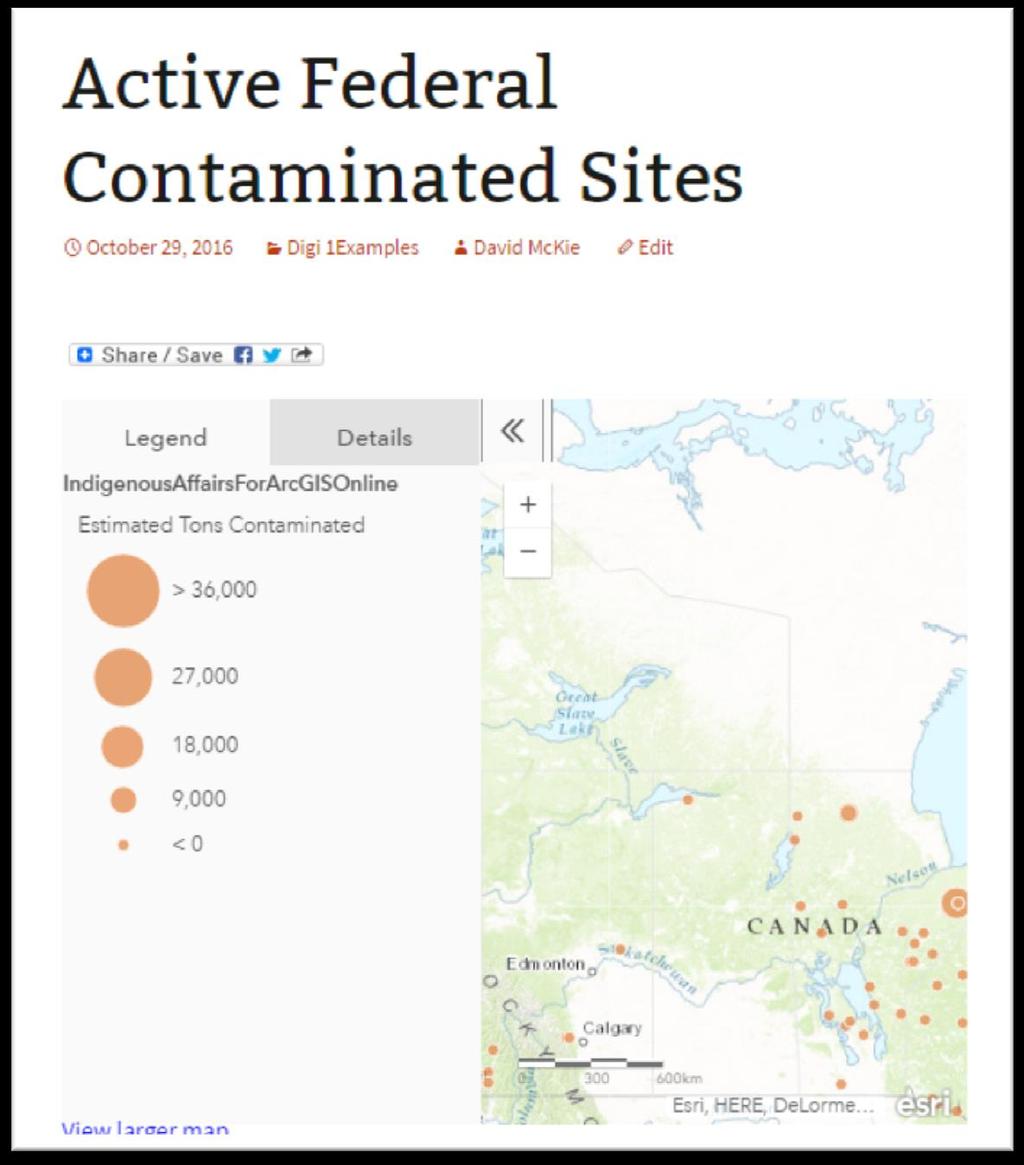
40
41
42

43 Following the same steps, you can also upload shape files that we learned about in Chapters 6 (page 121) and 7 (page 148). However, it s important to note that all the shape files components, or helper files, must be contained in a zipped folder. Just like the desktop version, ArcGIS Online needs access to all the shape file s other files. It s also important to note that Esri, the company that owns ArcGIS Online, is continually improving this product, and in the process making it more user friendly for journalists. As was mentioned earlier in the tutorial, you can also perform the kind of spatial analysis that we learned in Chapter 7. However, it s probably best, and less expensive, to perform your analysis in ArcGIS or Qgis, save the combined layers in a shape file, which you could then zip and upload to ArcGIS Online.
44 The beauty of learning many of the techniques in Data Journalist, means that they can be combined to produce results that will make your work sing online, thus setting it apart from your competitors.
Overview. Setting Up. Geospatial Centre University of Waterloo May 2014
 Overview ArcGIS Online is a web-based mapping and app-building site created by Esri, the world leader in GIS software. In an effort to empower users of all levels to create interactive maps and applications
ArcGIS Online Tutorial
 ArcGIS Online Tutorial ArcGIS Online allows users to make interactive maps or applications and easily share them with others. The University of Minnesota has an organizational account that can be logged
HCA ArcGIS. Online Tool - How To Guide V1.0 2/15/2016 HAWAII CONSERVATION ALLIANCE AGOL
 HCA ArcGIS 2/15/2016 Online Tool - How To Guide V1.0 HAWAII CONSERVATION ALLIANCE AGOL Table of Contents What is ArcGIS Online?... 1 Getting Started... 1 Getting a Login... 1 Logging In... 2 Searching
Analysing crime data in Maps for Office and ArcGIS Online
 Analysing crime data in Maps for Office and ArcGIS Online For non-commercial use only by schools and universities Esri UK GIS for School Programme www.esriuk.com/schools Introduction ArcGIS Online is a
Lesson 3a: Introduction to ArcGIS Online
 Lesson 3a: Introduction to ArcGIS Online Exercise 1: See Your World 1. Open ArcGIS Online: Go to http://www.arcgis.com, and click "Map" and a map will appear 2. Chick on the Sign in tab. A Sign In box
The Data Journalist Chapter 7 tutorial Geocoding in ArcGIS Desktop
 The Data Journalist Chapter 7 tutorial Geocoding in ArcGIS Desktop Summary: In many cases, online geocoding services are all you will need to convert addresses and other location data into geographic data.
Overview. Setting Up. Geospatial Centre University of Waterloo November 2015
 Overview ArcGIS Online is a web-based mapping and app-building site created by Esri, the world leader in GIS software. In an effort to empower users of all levels to create interactive maps and applications
Census tutorial using the city of Ottawa s wards
 Census tutorial using the city of Ottawa s wards Every five years, Statistics Canada uses the Census Program to collect vital data about Canadians that paints a portrait of who we are. Traditionally, the
ArcGIS Online (AGOL) Quick Start Guide Fall 2018
 Quick Start Guide Fall 2018") ArcGIS Online (AGOL) Quick Start Guide Fall 2018 ArcGIS Online (AGOL) is a web mapping tool available to UC Merced faculty, students and staff. The Spatial Analysis and Research Center (SpARC) provides
ArcGIS Online (AGOL) Quick Start Guide Fall 2018 ArcGIS Online (AGOL) is a web mapping tool available to UC Merced faculty, students and staff. The Spatial Analysis and Research Center (SpARC) provides
Community Health Maps Lab Series
 Community Health Maps Lab Series Lab 6 Data Visualization with Carto Objective Understand how to upload and style data with Carto to create an online visualization of your data Document Version: 2017-08-28(Final)
Map Direct Lite. Quick Start Guide: Map Layers 5/14/2018
 Map Direct Lite Quick Start Guide: Map Layers 5/14/2018 Contents Quick Start Guide: Map Layers... 1 Map Layers in Map Direct Lite.... 3 What is a Basemap Layer?... 4 Change the Basemap Using the Basemap
Getting Started with the NH Stone Wall Mapper January 2019
 Getting Started with the NH Stone Wall Mapper January 2019 Stone walls are significant cultural and historical features of the New England landscape. Creating a statewide inventory of existing stone walls
ArcGIS Online. Overview. Setting Up
 ArcGIS Online Overview ArcGIS Online is a web-based mapping and app-building site created by Esri, the world leader in GIS software. In an effort to empower users of all levels to create interactive maps
1. Start ArcMap by going to the Start menu > All Programs > ArcGIS > ArcMap.
 Learning ArcGIS: Introduction to ArcMap 10.1 The Map Document Feature Manipulation Navigating ArcMap Map Documents, Layers, and Features Shapes, Location, and Attribute Data Symbology Zoom, Pan and Map
Tutorial for mapping Census 2016 data in Qgis by census tracts
 Tutorial for mapping Census 2016 data in Qgis by census tracts Skills you will learn: How to join a Census 2016 map layer to a Census 2016 non-map layer, based on a common joining field shared by the two
Geo Apps: Modern Day GIS
 Geo Apps: Modern Day GIS Exercise 1: Create a customer service request app Estimated time: 20 minutes Exercise 2: Create a story map Estimated time: 30 minutes Exercise 3: Use Web AppBuilder for ArcGIS
Explore a map Learn ArcGIS
 Explore a map Learn ArcGIS In this lesson, you'll open a web map and learn how to navigate and work with it using map tools as you explore Farmer Markets in the Louisville Area. 1. Go to www.arcgis.com
Downloading shapefiles and using essential ArcMap tools
 CHAPTER 1 KEY CONCEPTS downloading shapefiles learning essential tools exploring the ArcMap table of contents understanding shapefiles customizing shapefiles saving projects Downloading shapefiles and
Manitowoc County, WI Advanced Access GIS Viewer User Documentation
 Manitowoc County, WI Advanced Access GIS Viewer User Documentation Introduction Extensive time was put into developing this website both from a display, and from a printing and scaling perspective. This
GIS DATA SUBMISSION USER GUIDE. Innovation and Networks Executive Agency
 Innovation and Networks Executive Agency GIS DATA SUBMISSION USER GUIDE Innovation and Networks Executive Agency (INEA) W910 Chaussée de Wavre 910 B-1049 Brussels, Belgium Tel: +32 (0)2 29 95252 Fax: +32
MicroStrategy Analytics Desktop
 MicroStrategy Analytics Desktop Quick Start Guide MicroStrategy Analytics Desktop is designed to enable business professionals like you to explore data, simply and without needing direct support from IT.
RAPIDMAP Geocortex HTML5 Viewer Manual
 RAPIDMAP Geocortex HTML5 Viewer Manual This site was developed using the evolving HTML5 web standard and should work in most modern browsers including IE, Safari, Chrome and Firefox. Even though it was
Tutorial 1 Exploring ArcGIS
 Tutorial 1 Exploring ArcGIS Before beginning this tutorial, you should make sure your GIS network folder is mapped on the computer you are using. Please refer to the How to map your GIS server folder as
GGR 375 QGIS Tutorial
 GGR 375 QGIS Tutorial With text taken from: Sherman, Gary E. Shuffling Quantum GIS into the Open Source GIS Stack. Free and Open Source Software for Geospatial (FOSS4G) Conference. 2007. Available online
No Programming Required Create web apps rapidly with Web AppBuilder for ArcGIS
 No Programming Required Create web apps rapidly with Web AppBuilder for ArcGIS By Derek Law, Esri Product Manager, ArcGIS for Server Do you want to build web mapping applications you can run on desktop,
Starting the QGIS Program. Exercise 1: Exploring QGIS
 Exercise 1: Exploring QGIS In this exercise you will learn how to open maps, manipulate layers, add spatial data, change symbols, and navigate within QGIS. You will also learn to repair broken data links.
Using Syracuse Community Geography s MapSyracuse
 Using Syracuse Community Geography s MapSyracuse MapSyracuse allows the user to create custom maps with the data provided by Syracuse Community Geography. Starting with the basic template provided, you
Estuary Data Viewer User Guide
 1. Introduction 2. Page Layout 3. Navigation Tools 4. Table of Contents Tabs 5. Action Tools 6. System Requirements Estuary Data Viewer User Guide 1. Introduction Welcome to the Estuary Planner Data Viewer.
Classroom Blogging. Training wiki:
 Classroom Blogging Training wiki: http://technologyintegrationshthornt.pbworks.com/create-a-blog 1. Create a Google Account Navigate to http://www.google.com and sign up for a Google account. o Use your
Tutorial 1: Finding and Displaying Spatial Data Using ArcGIS
 Tutorial 1: Finding and Displaying Spatial Data Using ArcGIS This tutorial will introduce you to the following: Websites where you may browse to find geospatial information Identifying spatial data, usable
Adding text and shapefiles and editing their layer properties into ArcGIS.com
 Adding text and shapefiles and editing their layer properties into ArcGIS.com With the latest release of ArcGIS.com, you can add a layer to your map that was stored in a delimited text file (.txt or.csv),
1. NJDEP Landscape 3.3 Viewer Interface
 Using the Landscape Project through NJDEP Landscape 3.3 Viewer Google Chrome or Mozilla Firefox are recommended for the use of this app. Navigate to the NJDEP-DFW s Landscape Project web page at www.njfishandwildlife.com/ensp/landscape/
Part 2: Build your own Map Tour with ArcGIS Online
 Part 2: Build your own Map Tour with ArcGIS Online Tutorial Overview In this tutorial, students will create and publish their own Map Tour application, a type of Story Map Web application, through ArcGIS
Tutorial for analyzing and mapping contaminated sites data
 Tutorial for analyzing and mapping contaminated sites data The federal government oversees thousands of sites that are contaminated with a number of pollutants such as petroleum hydrocarbons, a mixture
Read and accept the following disclaimer:
 How to use the Person County Tax Parcel Viewer Visit gis.personcounty.net and click to view the Tax Parcel Viewer or go to gis.personcounty.net/taxparcelviewer Read and accept the following disclaimer:
Chapter 7. Buffering in QGIS Desktop
 Chapter 7 Buffering in QGIS Desktop Summary: How far away is that? How many are too close? These are some of the most compelling mapping questions journalists can ask. A buffer is one of the most useful
BC Spatial Member Map Viewer. Version 2.0. User Guide. May 2015
 BC Spatial Member Map Viewer Version 2.0 User Guide May 2015 1 P a g e Revised: 16 June 2015 Contents Contents... 2 Introduction... 4 System Requirements... 5 BC Spatial Map Viewer... 6 I. Navigation Tools...
Step by Step GIS. Section 1
 Step by Step GIS Section 1 Contact the web page given below for the data required to do the exercises (http://www.pasda.psu.edu/default.asp) Before beginning the tutorials please visit the Preparation
GIS DATA SUBMISSION USER GUIDE. Innovation and Networks Executive Agency
 Innovation and Networks Executive Agency GIS DATA SUBMISSION USER GUIDE Innovation and Networks Executive Agency (INEA) W910 Chaussée de Wavre 910 B-1049 Brussels, Belgium Tel: +32 (0)2 29 95252 Fax: +32
9 Share results online
 Lesson 9 Share results online THE CITY COUNCIL WOULD LIKE to make the park analysis available to the public. A paper map, such as the one we made in the last lesson, is the traditional way to share results,
Introduction to using QGIS for Archaeology and History Workshop by the Empirical Reasoning Center
 Introduction to using QGIS for Archaeology and History Workshop by the Empirical Reasoning Center In this workshop, we will cover the basics of working with spatial data, as well as its main uses for archaeology.
GEOG 487 Lesson 2: Step-by-Step Activity
 GEOG 487 Lesson 2: Step-by-Step Activity In Lesson 2, we are going to create a website that contains interactive maps with datasets related to our project scenario described in the Introduction. We will
Google Earth Tutorial 1: The Basics of Map-making in Google Earth 6.2
 Google Earth Tutorial 1: The Basics of Map-making in Google Earth 6.2 University of Waterloo Map Library, 2012 Part 1: Placemarks 1. Locating a Geographical Area a. Open up Google Earth. b. In the Search
Navigating the ArcGIS Application Welcome to WebMap HELP
 Welcome to WebMap HELP Scroll or click on links below to access more information Table of Contents Basic Navigation Bar Zoom In/Out Search Bar Home Button Legend Layer List Basemap Gallery Draw Measurement
REDI 5.0 User Manual
 REDI 5.0 User Manual OBJECTIVE: REDI (Regional Economic Development Information System) provides a quick, convenient and easy way of accessing the City of San Diego Business Incentive Zones (BIZ) information.
Guide to Mapping Website (Public) December 2016 GC_236594
 December 2016 GC_236594") Guide to Mapping Website (Public) December 2016 GC_236594 Table of Contents Guide to Mapping Website (Public)... 1 December 2016... 1 Quick Start... 3 Map Layers... 4 How do I?... 5 Draw on the Map...
Guide to Mapping Website (Public) December 2016 GC_236594 Table of Contents Guide to Mapping Website (Public)... 1 December 2016... 1 Quick Start... 3 Map Layers... 4 How do I?... 5 Draw on the Map...
GEOG 487 Lesson 2: Step-by-Step Activity
 GEOG 487 Lesson 2: Step-by-Step Activity In Lesson 2, we are going to create a website that contains interactive maps with datasets related to our project scenario described in the Introduction. We will
SCHULICH MEDICINE & DENTISTRY Website Updates August 30, Administrative Web Editor Guide v6
 SCHULICH MEDICINE & DENTISTRY Website Updates August 30, 2012 Administrative Web Editor Guide v6 Table of Contents Chapter 1 Web Anatomy... 1 1.1 What You Need To Know First... 1 1.2 Anatomy of a Home
Tableau Tutorial Using Canadian Arms Sales Data
 Tableau Tutorial Using Canadian Arms Sales Data 1) Your data comes from Industry Canada s Trade site. 2) If you don t want to download the data yourself, use this file. You can also download it from the
Explore some of the new functionality in ArcMap 10
 Explore some of the new functionality in ArcMap 10 Scenario In this exercise, imagine you are a GIS analyst working for Old Dominion University. Construction will begin shortly on renovation of the new
Introduction to GIS & Mapping: ArcGIS Desktop
 Introduction to GIS & Mapping: ArcGIS Desktop Your task in this exercise is to determine the best place to build a mixed use facility in Hudson County, NJ. In order to revitalize the community and take
SAS Report Viewer 8.3 Documentation
 SAS Report Viewer 8.3 Documentation About SAS Report Viewer Introduction to SAS Report Viewer SAS Report Viewer (the report viewer) enables users who are not report designers to view a report using a web
CreateASite Beginner s Guide
 Contents Getting Started... 3 Access the CreateASite Control Panel... 3 Select a Category/Subcategory... 4 Select a Template... 6 Change the Site Template... 10 Change Colours... 12 Change Fonts... 13
OnCOR Silverlight Viewer Guide
 Getting Around There are many ways to move around the map! The simplest option is to use your mouse in the map area. If you hold the left button down, then click and drag, you can pan the map to a new
Fusion. CBR Fusion MLS Level 1 Core Functions. Class Handout
 Fusion 1 CBR Fusion MLS Level 1 Core Functions Class Handout GETTING STARTED IN FUSION Logging On and Off To log on to Fusion MLS: 1. Type your user name in the User ID box. 2. Type your password in the
From data source to data view: A practical guide to uploading spatial data sets into MapX
 From data source to data view: A practical guide to uploading spatial data sets into MapX Thomas Piller UNEP/GRID Geneva I Table of contents 1. Adding a new data source to MapX... 1 1.1 Method 1: upload
Using Spatial Data in a Desktop GIS; QGIS 2.8 Practical 2
 Using Spatial Data in a Desktop GIS; QGIS 2.8 Practical 2 Practical 2 Learning objectives: To work with a vector base map within a GIS and overlay point data. To practise using Ordnance Survey mapping
MAKING MAPS WITH GOOGLE FUSION TABLES. (Data for this tutorial at
 MAKING MAPS WITH GOOGLE FUSION TABLES (Data for this tutorial at www.peteraldhous.com/data) Thanks to Google Fusion Tables, creating maps from data and embedding them on a web page is now easy. We re going
MAP ASPEN Training Manual. Navigate back to City of Aspen Home, GIS Home, Map Aspen Home or the Data Catalog from any page in the site.
 Home Page Features: Top Navigation Bar MAP ASPEN Training Manual Navigate back to City of Aspen Home, GIS Home, Map Aspen Home or the Data Catalog from any page in the site. Search Bar Search for all content
Intro to GIS (requirements: basic Windows computer skills and a flash drive)
") Introduction to GIS Intro to GIS (requirements: basic Windows computer skills and a flash drive) Part 1. What is GIS. 1. System: hardware (computers, devices), software (proprietary or free), people. 2.
Introduction to GIS Intro to GIS (requirements: basic Windows computer skills and a flash drive) Part 1. What is GIS. 1. System: hardware (computers, devices), software (proprietary or free), people. 2.
First, you'll download the data and familiarize yourself with the information it contains.
 Map Easter Rising Fatalities ArcGIS Online Before you create a web app or story map, you'll first create a map of fatalities that occurred during the 1916 Easter Rising in Dublin. To do so, you'll first
Juniata County, Pennsylvania
 GIS Parcel Viewer Web Mapping Application Functional Documentation June 21, 2017 Juniata County, Pennsylvania Presented by www.worldviewsolutions.com (804) 767-1870 (phone) (804) 545-0792 (fax) 115 South
ENERGY WEB ATLAS WEB APPLICATION USER GUIDE. ENERGY WEB ATLAS All materials subject to strictly enforced copyright laws Gulf Publishing Company 1
 ENERGY WEB ATLAS WEB APPLICATION USER GUIDE ENERGY WEB ATLAS All materials subject to strictly enforced copyright laws Gulf Publishing Company 1 WELCOME Welcome to the Energy Web Atlas User Guide. Choose
National Monuments Service: Wreck Database Viewer
 National Monuments Service: Wreck Database Viewer Introduction HELP DOCUMENT Welcome to the Wreck Viewer map / search facility that provides access to the records of wrecks held by the National Monuments
Map Viewer User Guide
 Map Viewer User Guide Sea Level Scenario Sketch Planning Tool Version 2, 2017 University of Florida GeoPlan Center Introduction The purpose of this document is to guide users on how to use the Sea Level
1. Download Federal Electoral Districts and add to map document
 1. Download Federal Electoral Districts and add to map document Federal Electoral Districts (FEDs) are the geographic areas for which one Member of Parliament is elected. It is downloaded as a shapefile
Esri Story Maps let you combine authoritative maps with narrative text, images, and multimedia
 Geoinformation and Sectoral Statistics Section (GiSS) Story Maps Esri Story Maps let you combine authoritative maps with narrative text, images, and multimedia content. They make it easy to harness the
Chapter 7. A Quick Tour of ArcGIS Pro
 Chapter 7 A Quick Tour of ArcGIS Pro Skills you will learn: This tutorial is intended to get you going using ArcGIS Pro, a new desktop application that is part of ArcGIS Desktop. A separate tutorial gives
Map Preparation. Using QGIS
 Map Preparation Using QGIS Tutorial ID: IGET_GIS_006 This tutorial has been developed by BVIEER as part of the IGET web portal intended to provide easy access to geospatial education. This tutorial is
Chapter 7. Joining Maps to Other Datasets in QGIS
 Chapter 7 Joining Maps to Other Datasets in QGIS Skills you will learn: How to join a map layer to a non-map layer in preparation for analysis, based on a common joining field shared by the two tables.
Add to the ArcMap layout the Census dataset which are located in your Census folder.
 Building Your Map To begin building your map, open ArcMap. Add to the ArcMap layout the Census dataset which are located in your Census folder. Right Click on the Labour_Occupation_Education shapefile
Introduction to ArcGIS Online and Story Maps
 Introduction to ArcGIS Online and Story Maps Presented by the University of Connecticut s Center for Land Use Education and Research (CLEAR) CLEAR 1 Welcome! Instructor Introductions Course logistics Student
You'll begin your map by signing in and navigating to your area of interest: Houston, Texas.
 Geoinformation and Sectoral Statistics Section (GiSS) Create a Webmap In this lesson, you'll create a map that shows hurricane evacuation routes in Houston, Texas. First, you'll begin a new map in ArcGIS
Introduction to Google Earth Tutorial Haiti. 3/15/2011. Tufts GIS Center. Data Exploration
 Introduction to Google Earth Tutorial Haiti. 3/15/2011. Tufts GIS Center. Data Exploration 1. Open Google Earth 2. On the left you will see a navigation pane with 3 sections: Search, Places and Layers.
BIO8014 GIS & Remote Sensing Practical Series. Practical 1: Introduction to ArcGIS Desktop
 BIO8014 GIS & Remote Sensing Practical Series Practical 1: Introduction to ArcGIS Desktop 0. Introduction There are various activities associated with the term GIS, these include visualisation, manipulation
Introduction to QGIS: Instructor s Notes
 2016 Introduction to QGIS: Instructor s Notes Created by: MARK DE BLOIS, CEO / FOUNDER, UPANDE LIMITED WITH SUPPORT FROM THE WORLD BANK AND THE UK DEPARTMENT FOR INTERNATIONAL DEVELOPMENT (DFID) Module
Numbers Basics Website:
 Website: http://etc.usf.edu/te/ Numbers is Apple's new spreadsheet application. It is installed as part of the iwork suite, which also includes the word processing program Pages and the presentation program
How to digitize site (counting unit) boundaries
 boundaries") How to digitize site (counting unit) boundaries Drawing site boundaries is an easy way to standardise site coverage and help counters monitor the correct area and route. Digitising site boundaries allows
How to digitize site (counting unit) boundaries Drawing site boundaries is an easy way to standardise site coverage and help counters monitor the correct area and route. Digitising site boundaries allows
User Guide To CRITFC s Interactive Mappers
 User Guide To CRITFC s Interactive Mappers CRITFC is using ESRI products to build online interactive mapping applications for the display of general spatial and tabular data or for specific projects. The
Development Authority of the North Country (DANC) Internet Mapping Application Instructions Public Viewer 1. Purpose. 2. Logging-in. 3.
 Internet Mapping Application Instructions Public Viewer 1. Purpose. 2. Logging-in. 3.") Development Authority of the North Country (DANC) Internet Mapping Application Instructions Public Viewer 1. Purpose The purpose of this document is to outline basic functionality of the DANC Internet
Development Authority of the North Country (DANC) Internet Mapping Application Instructions Public Viewer 1. Purpose The purpose of this document is to outline basic functionality of the DANC Internet
ArcMap Online Tutorial Sarah Pierce How to map in ArcMap Online using the Fresh Prince of Bel Air as an example
 Fall GARP ArcMap Online Tutorial Sarah Pierce How to map in ArcMap Online using the Fresh Prince of Bel Air as an example Westfield State University Let s say you ve never used ArcGIS before and your professor
_Tutorials. Arcmap. Linking additional files outside from Geodata
 _Tutorials Arcmap Linking additional files outside from Geodata 2017 Sourcing the Data (Option 1): Extracting Data from Auckland Council GIS P1 First you want to get onto the Auckland Council GIS website
University of Pittsburgh Communications Services. Basic Training Manual Drupal 7
 University of Pittsburgh Communications Services Basic Training Manual www.shrs.pitt.edu Drupal 7 Table of Contents Users... 3 Log In... 3 Log Out... 3 What is a Content Management System?... 4 What are
TRAINING GUIDE. ArcGIS Online and Lucity
 TRAINING GUIDE ArcGIS Online and Lucity ArcGIS Online and Lucity This covers some basic functionality we feel you will need to be successful with Lucity with ArcGIS Online or Portal for ArcGIS Enterprise.
August 12. Tips for Gmail. Tips to save time and increase your productivity. Gmail Training
 Tips for Gmail August 12 2014 Gmail Tips to save time and increase your productivity Tips for Gmail Gmail Learn tips to save time, increase your productivity, and manage your email efficiently. Page 2
NorWeST ArcGIS Online Map Help Document
 Overview of the Online Map NorWeST ArcGIS Online Map Help Document Sharon (Parkes) Payne November 1, 2017 There are tabs available along the left under the map name and tools in the upper left-hand corner
Frequently Asked Questions
 ArcGIS Online Map This map will support Forest Stewards, partner organizations, and contractors in carrying out the mission of the Green Seattle Partnership (GSP). Maps help communicate about work areas
New Mexico Watch: User Guide
 New Mexico Watch: User Guide The New Mexico Watch (nmwatch.org) interactive website distributes maps, data, and related information of natural disasters within New Mexico. This application is developed
IntraMaps End User Manual
 IntraMaps End User Manual For IntraMaps Version 8 Date: 6 th July 2014 Contents Introduction... 4 What is IntraMaps?... 4 Application... 5 Main Toolbar... 6 View... 7 Original View:... 7 Pan:... 7 Zoom
Map Viewer User Guide. January 2018
 January 2018 Revision History Map Viewer 3.0.1 Revision Date Author / Reviewer Description of Changes 1 April 6, 2017 RWE Addition of Known Issues, format changes. 2 April 11, 2017 RWE Revision for PROD
Introduction to QGIS: Student Workbook
 2016 Introduction to QGIS: Student Workbook Created by: MARK DE BLOIS, CEO / FOUNDER, UPANDE LIMITED WITH SUPPORT FROM THE WORLD BANK AND THE UK DEPARTMENT FOR INTERNATIONAL DEVELOPMENT (DFID) Module 3:
The Preparing for Success Online Mapping Tool
 The Preparing for Success Online Mapping Tool Baker Polito Administration The Executive Office of Housing and Economic Development and MassGIS Questions & Comments? Please contact MassWorks@state.ma.us
Tutorial for Lane County Mapping Applications
 Tutorial for Lane County Mapping Applications Contents Overview... 2 Tools... 2 Navigation Tools... 3 Display Tools... 5 Information Tools... 6 Sharing Tools... 7 Common Tasks... 9 Identify or Show Data
Exercise 1: An Overview of ArcMap and ArcCatalog
 Exercise 1: An Overview of ArcMap and ArcCatalog Introduction: ArcGIS is an integrated collection of GIS software products for building a complete GIS. ArcGIS enables users to deploy GIS functionality
Chapter 1 : Getting Started with Integrity... Chapter 2 : Interface Layout... Chapter 3 : Navigation... Chapter 4 : Printing...
 .0 User s Manual Table of Contents Chapter : Getting Started with Integrity... Chapter : Interface Layout... Chapter : Navigation... Chapter : Printing... Chapter : Quick Search and Results Pane... Results
Basic Tasks in ArcGIS 10.3.x
 Basic Tasks in ArcGIS 10.3.x This guide provides instructions for performing a few basic tasks in ArcGIS 10.3.1, such as adding data to a map document, viewing and changing coordinate system information,
GEOG 487 Lesson 4: Step-by-Step Activity
 GEOG 487 Lesson 4: Step-by-Step Activity Part I: Visually Explore Trends In Part I, we will explore several tools and technique to make it easier to visually interpret patterns in your data using ArcGIS.
Selecting Attributes and Location in QGIS Desktop
 Chapter 7 Selecting Attributes and Location in QGIS Desktop Summary: This tutorial covers selecting features in QGIS. If you are unfamiliar with the basics of the QGIS user interface, please read the tutorial
MicroStrategy Academic Program
 MicroStrategy Academic Program Creating a center of excellence for enterprise analytics and mobility. GEOSPATIAL ANALYTICS: HOW TO VISUALIZE GEOSPATIAL DATA ON MAPS AND CUSTOM SHAPE FILES APPROXIMATE TIME
Biodiversity GIS (BGIS) Internet Mapping User Guide
 Internet Mapping User Guide") Biodiversity GIS (BGIS) Internet Mapping User Guide http://bgis.sanbi.org Contents 1 Basic Introduction to BGIS Website (http://bgis.sanbi.org)... 6 1.1 LUDS... 6 1.2 Projects... 6 1.3 Services... 6 1.4
Biodiversity GIS (BGIS) Internet Mapping User Guide http://bgis.sanbi.org Contents 1 Basic Introduction to BGIS Website (http://bgis.sanbi.org)... 6 1.1 LUDS... 6 1.2 Projects... 6 1.3 Services... 6 1.4