PEAKS Studio 5 User s Manual
|
|
|
- Randolf Riley
- 6 years ago
- Views:
Transcription
1
2 BIOINFORMATICS SOLUTIONS INC PEAKS Studio 5 User s Manual Bioinformatics Solutions Inc. 470 Weber St. N. Suite 204 Waterloo, Ontario, Canada N2L 6J2 Phone Fax Please contact BSI for questions or suggestions for improvement.
3 1. Introduction to PEAKS Main Features New Features in PEAKS Workflow Guidelines for Using this Manual Scope Service and Support Getting Started with PEAKS Package Contents System Requirements Installation for Windows Users Registering PEAKS Set up PEAKS Preferences Set up PEAKS Configuration Quick Walkthrough Create a Sample Database Create a Project Perform Data Refinement Run De novo Sequencing Run Protein Identification Run PTM Finder Run an inchorus Search Perform a SPIDER Search Load data Data Format Data Conversion Thermo Data Agilent Data Bruker Data Shimadzu Data Applied Biosystems Data Varian Data Waters/Micromass (MassLynx) Data ABI 4700 or 4800 Data Load a New File Create a New Project Open a Project Changing the Location of Saved Projects Orienting Yourself Project View Panel Properties Panel Raw Spectrum View Data refinement Run Data Refine
4 5.2 Data Refinement Parameters Merging Scans Precursor Charge Correction Filtering MS/MS Scans Preprocessing MS/MS Scans Data Preprocessing Results De novo Sequencing Setting up Auto De novo Sequencing Parameters Mass Options Enzyme Options PTM Options General Options De novo Sequencing Results Peptide Candidates Frame Ion Table Frame Spectrum View Frame Spectrum Alignment Frame Survey Scan Error Map Database Search Setting up Protein Identification Parameters Mass Options Enzyme Options General Options PTM Options Database Options Advanced Options Protein Identification Results Peptide View Protein View Chart View SPIDER Search Setting up SPIDER Parameters Query Options General Options PTM Options Filter Options De novo Options Database Options SPIDER Results View PTM Finder Setting up PTM Finder Parameters PTM Finder Results View inchorus Meta Search Setting up inchorus Parameters Importing Existing Results
5 10.2 inchorus Results View De novo, Peptide and Protein Views Chart View Filtering Your Results Setting Filter Parameters Possible Filters/ Selected Filters/ Edit Filter Filter Options Parameter Options Complex Analysis Creating a project for complex system Integrating data analysis Exporting Data/Reports and Printing Export Data in.mzxml or.mgf Export Peptide Results in PepXML Format Export Results in Excel Format Print Tables and Graphs for Publication De novo Image Files Protein ID Image Files inchorus Image Files Compare Image Files Advanced Configuration and Environment Preferences PEAKS Environment Preferences General Preferences Instrument Preferences Search Engine Preferences Ion Editor Preferences PEAKS Configuration Enzyme Configuration PTM Configuration Database Configuration Instrument Configuration Parameter Configuration PEAKS Quantification Setting up PEAKS Q Parameters D View itraq Walkthrough ) Creating a Project ) Running data refinement ) Running PEAKS Search ) Running Quantification SILAC Walkthrough ) Creating a project ) Running Protein Identification ) Running Protein Identification ) Running Quantification Label Free Quantification (Available in future)
6 16. References De novo SPIDER Quantification Appendix Terminology and Abbreviations Glossary Toolbars Main Window Toolbar Project View Main Processing Window Toolbar Mass Calculator Advanced Options About Bioinformatics Solutions Inc PEAKS Software License
7 Chapter 1 1. Introduction to PEAKS Main Features PEAKS is an innovative software system designed to derive amino acid sequences and identify proteins using tandem mass spectrometry data from all major mass spectrometry vendors. PEAKS incorporates de novo sequencing results into the database searching process for peptide/protein identification. It does this by generating sequence tags which are used in conjunction with fragment ion mass matching to speed up the search, remove false positive matches, and find peptides with interesting sequence variations or modifications that would prevent them from being otherwise identified. Our meta protein search tool, inchorus allows users to use multiple search engines (PEAKS, Sequest, Mascot, X!Tandem and OMSSA) to expand sequence coverage and increase confidence. Another tool, SPIDER, is used to reconstruct the correct sequence using the de novo sequence and a homologous peptide. 1.2 New Features in PEAKS 5 We have many new features in PEAKS 5 which will be explained throughout this manual. PEAKS 5 is now capable of handling very large data sets. Our protein identification is more sensitive and generates less false positives. PEAKS 5 also has improved identification of PTMs with our new PTM finder. BSI, makers of PEAKS, has also created a quantification module which will allow users to automatically quantify proteins from experiments using both label and label-free techniques. Results generated from PEAKS Q have high accuracy and can be performed over a wide dynamic range. Please note that the label-free quantification protocol is not included in this first release. PEAKS 5 uses project based data management which allows users to process simultaneous runs and easily compare/contrast samples within one project. 6
8 1.3 Workflow 1.4 Guidelines for Using this Manual This user s manual is intended to help you get started with PEAKS 5. It will describe its functionalities, show how to customize PEAKS to your applications, provide a task based reference, and troubleshooting. We recommend reading the walkthrough in Chapter 3, using the sample data provided. 1.5 Scope PEAKS users are assumed to be familiar with computer usage and the operating system environment. As such, it is beyond the scope of this manual to instruct the user on the use of windows, dialogue boxes, menus, file storage etc. Please refer to the operating system s manual or computer help books for such information. Similarly, PEAKS users are expected to be familiar with mass spectrometry, standard operating practices and data. 1.6 Service and Support In addition to reading this manual, we recommend that you take a look at our training videos that explain the main features of PEAKS in detail ( Please send technical questions to support@bioinfor.com. We also encourage our users to provide us with any suggestions or comments as we are always improving PEAKS to meet the needs of the scientific community ( 7
9 Chapter 2 2. Getting Started with PEAKS 5 This section of the manual will guide you through the installation and configuration of PEAKS Package Contents The PEAKS 5 package contains: This manual (hardcopy and/or electronic version) PEAKS 5 software 2.2 System Requirements PEAKS 5 will run on most platforms with the following requirements: Processor: Equivalent or superior processing power to a Pentium III at 800 MHz. Memory: 1 GB minimum, (1.5GB is recommended) for PEAKS Studio / PEAKS Client. 500MB is recommended for PEAKS Viewer. Operating System: PEAKS runs on Windows Vista, XP and Linux. Adjusting the Amount of Memory that PEAKS Uses The PEAKS Studio directory (e.g., C:/PEAKS Studio 5.0) contains a file called StartPEAKSStudio.lax which contains a line which looks like lax.nl.java.option.java.heap.size.max=1200m. The 1200m tells the Java VM (which runs PEAKS) to run with 1200MB of memory. With some trial and error (the Java VM will fail to run if the setting is too high) you can determine the highest optimal value for your own computer. 2.3 Installation for Windows Users Note: If you already have an older version of PEAKS installed on your system, please uninstall it before proceeding. 1. Close all programs that are currently running. 2. Insert the PEAKS 5 disc into the CD-ROM drive. If loading PEAKS via the download link, skip to step 4, after downloading and running the file. 8

10 3. Auto-run should automatically load the installation software. If it does not, find the CD-ROM drive and open it to access the disc. Click on the PEAKS_Studio_Installation.exe. 4. A menu screen will appear. Select the top item PEAKS Installer. The installation utility will begin the install. Wait while it does so. When the PEAKS 5 installation dialogue appears, click the Next button. 5. Basic system requirements will be presented. Please note that while the minimum requirement is 1 G of RAM, the preferred configuration is 1.5 G of RAM. Click Next. 6. Read the license agreement. If you agree with it, change the radio button at the bottom to select I accept the terms of the License Agreement and click Next. 7. Choose the folder/directory in which you would like to install PEAKS. The default location is simply C:\PEAKS 5. To change this location press the Choose button to browse your system and make a selection, or type a folder name in the textbox. Click Next. 8. Choose where you would like to place icons for PEAKS 5. The default will put these icons in the programs section of your start menu. A common user preference is on the desktop. Click Next. 9

11 9. Review the choices you have made. You can click Previous if you would like to make any changes or click Next if those choices are correct. 10. PEAKS 5 will now install on your system. You may cancel at any time by pressing the Cancel button in the lower left corner. 11. When the installation is complete, click Done. The PEAKS 5 menu screen should still be open. You may view movies and materials from here. To access this menu at a future date, simply insert the disc in your CD-ROM drive. 2.4 Registering PEAKS The first time PEAKS is run, you will be told that the product is not registered. Press the OK button and a dialogue will appear. Follow the onscreen instructions depending on your requirements. For users entitled to a perpetual license, select the Request License file and click Next. In the field that appears, enter the registration key that came with the product whether it is a key for the full version. You must also enter your name, the name of your organization. An automated servant from BSI will generate the license file (license.lcs) and it to the provided account from the License Wizard. Save the license file to a local directory and then continue with the License Wizard to import the license file into the PEAKS folder. A dialogue box will then read Registration Successful. If you are not connected to the internet, onscreen instructions will offer assistance for offline registration. Re-registering PEAKS may be necessary if your license has expired or if you wish to update the license. You will need to obtain a new registration key from BSI. Once you have obtained this new key, select About PEAKS Studio from the Help menu. The About BSI PEAKS Studio 10

12 dialogue box will appear. Press the License Wizard button to continue. Follow the on-screen instructions. 2.5 Set up PEAKS Preferences Before running your data, you must set up search engine preferences. For an explanation on how to do this, see page 93. It is possible to run your data through PEAKS without changing the other preferences as they have default settings. For more information on changing these default settings see page Set up PEAKS Configuration Before running your data, you must configure your databases. For instructions on how to do this, see page 99. It is possible to run your data through PEAKS without configuring any other parameters as they have default settings. For more information on changing these default settings see page

13 Chapter 3 3. Quick Walkthrough This section of the manual will walk you through most of the basic functionality of PEAKS 5. After completing this section you will see how easy it is to load, view a data file, perform data refinement, perform de novo sequencing, and database search protein identification. Please note that version upgrades of PEAKS as well as upgrades to the databases may result in small changes to the results screenshots in this chapter. 3.1 Create a Sample Database Before running the walkthrough data, you need to set up a database. So that this can be a quick process, we have provided you with a sample fasta database called SampleDB.fasta in your PEAKS program folder (C:\PEAKS Studio 5.0\Data). Click on the configuration toolbar icon or select Configuration from the Tools menu. Select Database from the left hand side of the window. Under Database Details enter the following information: You do not need to change any of the other information listed. Click the Add/Update button and then click OK. 3.2 Create a Project This will be a rather simple project as it will only contain one sample, however the same process will be used for projects with multiple samples and files. Click on the Create new project button or select New Project from the File menu. The following window will appear:


14 Enter a name for your project. Click the Next button. By default the first sample will be named Sample 1. Click the Add a file for this sample button. Select the OrbiSample. mzxml file from your PEAKS program folder. (For example C:\PEAKS Studio 5.0\Data ) 13


15 Click Next. We will leave the instrument vendor as General and select the instrument to be FT-trap. Click Next. You should now see the file in the Project View panel: The Project View panel which is shown in the upper left hand corner displays the organization of a particular project. Use the + and - boxes to expand and collapse the project in order to access the data file in the Project View. Make sure that you select this data file when choosing data to be analyzed. 14

16 PEAKS reads and tracks information about the experiment and data for use in the analysis and for future reference. Once the data file has loaded, click on the Properties tab in the bottom left hand corner: You should see the following in the Main Processing Window : 15

17 The information that is displayed by default pertains to the precursor scan. To the left of the window is the Total Ion Current (TIC). The graph in the upper right corner displays a survey scan with its corresponding tandem scans below. Click on the MS/MS tab to see the graphs that were generated from the tandem scan. For more information on the functions and tools found in these windows, see page Perform Data Refinement 1) Click the Data Refine toolbar icon Or Select Data Refine from the Tools menu. 2) Enter the settings as shown: For more details on setting up the parameters for data refinement refer to page 43. Here we will use a quality filter to remove data with a quality value lower than As all of the data in this data set is of good quality data, we will not remove any data using this filter. After running data refine, there will be new information listed in the Properties file. 16
 Enter the settings as shown: Note that we are not going to preprocess this data on the fly as we have already preprocessed the data during the data refinement stage.")
18 3.4 Run De novo Sequencing 1) Click the De novo sequencing toolbar icon Or Select De novo from the Tools menu. 2) Enter the settings as shown: Note that we are not going to preprocess this data on the fly as we have already preprocessed the data during the data refinement stage. We will also choose to report only one peptide per spectrum for simplicity s sake. You can save the parameters that you used for future reference by clicking on the Save Parameter button. For more information on setting up de novo parameters see page 44. Click OK to commence analysis. For this sample it takes just over a minute. The PEAKS auto de novo algorithm derives sequence candidates for each of the six spectra in our example data file. Take a look at spectra ID 1. Notice that the number in square brackets refers to the modification which in this case is iodoacetic acid derivative. After de novo sequencing is complete, the following will appear in the Main Processing Window : 17
 and Average Local Confidence (ALC) confidence scores are shown.")
19 At the top of the screen you will see the peptide candidates in the Peptide Candidates Frame. The peptide candidates are sorted by ID. Right next to the proposed sequence, the auto de novo Total Local Confidence (TLC) and Average Local Confidence (ALC) confidence scores are shown. You will also see the m/z ratio, mass, retention time etc. listed for each peptide sequence. For information including color coding, see page 47. Below the Peptide Candidates Frame is the Ion Table Frame. Each amino acid is colorcoded by confidence level (see page 47) with the masses for matched a, b and c ions listed in blue and for the matched x, y and z ions listed in red. Below the Ion Table Frame is the Spectrum View Frame. This frame is useful for seeing the strength of the ms/ms peaks that PEAKS 5 has set as ions. Here the alignment of the assigned b (blue) and y (red) ions with the entire spectrum corresponding to the selected peptide can be observed. For more information on the Spectrum View Frame, see page
 Click the PEAKS Search toolbar icon Or Select PEAKS Search from the Tools menu.")
20 At the bottom of the page is the Error Map, which displays the confidence that is assigned to each ion. The most confident results lie on the centerline. For more information on the Error Map, see page Run Protein Identification 1) Click the PEAKS Search toolbar icon Or Select PEAKS Search from the Tools menu. 2) Enter the settings as shown: 19

21 Parameters can be saved and used for future reference by clicking on the Save Parameter button. For more information on setting up protein identification parameters see page 51. Click OK to commence analysis. After PEAKS Protein ID is completed, the click on the De novo view tab. Recall that PEAKS found de novo sequencing results for all six spectra, however only four spectra (ID 1, 3, 4, 5) had a corresponding proteins found in the database. Now click on the Peptide View tab. The following will appear in the Main processing window : The Peptide ID List shows each spectrum for which PEAKS found a matching peptide. Since there may be more than one spectrum that matches a peptide, these spectra would be listed together under a Hit node. Use the + and - boxes to expand and collapse the node to see the spectra that are listed together. With this dataset, spectra 4 and 5 can both be found under one hit. 20

22 The Peptide Alignment Panel contains an Ion Table, Spectrum View Pane and Error Map as was displayed in the De novo View seen above. For more information about these sections please refer to page 55. Click on the Protein View tab on the upper left hand side. The following window will appear: PEAKS 5 presents a list of proteins, ranked in descending order from highest score on downward. Clicking on any protein will display the peptides matched to that protein in the bottom pane. In this case is Serotransferrin precursor from bovine. This protein has two matching peptides, which you can see in the Peptide List. The entire sequence of the protein is shown and the matched parts are highlighted in blue. In this case the total matched part accounts for 3.69% of the protein. Note that PEAKS 5 groups together homologous proteins which have the same peptide hits. Click on the Chart view tab to see charts of the protein/peptide score distribution, the false positive rate and the decoy database search results. The following window will appear: 21

23 The graphs display protein and peptide scores as well as information on the false positive rate which is generated from the decoy database search. Please see page 61 for more information about the chart view. 3.6 Run PTM Finder Using the PTM finder, you can identify any additional PTMs and increase the coverage of the proteins that we have found. It is important to note that the PTM Finder can only be applied to a Protein ID results file. As it is very time consuming to run Protein ID with many PTMs, this allows searching for more PTMs in less time. Make sure that you click on a Protein ID result before performing a PTM Finder search. 1) Click the PTM Finder toolbar icon Or Select PTM Finder from the Tools menu. 2) Enter the settings as shown: 22

24 Saving the parameters for future reference is achieved by clicking on the Save Parameter button. For more information on setting up PTM Finder parameters see page 63. Click OK to commence analysis. 23

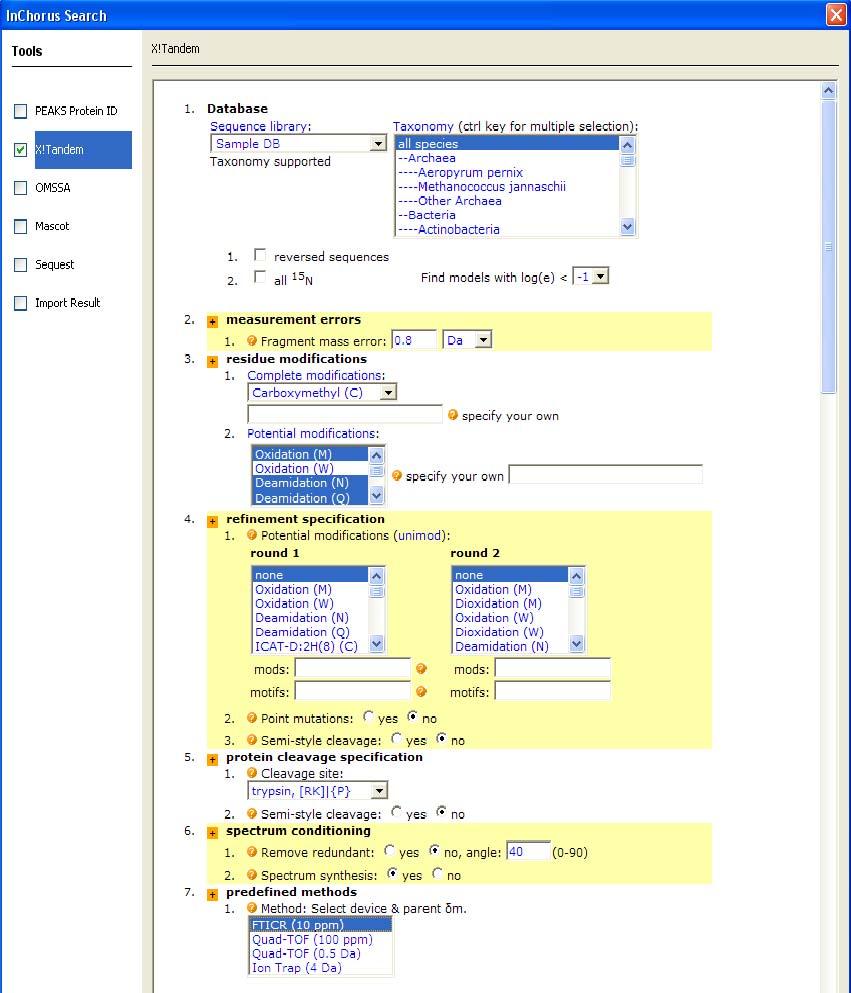
25 After the PTM Finder search is complete, the Peptide View window will appear: The results will be displayed in the same format as was seen for Protein ID. Recall that the Protein ID search identified spectra 1, 3, 4 and 5. The PTM finder search also displayed spectra 2 with the addition of deamidation on N. 3.7 Run an inchorus Search Performing the search with the same data by different search engines is useful both for finding new proteins and confirming others. You can perform and inchorus search using PEAKS Protein ID, X!Tandem, OMSSA, Mascot and Sequest. For this example we will be performing a local search using the X!Tandem and OMSSA search engines. If you have not already set up your search engine preferences, see page 93 for more instructions. 1) Click on the orbisample.mzxml file 2) Then click the inchorus Search toolbar icon Or Select inchorus Search from the Tools menu. 24

26 The inchorus search window will open. Check the PEAKS Protein ID box and select the name. Enter the following settings: Next, check the X!Tandem box and select the name. Note that you will need to use the Ctrl button to select multiple search engines. Enter the following settings: 25
27 26

28 Finally, check the OMSSA box and select the name. Enter the following settings: Click the Ok button. When the inchorus search is complete you should see the following new additions in the Project View panel: Presented here are individual reports for PEAKS, X!Tandem and OMSSA as well as an inchorus report that compares the individual reports. To see each of these reports, click on the report that you would like to see in the Project View panel. 27


29 The Peptide View results for the PEAKS Protein ID search can be seen below: The Peptide View results for the X!Tandem search can be seen below: Peptide View results for the OMSSA search can be seen below: The inchorus report contains most of the information that is seen in a PEAKS Protein ID results file (page 55). Click on the Peptide View tab: The Peptide View of an inchorus report contains the scores received by each search engine involved in the inchorus search. A indicates that the search engine did not find that a protein sequence for that particular spectrum. Notice that while PEAKS Protein ID found spectra 1-5, X!Tandem found 1, 5 and OMSSA found 1, 2, 5. Click on the Protein View tab: The Protein View of an inchorus report displays the proteins that were found and indicates by checkmarks whether the different search engines found that protein or not. In this case, the X!Tandem and OMSSA searches did not generate any extra results that PEAKS did not find but helped to confirm that the first protein is good match. Click on the Chart View tab: 28
. More information about the inchorus Protein Number Pie Chart and the inchorus Protein Number Venn Diagram can be found on page 72. 3.")
30 The top two charts, the Protein Score Distribution Chart and the Peptide Score Distribution Chart are in the same format to those that are seen in the Chart View of a PEAKS Protein ID search (page 61). More information about the inchorus Protein Number Pie Chart and the inchorus Protein Number Venn Diagram can be found on page Perform a SPIDER Search In this example, spectrum 6 has not been identified with database searching tools. In order to gain more information from our data, we will run a SPIDER search next. For more information about the SPIDER search refer to page 63. 1) Click on the OrbiSample.mzxml file 2) Next, click the SPIDER Search toolbar icon Or Select SPIDER Search from the Tools menu. 3) Enter the settings as shown: 29


31 Parameters can be saved for future reference by clicking on the Save Parameter button. For more information on setting up SPIDER Search parameters see page 68. Click OK to commence analysis. After the SPIDER search has completed, the Peptide View window will appear. The format is identical to what was seen in the results of a Protein ID search: 30

32 Note that all spectra can now be identified by the SPIDER search. Spectrum 6 is well identified. Clicking on the Peptide details tab will display the protein with its matched peptides in red. SPIDER will also display a reconstructed sequence. See page 66 for more information. 31
33 Chapter 4 4. Load data 4.1 Data Format Before loading data files into PEAKS, you must make sure that the data is in an accessible format. PEAKS handles data files in the following formats:.pkl: The file format associated with MassLynx software..dta: The file format associated with SEQUEST software.mgf: The file format associated with Mascot software..anz the zip compressed XML based file format associated with PEAKS 4.5.XML format files using the mzxml schema.xml format files using the mzdata schema.raw files from Thermo Electron instruments.wiff files from ABI/Sciex QSTAR and QTRAP instruments.raw files from Waters QTOF instruments.baf,.yep and folders of.fid files from Bruker instruments.d files from Agilent QTOF instruments.dat files created by BSI s ABI converter software PEAKS 5 project 4.2 Data Conversion It is best to import RAW data directly, so that PEAKS can access the complete, unprocessed experimental data including the MS survey scan and retention time information. This will ensure that the PEAKS analysis does not suffer from poor preprocessing.
34 In order to load RAW data from different vendors, PEAKS may require third-party software to be installed. Please consult the following instructions for third-party software requirements. Thermo Data RAW data from Thermo Electron mass spectrometers can be loaded, provided that the XCalibur software is installed on the same computer as PEAKS 5. Agilent Data PEAKS 5 can load native data from Agilent QTOF, provided that the MassHunter software is installed on the same computer. Bruker Data PEAKS 5 can load data from Bruker mass spectrometers provided that the CompassXport software is installed on the same computer. If loading.fid files, which are stored in a network of folders, select the top level folder to load them all at once. Shimadzu Data Shimadzu mass spectrometer data can be loaded, provided that the Shimadzu software is installed on the same computer as PEAKS 5. Applied Biosystems Data WIFF data from Applied Biosystems/Sciex QSTAR (or QTRAP) mass spectrometers can be loaded, provided that the Analyst QS (Analyst for QTRAP) software and the MSX plug-in are installed on the same computer as PEAKS 5. The MSX tool is produced and sold by Infochromics Ltd., and is available (at cost) from Bioinformatics Solutions Inc. Please contact a BSI sales representative to obtain an evaluation or full license. Varian Data A conversion tool is embedded into Varian s data acquisition software which allows the conversion of Varian raw data into.pkl files which can be immediately read by PEAKS. The.trans type data (raw) is converted in Varian programs by clicking "File", "Save As" and selecting the.pkl file format or by clicking "File", right clicking "Export" and selecting ".pkl". If you are viewing a chromatogram with the Varian software, all the spectra data in the viewed chromatogram is converted to the.pkl format. Likewise, if you are viewing a single spectrum and choose to convert the data, only the viewed spectra will be converted. Waters/Micromass (MassLynx) Data PEAKS 5 can import RAW data from Waters/MicroMass QTOF instruments using a utility called wolf.exe (originally created as part of the Sashimi Project) to access MassLynx libraries and convert the data. PEAKS provides a version of wolf.exe compatible with MassLynx 4.1. If you need a different version of wolf.exe, please visit: Additionally, you must make sure that the following MassLynx libraries are installed on the same computer as PEAKS and wolf.exe: 33
35 DACServer.dll Genutil.dll MetaGD32.dll raw.dll securityaccess.dll securitysettings.dll securitysignature.dll ABI 4700 or 4800 Data BSI has created a converter to extract the data from an ABI-Oracle database. If you require this separate, free tool, contact your sales representative. Once installed, you can start up the ABI 4700 Data Extractor from the Start menu. System Requirements This extractor can be installed on the same machine as ABI 4700 Explorer and the Oracle database (we will call this machine the 4700 SERVER in the following instructions) or another machine that has direct network access (no firewall or proxy required) to the 4700 SERVER. Windows 2000 or Windows XP is recommended for use with this tool. Configuration Before using the ABI 4700 Data Extractor, it must be configured. To do so, choose Settings from the File menu. Configuration requires the following: 4700 SERVER Name or IP Address: input localhost if the Extractor is running on the 4700 SERVER (this is the default value), otherwise enter the IP address of the 4700 SERVER. The socket used by the 4700 SERVER: this is the port that the Oracle database listens to (the default is 1521). Username to access the Oracle database: most likely we do not need to change this (the default is tsquared ). Password to access the Oracle database: mostly likely you do not need to change this one either. Data extraction procedure 1. Load Spot Set List from the database: (Do it via menu File Load Spot Set List). The extractor will export the peak list of a spot set into a PKL file. 2. Open a Spot Set: (menu File Open Spot Set) Spot Set Chooser will help the user to choose a spot set. After selecting a spot set, click 'OK' to open it. The job run information of a spot set will be shown. 3. Select a job run: There is a button to select before each job run. Only the MS/MS job run can be selected for export, as the precursor information is needed. Select a job run and click 'Convert' to do the extraction. 34

36 4. Choose a filename to save: After clicking the 'Convert' button, the user needs to input a file name and the peak lists of the selected job run will be exported. 4.3 Load a New File After making sure that you have the appropriate third party software, use the instructions below to load the data files. 1) Select New File from the file menu or use the blue file menu icon. First select the mass spectrometry vendor from the drop down menu or keep the default General setting. 2) Select your instrument from the drop down menu. If you selected the General setting in the option above, the instrument names will also be general, however if you selected a particular vendor, the vendor specific instrument names will be displayed. If you do not see the instrument that you used, you click on the Add Instrument button to create a new instrument. 3) Finally, browse your computer to locate the file to be processed and click open. The file will now begin loading. 35

37 4.4 Create a New Project 1) To create a new project, select New Project from the file menu or using the New project icon 2) Create a name for your project and click browse to select the location of the data for that project. You can use the notes and description box, to remind yourself of information specific to the project. on the toolbar. The Project Properties window will open. 3) The Sample Properties window will open. Give your sample a name. You can now select file/s that pertains to this sample using the Add a file for this sample. To remove files or clear the list, you can use the Remove from list and Clear list buttons respectively. You may also leave notes about the sample for reference. 36
 Select the Next button once all relevant files are added to each sample. 6) The Instrument Details window will open. Select the instrument that was used to generate the experimental data.")

38 4) To add another sample or remove the current sample, use the Add another sample and Remove current sample buttons, respectively. 5) Select the Next button once all relevant files are added to each sample. 6) The Instrument Details window will open. Select the instrument that was used to generate the experimental data. From the drop-down menu, select General for the common instrument types (example: FT-TRAP) or specify the instrument vendor and chose the vendor specific instrument type (example: LCQ Ion Trap). Hold down the Ctrl key to select additional instruments. Notice that when you select the instrument type, the default parameters will be displayed in the right hand pane. Select the Add a new instrument button if your instrument is not on the list. Lastly, select whether the MS or MS/MS data has been centroided. Click the Next button. When only one instrument is selected, PEAKS starts loading data. 7) If more than two instruments are selected, the Instruments and Files window will open next. The top of the window will contain a list of all files selected for the project. The lower part of the window contains the instruments selected in the Instrument Details window. 37

 Click on the finish button and the file will begin loading. 4.")
39 8) In order to indicate which instrument was used to generate each file, drag the file from the list above and drop it onto the instrument in the list below. In order to drag and drop multiple files at once, use Ctrl + Click or SHIFT + Click. Use the reset button to return the files to the list at the top of the window if you make an error. 9) Click on the finish button and the file will begin loading. 4.5 Open a Project Go to File and select Open Project or Open Recent Project can also select Close project to close a project that is open. to access stored projects. You 38


40 4.6 Changing the Location of Saved Projects Projects are saved in the location that is listed in your Preferences window. To modify your preferences, select the Preferences toolbar icon or select Preferences from the Window menu. Select General on the left hand side of the window. The default Output Directory and Project Folder locations are listed in the Default Output Directory panel. Please note that the defaults seen here may differ from your default locations depending where you downloaded PEAKS. Click on the Browse buttons to change either of these locations. You can also change the location of you projects on a project by project basis by selecting a new Project Location when setting up a database as seen below: 4.7 Orienting Yourself Project View Panel This frame appears in the upper left hand corner, displays the organization of a particular project (if applicable) or simply of a data file. Use the + and - boxes to expand and collapse the project in order to access the data file that you want to analyze. Make sure the data file to be analyzed is selected. Properties Panel PEAKS reads and tracks information about the experiment for use in the analysis and for future reference. Once the data file has loaded, click on the properties tab in the bottom left hand corner. If any information cannot be found in the file, PEAKS will prompt you to enter this information. 39
. Depending on how the file was generated there may be simply a list of spectra and not a TIC graph.")
41 Raw Spectrum View Opening the raw file in PEAKS will display the following graphs in the Main Processing Window. The MS tab is selected by default and represents the precursor scan. On the left hand side of the screen is the total ion current (TIC). Depending on how the file was generated there may be simply a list of spectra and not a TIC graph. The retention time is plotted against the vertical axis. Clicking on the TIC graph will move the red line and display the ms spectra to the right of the TIC graph that corresponds to the selected retention time. Alternatively, use the up and down arrows, found on the keyboard, to move through the TIC. If the ms2 scans is available, it will be displayed below the corresponding ms scan. To zoom either on the X or Y axes, select the 2X or 2Y buttons, respectively. To scroll in even more, click the button on the left of your mouse and drag the arrow to the side. To increase the intensity of the peaks, use slide the scroll bar on the left hand side, up and down. Selecting the 1:1 button will bring you back to the original image where the entire spectrum is visible. Scrolling over the spectrum will display the m/z ratio and the height/intensity (as a percentage of 100) of the particular peak under the spectrum view on the right hand side (see the box highlighted in red below). You can use the profile and peak buttons to switch the spectrum view from profile mode to peak mode and vice versa. 40
.")
42 The MS/MS tab gives detailed information about each tandem spectrum: Each of the spectra in the data file will be listed in the left most panel under the name of the data file. Clicking on one of the spectra will display the results that have been generated for that spectrum in the top right hand panel (as seen in the example above). Before any results files have been generated, the top panel will look like this: More information can be found about the spectra under the Info tab. You will find information about the retention time, where to find the spectra on the TIC graph, the number of peaks and the fragmentation type (if available). You will also find an overview of the results that were found for that spectrum in the results files. The largest panel displays the MS/MS and below you will find the corresponding MS spectra under the Survey tab. Information about navigating through the MS and MS/MS spectra can be found above in the section describing the MS tab. 41

43 Chapter 5 5. Data refinement Since mass spectrometry data often contains noise and redundant data, it makes sense to filter the data before analysis. This will increase the quality of the results, while saving time spent on database searching and de novo sequencing. MS/MS spectra that are mostly noise will be removed from the data. When PEAKS is connected to a PEAKS Online server, you will also save time by uploading smaller, preprocessed data. Data refinement can be done locally, before uploading to the server. 5.1 Run Data Refine To begin the refinement of data from a whole MS/MS run: 1) In the Project View Frame, select the data file(s) containing the data that you wish to refine. 2) Click the Data Refine toolbar icon Or Select Data Refine from the Tools menu. The Data refinement options window will appear: 3) Choose the data refinement tools you wish to use by clicking the yes radio button next to each one. See the information below to help you decide on proper refinement parameters.

44 5.2 Data Refinement Parameters Merging Scans In DDA mode, a mass spectrometer will often produce several tandem ms (MS/MS) scans of the same peptide. To increase the intensity of real signal peaks within these scans and to reduce the size of the whole data set, it makes sense to merge MS/MS scans of the same peptide together. To avoid improper merging (of MS/MS scans of different peptides) we make sure that the measured parent ion masses of these peptides are very close and that they have similar retention times in the LC column. The units here are m/z values in Daltons. For retention time, we use whatever units are recorded in the data file (usually minutes or seconds). Precursor Charge Correction Since a mass spectrometer measures mass-to-charge ratios, we must know the charge on a peptide before we can determine its mass. The standard method of finding the charge is to look at the spacing of the isotope ladder in the survey scan. However many Ion-Trap instruments do not have enough resolution for this. So PEAKS will look at the MS/MS data to determine if it's charge 1+, 2+ or 3+. For data where the survey scan is available, PEAKS will examine the precursor ion s isotope distribution to confirm or correct the charge assignment. Type in the boxes to set a range of charges. Only spectra that fit in this range will be considered for analysis. Filtering MS/MS Scans Scans of contaminants and electrical noise should not be included in analysis. Removing them from the data set will save time, and reduce the risk of random matches to the database. PEAKS offers an effective tool for removing these low quality MS/MS scans. Type in the boxes to set ranges of retention time and m/z ratio. Only peaks between these values will be considered for analysis. Additionally, PEAKS examines the MS/MS spectrum to determine its quality. The quality filter is based on four characteristics: signal to noise ratio over MS/MS, number of peaks after pre-processing, sum of all peak intensities and length of the longest simple sequence tag that can be generated. You can choose a threshold of quality score (a value from 0 to 1) for accepting a scan. We recommend a quality filter of Set to 0.01 to disable quality filtering. Preprocessing MS/MS Scans This section deals with deconvolution (de-isotoping), centroiding and noise filtering within the MS/MS data. Preprocessing can save hard disk space or upload time. But make sure to have the original data available in case you need to refer to it later. To see how your data is changed after data refinement, refer to the data properties window. 5.3 Data Preprocessing Results To view the result of data pre-processing, click on the MS/MS tab on the spectrum view. In following example, the spectrum (m/z = ) results from raw spectra (m/z = and m/z = 473.7). 43
 In the Project View Frame, select the data file(s) or project containing the spectra that you wish to sequence by Auto de novo.")
45 Chapter 6 6. De novo Sequencing 6.1 Setting up Auto De novo Sequencing Parameters 1) In the Project View Frame, select the data file(s) or project containing the spectra that you wish to sequence by Auto de novo. 2) Click the Automatic de novo toolbar icon Or Select Auto de novo from the Tools menu. The Auto de novo Parameters dialogue window will appear:
46 3) To change any of the following parameters, now is the time: Mass Options Parent mass error tolerance: Determine how much random and systematic experimental error on the parent/precursor ion PEAKS will allow for in its analysis. As you have previously selected your instrument, PEAKS will provide the suggested error tolerances. Type a tolerance in the textbox and choose units from the dropdown list. Using PPM allows for larger errors at larger m/z values. PEAKS will be very stringent concerning this value, so new PEAKS users should try setting this a little higher than past experience may suggest, if sensitivity is a concern. Fragment mass error tolerance: Determine how much random and systematic experimental error on the fragment/daughter ion PEAKS will allow for in its analysis. As an instrument has previously been selected, PEAKS will provide suggested error tolerances. Type a tolerance in the textbox. Again, new PEAKS users should try setting this a little higher than past experience may suggest. Enzyme Options Enzyme: Tell PEAKS what type of enzyme was used to digest the sample. Choose from a dropdown list of enzymes, or if your enzyme is not in the list, click the "New Enzyme" button. You can then input the name of the new enzyme. Digest Rules: Enter the amino acid that is found at the end of the peptide. Put set brackets {} around a residue to denote any amino acids except for those that are within the brackets. Select the Advanced button if your digest rules are more complicated. Select the radio box Select peptides that satisfy at both ends if you require that your peptide was cut by the enzyme you chose at both ends. PTM Options Selecting fixed and variable PTMs: The PTM Options list tells PEAKS what types of posttranslational modifications to include in its analysis. To view additional modifications, select the Show unimod box. If a desired PTM does not appear on the list or is different than what is listed, select the New PTM button and the PTM Editing window will open. Fill in the information pertaining to your PTM. To select a PTM as Fixed or Variable, drag the PTM into the Fixed Modification or Variable Modification box. If you drag over an incorrect PTM, simply drag it back to the PTM Options list. Max variable PTM per peptide: To reduce uncertainty, limit PEAKS' de novo sequencing 'vocabulary' by restricting the number of variable PTM found on a peptide. Specify a number by typing it into the box. To lift such restrictions, type a very large number (longer than the length of the peptide). General Options Report up to (# peptides): Set how many peptide sequences PEAKS will report from its de novo sequencing analysis. 45

47 Preprocess your data on the fly before auto de novo: PEAKS has its own built-in preprocessor for removing noise, centroiding and deconvolution. Check this box to turn preprocessing on. BSI highly recommends using PEAKS to preprocess all data, as opposed to using instrument vendor software, if the data is to be used by PEAKS. PEAKS preprocessor should not be used on data that has already been pre-processed as this will have adverse effects on the results (unless it is ion-trap data). Note: If you have already pre-processed your data in the data refinement step, you do not need to do this again. 4. After setting parameters, you can save them for future use. Click the "Save Parameters" button at the top of the window, and choose a name for future reference when prompted. Any parameters that are saved will be available in the drop-down list at the top of the window. To see what's inside, select one and the parameters boxes will be populated. 5. Press the OK button to initiate de novo sequencing. 6.2 De novo Sequencing Results Once de novo sequencing is finished, the following window will open: 46
48 Peptide Candidates Frame PEAKS displays the peptide sequence candidates at the top of the screen in the Peptide Candidates Frame. You can sort the results by clicking on any of the titles of the columns. For example, to sort the peptide sequence candidates by ID click on ID. Note that all of the peptides that have the same ID have the same mass, charge, retention time and quality score. See page 43 for more information on how the quality score is generated. The following table describes the contents of the columns in the Peptide Candidates Frame : ID A unique identifier for the MS/MS spectrum. This differs from a scan number since we may have merged several scans together. Sequence The sequence of the peptide (including modifications if present) as determined by de novo sequencing. TLC Total local confidence (the confidence that we have in the peptide sequence). It is calculated by adding the positional confidence for each amino acid in the peptide sequence. ALC Average local confidence (the confidence that we have in the peptide sequence). It is calculated by adding the positional confidence for each amino acid in the peptide sequence and dividing by the total number of amino acids. Rank The sequences for a particular spectrum (ID) as sorted by score (TLC). m/z The measured mass/charge value, in Daltons, for the peptide. Z The calculated charge value for the peptide. Mass Calculated using the measured m/z and calculated z, we use this as the experimental mass of the peptide. File The name of the file. RT Retention time (elution time) for the peptide as recorded in the scan header. Scan The scan number. Quality A value from 0 to 1 estimated from the spectrum to refer to spectrum quality. Attributes like signal to noise, total intensity, and spectrum tagging are used. Scan Mode Mode that the scan step was performed in. Frag. Mode Mode that the fragmentation step was performed in. 47

 are represented by color coding.")
49 The columns themselves are customizable. Right click anywhere in the report and choose Toggle Column from the pop-up menu. The sub-menu that appears shows a checkmark in each of the columns that are currently showing. Click any one of them to show or hide a column. These settings will apply to all your reports. Confidence Scores Next to the proposed sequence candidates, the auto de novo Total Local Confidence (TLC) and Average Local Confidence (ALC) confidence scores are shown. The confidence scores for each amino acid (that is, confidence that the correct residue in each position has been identified) are represented by color coding. Red represents a very high confidence (greater than 90%), purple represents a high confidence (80 to 90%) blue represents a medium confidence (60 to 80%) and black represents a low confidence (less than 60%). For more detailed positional confidence, place the cursor over the sequence of interest and right click Show Positional Confidence. A Position Confidence Table will appear, showing the confidence that each amino acid/pair of amino acids are correct. Sequence Tags Right click on a peptide in the Peptide Candidates Frame and select Show Sequence Tag. If the score threshold is set at 0.0, all of the amino acids in the peptide sequence will be displayed. Increasing the Score Threshold will display a mass in square brackets if the amino acids do not satisfy the score threshold. Modifications Consider the following sequence: The number 1 in square brackets refers to where a modification may occur. If you forget what modifications you selected before running de novo, click to the Properties tab. The fixed modification is set to [1] @[CKW]. In the sequence above, the modification has been made to the W as well as the C. The colors assigned to the [1] follow the same confidence scores as the amino acids themselves. Refer to the above section on Confidence Scores for more information on color coding. 48
.")
50 Ion Table Frame The Ion Table shows the proposed ions with their corresponding masses. To add additional ions to the ion table, see the instructions on page 95. If an ion is found in the corresponding spectrum, it must first pass two criteria before being displayed in a specific color (blue for N-terminal ions and red for C-terminal ions). It must be found within the mass error tolerance chosen by the user and must have an intensity of greater than 2% of the ion with the greatest intensity. Spectrum View Frame The Spectrum View Frame is found below the Ion Table and displays a graphical representation of the spectrum. The peptide that corresponds to the spectrum in the Spectrum View Frame is displayed in the Input Sequence box. Use the drop down to select other peptides that have the same ID. Scrolling over the spectrum will display a tooltip in the new window that will display the m/z ratio and the height/ intensity (as a percentage of 100) of that particular peak. Both the m/z ratio and the height of the peak can also found under the spectrum view on the right hand side. To zoom either on the X or Y axes, select the Zoom X or Zoom Y buttons, respectively and then use the wheel on your mouse to move around the graph. Selecting the 1:1 button will restore settings to view the entire spectrum on the screen. You can use the profile and peak buttons to switch the spectrum view from profile mode to peak mode and vice versa. The scrollbar on the left acts to increase and decrease the intensity of the peaks, where the scrollbar on the right acts to zoom in to display the monoisotopic peaks. 49
51 Spectrum Alignment Frame Clicking on the Alignment tab will display the Spectrum Alignment Frame. This frame always shows the whole spectrum and is used as a tool to help us navigate the spectrum view frame. A blue bar along the horizontal axis of the alignment view indicates the range of the spectrum view in the Spectrum View Frame. This frame will show you how the proposed ions align with the spectrum. By default, the Spectrum Alignment Frame displays b-ions and y-ions. The b ions are shown right to left in blue, while the y ions are shown left to right in red. Survey Scan Clicking on the Survey tab will display the corresponding precursor ion spectrum. The buttons that appear in this section are the same as those that are explained above in the Spectrum View Frame section. Error Map Click on the Error Map tab. The m/z ratio is displayed on the y axis and the error is listed on the x axis in Daltons. The Error Plot displays the confidence that is assigned to each ion. The most confident results lie on the centerline. Clicking a cell or column in the Ion Table highlights the corresponding points on the error plot and corresponding peaks on the spectrum. 50
 In the Project View Frame, select the data file(s) or project")
 Click the Protein Identification toolbar icon Or Select PEAKS Protein ID from the Tools menu.")
52 Chapter 7 7. Database Search 7.1 Setting up Protein Identification Parameters 1) In the Project View Frame, select the data file(s) or project containing the spectra that you wish to identify using database search. 2) Click the Protein Identification toolbar icon Or Select PEAKS Protein ID from the Tools menu. The Protein Identification Parameters dialogue window will appear: 3) To change any of the protein identification search parameters, now is the time.

53 Mass Options Parent mass error tolerance: Determine how much random and systematic experimental error on the parent/precursor ion PEAKS will allow for in its analysis. Type a tolerance in the textbox and choose units from the dropdown list. Using PPM allows for larger errors at larger m/z values. PEAKS will be very stringent concerning this value, so new PEAKS users should try setting this a little higher than past experience may suggest, if sensitivity is a concern. Fragment mass error tolerance: Determine how much random and systematic experimental error on the fragment/daughter ion PEAKS will allow for in its analysis. Type a tolerance in the textbox. Again, new PEAKS users should try setting this a little higher than past experience may suggest. Precursor mass search type: If the precursor mass is monoisotopic value, check monoisotopic. Check average, otherwise. Enzyme Options Enzyme: Indicate which type of enzyme was used to digest the sample. Choose from a dropdown list of enzymes. Note that you cannot delete or change the details of a built-in enzyme and therefore the Delete enzyme button and the Digest Rules panel will be grayed out. If your enzyme (or combination of enzymes) is not in the list, click the "New Enzymes" button. You will then be able to enter a name for your enzyme, digest rules (see below) and select if you would like to find proteins that satisfy the rules at both ends. This option is grayed out for builtin enzymes. Digest Rules: This is how you specify where your enzyme will cleave the protein between two amino acids to create peptides. The letter X denotes any amino acid in this position, while {set brackets} indicate any amino acid except the one in the brackets. Clicking on the Advanced button will open a new window which will allow you to be more specific with your digest rules. 52

54 General Options Max missed cleavages: determine the most missed cleavages to allow, internal to the peptide, in a de novo sequence. For instance, setting this to 2, and Trypsin as the enzyme, then PEAKS will return de novo sequences with up to 2 R's or K's internally. Preprocess before auto de novo: PEAKS has its own built-in preprocessor for removing noise, centroiding and peak charge recognition from MS/MS data. Check this box to turn preprocessing on. PTM Options PTM options: This list tells PEAKS what kind of post-translational modifications to include in its analysis. Drag the desired PTM into either the Fixed Modification or Variable Modification box. If the desired PTM is not in the list, first check the Show Unimod box to show additional PTMs. To create a new PTM click on the New PTM button. The following window will appear: Fill in the following information: Name: this name will appear in the PTM list for future use after it is saved. Monoisotopic mass: the mass that the residue gains or loses as a result of the PTM. Enter this value numerically. Neutral loss mass: the mass that the modified residue loses as a result of fragmentation. Ex. 28 would signify a loss of 28 Daltons. This is optional. Chemical formula: the chemical formula of the PTM. This should correspond to the mass listed above. This is optional. Residues that can be modified: Enter residues that can be modified anywhere, residues that can only be modified if they are at the N-or C-terminus or in the middle only. Rule: Enter comments for reference. This is optional. 53
55 Please note that you can also configure your PTMs in the Configuration panel. See page 98 for more information. Max variable PTM per peptide: To reduce uncertainty, limit PEAKS' de novo sequencing 'vocabulary', by restricting the number of variable PTM found on a peptide. Specify a number by typing it into the box. To lift such restrictions, type a very large number (longer than the length of the peptide). Database Options Database to search: Select from this dropdown list, one of the FASTA databases configured in PEAKS. To edit an already existing database, click on the Edit Database button. If the desired database is not in this list, click the "New Database" button. Note that you can also set up a new database in the Database Configuration window. The configuration window is the only place that that you can delete databases that you have created. For more information on setting up new databases see page 99. Taxonomy selection: This list displays the taxa you have chosen for your search. If the database selected has taxon information available, you can click on the Set taxa button. Otherwise, the whole database will be searched. The selections correspond to established hierarchy -- i.e. selecting 'Mammalia' will search all of 'horse, cow, rat, mouse, human, etc. Paste FASTA sequences: If you already know the sequence of the protein(s) you are looking for, select Paste fasta sequences and paste the sequence in the space provided in fasta format. Alternatively, if you want search the same sequence regularly, it is recommended to simply create a small text file and configure it as a database for PEAKS. Advanced Options PEAKS needs to have some de novo sequences before database searching since PEAKS uses sequence tags to perform database searching. As such the option of doing de novo prior to protein ID is presented here. In most cases, the same values for instrument, error, enzyme and PTM can be used in de novo and in protein ID, but you have the option of using one of your saved de novo parameter sets for the de novo portion. Select one from the drop down list. 4) After setting up parameters, we can save them for future use. Click the "Save Parameters" button, and choose a name for future reference when prompted. Any parameters that you save will be available in the drop-down list at the top of the window. To see what's inside, just select one, and the parameters boxes will be populated. 5) Press the OK button. If you have already performed de novo sequencing, the database search will commence automatically. If you have not previously performed de novo sequencing, the auto de novo process will appear first in the task queue. Once de novo sequencing is finished the database search will begin. 54

56 7.2 Protein Identification Results Peptide View Once PEAKS is finished searching the database, the Peptide View window will open by default: The Peptide View window summarizes the results for each MS/MS spectrum. All peptides that match to each spectrum are displayed. By default the spectra are listed by ID in the ID column with the corresponding peptide sequence in the Sequence column beside. In certain cases, one peptide can correspond to more than one spectrum. These spectra are then listed in the ID column under a heading entitled Hit. Click on + to expand the view to see all of the spectra that can be matched by the same peptide. The table below describes the contents of the columns in the Peptide View Window : ID A unique identifier for the MS/MS spectrum. This differs from a scan number since we may have merged several scans together. 55
57 Sequence Score m/z z Mr (Calc) Delta (Mass) Error (ppm) File RT Scan Quality Scan Mode Frag. Mode The amino acid sequence of the peptide. PTMs are listed in [square brackets]. PEAKS probability score. The measured mass/charge value, in Daltons, for the peptide. The calculated charge value for the peptide The sum of the theoretical mass of the residues that form the identified peptide sequence from the database. The difference between Mr(Calc) and Mass, in Daltons. The difference between Mr(Calc) and Mass, ppm. The name of the file. Retention time (elution time) for the peptide as recorded in the scan header. The scan number. A value from 0 to 1 estimated from the spectrum to refer to spectrum quality. Attributes like signal to noise, total intensity, and spectrum tagging are used. Mode that the scan step was performed in. Mode that the fragmentation step was performed in. The columns themselves can be customized. Right click anywhere in the report and choose Toggle Column from the pop-up menu. The sub-menu that appears shows a checkmark in each of the columns that are currently showing. Click any one of them to show or hide a column. These settings will apply to all your reports. Peptide Alignment Click on the Peptide Align window. This will look very similar to the de novo results window. You will see the Ion Table which shows the proposed ions with their corresponding masses. To the right of the Ion Table is the Error Plot which displays the confidence that is assigned to each ion. The most confident results lie on the centerline. Clicking a cell or column in the Ion Table highlights the corresponding points on the error plot and corresponding peaks on the spectrum. Underneath the Ion Table is the Spectrum View Frame which displays a graphical representation of the spectrum. The peptide that corresponds to the spectrum in the Spectrum View Frame is displayed in the Input Sequence box. Note that this is a drop down menu so that you can select other peptides that have the same ID (if applicable). Scrolling over the spectrum will display a tooltip that will display the m/z ratio and the height/ intensity (as a percentage of 100) of that particular peak. Both the m/z ratio and the height of the peak can also found under the spectrum view on the right hand side. 56
58 To zoom either on the X or Y axes, select the Zoom X or Zoom Y buttons, respectively and then use the wheel on your mouse to move around the graph. Select the Slide X button and then use the wheel on your mouse to move around the graph. You must ensure that you are sufficiently zoomed in on the X axis to use the Slide X button. Selecting the 1:1 button will bring you back to the original image where you can see the entire spectrum on the screen. You can use the profile and peak buttons to switch the spectrum view from profile mode to peak mode and vice versa. The scrollbar on the left acts to increase and decrease the intensity of the peaks, where the scrollbar on the right acts to zoom in to display the monoisotopic peaks. Finally at the bottom of the screen is the Spectrum Alignment Frame which is used as a tool to navigate the Spectrum View frame. A blue bar along the horizontal axis of the alignment view indicates the range of the spectrum view in the Spectrum View Frame. This frame will show you how the proposed ions align with the spectrum. By default, the Spectrum Alignment Frame displays b-ion and y-ion. The b ions are shown right to left in blue, while the y ions are shown left to right in red. Peptide Details Click on the Peptide Details tab. The following window will appear: 57

59 At the top of the Peptide Details frame is the accession number of the protein that corresponds to the peptide that you chose in the Peptide View window. If more than one protein matches a single peptide, you will be able to select these additional proteins using the dropdown menu. Below this you will see a simple alignment between the original de novo sequence for this spectrum (if available), the peptide found in the database and the reconstructed sequence. Letters on a green background, and with vertical bars, indicate agreement. Color codes on the de novo sequence letters still indicate positional confidence. Finally at the bottom of the window you will see the sequence of the selected protein and in blue you will see where the selected peptide matches the protein. The darker the blue, the more confident the match is. The matched peptides will be shown in red if you have performed a SPIDER search which is discussed in the next section. Protein View Click on the Protein View tab. The following window will appear: 58
60 The Protein View collects all the peptide identifications together, summarizes which proteins were present in the sample, and groups homologous proteins together. The same information is displayed in the Peptide View as in this Protein View; however, the results are organized to best enable us to evaluate at the protein level. This view is helpful when building a summary that can be sent to a customer/collaborator. See chapter 13 for more details on exporting whole files or proteins of interest to an Excel file. Index The top section of this view (shown above) behaves like an index, listing each protein found in the sample. Very similar proteins, containing the same set or a subset of the matched peptides, are clustered together. To expand and collapse the full list of proteins within each cluster click the + or - sign respectively. The table below describes the contents of the columns in the index: Accession Mass Display Score (%) Coverage (%) Query Matched Marked Description The GI, accession or other unique identifier for this protein as recorded in the database that was searched. The calculated mass of this protein A graphical coverage map. Blue areas represent parts of the sequence that have been explained by the identified peptides. A value from 1 to 99 representing the confidence we have in this protein identification calculated from the confidence on the ten best peptide hits for this protein, and normalized against the other identified proteins. The number of amino acids in the protein sequence that have been explained by the identified peptides. Expressed as a percentage of the total length of the protein. The number of spectra explained by matching to a peptide from this protein. A multi-function checkbox. By default unchecked, but we can use this to select proteins for export or multiple sequence alignment. The part of the protein s header information as parsed from the database, usually it contains the name of the protein. The columns themselves can be customized. Right click anywhere in the report and choose Toggle Column from the pop-up menu. The sub-menu that appears shows a checkmark in each of the columns that are currently showing. Click any of them to show or hide a column. These settings will apply to all your reports. 59

61 Sequence Browser The Sequence Browser tab is selected by default. Clicking on a protein in the index will display the sequence of that protein below in the Sequence Browser panel. Clicking on the hyperlink of the accession number of the protein shown in blue will open a new window containing the webpage of the database that you searched for protein ID page in a new window. There is also a Peptides List box which displays information about the peptides that matched to the selected protein. This list is identical to the Peptide View panel so see this section for more details. Below the Peptides List, you will see the protein sequence with the matching peptide sequences in blue. The darker the blue, the more confident the match is. Sequence Comparison Click on the Sequence Comparison tab to open the multiple sequence alignment window. A multiple sequence alignment helps to highlight the differences and similarities between homologous proteins, and the variants you ve evidenced from your sample. In the above list of proteins, mark two or more entries by clicking in their checkboxes. Click one of the above buttons to generate the multiple sequence alignment in this frame, or in your web browser. Identified peptides are highlighted in blue letters on the sequence. A more intense blue indicates a more confident match. The background colors indicate similarity between the sequences. A dark background indicates regions where residues or nucleotides are identical in all sequences, a light background indicates similarity across some sequences, and lowercase letters on white background highlight differences. A dash - is displayed where a gap had to be introduced in one sequence to complete the alignment. 60


62 Chart View Click on the Chart View tab. The following window will appear: 61

63 This feature will be described using the data that was chosen for the walkthrough as it is simple data. The Protein Score Distribution Chart, shows the distribution of the protein scores by percentage. The default peptide score threshold is 20%. In the above example, this threshold results in 32 proteins with a single detection cluster, 15 proteins with two detection clusters and 18 proteins with multi-detection clusters. Modifying the peptide score threshold using the up/down arrows and clicking on the Calculate button will result in changes to the amount of clusters that are found for each protein. The Peptide Score Distribution Chart displays the scores of the individual peptides as a percentage. The False Positive Rate Chart is derived from running a decoy database search which can be selected from the Advanced Options panel when you are setting up your Protein ID parameters. The example shown above indicates that below a score threshold of 30%, there is a false positive rate of approximately 1%. More specific details about the false positive rate can be seen in the Decoy Search Result table. For example, a score threshold of 20% resulted in 88 matches using a forward database search and 8 matches using a reverse database search. The false positive rate was therefore 8.33%. 62

64 Chapter 8 8. SPIDER Search After having obtained de novo sequences for peptides that are not in the database, it s a good idea to look for a homologous peptide in the database. This will help you to learn more about the proteins in your sample. To search with SPIDER you must first have some good de novo sequences. 8.1 Setting up SPIDER Parameters 1) Select a data file or a Protein ID result from the Project View frame 2) Click the SPIDER icon on the toolbar Or Choose SPIDER Search from the Tools menu. When a Protein ID results file is selected, the SPIDER Search Options window will appear as seen below:

65 If you have selected a data file, the following window will appear: Note that this window differs from the other window as it asks you to select a does not give you any filter options. In this case, we assume you already have de novo result for the data file. By selecting a database, SPIDER will search the de novo sequences already generated for that data file that have used the database that you selected. 3) The following section will describe the different options that you have when setting up the parameters for your SPIDER search. Query Options Choose a Query Type. They are, in order of increasingly rigorous analysis: Segment Match: this is not a true mutation search, instead, it will insist that the mass of the peptide returned is the same as that of the de novo sequence. Non-gapped Homology Match: this search will allow for transpositions, and single point mutations but not insertions or deletions. Gapped Homology Match: this search is the most rigorous, will find all types of mutations, but it is the slowest of the three search modes. Block Match: this is the most rigorous (but most resource intensive) search mode, taking into account all types of mutations and the positional confidence scores. A quick version of this is used to create the reconstructed peptides and to generate the final scores in each of the previous search modes. This is the only search mode that allows you to use variable modifications. 64
66 General Options Amino acid selection: Choose if you would like PEAKS to consider Leucine equal to Isoleucine without a penalty in the score as well as whether Lysine should be equal to Glutamine without penalty. Mass tolerance: Enter the amount of error (in Daltons) that PEAKS will allow for when determining the peptide sequences. Number of peptides to report: Choose how many of the best homologous peptides should be displayed after searching PTM Options PTM Options List: The PTM Options list tells PEAKS what kind of post-translational modifications to include in its analysis. To view additional modifications, select the Show unimod box. If your desired PTM does not appear on the list or is different than what is listed, you can select the New PTM button and the PTM Editing window will open. Fill in the information pertaining to the PTM of interest. For a more in depth explanation of creating a new PTM, see page 53. To select a PTM as Fixed or Variable, drag the PTM into the Fixed Modification or Variable Modification box. If you drag over an incorrect PTM, simply drag it back to the PTM Options list. Note that in previous versions of PEAKS, only fixed PTMs were allowed, however PEAKS version 5.0 allows variable PTMs as well when using the new block search. Max variable PTMs: To reduce uncertainty, PEAKS' de novo sequencing 'vocabulary' can be limited by restricting the number of variable PTM found on a peptide. Specify a number by typing it into the box. To lift such restrictions, type a very large number (longer than the length of the peptide). Filter Options As the SPIDER search is computationally intensive, it is not recommended that you run all of your de novo sequencing peptides against the database; only those that cannot be well explained. De novo score (A.A.) threshold: The SPIDER search requires a good sequence tag from de novo to be able to find good quality homologous proteins. Enter a value for the de novo score threshold. The recommended threshold is 0.5. Peptide score threshold: Because there is no need to run SPIDER on peptides that already were found to have a good match during PEAKS protein ID, it is helpful to enter a peptide score threshold so that SPIDER will only be performed on peptides below the threshold. The recommended threshold is

67 De novo Options Because SPIDER requires a de novo sequence to find homologous proteins in the database, de novo sequencing will need to be performed first. If you have already done de novo sequencing, select the I have already run de novo button. Database Options Note that these options are only visible if you choose to run a SPIDER search on a data file rather than a PEAKS results file. Database to search: Select from this dropdown list, one of the FASTA databases configured in PEAKS. To edit an already existing database, click on the Edit Database button. If the desired database is not in this list, click the "New Database" button. Note that you can also set up a new database in the Database Configuration window. The configuration window is the only place that that you can delete databases that you have created. For more information on setting up new databases see page 99. Taxonomy selection: This list displays the taxa you have chosen for your search. If the database selected has taxon information available, you can click on the Set taxa button. Otherwise, the whole database will be searched. The selections correspond to established hierarchy -- i.e. selecting 'Mammalia' will search all of 'horse, cow, rat, mouse, human, etc. 4) After setting up parameters, we can save them for future use. Click the "Save Parameters" button, and choose a name for future reference when prompted. Any parameters that you save will be available in the drop-down list at the top of the window. To see what's inside, just select one, and the parameters boxes will be populated. 5) Press the OK button and the SPIDER search will begin. 8.2 SPIDER Results View SPIDER will search the database for homologous peptides, and attempt to consolidate these into protein hits as well. The result report will look much like the results for PEAKS Protein ID or inchorus searching. Clicking on the Peptide View tab, will display results that look very much like the results for PEAKS Protein ID. See the section on page 55 for more details. Click on the Peptide details tab to see the SPIDER matches shown in red. Letters on a green background, and with vertical bars, indicate agreement. Letters on a red background indicate sequencing error. Color codes on the de novo sequence letters still indicate positional confidence. Letters on a blue background indicate uncertainty or mutation. + signs represent more likely mutations. [brackets] indicate an equal mass substitution, common non-critical de novo errors. <these brackets> indicate an equal mass substitution and a mutation. 66
, however where there were blue regions to indicate areas of homology when performing a")

68 When simply identifying exact peptides from the database, using PEAKS Protein ID, or inchorus, there s no need to reconstruct the real sequence. Clicking on Protein View will again yield a similar display as was seen for PEAKS Protein ID (see page 58), however where there were blue regions to indicate areas of homology when performing a protein ID search, there are now red regions to indicate areas of mutation. Click on the Sequence Browser tab, and note that instead of highlighting areas of homology in blue, areas of mutation are highlighted in red. After finding a homologous peptide in the database, SPIDER will decide what is likely a mutation and what is more likely a simple de novo sequencing error (resulting from certain combinations of amino acids having exactly the same mass L/I, N/GG, AG/G, etc.). As such it reconstructs the real sequence from a de novo sequence and its homologue. This is highlighted on the Peptide Details frame of Peptide View. 67
 Click the PTM icon on the toolbar Or Select PTM Finder from the Tools menu.")
69 Chapter 9 9. PTM Finder 9.1 Setting up PTM Finder Parameters 1) Select a Protein ID results file to perform a PTM finder search on. Note that you cannot perform protein ID on a raw file or de novo results. 2) Click the PTM icon on the toolbar Or Select PTM Finder from the Tools menu. The PTM Finder Options window will appear: 68
70 The parameters are the same as you used when performing protein ID (page 51) with the exception of the filter options found at the bottom of the window. As PTM Finder searches tend to be computationally intensive, PEAKS will only look at de novo sequencing results that are above the amino acid score threshold and below the peptide score threshold that you input. De novo score (A.A.) threshold: The PTM finder requires a good sequence tag from de novo to be able to find good quality homologous proteins. Enter a value for the de novo score threshold. The recommended threshold is 0.5. Peptide score threshold: Because there is no need to run the PTM finder on peptides that were already found to have a good match during PEAKS protein ID, it is helpful to enter a peptide score threshold so that SPIDER will only be performed on peptides below the threshold. The recommended threshold is PTM Finder Results View The results from a PTM finder search are identical to those seen in a PEAKS Protein ID search. Please see page 55 for more information on the PEAKS Protein ID search results. 69

71 Chapter inchorus Meta Search inchorus Protein Identification will call upon several search engines for protein identification and will then compare and summarize the results from the different search engines in one single report. PEAKS protein ID, X!Tandem, OMSSA, Mascot and Sequest. Please note that you will need to have your own copy of Mascot and Sequest in order to make use of those search engines during and inchorus search. In order to set up your search engine preferences, see page Setting up inchorus Parameters 1) Select the orbisample.mzxml file 2) Click the inchorus Search icon on the toolbar Or Select inchorus Search from the Tools menu. The inchorus Options window will appear: 3) First select each of the protein identification tools that you would like to use by putting a checkmark in their respective checkboxes. Search parameters for each program can be set by selecting the name of the search engine. You will need to use the Ctrl button to be able to check the boxes for multiple search engines. The option screens for each of the search engines available to inchorus are designed to work in the same way as options screens for the original programs. For help in setting search parameters for each program, please refer to that program s user manual. For help with PEAKS Protein ID, please refer page 51.

72 Importing Existing Results PEAKS inchorus reads X!Tandem.xml files, OMSSA.omx files, Mascot.dat files and Sequest.srf files. When importing third party results files, please make sure that the scan number model in the results file is consistent with the one in PEAKS. PEAKS uses original data information to compute the inchorus score. When you run X!Tandem search with command line, you need to turn on the option of ``-w`` in order to export data information into X!Tandem.xml files. To import existing results, check the Import Result checkbox and select Import Result. The following window will open. Although it is not necessary for the various search engines to use the same database in an inchorus search, it is necessary to have a unified database for an inchorus search that includes imported results. Select the database that you would like to use from the dropdown list. The inchorus search will be performed on all species in the database unless specified by the user. If this database does not appear in this list, refer to page 99 to configure your databases. To specify which taxa you would like to search, click on the Set Taxa button. You will need to use the Ctrl key to make multiple selections. To import your file, click the Browse button that is found beside the appropriate search engine. Find the file that you would like to import and click Open. Once you have selected the file(s) that you would like to import and have selected the options for any other search engine searches you would like to perform, click OK. 71

73 10.2 inchorus Results View When the inchorus search is complete the Project View panel should contain a separate results file for each search engine that you selected as well as an inchorus report that combines the results from the multiple search engines. See an example below: De novo, Peptide and Protein Views Each results file for the 3 rd party search engines looks very similar to the PEAKS protein ID results file (page 55) with a few small differences. Firstly, there is no De novo View or Chart View, and secondly, the scoring will be specific to that search engine. For example, the score for OMSSA is listed as an E-value. For more information about different scoring methods, refer to the user manual of the 3 rd party search engines. The inchorus search report also looks very similar to the 3 rd party search engine results, however there are no De novo View and Chart View results available. The de novo sequencing results that are found in the De novo View are only those that correspond to results that have been identified by one of the search engines in the inchorus search. Chart View As mentioned above, Chart View is available in the inchorus report. The two charts that appear at the top, the Protein Score Distribution Chart and the Peptide Score Distribution Chart are in the same format to those that are seen in the Chart View of a PEAKS Protein ID search (page 61). In the example below, the inchorus Protein Number Pie Chart displays the percentage of identified proteins that were found by PEAKS, OMSSA, Mascot and X!Tandem. PEAKS identified 82% of the proteins on its own and 15% of proteins were common between some of the search engines. The inchorus Protein Number Venn Diagram gives more specific information than the pie chart about the overlap of the results between different search engines. The Venn diagram contains information about 3 search engines and inchorus was run using 4 search engines for this example. You can change the search engines that will appear in the Venn diagram using the dropdown lists. Select the 3 search engines that you would like to compare and click the Apply button. 72

74 Chapter Filtering Your Results PEAKS 5 provides you with an exhaustive list of all proteins and peptides that can be found in a sample. However, since everyone has their own criteria of what information is required in their report and what is an acceptable result, PEAKS 5 provides the necessary filtering tools that enable you to filter out the less critical information and leave you with the essentials Setting Filter Parameters Click on the time and date stamp associated with the result that you would like the filter. Once the report loads, click the right button on your mouse and select Perform Filtering. The following window should appear:

75 Possible Filters/ Selected Filters/ Edit Filter The filters are grouped into three basic types to reflect what they act on: De novo filters act to remove proposed de novo sequences; Peptide Filters act to remove peptides found in the database from the report; and Protein filters act to remove proteins from the report. To see the available filters for each level of filtering, double click on the appropriate folder in the Possible Filters frame. See the options in each folder below: Choose a filter from the Possible Filters list on the left by clicking on it. Options for this filter will appear in the Edit Filter frame. Once you have set the options that you would like for the filter in the Edit Filter frame, drag the filter that you would like into the Selected Filter list on the right hand side. Click OK to apply the filter that you have selected to the current file. If you would like to add another filter, you can repeat the process, continuing to add as many filters as necessary. In this way it is also possible to have two filters on the same property; we can set a range of protein mass, for instance, by applying one filter on the upper bound of the mass and adding another filter to be the lower bound of the mass. We can also have more complex filters that involve multiple properties. For example, let s say that you want to show only proteins with more than one high scoring (greater than 60% score) peptide, a standard requirement for publication. Double click on the Peptide Filters folder. Select Score Filter. Edit the filter to select peptides that have a score that is greater than 60% in the Edit filter frame. Now drag Score filter from the Possible Filters frame to the Selected Filters frame. 74

 will remove it from the Protein View list and will remove all peptides associated with that protein from the Peptide View")
76 Filter Options The filters cascade through each view in the multi-part report. For instance, removing a peptide from the database search results the Peptide View list will cause the de novo sequence for that peptide to be removed from the De novo View tab but will not affect the Protein View list. Filtering out a protein (by mass, for example) will remove it from the Protein View list and will remove all peptides associated with that protein from the Peptide View list as well as from the De novo View list. The manner in which the De novo View is linked can be specified by the user using the options in the Filter Options frame. See the figure below for more information. 75

77 Parameter Options Filter sets can be saved and re-used between sessions, by clicking the Save Parameter button that is found at the top right hand corner of the Filter Parameters window. You may prepare your results the same way each time; in which case it makes sense to set up a filter that will be automatically applied each time we load a report. Select a filter from the list of saved filters from the dropdown menu found at the top right hand corner of the Filter Parameters window. Click on the Set saved as default button. This filter will be displayed in the Parameter Options frame (as seen below) and will be applied automatically just after a report is loaded. Be careful, if your default filter is very stringent, it can sometimes remove everything! To remove a default filter, press the Clear Default Button at the bottom of the Filter Pane. Each filter can be applied several times over. So it can get a little complex. To illustrate, here are a few examples: 1) Goal: Show proteins that have two high-scoring hits: -Add the Protein Filter called Query and in the Edit Filter section choose greater than and type 1 in the box (without the quotes). This will remove any one hit wonders. -Add the Peptide Filter called Score and in the Edit Filter section choose greater than and type 50 in the box (without the quotes). 2) Goal: Find a protein that contains the word human or rat in the database entry s description, but not Keratin or Trypsin. -Add the Protein Filters called Desc -In the Edit filter section, you are required to type in a regular expression (regex). This allows you to use wildcards. 76
78 -So type in the regex: (?!.*(Keratin Trypsin).*).*(human rat).* and press the Enter key. If PEAKS confirms that this is a valid regular expression, it will put a check in the Valid Java Regex box. 3) Goal: Setting a protein mass range If we know the approximate mass of the proteins you are interested in, you can eliminate all proteins that are not close in mass. Add two filters: Protein Filters: Mass >12000 and Protein Filters: Mass <

79 Chapter Complex Analysis 12.1 Creating a project for complex system PEAKS 5 is able to analysis MS data from very complex systems. The data analysis scheme is organized as follows: Project nodes Sample nodes File nodes Below is an example of a project that contains three samples that were generated using the following fragmentation methods: ETD, CID, and CID/ETD. Each sample has three files.

80 12.2 Integrating data analysis Within a project, the data is analyzed either file by file or sample by sample. By selecting a sample, the operation applies to all files in the sample. It means all spectra from different files are processed in a single run. The result node is at same level as selected data node. PEAKS 1 is the PEAKS Protein ID result for file ETD_01.RAW, whereas PEAKS 11 is the PEAKS Protein ID result for all three fractions of the ETD sample. Note that the result of a sample may not be the sum of the results of all files in the sample Comparing results PEAKS 5 provides a Compare Results function to align/differentiate two or more results. To use the Compare Results function, hold down the Ctrl key and select two or more result files that you would like to compare. Click on the right mouse button and select Compare Results. Below you will see a comparison of the PEAKS protein ID results (PEAKS 11, PEAKS 22 and PEAKS 32) generated for the three samples mentioned in the previous section: ETD, CID and CID_ETD. After selecting the Compare Results function for PEAKS 11, PEAKS 22 and PEAKS 32, a new entry will appear in the Project View Frame called Compare PEAKS 11, 22, 32. Note that the results window that appears will contain De novo View, Protein View, Compare View and Compare Chart tabs. In the Protein View, all proteins found by each of the in the result of PEAKS 11 PEAKS 22 or PEAKS 32 are listed in the first column. For each protein, the scores in different database search results are displayed. 79


81 Similarly, in Compare View, all peptides in the result of PEAKS 1 or PEAKS 5 are listed in the first column. For each peptide, the spectrum id, m/z and score in different database search results are displayed. The Compare Chart provides Venn diagrams and pie charts for proteins and peptides to illustrate the comparison of results that were generated by each protein ID search. For more information on the Venn diagrams and pie charts in PEAKS s Chart View refer to page
 formats and follow a What you see is what you get philosophy. All the information you see on screen in PEAKS 5 will appear in the exported report.")
82 Chapter Exporting Data/Reports and Printing PEAKS 5 allows you to create reports to share with collaborators, colleagues and clients. The reports are available in HTML or Microsoft Excel (.xls) formats and follow a What you see is what you get philosophy. All the information you see on screen in PEAKS 5 will appear in the exported report. For this reason, it is important that we complete results filtering and toggling columns before exporting a report Export Data in.mzxml or.mgf In order to export your data file in.mzxml or.mgf right click on the data file that you wish to export. Click Export MGF File A window will open that will prompt you to enter a name and a location for the file. Click Export. or Click Export MzXML File. The following window will open: Enter the start and end RT in the appropriate boxes. Then click the Browse button to select a destination to save your file.

83 13.2 Export Peptide Results in PepXML Format In order to export your PEAKS results file in PepXML right click on the results file that you wish to export and select Export PepXML. The following window will appear: Browse your computer to select the location that you would like to export the PepXML file to. Then click OK Export Results in Excel Format In order to export your PEAKS results file to Excel right click on the results file that you wish to export and select Export Excel. 82


84 The following window will appear: If you would like to export all of the protein and peptide results select the All Protein and Peptide Result(s), otherwise select one of the other options where you can limit which results are exported. Select the appropriate boxes if you would like to export Data Properties, Search Parameters and Filter Conditions to Excel. Finally you need to select the Export Destination by clicking the Browse button. Then click OK. If you export De novo results to Excel, the de novo sequencing results will be exported and you have the choice to also export Data Properties, Search Parameters and Filter Conditions. See below: 83


85 13.4 Print Tables and Graphs for Publication In order to export an image file, right click on the results file that contains the appropriate image file and select Export Statistics Graph. De novo Image Files Select a De novo results file. Right click and select Export Statistics Graph. The following window will appear: The De novo A. A. Score Chart option will be selected in the Statistics Graph Type panel. Select a file format and height/width for your chart and browse your computer to select a destination. Beside is an example of the output: 84


86 Protein ID Image Files Select a Protein ID results file. Right click and select Export Statistics Graph. The following window will appear, giving you the option of exporting a Protein Score Chart, a Peptide Score Chart or a False Positive Rate Chart: Below are examples of the Protein Score Chart, the Peptide Score Chart and the False Positive Rate Chart, respectively. 85


87 inchorus Image Files Select an inchorus results file. Right click and select Export Statistics Graph. The following window will appear, giving you the option of exporting a Protein Score Chart, a Peptide Score Chart, an inchorus Result Pie Chart or an inchorus Result Venn Diagram. Below are examples of the inchorus Result Pie Chart and inchorus Result Venn Diagram, respectively. Examples for the Protein Score Chart and the Peptide Score Chart can be found above in the Protein ID image files section. Compare Image Files Select a Compare results file (see chapter 12 for more information on comparing results files). Right click and select Export Statistics Graph. The following window will appear, giving you 86


88 the option of exporting a Peptide Number Pie Chart, a Protein Number Pie Chart, a Peptide Number Venn Diagram or a Protein Number Venn Diagram. Below are examples of the Peptide Number Pie Chart, the Protein Number Pie Chart, the Peptide Number Venn Diagram and the Protein Number Venn Diagram, respectively. 87

89 Chapter Advanced Configuration and Environment Preferences 14.1 PEAKS Environment Preferences This section will describe the setting up the configuration of environmental preferences including general, instrument, search engine and ion editor configurations. To begin click the Preferences toolbar icon Or Select Preferences from the Window menu. The following window will open:

90 Use the + and boxes to expand and collapse the view. General Preferences Default Input File Directory- Select where your data is being inputted from using the Browse button. Default Output File Directory- PEAKS outputs your results to C:\derbyServer by default. Select the Browse button to change this location. Project folder- PEAKS uses C:\derbyServer\serverDB as the default project folder. Select the Browse button to change this location. Temporary File Directory- PEAKS uses C:\temp_mgf as the default project folder. Select the Browse button to change this location. Default Configuration File Directory- Your configuration files for PEAKS can be found at C:\Documents and Settings\bsi\.peaks\peaksconf.xml by default. Select the Browse button to change this location. Default Log File Location- Your log file for PEAKS can be found at C:\Documents and Settings\bsi\.peaks\peaks.log by default. Select the Browse button to change this location. RMI Connections Clicking on RMI connections on the menu on the left hand will open the following window: The default port numbers for the Server, Client and Worker will appear. The port numbers can be changed if conflicts arise. Contact technical support at BSI for more information. Click the Apply button to save any changes that you made. 89


91 Derby Database Clicking on Derby Database on the menu on the left hand will open the following window: Derby Host The name of the Derby Host as well as the Port number will come up by default and can be changed if needed. Memory used to start Derby Server The amount of Memory used to start Derby Server will also come up by default but can be changed if more memory is available. Derby Jar Location The Derby Jar Location panel will list the location of the Derby Jar file by default. If you would like change this location, check the User Define box and click on the Browse button to select a new location. Click the Apply button to save any changes you have made. Performance Clicking on Performance on the menu on the left hand will open the following window: 90

92 Computer Performance Select the number of cores that your computer contains (i.e. single, double or quad core). Please note that the setting of number of cores that you are able to use must comply with the license. 3D view PEAKS will display a 3D view with your quantification results. Check the Show 3D View box to enable this function. PEAKS 5 comes with the Java3D program to support the viewing of 3D images. Fast loading files This function is for raw file loading. If you check the Fast Loading Files box, PEAKS will only load spectrum header information without the peak list. Please note that if you set up a project which contains more than 20 raw files, this function will not work well due to memory issues, and you should uncheck the Fast Loading Files box. Click the Apply button to save any changes you have made. Instrument Preferences This section will allow you to change any preferences for the following instruments: ABI, Bruker, Shimadzu and Varian. ABI (.wiff) Clicking on Instrument and then ABI (.wiff) on the menu on the left hand side will open the following window: Default.wiff raw file convertor location Click Browse to tell PEAKS the location of the Default.wiff raw file converter. 91

93 Raw file converter options ABI raw files may contain several samples. By default, these samples are not merged into one data set. Select yes if you would like PEAKS to merge all the samples into one data set. For PEAKS to work optimally, it is important to select if the survey spectrum or the product spectrum has been centroided. Click the Apply button to save any changes you have made. Bruker (.yep/baf, fid) Clicking on Instrument and then Bruker (.yep/baf, fid) in the menu on the left hand side will open the following window: Default compass file location Click Browse to tell PEAKS the location of the CompassXport file converter. Raw file converter options Bruker.fid files may contain several samples. By default, these samples are not merged into one data set. Select yes if you would like PEAKS to merge all the samples into one data set. Click the Apply button to save any changes you have made. Shimadzu AXIMA (.run) Clicking on Instrument and then Shimadzu AXIMA (.run) in the menu on the left hand side will open the following window: 92

 in the menu on the left hand side will open the following window: Click Browse to")

94 Click Browse to tell PEAKS the location of the Shimadzu run2xml.exe file. Click the Apply button to save any changes you have made. Varian (.xms) Clicking on Instrument and then Varian (.xms) in the menu on the left hand side will open the following window: Click Browse to tell PEAKS the location of the xmlrai.exe file. Click the Apply button to save any changes you have made. Search Engine Preferences Mascot Settings Clicking on Search Engine and then Mascot Settings on the menu on the left hand side will open the following window: 93
, Port, Virtual Directory as well as your user name, password and email address.")
95 In this window you will tell PEAKS how to access your Mascot server (if applicable). Enter the Host name (or an IP address), Port, Virtual Directory as well as your user name, password and address. To make sure that you entered everything correctly and that the server is working, click the Test Connection button. If you would like to save your password so that you don t have to enter it every time, check the Save Password box. Click the Apply button to save any changes you have made. X!Tandem Settings Clicking on Search Engine and then X!Tandem Settings in the menu on the left hand will open the following window: First you must select whether you would like PEAKS to access a server or local version of X!Tandem. If you select the server version, you must enter the Host name (or IP address) as well as the port. To make sure that you entered everything correctly and that the server is working, click the Test Connection button. If you select a local version of X!Tandem, you must click the Browse button to tell PEAKS where to find the local settings. If PEAKS provides the local copy, uses the location of PEAKS as the default path. Click the Apply button to save any changes you have made. 94


 as well as the Sequest Result Output Folder. Click the Apply button to save any changes you have made.")
96 OMSSA Settings Clicking on Search Engine and then OMSSA Settings in the menu on the left hand will open the following window: To use OMSSA, you must click the Browse button to tell PEAKS where to find the default path. If PEAKS provides the local copy, uses the location of PEAKS as the default path. Click the Apply button to save any changes you have made. Sequest Settings Clicking on Search Engine and then Sequest Settings in the menu on the left hand will open the following window: To use Sequest you must click the Browse button to tell PEAKS where to find the default path. You must also browse your computer to find the location of the Default Sequest Parameter File (.params) as well as the Sequest Result Output Folder. Click the Apply button to save any changes you have made. Ion Editor Preferences Clicking on Ion Editor on the menu on the left hand will open the following window: 95

97 Decimal places Select the number of decimal places you would like to appear in the ion table. The default is set to two decimal places. Ion Editor Clicking on Ion Settings and then Ion Editor in the menu on the left hand will open the following window: To select an ion type to be viewed in the ion table, click on the ion type in the Ion Type list found on the left hand side of the window. You now need to select the charge for that ion type from the drop-down menu. Once you have done this, click on the =>Add with charge button and the ion type will now appear in the Ion Table Columns list on the right hand side of the window. To remove an ion type from the Ion Table Column list, select the ion type and click on the Remove from list <= button. The ion type will now appear in the Ion types list. Click the Apply button to save any changes you have made. 96

98 14.2 PEAKS Configuration This step includes configuration of enzymes, PTMs, databases, instruments, and parameters. To begin click the Configuration toolbar icon Or Select Configuration from the Windows menu. Enzyme Configuration PEAKS can use almost any enzyme, or combination of enzymes in your analysis. You can select from any of the built-in enzymes or define your own. From the Configuration window select Enzyme from the left hand to change your enzyme configuration. Built-in enzymes All of the built-in enzymes within PEAKS are listed in the Enzyme list. Clicking on one of these built-in enzymes will display the information listed about that enzyme in the Enzyme Details panel. Note that you cannot delete or change the details of a built-in enzyme and therefore the Delete enzyme button and the Digest Rules panel will be grayed out. Create a new enzyme Click on the New Enzyme button. Digest Rules: This is how you specify where you enzyme will cleave the protein between two amino acids to create peptides. The letter X denotes any amino acid in this position, while {set brackets} indicate any amino acid except the one in the brackets. You can also choose to select the check the box Select peptides that satisfy the above rules at both ends if you desire. The example below shows a combination of Trypsin and Asp-N. 97

99 You must click the Add/Update button for the changes to be saved. Your new enzyme will now appear in the Enzyme List where you can access it later. If you wish to delete an enzyme that you created, select the appropriate enzyme and click the Delete Enzyme button. Note: For information on defining new enzymes on the fly for PEAKS de novo or PEAKS Protein ID, see pg 45 or pg 53, respectively. PTM Configuration From the Configuration window select PTM from the left hand to change your PTM configuration. Built-in PTMs The built-in PTMs within PEAKS are listed in the PTM List. To see additional built-in PTMs from the Unimod library, click the Show unimod box. Clicking on one of these built-in PTMs will display the information listed about that PTMs in the PTM Details panel. Note that you cannot delete or change the details of a built-in PTM and therefore the Delete PTM button and the PTM Rules panel will be grayed out. Create a new PTM Click on the New PTM button. Now simply enter the information about your PTM in the PTM Details panel. Name: this name will appear in the PTM list for future use after it is saved. Monoisotopic mass: the mass that the residue gains or loses as a result of the PTM. Neutral loss mass: the mass that the modified residue loses as a result of fragmentation. Ex. 28 would signify a loss of 28 Daltons. Chemical formula: the chemical formula of the PTM. This should correspond to the mass listed above. Residues that can be modified: Enter residues that can be modified anywhere, residues that can only be modified if they are at the N-or C-terminus or in the middle only. Rule: you can enter a comment for your reference. You must click the Add/Update button for the changes to be saved. Your new PTM will now appear in the PTM List where you can access it later. If you wish to delete a PTM that you created, select the appropriate PTM and click the Delete PTM button. 98

100 The example listed below is one where we knew that only methionine was oxidized. Note: For information on defining new PTMs on the fly for PEAKS de novo or PEAKS Protein ID, see pg 45 or pg 53, respectively. Database Configuration In addition to de novo sequencing of peptides, PEAKS 5 also has the ability to search through a database search to identify proteins. In order to use this function, PEAKS must have access to a protein or EST database in FASTA format or an EST database of DNA sequences. You can point PEAKS to an existing database on your system, or download one. Additionally, you can associate taxonomy with certain databases. WARNING: Downloading a database can take a long time (8+ hours), depending on connection speed. Most only take minutes. From the Configuration window select Database from the left hand to change your database configuration. The Database list at the top of the screen will show you databases that you have already configured. Select one of these files to see the details in the Database Details panel below. Configure a new database 1) Select the New Database button on the right hand side of the Database List. You will now be filling in the specifics for your database in the Database Details panel below. 99
 In the basics option panel, enter a name for your database and select Download Database.")

101 2) Fasta Format Database: Select your database from this drop-down menu, or select Other if your database is not in the list or if you would like to submit your own database. 3) In the basics option panel, enter a name for your database and select Download Database. The following window will appear: 4) If you would like to invoke your default FTP client software and download automatically, click Yes. If you select No the following window will appear telling you that the URL will be copied to your system clipboard. Click Ok. Open your Internet Explorer and paste the URL into the address bar. A file download window will open. Click Save. 5) Once the database is downloaded, you need to make sure that you decompress the file if it is compressed using a program such as WinZip, or WinRar to extract its contents. The file inside the compressed file will be a FASTA format text file (a.fas or a.fasta file). 6) Finally put the database file into a directory that PEAKS can access. 7) Click Browse to tell PEAKS where the database file is located. 8) If the database that you have selected is an EST database, check the box labeled EST Database. If not, leave it blank. 100
 you must enter parsing parameters yourself by typing in the textboxes.")

102 9) Since you have already selected a FASTA Format Database in Step 2, the Accession number information and the parsing rules for the database headers are shown in the textboxes below in the Advanced Options- Fasta Title Format panel. If you chose an Other (in step 2) you must enter parsing parameters yourself by typing in the textboxes. Alternatively, if our database format is the same as one of the public databases, you can choose to apply that database s format when PEAKS reads our database. Select the database that is similar to yours from the dropdown list to fill the textboxes with the appropriate parsing rules. A note on parsing rules Apart from starting with a greater than symbol, the precise syntax of the FASTA title line varies from database to database. For this reason, PEAKS uses Java Regular Expressions to define how the accession string and the description text should be parsed from the FASTA title line. A note on using a delimiter Some databases use one entry to represent multiple protein entries. The FASTA headers are concatenated with a delimiter. Since some of these databases use unprintable control codes as delimiters PEAKS will use the equivalent ASCII decimal code to represent them. For example the NCBI NR database uses CTRL-A as a delimiter so the user should input "1" as its equivalent decimal delimiter as listed here. 10) To be able to do PEAKS Protein ID using a specific taxonomy, you will need to download some files and place tell PEAKS where to find them in the Taxonomy Options panel. 11) To download the taxonid file, click the Download button. The following window will appear: 101
103 URL will be copied to your system clipboard. Click Ok. If you would like to invoke your default FTP client software and download automatically, click Yes. If you select No the following window will appear telling you that the Open your Internet Explorer and paste the URL into the address bar. A file download window will open. Click Save. Repeat Step 11 taxdmp file. Please not that you do not have to decompress the taxonomy files. 12) Now that you have downloaded the taxonomy files, you must tell PEAKS where to access them by clicking the Browse button and selecting the file. 13) To save the database to your Database List, you must click the Add/Update button before clicking the Ok button. Delete a previously saved database If you would like to delete a database file, select the database that you wish to delete and click on the Delete Database button. Set a database as default Select the file and click the set as default button which is located to the right of the Database List. This database will now be used by PEAKS when you run PEAKS Protein ID. Moving/Updating a Database If you choose to move a database to another directory, or delete it entirely, you need to notify PEAKS. You must remove the database from the list and re-load it. Until you do so, the database name will appear in red in the list of databases and any protein identification using that database will fail. If you choose to update the database (perhaps by downloading the latest database file and overwriting the old database file), PEAKS will show the database information in light gray. A light grey colour could also mean that the database does not have header information. Best practices: configuring databases for use with X!Tandem At the time of this writing, X!Tandem had trouble searching through large databases, and would crash. It is therefore suggested that X!Tandem only be used with small databases; or if used with a large database, a taxon should be specified. The NCBInr and SwissProt databases are ideal for this purpose. Best practices: configuring databases for use with OMSSA At the time of this writing, we could not use OMSSA with databases that were not in NCBI format, or SwissProt format, and have those results available to inchorus. 102

104 Also, a bug in OMSSA prevents us from easily using databases with OMSSA when they are stored in a folder that contains a space in its path. This creates problems when PEAKS creates temporary databases on our behalf. To avoid this, best practices suggest that you put all our databases in a folder c:\peaksdatabases. The folder c:\my documents\databases wouldn t work because it contains a space between my and documents. Using spaces in the database file name causes the same problem. So after you download and extract our database you should call the database file ncbinr.fas, or ncbi_nr.fas rather than ncbi nr.fas. Instrument Configuration From the Configuration window select Instrument from the left hand to change your instrument configuration. Built- in Instruments Select the manufacturer of your instrument from the drop-down list. The names of the instruments will then appear in their vendor specific formats. Select your instrument and you will be able to view the information on your instrument in the Instrument details panel below. You can also select General in the manufacturer list and the instruments will be listed in a general format. Note that you cannot delete or change the details of a built-in instrument and therefore the Delete PTM button and the Instrument Details panel will be grayed out. Create a new instrument Click on the New Instrument button and the following window will appear: In the Instrument Details panel, create a name for your instrument. Next, fill in your details in the Basic Options panel. In the manufacturer dropdown list, select a specific vendor or General. 103
105 Ion Source: Use the drop-down list to select what ion source that was used; MALDI/SELDI or ESI(nano-spray). This will help the PEAKS Data Refine tool to decide the charge of the ions. MS- Precursor Scan: Use the drop-down list to select what type of MS scan was performed. This selection will tell the PEAKS Data Refine tool if the survey scan is of sufficient resolution to determine the charge and the monoisotopic peak from the examination of the survey scan. Fragmentation type: Use the drop-down list to select the method of fragmentation that was used. This selection will tell PEAKS what type of ion-series to expect for PEAKS auto de novo sequencing and PEAKS protein ID database search. Select CID/ECD if alternating fragmentation is used to allow the algorithm to determine the type of fragmentation from each scan header. MS n Product Scan: Use the drop-down list to select what type of MS n scan was performed. This selection will help PEAKS decide which internal parameters (for weighing fragments and amount of noise) to use during PEAKS auto de novo sequencing and PEAKS protein ID database search. Select LIT/FT if alternating hi-res/low-res modes are used, allowing the algorithm to determine the mass analyzer from the scan header. You can also use the Advanced Options to specify additional parameters. Precursor Mass Search Type: Select Monoisotopic or Average. For ion-trap instruments, it is usually beneficial to allow the PEAKS protein ID database search to use an average mass. Parent and Fragment error mass tolerance: User specified values. These will appear on the PEAKS de novo and PEAKS protein ID options screens when the instrument is selected. Target Ions: Select which ions that you would like PEAKS de novo and Protein ID to focus their search on. You must click the Add/Update button for the changes to be saved. Your new instrument will now appear in the Instrument List where you can access it later. If you wish to delete an instrument that you created, select the appropriate instrument and click the Delete Instrument button. Parameter Configuration From the Configuration window select Parameters from the left hand to change your parameter configurations. Please note that you can only view and delete parameters from within this parameter window. From the Parameter type drop-down list at the top of the screen you can select De novo, PEAKS Parameters or SPIDER Parameters. The parameters that you have saved within these categories will be displayed below in the list. Select the parameter file that you would like to view. 104
106 Creating a new parameter file If you would like to create and save new parameters you can do this when/before you set up auto de novo sequencing (see page 45), PEAKS protein ID (see page 54) or SPIDER (see page 66). These references will provide you with an explanation of all of the parameters. Deleting a previously saved parameter file If you would like to delete a parameter file, select the file that you wish to delete and click on the Delete button. Viewing a previously saved parameter file Selecting a file will display the details of that file below. For an explanation of the parameters, please see the pages listed in the Creating a new parameter file section above. 105
107 Chapter PEAKS Quantification Many approaches to protein quantification using mass spectrometry data have been described in the literature. In terms of their implementation, most of them can be classified into three protocols. MS: Quantification based on the relative intensities of extracted ion chromatograms (XICs) for precursors within a single data set. This is the most widely used approach, which can be used with any chemistry that creates a precursor mass shift. For example, ICAT and SILAC. MS/MS: Quantification based on the relative intensities of fragment peaks at fixed m/z values within an MS/MS spectrum. For example, itraq and Tandem Mass Tags. Label free: Label free quantification based on the relative intensities of extracted ion chromatograms (XICs) for precursors in multiple data sets aligned using mass and elution time. All three protocols are fully implemented within PEAKS Q. The flow chart is shown below: 15.1 Setting up PEAKS Q Parameters 1) In the Project View Frame, select a PEAKS Search result file. 2) Click the PEAKS quantification toolbar icon. Or Select Quantification from the Tools menu. The following window will open, displaying the quantification parameters:


108 Slightly different options will be available if you select labeling at the MS level: Quantification parameter options include the following: Basic Options Mass Error Tolerance: Quantification is based on the feature of a peptide that identifies its origin in the sample mixture. For example, in a SILAC experiment, one feature is unmodified peptides and the other is peptides modified with Label:13C(6) on arginine or lysine. For itraq, the feature would be reporter ion m/z value. The mass error tolerance is for pairing up features. Upper Bound of Precursor Charge: The peptide may present in different charges. Upper bound of precursor charge defines the maximum charge of peptides which are used for counting quantity. 107
 for precursors within a single data set.")
109 Retention Time Range: The retention time range is for pairing up features. For itraq, it is optional. Labeling Options Labeling occurs at the MS/MS level e.g. ITRAQ: It is for quantification based on the relative intensities of fragment peaks at fixed m/z values within an MS/MS spectrum. Labeling occurs at the M level e.g. ICAT: It is for quantification based on the relative intensities of extracted ion chromatograms (XICs) for precursors within a single data set. Label-free: It is for quantification based on the relative intensities of extracted ion chromatograms (XICs) for precursors in multiple data sets aligned using mass and elution time. Sample: It is for specifying sample name. Reporter ion: It is for specifying mass of reporter ion Added Mass: The modified mass of a residue. Residues: The residue to be modified. Labeling efficiency: It is for specifying efficiency of chemical reaction. Add label: It is used to add a label. Delete label: It is used to delete a label D View In order to produce a 3D view, you must first select this in your preferences. 1) Click on the Preferences toolbar icon. or select Preferences from the Windows menu. 2) Select General from the panel on the left hand side. 3) Select Performance and check the Show 3D View box. 4) Click Apply. 108

110 When a PEAKS Quantification run is complete, a 3D View tab can be found in the Peptide View window: Click the Apply button to change the 3D view to your specified values. Check the Auto button and click Apply to the default numbers itraq Walkthrough Isobaric tagging for relative and absolute quantification (itraq) uses isotopic labeling to enable relative quantitative comparisons. Up to eight different proteomic samples can be labeled using eight different isobaric tags. 1) Creating a Project Click on the Create new project icon or select the New project from the File menu. The following window will appear: The 3D view contains 3 axes: intensity, m/z ratio and scan number. The panel along the bottom allows you to narrow in on the peptides that you would like to examine. You can specify a particular scan number range, m/z range or intensity range. 109


111 Give your project a name, such as itraq Sample. Then click Next. The following window will appear. Give your sample a name such as itraq 1. Click the Add a file for this sample button and select the file C:/PEAKS 5/Data/iTRAQSample.mzx ml. Click OK to add this to the list of selected files. For cases where you want to add another sample to the project, select Add another sample and repeat these last two steps. In our case we are not going to add any more samples, so we can just click Next. The following section will tell PEAKS which type of mass spectrometer was used to generate the data. This sample was derived from a Quad-TOF. Click the box beside Quad-TOF to select this instrument. Upon clicking Next a sample project will be created. Your Main Processing Screen should look something like this: 110

112 2) Running data refinement In the Project View Frame, select itraqsample.mzxml. Click the data refinement tool or select Data Refine from the Tools menu. Enter the following parameters shown below and click OK. 111

113 3) Running PEAKS Search Click the PEAKS Search toolbar icon or select PEAKS Search from the Tools menu. The Protein Identification Parameters dialogue window will appear. Input the parameters as following. 112
 Running Quantification Select the PEAKS Search result file, and click the PEAKS")
114 Click OK. This will launch PEAKS Protein ID and when completed the results will appear, as below: 4) Running Quantification Select the PEAKS Search result file, and click the PEAKS Quantification toolbar icon or selecting Quantification from the Tools menu. The quantification parameters window will open. Enter the parameters as shown below and click OK. 113


115 derivation of Once completed, the protein quantification result will be displayed in the same PEAKS Protein ID result window that you selected earlier. The results are listed as a Ratio of : and as Standard Deviation of : They are highlighted in the red box below. For example the relative protein ratio for the top ranked protein is 4.73 with a standard 114


116 15.4 SILAC Walkthrough Stable isotope labeling with amino acids in cell culture (SILAC) is a method to metabolically label proteins for relative quantitative comparison. One cell population is fed amino acids of normal isotopic composition; the other cell population is fed amino acids labeled with heavier isotopes. The heavy amino acids are incorporated into newly synthesized proteins, eventually completely replacing the cells proteins, such that labeling efficiency is near 100%. The cell populations are then mixed together and digested for MS analysis to determine differential protein abundances. 1) Creating a project Click on the Create new project icon following window will appear: or select New project from the File menu. The Give your project a name, such as SILAC Sample. Then click Next. The following window will appear. Give yo ur sample a name such as SILAC 1. Click the Add a file for this sample button and select the file C:/PEAKS 5/Data/SILACSample.mzxml. Click OK to add this to the list of selected files. For cases where you want to add another sample to the project, select Add another sample and repeat these last two steps. In our case we are not going to add any more samples, so we can just click Next. 115


117 The following section will tell PEAKS which type of mass spectrometer was used to generate the data. This sample was derived from a Thermo LTQ Orbitrap. Click the box beside LTQ FT Ultra Hybrid FT-Trap to select this instrument. Upon clicking Next a sample project will be created. Your Main Processing Screen should look some thing like this: 116
118 2) Running Protein Identification 1) In the Project View Frame, select SILACSample.mzxml Click the data refinement tool select Data Refine from the Tools menu. Enter the parameters as shown below and click OK. or 3) Running Protein Identification Click the PEAKS Search toolbar icon or select PEAKS Search from the Tools menu. The Protein Identification Parameters dialogue window will appear. Enter the following parameters: 117


119 Click OK. This will launch PEAKS Protein ID and when completed click on the Protein View button. The results should appear similar, to those shown below: Note that the top protein result is Human Filamin A, with a score of 98.89%. 118


120 4) Running Quantification Select the PEAKS Protein ID result file, and click the PEAKS Quantification toolbar icon or selecting Quantification from the Tools menu. The quantification parameters window will open. Enter the parameters as shown below and click OK. Once completed, the protein quantification result will be displayed in the same PEAKS Protein ID result window that you selected earlier. The results are listed as a Ratio Heavy: Light and Standard Deviation Heavy: Light. They are highlighted in the red box below. For example, the highest ranked protein, Human Filamin-A has a ratio of 1.2 and a standard deviation of


121 There are four peptide features are identified and calculated for quantification of Human Filamin-A. PEAKS provides the 3D view of each peptide feature for visual validation. For example, spectrum 12 is among the feature of YGGQPVPNFPSK. Input the scan range of 25 ~ 28, and m/z range of 644 ~ 652. Click the button of Apply. The 3D view of the feature is displayed Label Free Quantification (Available in future) Label Free quantification relies on the changes in analyte signals directly reflecting their concentrations in one sample relative to another. This technology employs overall spectral intensity normalization by interpreting signals of molecules that do not change concentration from sample to sample. By comparing two or more spectra, PEAKS can determine the constant intensity ratio between the unchanging analytes forms the basis for identifying the non-changing concentrations, making spiking unnecessary. 120
122 Chapter References De novo Bin Ma, Kaizhong Zhang, Christopher Hendrie, Chengzhi Liang, Ming Li, Amanda Doherty-Kirby, Gilles Lajoie. PEAKS: Powerful Software for Peptide De novo Sequencing by MS/MS. Rapid Communications in Mass Spectrometry, 17(20): SPIDER Y. Han, B. Ma, and K. Zhang. SPIDER: Software for Protein Identification from Sequence Tags Containing De novo Sequencing Error. Journal of Bioinformatics and Computational Biology 3(3): Quantification Yang, W., Chen, W., Rogers, I., Ma, B., Bendall, S., Lajoie, G., Smith, D., PEAKS Q: Software for MSbased quantification of stable isotope labeled peptides. Bioinformatics Solutions Inc., Genome BC Proteomics Centre, University of Western Ontario. ASMS 2006 poster WP531.
123 Chapter Appendix 18.1 Terminology and Abbreviations Glossary a-ions: an N-terminal fragment holding at least one charge. This is a fragment of the peptide derived from b-ions. The a-ion s mass will be the sum of the masses of the N terminal group, plus the intervening neutral amino acid residues, subtract the mass of carbon monoxide. b-ions: an N-terminal fragment holding at least one charge. This is a prefix fragment of the peptide. The b-ion s mass will be the sum of the masses of the N terminal group, plus the intervening neutral amino acid residues. BSI (Bioinformatics Solutions Inc.): The makers of PEAKS and other fine bioinformatics software. c-ions: an N-terminal fragment holding at least one charge. This is a prefix fragment of the peptide. The c-ion s mass will be the sum of the masses of the N terminal group, plus the intervening neutral amino acid residues, plus the mass of ammonia. Deconvolution: rearrangement of the spectrum to show each monoisotopic peak as if it were singly charged. Thus, to reposition them on the scale, PEAKS multiplies the m/z of ion s that were doubly charged by two minus the mass of 1 H. Note that the deconvolved scale PEAKS shows is at +1. Fixed modification: selecting a post-translational modification as a fixed modification tells PEAKS that this modification is applied to all occurrences of the residue(s) on which the PTM can occur. Enzyme: Biomolecules that catalyze chemical reactions, including the digestion of proteins. ESI (Electrospray Ionization): A method for ionizing a sample into the mass spectrometer. m/z: mass to charge ratio. MALDI (Matrix-Assisted Laser Desorption/Ionization): A method for ionizing a sample into the mass spectrometer. This has a characteristic effect of producing singly charged ions. Mass accuracy: this refers to the accuracy of data obtained from a given mass spectrometer. On a spectrum, this is reflected by how close the peaks are to the actual masses of the ions they represent.
124 PTM (Post-Translational Modification): A newly translated protein may differ from its final form as a result of processing by various enzymes in the cellular environment. This change is referred to as a post-translational modification. Since PTMs change the mass of residues, it must be accounted for when sequencing peptides by mass spectrometry. Built-in PTM: PEAKS comes equipped with a library of possible post-translational modifications. These can be incorporated into a de novo analysis at the click of a button. Customized PTM: If the post-translational modification you are looking for is not in the PEAKS PTM set, you may create our own entry, or modify an existing one. This will appear as a customized PTM in the set. PTM library: A listing of all possible (built-in and custom entered) post-translational modifications that PEAKS can use as a part of its analysis. Residue: as used in this manual, a residue refers to what remains of an amino acid once it has become part of a peptide, or peptide fragment. In this manual, residues are referred to by their original amino acid names. Resolution: refers to the resolving power of an instrument. On a spectrum, this is reflected by how close together two peaks can be and still be resolved. Variable modification: selecting a post-translational modification as a variable modification tells PEAKS that this modification may or may not be applied to the residue(s) on which the PTM can occur. x-ions: a C terminal fragment holding at least one charge. The x-ion s mass will be the sum of the masses of the C terminal group, plus the intervening neutral amino acid residues, plus the mass of carbon monoxide. y-ions: a C terminal fragment holding at least one charge. The y-ion s mass will be the sum of the masses of the C terminal group, plus the intervening neutral amino acid residues, plus the mass of 2 H. z-ions: a C terminal fragment holding at least one charge. The z-ion s mass will be the sum of the masses of the N terminal group, plus the intervening neutral amino acid residues, after subtracting the mass of ammonia Toolbars Main Window Toolbar New File: This allows you to open a new data file created by the mass spectrometer in its native format, or a PEAKS data file (in ANZ format) that also contains peptide analysis data. Other accepted file formats include PKL, DTA, MGF or ANZ. Close File: Selecting this icon will remove the presently selected data file from its project. 123
125 New Project: Clicking the New Project button will allow users to create a brand new project, offering organization to any study. Open Recent Project: The quickest method to recalling an existing project. Users are instantly directed to a selection of recently created, modified or viewed PEAKS projects. Close Project: When a project is complete or a user temporarily no longer is working on a particular project, users can click this icon to remove it from their Project View. Save As: The project method of PEAKS allows for all results to be automatically constantly saved. However, if a user wishes to save a particular application under a new heading this is the most convenient and appropriate way to do so. Just click the icon and enter the new title in the field provided. The file will be saved in the ANZ format. Press this after selecting a data file in the Peptide Data Frame. Print: Whether a user desires to print their ms spectrum views to complement a publication or print matrices, the print feature offers a straight forward connection to any printer configured to the user s computer. Export: Easily export the spectrum view, ion table, or a picture (bmp, gif, or jpg format) with ions, masses, PEAKS and peptides marked. Exit: To exit from the PEAKS software safely, select this icon or press on the keyboard the Control key simultaneously with the letter Q. Data Refine: Merge scans of the same peptide, remove noise spectra, preprocess within each MS/MS spectrum and recover peptide charge state. The data refinement options dialogue will allow us to choose and to set parameters for each of these refinement tools. De novo: Perform auto de novo for a selected data file, spectrum or project. Press this after selecting one or more data files (or spectra) in the Peptide Data Frame. An auto de novo options dialogue will allow users to set parameters before beginning. PEAKS Search: Perform protein identification on a selected data project. Press this after selecting one or more data files (or spectra) in the Peptide Data Frame. A protein identification options dialogue will allow users to set parameters. SPIDER Search: Peptide homologue search tool. PTM Finder: A PTM finder search can be performed on any PEAKS Protein ID and allows the user to be able to identify more PTMs in less time. 124
126 inchorus Search: inchorus, a meta protein identification tool, can be used to compare and validate results, calling upon such search engines as Mascot, OMSSA, PEAKS, Sequest and X!Tandem, as well as SPIDER. Click this icon to set a task to have inchorus perform a user s analysis easily. Quantification: Where users require abundance ratio results, PEAKS Q provides insight. Click here to analyze results from ICAT, itraq, Label Free, SILAC, N-terminal and User Defined Labeling techniques. Configuration: Set up enzymes, post translational modifications, databases, instruments and parameters. Preferences: Organize general properties such as directories, search engines and ion editing capabilities. Mass Calculator: The Mass Calculator is a simple tool to help us determine the molecular weight of a peptide. Clicking this icon will make the mass calculator appear. Project View The project view allows optimal organization and greater control when managing multiple files at once. As different projects may be active at once, it is important to understand the different categories and levels presented by PEAKS. Tree Root Project Node Filter Result Sample Node File Node Combine Results Compare Results Search Engines: Within the Project View, these icons are used to represent which method/search engine a particular file was interpreted by. Mascot OMSSA Sequest X!Tandem Main Processing Window Toolbar Profile Mode Peak Mode Return to original size 125

127 Zoom X-axis Zoom Y-axis 18.3 Mass Calculator Click the Mass Calculator icon on the toolbar Or choose Mass Calculator from the Tools menu. The following window will appear: In order to use the mass calculator input the peptide sequence or enter the mass in Daltons. Indicate if the sequence contains b- or -y ions or if your search is non-specific. For example select b-ion, input the sequence ACDR and click the Calculate button. You should see the following: You can change the charge and use the arrow on the right to calculate the precursor mass or use the arrow on the left to calculate the peptide mass. Or for another example, change the margin of error to 1 Da, input a mass of 146 Da and click the Calculate button. In the sequences box you should see the following predicted sequences: 126

128 Use the Clear button to start again. Advanced Options Clicking on the Advanced button will display the following: You will now be able to add various modifications to your amino acid sequence. For example, enter A, M, then select Oxidation on M from the PTM list and click the PTM button. Then click the Calculate button. You should see the following: To view additional PTMs from the unimod list, select the unimod box. You can delete a PTM using the Delete PTM button. You can also edit or create a new PTM using the Edit PTM or New PTM buttons, respectively. You can also use the advanced options menu to add a water or proton to your sequence. The Back button will remove the last amino acid or modification that you have added to your sequence or click on the Clear button to start again. 127
129 Chapter About Bioinformatics Solutions Inc. BSI provides advanced software tools for analysis of biological data. Bioinformatics Solutions Inc. develops advanced algorithms based on innovative ideas and research, providing solutions to fundamental bioinformatics problems. This small, adaptable group is committed to serving the needs of pharmaceutical, biotechnological and academic scientists and to the progression of drug discovery research. The company, founded in 2000 in Waterloo, Canada, comprises a select group of talented, award-winning developers, scientists and sales people. At BSI, groundbreaking research and customer focus go hand in hand on our journey towards excellent software solutions. We value an intellectual space that fosters learning and an understanding of current scientific knowledge. With an understanding of theory, we can focus our talents on providing solutions to difficult, otherwise unsolved problems that have resulted in research bottlenecks. At BSI, we are not satisfied with a solution that goes only partway to solving these problems; our solutions must offer something more than existing software. The BSI team recognizes that real people will use our software tools. As such, we hold in principle that it is not enough to develop solely on theory; we must develop with customer needs in mind. We believe the only solution is one that incorporates quality and timely results, a satisfying product experience, customer support and two-way communication. So then, we value market research, development flexibility and company-wide collaboration, evolving our offerings to match the market/user s needs. Efficient and concentrated research, development, customer focus and market analysis have produced: PEAKS software for protein and peptide identification from tandem mass spectrometry data, RAPTOR and PROSPECT Pro software for threading based 3D protein structure prediction and PatternHunter software for all types of homology search sequence comparison. 128
130 Chapter PEAKS Software License This is the same agreement presented on installation. It is provided here for reference only. If we are evaluating a time limited trial version of PEAKS and we wish to update the software to the full version, we must purchase PEAKS and obtain a full version registration key. 1. License. Subject to the terms and conditions of this Agreement, Bioinformatics Solutions (BSI) grants to you (Licensee) a non-exclusive, perpetual, non-transferable, personal license to install, execute and use one copy of PEAKS (Software) on one single CPU at any one time. Licensee may use the Software for its internal business purposes only. 2. Ownership. The Software is a proprietary product of BSI and is protected by copyright laws and international copyright treaties, as well as other intellectual property laws and treaties. BSI shall at all times own all right, title and interest in and to the Software, including all intellectual property rights therein. You shall not remove any copyright notice or other proprietary or restrictive notice or legend contained or included in the Software and you shall reproduce and copy all such information on all copies made hereunder, including such copies as may be necessary for archival or backup purposes. 3. Restrictions. Licensee may not use, reproduce, transmit, modify, adapt or translate the Software, in whole or in part, to others, except as otherwise permitted by this Agreement. Licensee may not reverse engineer, decompile, disassemble, or create derivative works based on the Software. Licensee may not use the Software in any manner whatsoever with the result that access to the Software may be obtained through the Internet including, without limitation, any web page. Licensee may not rent, lease, license, transfer, assign, sell or otherwise provide access to the Software, in whole or in part, on a temporary or permanent basis, except as otherwise permitted by this Agreement. Licensee may not alter, remove or cover proprietary notices in or on the Licensed Software, or storage media or use the Licensed Software in any unlawful manner whatsoever. 4. Limitation of Warranty. THE LICENSED SOFTWARE IS PROVIDED AS IS WITHOUT ANY WARRANTIES OR CONDITIONS OF ANY KIND, INCLUDING BUT NOT LIMITED TO WARRANTIES OR CONDITIONS OF MERCHANTABILITY OR FITNESS FOR A PARTICULAR PURPOSE. LICENSEE ASSUMES THE ENTIRE RISK AS TO THE RESULTS AND PERFORMANCE OF THE LICENSED SOFTWARE. 5. Limitation of Liability. IN NO EVENT WILL LICENSOR OR ITS SUPPLIERS BE LIABLE TO LICENSEE FOR ANY INDIRECT, INCIDENTAL, SPECIAL, OR CONSEQUENTIAL
131 DAMAGES WHATSOEVER, EVEN IF THE LICENSOR OR ITS SUPPLIERS HAVE BEEN ADVISED OF THE POSSIBILITY OF SUCH DAMAGE OR CLAIM, OR IT IS FORESEEABLE. LICENSOR'S MAXIMUM AGGREGATE LIABILITY TO LICENSEE SHALL NOT EXCEED THE AMOUNT PAID BY LICENSEE FOR THE SOFTWARE. THE LIMITATIONS OF THIS SECTION SHALL APPLY WHETHER OR NOT THE ALLEGED BREACH OR DEFAULT IS A BREACH OF A FUNDAMENTAL CONDITION OR TERM. 6. Termination. This Agreement is effective until terminated. This Agreement will terminate immediately without notice if you fail to comply with any provision of this Agreement. Upon termination, you must destroy all copies of the Software. Provisions 2,5,6,7 and 10 shall survive any termination of this Agreement. 7. Export Controls. The Software is subject at all times to all applicable export control laws and regulations in force from time to time. You agree to comply strictly with all such laws and regulations and acknowledge that you have the responsibility to obtain all necessary licenses to export, re-export or import as may be required. 8. Assignment. Customer may assign Customer's rights under this Agreement to another party if the other party agrees to accept the terms of this Agreement, and Customer either transfer all copies of the Program and the Documentation, whether in printed or machine-readable form (including the original), to the other party, or Customer destroy any copies not transferred. Before such a transfer, Customer must deliver a hard copy of this Agreement to the recipient. 9. Maintenance and Support. BSI will provide technical support for a period of thirty (30) days from the date the Software is shipped to Licensee. Further maintenance and support is available to subscribers of BSI's Maintenance plan at BSI's then current rates. Technical support is available by phone, fax and between the hours of 9 am and 5 pm, Eastern Time, excluding statutory holidays. 10. Governing Law. This Agreement shall be governed by and construed in accordance with the laws in force in the Province of Ontario and the laws of Canada applicable therein, without giving effect to conflict of law provisions and without giving effect to United Nations Convention on contracts for the International Sale of Goods. 130
132
PEAKS Studio 5.1 User s Manual
 BIOINFORMATICS SOLUTIONS INC. PEAKS Studio 5.1 User s Manual Bioinformatics Solutions Inc. 470 Weber St. N. Suite 204 Waterloo, Ontario, Canada N2L 6J2 Phone 519-885-8288 Fax 519-885-9075 Please contact
PEAKS 4.2 User s Manual
 B I O I N F O R M A T I C S S O L U T I O N S I N C PEAKS 4.2 User s Manual PEAKS Studio (S) PEAKS Client (C) PEAKS Viewer (V) Bioinformatics Solutions Inc. 470 Weber St. N. Suite 204 Waterloo, Ontario,
Agilent G2721AA Spectrum Mill MS Proteomics Workbench Quick Start Guide
 Agilent G2721AA Spectrum Mill MS Proteomics Workbench Quick Start Guide A guide to the Spectrum Mill workbench Use this reference for your first steps with the Spectrum Mill workbench. What is the Spectrum
Skyline Targeted Method Editing
 Skyline Targeted Method Editing This tutorial will cover many of the features available in the Skyline Targeted Proteomics Environment for creating new instrument methods for Selected Reaction Monitoring
Tutorial 2: Analysis of DIA/SWATH data in Skyline
 Tutorial 2: Analysis of DIA/SWATH data in Skyline In this tutorial we will learn how to use Skyline to perform targeted post-acquisition analysis for peptide and inferred protein detection and quantification.
This manual describes step-by-step instructions to perform basic operations for data analysis.
 HDXanalyzer User Manual The program HDXanalyzer is available for the analysis of the deuterium exchange mass spectrometry data obtained on high-resolution mass spectrometers. Currently, the program is
Note: Note: Input: Output: Hit:
 MS/MS search 8.9 i The ms/ms search of GPMAW is based on the public domain search engine X! Tandem. The X! Tandem program is a professional class search engine; Although it is able to perform proteome
TraceFinder Analysis Quick Reference Guide
 TraceFinder Analysis Quick Reference Guide This quick reference guide describes the Analysis mode tasks assigned to the Technician role in the Thermo TraceFinder 3.0 analytical software. For detailed descriptions
Protein Deconvolution Quick Start Guide
 Protein Deconvolution Quick Start Guide The electrospray ionization (ESI) of intact peptides and proteins produces mass spectra containing a series of multiply charged ions with associated mass-to-charge
Tutorial 7: Automated Peak Picking in Skyline
 Tutorial 7: Automated Peak Picking in Skyline Skyline now supports the ability to create custom advanced peak picking and scoring models for both selected reaction monitoring (SRM) and data-independent
Progenesis LC-MS Tutorial Including Data File Import, Alignment, Filtering, Progenesis Stats and Protein ID
 Progenesis LC-MS Tutorial Including Data File Import, Alignment, Filtering, Progenesis Stats and Protein ID 1 Introduction This tutorial takes you through a complete analysis of 9 LC-MS runs (3 replicate
GPS Explorer Software For Protein Identification Using the Applied Biosystems 4700 Proteomics Analyzer
 GPS Explorer Software For Protein Identification Using the Applied Biosystems 4700 Proteomics Analyzer Getting Started Guide GPS Explorer Software For Protein Identification Using the Applied Biosystems
MRMPROBS tutorial. Hiroshi Tsugawa RIKEN Center for Sustainable Resource Science
 MRMPROBS tutorial Edited in 2014/10/6 Introduction MRMPROBS is a tool for the analysis of data from multiple reaction monitoring (MRM)- or selected reaction monitoring (SRM)-based metabolomics studies.
Skyline Targeted MS/MS
 Skyline Targeted MS/MS Skyline now supports several methods of extracting chromatography-based quantitative measurements from the raw data files of full-scan mass spectrometers, such as ion trap and Q-TOF
Using Galaxy-P Documentation
 Using Galaxy-P Documentation Release 0.1 John Chilton, Pratik Jagtap October 26, 2015 Contents 1 Introduction 1 2 Galaxy-P 101 - Building Up and Using a Proteomics Workflow 3 2.1 What Are We Trying to
Skyline MS1 Full Scan Filtering
 Skyline MS1 Full Scan Filtering The Skyline Targeted Proteomics Environment provides informative visual displays of the raw mass spectrometer data you import into your Skyline project. These displays allow
Agilent MassHunter Qualitative Data Analysis
 Agilent MassHunter Qualitative Data Analysis Qualitative Navigator B.08.00 Presenters: Kevin Costalunga Stephen Harnos With Matt Leyden & Kevin Costalunga 1 MassHunter Webinar Series MassHunter Qualitative
MSFragger Manual. (build )
") MSFragger Manual (build 20170103.0) Introduction MSFragger is an ultrafast database search tool for peptide identifications in mass spectrometry-based proteomics. It differs from conventional search engines
MSFragger Manual (build 20170103.0) Introduction MSFragger is an ultrafast database search tool for peptide identifications in mass spectrometry-based proteomics. It differs from conventional search engines
Panorama Sharing Skyline Documents
 Panorama Sharing Skyline Documents Panorama is a freely available, open-source web server database application for targeted proteomics assays that integrates into a Skyline proteomics workflow. It has
Agilent G2721AA/G2733AA Spectrum Mill MS Proteomics Workbench
 Agilent G2721AA/G2733AA Spectrum Mill MS Proteomics Workbench Quick Start Guide What is the Spectrum Mill MS Proteomics Workbench? 2 What s New in Version B.06.00? 3 Where to Find More Information 9 Setting
Spectrometer Visible Light Spectrometer V4.4
 Visible Light Spectrometer V4.4 Table of Contents Package Contents...3 Trademarks...4 Manual Driver and Application installation...5 Manual Application Installation...6 First Start of the Application...8
PROTEOMIC COMMAND LINE SOLUTION. Linux User Guide December, B i. Bioinformatics Solutions Inc.
 >_ PROTEOMIC COMMAND LINE SOLUTION Linux User Guide December, 2015 B i Bioinformatics Solutions Inc. www.bioinfor.com 1. Introduction Liquid chromatography-tandem mass spectrometry (LC-MS/MS) based proteomics
SequencePro Data Analysis Application. User Guide
 SequencePro Data Analysis Application User Guide SequencePro Data Analysis Application User Guide DRAFT October 31, 2001 12:52 pm, Title_page.fm Copyright 2001, Applied Biosystems. All rights reserved.
De Novo Peptide Identification
 De Novo Peptide Identification When a suitable sequence database is not available for your sample of interest, identification of your acquired fragmentation mass spectra becomes quite difficult. Indeed,
QuiC 1.0 (Owens) User Manual
 User Manual") QuiC 1.0 (Owens) User Manual 1 Contents 2 General Information... 2 2.1 Computer System Requirements... 2 2.2 Scope of QuiCSoftware... 3 2.3 QuiC... 3 2.4 QuiC Release Features... 3 2.4.1 QuiC 1.0... 3
QuiC 1.0 (Owens) User Manual 1 Contents 2 General Information... 2 2.1 Computer System Requirements... 2 2.2 Scope of QuiCSoftware... 3 2.3 QuiC... 3 2.4 QuiC Release Features... 3 2.4.1 QuiC 1.0... 3
MRMPROBS tutorial. Hiroshi Tsugawa RIKEN Center for Sustainable Resource Science MRMPROBS screenshot
 MRMPROBS tutorial Edited in 2016/11/16 Introduction MRMPROBS is launched as a universal program for targeted metabolomics using not only multiple reaction monitoring (MRM)- or selected reaction monitoring
Thermo Xcalibur Getting Started (Quantitative Analysis)
") Thermo Xcalibur Getting Started (Quantitative Analysis) XCALI-97207 Revision B September 2010 2010 Thermo Fisher Scientific Inc. All rights reserved. Xcalibur, Surveyor, and Accela are registered trademarks
Thermo Xcalibur Getting Started (Quantitative Analysis) XCALI-97207 Revision B September 2010 2010 Thermo Fisher Scientific Inc. All rights reserved. Xcalibur, Surveyor, and Accela are registered trademarks
Progenesis QI for proteomics User Guide. Analysis workflow guidelines for DDA data
 Progenesis QI for proteomics User Guide Analysis workflow guidelines for DDA data Contents Introduction... 3 How to use this document... 3 How can I analyse my own runs using Progenesis QI for proteomics?...
User Manual For SmartRoom Managers
 User Manual For SmartRoom Managers Table of Contents 1.0 Login 2.0 Confidentiality Agreement 3.0 Software Installation 4.0 Dashboard 5.0 Document Review and Index Maintenance 5.1 View by Index 5.1.1 Index
De Novo Pipeline : Automated identification by De Novo interpretation of MS/MS spectra
 De Novo Pipeline : Automated identification by De Novo interpretation of MS/MS spectra Benoit Valot valot@moulon.inra.fr PAPPSO - http://pappso.inra.fr/ 29 October 2010 Abstract The classical method for
Skyline Targeted Method Refinement
 Skyline Targeted Method Refinement This tutorial will introduce the features available in the Skyline Targeted Proteomics Environment for refining instrument methods for Selected Reaction Monitoring (SRM,
TAI Indicator Database User Instructions for Version 1.0
 TAI Indicator Database User Instructions for Version 1.0 Table of Contents QUICK HELP... 4 How do I get started?...4 Where can I find research guidelines and background information for this assessment?...5
Skyline irt Retention Time Prediction
 Skyline irt Retention Time Prediction Predicting peptide retention time has long been of interest in targeted proteomics. As early as version 0.2, Skyline integrated the SSRCalc hydrophobicity calculator
MASPECTRAS Users Guide
 MASPECTRAS Users Guide In this user guide every page and functionality is described in detail. To work with MASPECTRAS it is not necessary to read the whole document, because many things work similar to
Tour Guide for Windows and Macintosh
 Tour Guide for Windows and Macintosh 2011 Gene Codes Corporation Gene Codes Corporation 775 Technology Drive, Suite 100A, Ann Arbor, MI 48108 USA phone 1.800.497.4939 or 1.734.769.7249 (fax) 1.734.769.7074
Legal Notes. Regarding Trademarks KYOCERA MITA Corporation
 Legal Notes Unauthorized reproduction of all or part of this guide is prohibited. The information in this guide is subject to change without notice. We cannot be held liable for any problems arising from
Agilent MassHunter Metabolite ID Software. Installation and Getting Started Guide
 Agilent MassHunter Metabolite ID Software Installation and Getting Started Guide Notices Agilent Technologies, Inc. 2011 No part of this manual may be reproduced in any form or by any means (including
Progenesis CoMet User Guide
 Progenesis CoMet User Guide Analysis workflow guidelines for version 2.0 Contents Introduction... 3 How to use this document... 3 How can I analyse my own runs using CoMet?... 3 LC-MS Data used in this
Tutorial for the PNNL Biodiversity Library Skyline Plugin
 Tutorial for the PNNL Biodiversity Library Skyline Plugin Developed By: Michael Degan, Grant Fujimoto, Lillian Ryadinskiy, Samuel H Payne Contact Information: Samuel Payne (Samuel.Payne@pnnl.gov) Michael
Agilent Triple Quadrupole LC/MS Peptide Quantitation with Skyline
 Agilent Triple Quadrupole LC/MS Peptide Quantitation with Skyline Workflow Guide A Peptide Optimization B Review Results in Skyline Create QQQ method in Skyline Edit Skyline settings Import peptides into
Skyline High Resolution Metabolomics (Draft)
") Skyline High Resolution Metabolomics (Draft) The Skyline Targeted Proteomics Environment provides informative visual displays of the raw mass spectrometer data you import into your Skyline documents. Originally
Skyline High Resolution Metabolomics (Draft) The Skyline Targeted Proteomics Environment provides informative visual displays of the raw mass spectrometer data you import into your Skyline documents. Originally
Pinpoint Quick Start Guide
 Pinpoint Quick Start Guide Thermo Pinpoint, version 1.0 and later 1, targeted protein quantification software simplifies the creation of processing methods and helps you do the following: Select targeted
Very large searches present a number of challenges. These are the topics we will cover during this presentation.
 1 Very large searches present a number of challenges. These are the topics we will cover during this presentation. 2 The smartest way to merge files, like fractions from a MudPIT run, is using Mascot Daemon.
User Guide. Version
 User Guide Version 0.19 2-11-2008 StormPro Max User Guide Page 1 of 69 5/10/2008 Table of Contents 1. Overview... 4 1.1 Definition of StormPro Max Terms... 4 2. Accessing StormPro Max... 5 3. Navigating
Reference Manual MarkerView Software Reference Manual Revision: February, 2010
 Reference Manual MarkerView 1.2.1 Software Reference Manual - 1 - Revision: February, 2010 This document is provided to customers who have purchased AB SCIEX equipment to use in the operation of such AB
Skyline Targeted Method Refinement
 Skyline Targeted Method Refinement This tutorial will introduce the features available in the Skyline Targeted Proteomics Environment for refining instrument methods for Selected Reaction Monitoring (SRM,
Podium Plus Data Analysis Software. User Manual. SWIS10 Version
 SWIS10 Version Issue 1.10 February 2005 Contents 1 Introduction 6 1.1 What is Podium Plus? 6 1.2 About This Manual 6 1.3 Typographical Conventions 7 1.4 Getting Technical Support 7 2 Getting Started 8
CITO2 Installation & User Instructions
 CITO2 Installation & User Instructions DD 56107 Stoneridge Electronics Ltd 1. Installation...4 1.1. System Requirements...4 1.2. Installing CITO2...4 1.3. Uninstalling CITO2...4 2. Starting and closing
Spectronaut Pulsar X
 Spectronaut Pulsar X User Manual 1 General Information... 8 1.1 Scope of Spectronaut Pulsar X Software... 8 1.2 Spectronaut Pulsar X Release Features... 8 1.3 Computer System Requirements... 9 1.4 Post
Agilent RapidFire 300 High-throughput Mass Spectrometry System
 Agilent RapidFire 300 High-throughput Mass Spectrometry System Data Analysis Guide Installation 2 To install Agilent RapidFire Integrator software 2 Preparing Data Collected in Plates Mode for RapidFire
U.S. Pharmacopeia Pharmacopeial Forum. USP-PF Online Quick Start Guide
 U.S. Pharmacopeia Pharmacopeial Forum USP-PF Online Quick Start Guide Contents GETTING STARTED... 2 Document Conventions... 2 Technical Requirements... 2 LOGIN AND LOGOFF... 2 Logging On... 3 Logging Off...
KYOCERA Net Viewer User Guide
 KYOCERA Net Viewer User Guide Legal Notes Unauthorized reproduction of all or part of this guide is prohibited. The information in this guide is subject to change without notice. We cannot be held liable
Working with PDF s. To open a recent file on the Start screen, double click on the file name.
 Working with PDF s Acrobat DC Start Screen (Home Tab) When Acrobat opens, the Acrobat Start screen (Home Tab) populates displaying a list of recently opened files. The search feature on the top of the
Statistical Process Control in Proteomics SProCoP
 Statistical Process Control in Proteomics SProCoP This tutorial will guide you through the installation of SProCoP and using it to perform statistical analysis on a sample Skyline file. Getting Started
Mascot Insight is a new application designed to help you to organise and manage your Mascot search and quantitation results. Mascot Insight provides
 1 Mascot Insight is a new application designed to help you to organise and manage your Mascot search and quantitation results. Mascot Insight provides ways to flexibly merge your Mascot search and quantitation
Thank you for purchasing Qwizdom Remotes.
 Thank you for purchasing Qwizdom Remotes. Now that you ve received your set, you re probably thinking, What do I do now? We have prepared this quick-start guide to help you get up and running with your
Argosy University Online Programs, Version 7.0. digital bookshelf. Student User Guide
 Argosy University Online Programs, Version 7.0 digital bookshelf Student User Guide 1 Take your ebooks with you! Download the Bookshelf app. If you own an iphone, ipad, or ipod Touch, you can download
To get started download the dataset, unzip files, start Maven, and follow steps below.
 Getting Started. This document provides basic overview of Maven functionality. For the purpose of demonstration we will use an example CMV Viral Infection time course dataset. (Dataset Download). There
KMnet Viewer. User Guide
 KMnet Viewer User Guide Legal Notes Unauthorized reproduction of all or part of this guide is prohibited. The information in this guide is subject to change for improvement without notice. We cannot be
SpectroDive 8 - Coelacanth. User Manual
 SpectroDive 8 - Coelacanth User Manual Table of Contents 1 System Requirements... 4 2 General Information... 4 2.1 Supported Instruments... 4 3 Getting Started... 5 3.1 Getting SpectroDive... 5 3.2 SpectroDive
User Guide 701P Wide Format Solution Wide Format Scan Service
 User Guide 701P44865 6204 Wide Format Solution Wide Format Scan Service Xerox Corporation Global Knowledge & Language Services 800 Phillips Road Bldg. 845-17S Webster, NY 14580 Copyright 2006 Xerox Corporation.
Part 3: Setup of Client PC
 Version 2.2, January 16, 2013 Contents 1. Introduction... 3 1.1 Requirements of Client PC... 3 1.2 Flow Chart of Client PC Setup... 4 2. Setting of Windows OS... 5 2.1 Setting to Display File Type Extension
KYOCERA Net Viewer 5.3 User Guide
 KYOCERA Net Viewer. User Guide Legal Notes Unauthorized reproduction of all or part of this guide is prohibited. The information in this guide is subject to change without notice. We cannot be held liable
Q Exactive HF-X Software Manual
 Q Exactive HF-X Software Manual Exactive Series 2.9 BRE0012262 Revision A May 2017 Q Exactive HF-X Software Manual Exactive Series 2.9 BRE0012262 Revision A May 2017 Legal Notices 2017 Thermo Fisher Scientific
Proteomic data analysis using the TPP
 Proteomic data analysis using the TPP 2013 ASMS short course. Instructor: Alexey Nesvizhskii, University of Michigan, nesvi@umich.edu PART A: Tutorial on running the TPP This tutorial was written for the
TraceFinder Analysis Quick Reference Guide
 TraceFinder Analysis Quick Reference Guide This quick reference guide describes the Analysis mode tasks assigned to the Technician role in Thermo TraceFinder analytical software. For detailed descriptions
Calendar & Buttons Dashboard Menu Features My Profile My Favorites Watch List Adding a New Request...
 remitview User Guide 1 TABLE OF CONTENTS INTRODUCTION... 3 Calendar & Buttons... 3 GETTING STARTED.... 5 Dashboard.... 7 Menu Features... 8 PROFILE.... 10 My Profile... 10 My Favorites... 12 Watch List...
Skyline Collision Energy Optimization
 Skyline Collision Energy Optimization As of version 0.6, Skyline now supports a rich user interface and fully automated pipeline for predicting and optimizing SRM instrument parameters like collision energy
Note: The MS/MSALL with SWATH Acquisition MicroApp version 2.0 supports PeakView software versions 2.1 and later.
 MS/MS ALL with SWATH Acquisition MicroApp Add-in for PeakView Software Version 2.0.1 Introduction The MS/MS ALL with SWATH Acquisition MicroApp workflow provides a method for collecting MS/MS of all species
OpenLynx User's Guide
 OpenLynx User s Guide OpenLynx User's Guide Version 4.0 Waters part No 715000405 Micromass Part No - 6666670 5 February, 2002 i OpenLynx User s Guide OpenLynx User s Guide The software described in this
DocAve Content Shield v2.2 for SharePoint
 DocAve Content Shield v2.2 for SharePoint User Guide For SharePoint 2007 Revision A Issued August 2012 1 Table of Contents Table of Contents... 2 About DocAve Content Shield for SharePoint... 4 Complementary
BUCKVIEW Advanced. User Guide
 BUCKVIEW Advanced User Guide Inside This Manual I. Inside This Manual... 2 II. Viewing and Managing Your Images... 3 Manage Image Folders...5 Manage Sites...6 Manage Locations...10 Erase Memory Card...14
2 The Stata user interface
 2 The Stata user interface The windows This chapter introduces the core of Stata s interface: its main windows, its toolbar, its menus, and its dialogs. The five main windows are the Review, Results, Command,
Downloading TurningPoint Software
 Clickers Basic Windows Training Session Today s Session 1. Clickers Overview 2. Exercises (Hands On) Downloading TurningPoint Software TurningPoint software is available for free to all University of Iowa
Ecert Onsite: User Guide for Inspectors
 Introduction to Ecert Onsite 2 Description and Overview 2 Ecert Onsite Basics 2 How to Access Orders from MyCCOF 4 Check Out Orders 4 Check In Orders 6 Deleting Orders from Ecert Onsite 6 Open and Edit
TestAnyTime User Manual (Imaging) English Version
 English Version") TestAnyTime User Manual (Imaging) English Version 1 User Manual Notes & Notices Thank you for choosing TestAnyTime. This quick start guide will teach you the basics and have you up & running in a few minutes.
TestAnyTime User Manual (Imaging) English Version 1 User Manual Notes & Notices Thank you for choosing TestAnyTime. This quick start guide will teach you the basics and have you up & running in a few minutes.
irc Pro (Not for diagnostic use)
") irc Pro (Not for diagnostic use) User guide 2016 2 Table of Contents ircpro... 3 Overview... 3 Release notes... 4 Requirements... 5 Setup... 6 Setup by DVD... 7 Setup by Internet... 8 step 1 - Install
irc Pro (Not for diagnostic use) User guide 2016 2 Table of Contents ircpro... 3 Overview... 3 Release notes... 4 Requirements... 5 Setup... 6 Setup by DVD... 7 Setup by Internet... 8 step 1 - Install
Xcalibur Library Browser
 Thermo Xcalibur Library Browser User Guide Creating and Searching Spectral Libraries Software Version 3.0 XCALI-97552 Revision A June 2013 2013 Thermo Fisher Scientific Inc. All rights reserved. Xcalibur
Vol. 1 Introduction. OMS-100 User Manual. Publishing version: V2.2. Publishing version: V2.2 1
 Vol. 1 Introduction OMS-100 User Manual Publishing version: V2.2 Publishing version: V2.2 1 OMS-100 User Manual Table of Contents I Vol. 1 Introduction 5 2 1 Foreword... 5 1.1 Typographical Conventions...
IMPORTANT. Registration Settings: SERIAL NUMBER: COMPUTER ID: REGISTRATION NUMBER:
 IMPORTANT Registration Settings: SERIAL NUMBER: COMPUTER ID: REGISTRATION NUMBER: Once you have your TALITY software functioning properly copy your phone system settings onto this page and save it for
MassHunter File Reader
 MassHunter File Reader vers 1.0.0 2015 Quadtech Associates, Inc. All Rights Reserved Release date: November 18, 2015 www.quadtechassociates.com MassHunter File Reader Welcome to MassHunter File Reader.
IT Essentials v6.0 Windows 10 Software Labs
 IT Essentials v6.0 Windows 10 Software Labs 5.2.1.7 Install Windows 10... 1 5.2.1.10 Check for Updates in Windows 10... 10 5.2.4.7 Create a Partition in Windows 10... 16 6.1.1.5 Task Manager in Windows
Thermo Scientific. GRAMS Envision. Version 2.1. User Guide
 Thermo Scientific GRAMS Envision Version 2.1 User Guide 2013 Thermo Fisher Scientific Inc. All rights reserved. Thermo Fisher Scientific Inc. provides this document to its customers with a product purchase
Nintex Reporting 2008 Help
 Nintex Reporting 2008 Help Last updated: Thursday, 24 December 2009 1 Using Nintex Reporting 2008 1.1 Chart Viewer Web Part 1.2 Importing and Exporting Reports 1.3 Import Nintex report page 1.4 Item Level
Agilent 6400 Series Triple Quadrupole LC/MS System
 Agilent 6400 Series Triple Quadrupole LC/MS System Quick Start Guide Where to find information 4 Getting Started 6 Step 1. Start the Data Acquisition software 7 Step 2. Prepare the LC modules 13 Step 3.
VANGUARD LOAD TAP CHANGER ANALYZER (LTCA) VERSION 2.xx SOFTWARE MANUAL. LTCA-10, LTCA-40, WRM-10P, WRM-40, TRM-20, TRM-40, TRM-203, and TRM-403
 VERSION 2.xx SOFTWARE MANUAL. LTCA-10, LTCA-40, WRM-10P, WRM-40, TRM-20, TRM-40, TRM-203, and TRM-403") VANGUARD LOAD TAP CHANGER ANALYZER (LTCA) VERSION 2.xx SOFTWARE MANUAL For Use with Vanguard s LTCA-10, LTCA-40, WRM-10P, WRM-40, TRM-20, TRM-40, TRM-203, and TRM-403 Load Tap Changer Analyzers and Winding
VANGUARD LOAD TAP CHANGER ANALYZER (LTCA) VERSION 2.xx SOFTWARE MANUAL For Use with Vanguard s LTCA-10, LTCA-40, WRM-10P, WRM-40, TRM-20, TRM-40, TRM-203, and TRM-403 Load Tap Changer Analyzers and Winding
Multivariate Calibration Quick Guide
 Last Updated: 06.06.2007 Table Of Contents 1. HOW TO CREATE CALIBRATION MODELS...1 1.1. Introduction into Multivariate Calibration Modelling... 1 1.1.1. Preparing Data... 1 1.2. Step 1: Calibration Wizard
Corra v2.0 User s Guide
 Corra v2.0 User s Guide Corra is an open source software Licensed under the Apache License, Version 2.0 and it s source code, demo data and this guide can be downloaded at the http://tools.proteomecenter.org/corra/corra.html.
Project Report on. De novo Peptide Sequencing. Course: Math 574 Gaurav Kulkarni Washington State University
 Project Report on De novo Peptide Sequencing Course: Math 574 Gaurav Kulkarni Washington State University Introduction Protein is the fundamental building block of one s body. Many biological processes
DataPro Quick Start Guide
 DataPro Quick Start Guide Introduction The DataPro application provides the user with the ability to download and analyze data acquired using the ULTRA-LITE PRO range of Auto Meter products. Please see
You will remember from the introduction, that sequence queries are searches where mass information is combined with amino acid sequence or
 1 You will remember from the introduction, that sequence queries are searches where mass information is combined with amino acid sequence or composition information 2 The best known example is a sequence
SeeSnake HQ User Guide
 SeeSnake HQ User Guide SeeSnake HQ Version 1.53.85.1426 23 May 2010 About SeeSnake HQ 3 Digital Technology 3 Installation and Updates 5 Windows XP 5 Windows Vista 5 Windows 7 5 The Home Window 6 Home Toolbar
MacVector for Mac OS X
 MacVector 10.6 for Mac OS X System Requirements MacVector 10.6 runs on any PowerPC or Intel Macintosh running Mac OS X 10.4 or higher. It is a Universal Binary, meaning that it runs natively on both PowerPC
SAS Infrastructure for Risk Management 3.4: User s Guide
 SAS Infrastructure for Risk Management 3.4: User s Guide SAS Documentation March 2, 2018 The correct bibliographic citation for this manual is as follows: SAS Institute Inc. 2017. SAS Infrastructure for
Challenges of very large searches
 Challenges of very large searches 1 What is very large Number of spectra? Size of peak lists? Size of raw files? Size of fasta database? Mass of proteins? Size of organism (Blue Whale vs Thailand's bumblebee
USER MANUAL. > analyze. reduce. recover
 USER MANUAL > analyze > reduce > recover Table of Contents COPY AUDIT... 1 OVERVIEW... 1 IMPORTANT NOTES FOR PRINT AUDIT 4 CUSTOMERS... 1 COMMUNICATOR TECHNICAL NOTES... 2 COPY AUDIT SOFTWARE... 2 INSTALLING
DocAve Content Shield v2.2 for SharePoint
 DocAve Content Shield v2.2 for SharePoint User Guide For SharePoint 2010 Revision A Issued August 2012 1 Table of Contents Table of Contents... 2 About DocAve Content Shield for SharePoint... 4 Complementary
Progenesis CoMet User Guide
 Progenesis CoMet User Guide Analysis workflow guidelines for version 1.0 Contents Introduction... 3 How to use this document... 3 How can I analyse my own runs using CoMet?... 3 LC-MS Data used in this
Series 6 Technical Admin Guide Page 1
 Series 6 Technical Admin Guide Page 1 TABLE OF CONTENTS PRODUCT REGISTRATION... 6 Free Trial Registration and the Wizard...7 How the Trial Works...8 Register Invu Document Management...8 Privileges for
EZCT-2000 Software. VERSION 2.x USER'S MANUAL
 EZCT-2000 Software VERSION 2.x USER'S MANUAL For Use with Vanguard s EZCT-S2, EZCT-S2A, EZCT-2000, EZCT-2000A, EZCT-2000B, EZCT-2KA, EZCT-2000C Current Transformer Testers Vanguard Instruments Company,