LAMPIRAN. Sampel Penelitian
|
|
|
- Maryann Joseph
- 6 years ago
- Views:
Transcription
1 LAMPIRAN Lampiran 1 Daftar Perusahaan Sampel Penelitian No. Kode Kriteria Perusahaan Sampel 1 ADES 1 2 AISA 2 3 ALTO 4 CEKA 5 DAVO 6 DLTA 3 7 ICBP 4 8 INDF 5 9 MLBI 6 10 MYOR 11 PSDN 7 12 ROTI 8 13 SKBM 14 SKLT 9 15 STTP 16 ULTJ 10 57
2 Lampiran 2 Data Penelitian TAHUN KODE DALAM PERSEN (%) WCTO CR ROA ADES AISA DLTA ICBP INDF MLBI PSDN ROTI SKLT ULTJ ADES AISA DLTA ICBP INDF MLBI PSDN ROTI SKLT ULTJ ADES AISA DLTA ICBP INDF MLBI PSDN ROTI SKLT ULTJ
3 TAHUN KODE DALAM PERSEN (%) WCTO CR ROA ADES AISA DLTA ICBP INDF MLBI PSDN ROTI SKLT ULTJ ADES AISA DLTA ICBP INDF MLBI PSDN ROTI SKLT ULTJ
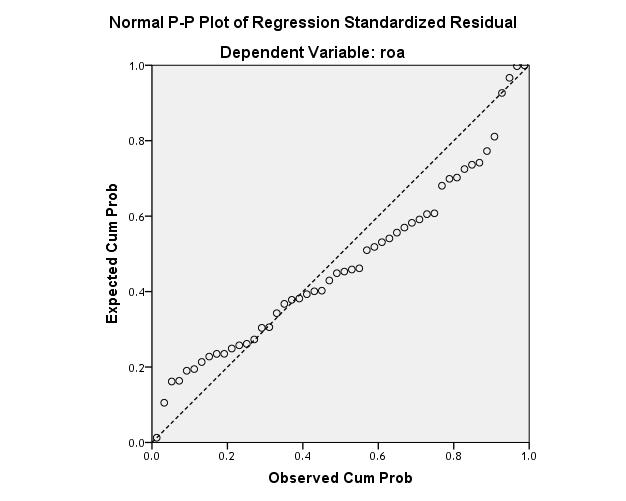
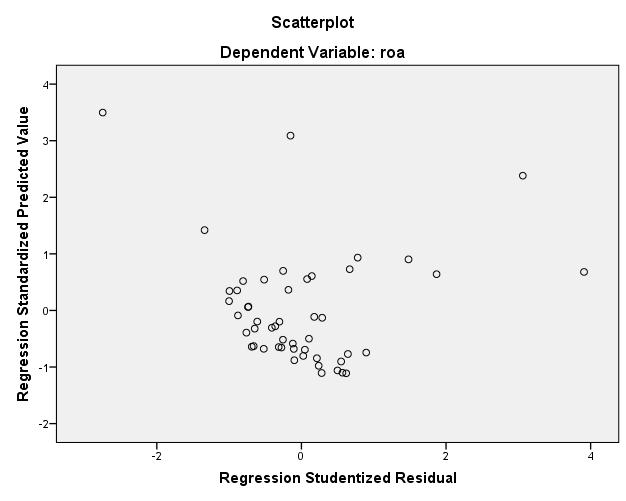
4 Lampiran 3 Uji Asumsi Klasik dan Analisis Regresi Linear Berganda REGRESSION /DESCRIPTIVES MEAN STDDEV CORR SIG N /MISSING LISTWISE /STATISTICS COEFF OUTS BCOV R ANOVA COLLIN TOL /CRITERIA=PIN(.05) POUT(.10) /NOORIGIN /DEPENDENT roa /METHOD=ENTER wcto cr /SCATTERPLOT=(*ZPRED,*SRESID) /RESIDUALS DURBIN HISTOGRAM(ZRESID) NORMPROB(ZRESID) /SAVE RESID. Regression Output Created Comments Input Missing Value Handling Notes Active Dataset Filter Weight Split File N of Rows in Working Data File Definition of Missing Cases Used DataSet0 30-JAN :17:44 50 User-defined missing values are treated as missing. Statistics are based on cases with no missing values for any variable used. 60
5 REGRESSION /DESCRIPTIVES MEAN STDDEV CORR SIG N /MISSING LISTWISE /STATISTICS COEFF OUTS BCOV R ANOVA COLLIN TOL Syntax Resources Variables Created or Modified /CRITERIA=PIN(.05) POUT(.10) /NOORIGIN /DEPENDENT roa /METHOD=ENTER wcto cr /SCATTERPLOT=(*Z PRED,*SRESID) /RESIDUALS DURBIN HISTOGRAM(ZRESI D) NORMPROB(ZRESI D) /SAVE RESID. Processor Time 00:00:04.91 Elapsed Time 00:00:10.10 Memory Required 1644 bytes Additional Memory Required for 904 bytes Residual Plots Unstandardized RES_1 Residual [DataSet0] Descriptive Statistics 61
6 Mean Std. Deviation roa wcto cr N Pearson Correlation Sig. (1-tailed) N Correlations roa wcto cr roa wcto cr roa wcto cr roa wcto cr Mode l Variables Entered/Removed a Variables Entered Variables Removed Method 1 cr, wcto b. Enter a. Dependent Variable: roa b. All requested variables entered. Mode l R R Square Model Summary b Adjusted R Square Std. Error of the Estimate Durbin- Watson a
7 a. Predictors: (Constant), cr, wcto b. Dependent Variable: roa ANOVA a Model 1 Sum of Squares df Mean Square F Sig. Regression b Residual Total a. Dependent Variable: roa b. Predictors: (Constant), cr, wcto Coefficients a Model 1 Model 1 Unstandardized Coefficients Standardize d Coefficients B Std. Error Beta t Sig. (Constant) wcto cr Coefficients a (Constant) a. Dependent Variable: roa Collinearity Statistics Tolerance VIF wcto cr Coefficient Correlations a Model cr wcto 1 Correlations cr wcto Covariances cr wcto a. Dependent Variable: roa 63
8 Mode l 1 Collinearity Diagnostics a Dimension Eigenvalue Condition Index Variance Proportions (Constant) wcto cr a. Dependent Variable: roa Residuals Statistics a Minimum Maximum Mean Std. Deviation Predicted Value Std. Predicted Value Standard Error of Predicted Value Adjusted Predicted Value Residual Std. Residual Stud. Residual Deleted Residual Stud. Deleted Residual Mahal. Distance Cook's Distance Centered Leverage Value a. Dependent Variable: roa N Charts 64
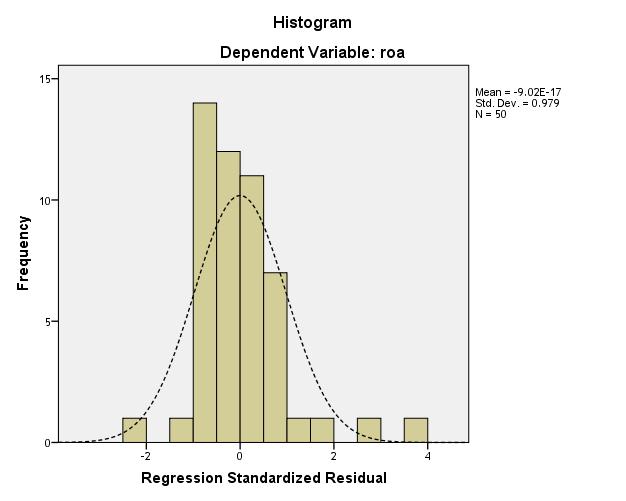
9 65
10 66
11 67
12 NPar Tests Output Created Comments Input Missing Value Handling Syntax Resources Notes Active Dataset Filter Weight Split File N of Rows in Working Data File DataSet0 30-JAN :18:51 50 User-defined missing Definition of Missing values are treated as missing. Statistics for each test are based on all Cases Used cases with valid data for the variable(s) used in that test. NPAR TESTS /K- S(NORMAL)=RES_1 /MISSING ANALYSIS. Processor Time 00:00:00.00 Elapsed Time 00:00:00.08 Number of Cases Allowed a a. Based on availability of workspace memory. 68
13 [DataSet0] One-Sample Kolmogorov-Smirnov Test Unstandardi zed Residual N 50 Mean 0E-7 Normal Parameters a,b Std Deviation 9 Absolute.150 Most Extreme Positive.150 Differences Negative Kolmogorov-Smirnov Z Asymp. Sig. (2-tailed).208 a. Test distribution is Normal. b. Calculated from data. 69
14 Descriptives Output Created Comments Input Missing Value Handling Syntax Notes Active Dataset Filter Weight Split File N of Rows in Working Data File Definition of Missing Cases Used DataSet0 30-JAN :20:25 50 User defined missing values are treated as missing. All non-missing data are used. DESCRIPTIVES VARIABLES=wcto cr roa Resources /STATISTICS=MEAN STDDEV MIN MAX. Processor Time 00:00:00.02 Elapsed Time 00:00:00.02 [DataSet0] Descriptive Statistics N Minimum Maximum Mean Std. Deviation wcto cr roa Valid N (listwise) 50 70
CDAA No. 4 - Part Two - Multiple Regression - Initial Data Screening
 CDAA No. 4 - Part Two - Multiple Regression - Initial Data Screening Variables Entered/Removed b Variables Entered GPA in other high school, test, Math test, GPA, High school math GPA a Variables Removed
TABEL DISTRIBUSI DAN HUBUNGAN LENGKUNG RAHANG DAN INDEKS FASIAL N MIN MAX MEAN SD
 TABEL DISTRIBUSI DAN HUBUNGAN LENGKUNG RAHANG DAN INDEKS FASIAL Lengkung Indeks fasial rahang Euryprosopic mesoprosopic leptoprosopic Total Sig. n % n % n % n % 0,000 Narrow 0 0 0 0 15 32,6 15 32,6 Normal
DataSet2. <none> <none> <none>
 GGraph Notes Output Created 09-Dec-0 07:50:6 Comments Input Active Dataset Filter Weight Split File DataSet Syntax Resources N of Rows in Working Data File Processor Time Elapsed Time 77 GGRAPH /GRAPHDATASET
Regression. Notes. Page 1 25-JAN :21:57. Output Created Comments
 /STATISTICS COEFF OUTS CI(95) R ANOVA /CRITERIA=PIN(.05) POUT(.10) /DEPENDENT Favorability /METHOD=ENTER zcontemp ZAnxious6 zallcontact. Regression Notes Output Created Comments Input Missing Value Handling
Descriptives. Graph. [DataSet1] C:\Documents and Settings\BuroK\Desktop\Prestige.sav
![Descriptives. Graph. [DataSet1] C:\Documents and Settings\BuroK\Desktop\Prestige.sav](/thumbs/82/84761217.jpg "Descriptives. Graph. [DataSet1] C:\Documents and Settings\BuroK\Desktop\Prestige.sav") GET FILE='C:\Documents and Settings\BuroK\Desktop\Prestige.sav'. DESCRIPTIVES VARIABLES=prestige education income women /STATISTICS=MEAN STDDEV MIN MAX. Descriptives Input Missing Value Handling Resources
GET FILE='C:\Documents and Settings\BuroK\Desktop\Prestige.sav'. DESCRIPTIVES VARIABLES=prestige education income women /STATISTICS=MEAN STDDEV MIN MAX. Descriptives Input Missing Value Handling Resources
LAMPIRAN 1 : DATA HASIL PENELITIAN
 LAMPIRAN 1 : DATA HASIL PENELITIAN SKPD SDM KOMUNIKASI SARANA KOMITMEN MOTIVASI RATA 43 15 74 42 64 78 52,6666667 47 14 66 40 50 80 49,5 55 15 61 40 56 87 52,3333333 49 12 50 41 58 87 49,5 44 12 49 30
Regression. Page 1. Notes. Output Created Comments Data. 26-Mar :31:18. Input. C:\Documents and Settings\BuroK\Desktop\Data Sets\Prestige.
 GET FILE='C:\Documents and Settings\BuroK\Desktop\DataSets\Prestige.sav'. GET FILE='E:\MacEwan\Teaching\Stat252\Data\SPSS_data\MENTALID.sav'. DATASET ACTIVATE DataSet1. DATASET CLOSE DataSet2. GET FILE='E:\MacEwan\Teaching\Stat252\Data\SPSS_data\survey_part.sav'.
I. MODEL. Q3i: Check my . Q29s: I like to see films and TV programs from other countries. Q28e: I like to watch TV shows on a laptop/tablet/phone
 1 Multiple Regression-FORCED-ENTRY HIERARCHICAL MODEL DORIS ACHEME COM 631/731, Spring 2017 Data: Film & TV Usage 2015 I. MODEL IV Block 1: Demographics Sex (female dummy):q30 Age: Q31 Income: Q34 Block
1. Crosstabs a. Usia*jenis kelamin
 1. Crosstabs a. Usia*jenis kelamin usia * jenis_kelamin Valid Missing Percent Percent Percent 27 100.0% 0.0% 27 100.0% usia * jenis_kelamin Crosstabulation usia >=30 tahun 31-40 tahun 41-50 tahun
Correlations. Correlations
 LAMPIRAN 3 UJI VALIDITAS ketergantun ketergantun ketergantun ketergantun ketergantun gan1 gan2 gan3 gan4 gan5 total1 ketergantungan1 Pearson 1.470(**).179.223.299.614(**) Sig. (2-tailed).009.343.236.109.000
Correlations. Butir 1 Pearson Correlation ** Sig. (2-tailed) N
 N") 109 Lampiran olahan Data. 1. Nilai Pelanggan (X1) s Butir 1 Butir 2 Butir 3 Butir Total Butir 1 1.049 -.157.441 ** Sig. (2-tailed).626.120.000 N 100 100 100 100 Butir 2.049 1 -.003.735 ** Sig. (2-tailed).626.978.000
109 Lampiran olahan Data. 1. Nilai Pelanggan (X1) s Butir 1 Butir 2 Butir 3 Butir Total Butir 1 1.049 -.157.441 ** Sig. (2-tailed).626.120.000 N 100 100 100 100 Butir 2.049 1 -.003.735 ** Sig. (2-tailed).626.978.000
LAMPIRAN B ANALISIS DATA
 100 116 LAMPIRAN B ANALISIS DATA 101 117 Kemandirian Belajar NPAR TESTS /K-S(NORMAL)= /MISSING ANALYSIS. NPar Tests[DataSet0] One-Sample Kolmogorov-Smirnov Test N 91 Normal Parameters a Mean 111.0769 Std.
Independent Variables
 1 Stepwise Multiple Regression Olivia Cohen Com 631, Spring 2017 Data: Film & TV Usage 2015 I. MODEL Independent Variables Demographics Item: Age Item: Income Dummied Item: Gender (Female) Digital Media
Lampiran 1 Data Sampel Penelitian. Kode Nama Sektor/Sub Sektor
 Lampiran Data Sampel Penelitian Kode Nama Sektor/Sub Sektor AALI Astra Agro Lestari Tbk Pertanian/Perkebunan ADRO Adaro Energy Tbk Pertambangan/Batubara ASII Astra International Tbk Aneka Industri/Otomotif
Multiple Regression White paper
 +44 (0) 333 666 7366 Multiple Regression White paper A tool to determine the impact in analysing the effectiveness of advertising spend. Multiple Regression In order to establish if the advertising mechanisms
Teaching students quantitative methods using resources from the British Birth Cohorts
 Centre for Longitudinal Studies, Institute of Education Teaching students quantitative methods using resources from the British Birth Cohorts Assessment of Cognitive Development through Childhood CognitiveExercises.doc:
Perpustakaan Unika LAMPIRAN
 LAMPIRAN Lampiran 1. Hasil Penelitian Pendahuluan Tabel Hasil Pengukuran Absorbansi Ekstrak Monascus purpureus Hari ke- Media Air Tajin MEB 5 0.4792 0.2744 6 0.6469 0.3695 7 0.6974 0.4817 8 0.6534 0.4661
Crosstabs Notes Output Created 17-Mai :40:54 Comments Input
 Crosstabs Notes Output Created 17-Mai-2011 01:40:54 Comments Input Data /Users/corinnahornei/Desktop/spss table.sav Active Dataset DatenSet3 Filter Weight Split File N of Rows in Working 189 Data File
THE UNIVERSITY OF BRITISH COLUMBIA FORESTRY 430 and 533. Time: 50 minutes 40 Marks FRST Marks FRST 533 (extra questions)
") THE UNIVERSITY OF BRITISH COLUMBIA FORESTRY 430 and 533 MIDTERM EXAMINATION: October 14, 2005 Instructor: Val LeMay Time: 50 minutes 40 Marks FRST 430 50 Marks FRST 533 (extra questions) This examination
THE UNIVERSITY OF BRITISH COLUMBIA FORESTRY 430 and 533 MIDTERM EXAMINATION: October 14, 2005 Instructor: Val LeMay Time: 50 minutes 40 Marks FRST 430 50 Marks FRST 533 (extra questions) This examination
LAMPIRAN. Tests of Normality. Kolmogorov-Smirnov a. Berat_Limfa KB KP P
 LAMPIRAN 1. Data Analisis Statistik 1.1 Berat Limpa U1 U2 U3 U4 U5 U6 Rata- SD Rata KB 0.53 0.17 0.18 0.2 0.18 0.13 0.23 0.15 KP 0.31 0.27 0.27 0.27 0.11 0.23 0.24 0.07 P1 0.23 0.21 0.12 0.2 0.24 0.23
- 1 - Fig. A5.1 Missing value analysis dialog box
 WEB APPENDIX Sarstedt, M. & Mooi, E. (2019). A concise guide to market research. The process, data, and methods using SPSS (3 rd ed.). Heidelberg: Springer. Missing Value Analysis and Multiple Imputation
Intermediate SPSS. If you have an SPSS dataset (*.sav), you can open it in the following way:
, you can open it in the following way:") Center for Teaching, Research & Learning Research Support Group at the Social Science Research lab American University, Washington, D.C. http://www.american.edu/provost/ctrl/ 202-885-3862 Intermediate
Center for Teaching, Research & Learning Research Support Group at the Social Science Research lab American University, Washington, D.C. http://www.american.edu/provost/ctrl/ 202-885-3862 Intermediate
Applied Regression Modeling: A Business Approach
 i Applied Regression Modeling: A Business Approach Computer software help: SPSS SPSS (originally Statistical Package for the Social Sciences ) is a commercial statistical software package with an easy-to-use
Applied Regression Modeling: A Business Approach
 i Applied Regression Modeling: A Business Approach Computer software help: SAS SAS (originally Statistical Analysis Software ) is a commercial statistical software package based on a powerful programming
FREQUENCIES VARIABLES=CAT_MSDS /STATISTICS=STDDEV MINIMUM MAXIMUM MEAN MEDIAN MODE /ORDER=ANALYSIS.
 1. Uji Univariat FREQUENCIES VARIABLES=CAT_MSDS /STATISTICS=STDDEV MINIMUM MAXIMUM MEAN MEDIAN MODE /ORDER=ANALYSIS. Frequencies Notes Output Created 31-MAY-2017 20:53:29 Comments Input Data Active Dataset
Minitab 17 commands Prepared by Jeffrey S. Simonoff
 Minitab 17 commands Prepared by Jeffrey S. Simonoff Data entry and manipulation To enter data by hand, click on the Worksheet window, and enter the values in as you would in any spreadsheet. To then save
Eksamen ERN4110, 6/ VEDLEGG SPSS utskrifter til oppgavene (Av plasshensyn kan utskriftene være noe redigert)
") Eksamen ERN4110, 6/9-2018 VEDLEGG SPSS utskrifter til oppgavene (Av plasshensyn kan utskriftene være noe redigert) 1 Oppgave 1 Datafila I SPSS: Variabelnavn Beskrivelse Kjønn Kjønn (1=Kvinne, 2=Mann) Studieinteresse
Eksamen ERN4110, 6/9-2018 VEDLEGG SPSS utskrifter til oppgavene (Av plasshensyn kan utskriftene være noe redigert) 1 Oppgave 1 Datafila I SPSS: Variabelnavn Beskrivelse Kjønn Kjønn (1=Kvinne, 2=Mann) Studieinteresse
The following procedures and commands, are covered in this part: Command Purpose Page
 Some Procedures in SPSS Part (2) This handout describes some further procedures in SPSS, following on from Part (1). Because some of the procedures covered are complex, with many sub-commands, the descriptions
E-Campus Inferential Statistics - Part 2
 E-Campus Inferential Statistics - Part 2 Group Members: James Jones Question 4-Isthere a significant difference in the mean prices of the stores? New Textbook Prices New Price Descriptives 95% Confidence
LAMPIRAN 1 PENGARUH KETERSEDIAAN KOLEKSI PERPUSTAKAAN TERHADAP MINAT BACA SISWA SMP NEGERI 30 MEDAN
 LAMPIRAN 1 ANGKET PENELITIAN PENGARUH KETERSEDIAAN KOLEKSI PERPUSTAKAAN TERHADAP MINAT BACA SISWA SMP NEGERI 30 MEDAN Saya mengharapkan kesediaan Saudara untuk mengisi angket dalam rangka penelitian tetang
Bivariate (Simple) Regression Analysis
 Regression Analysis") Revised July 2018 Bivariate (Simple) Regression Analysis This set of notes shows how to use Stata to estimate a simple (two-variable) regression equation. It assumes that you have set Stata up on your
Revised July 2018 Bivariate (Simple) Regression Analysis This set of notes shows how to use Stata to estimate a simple (two-variable) regression equation. It assumes that you have set Stata up on your
An introduction to SPSS
 An introduction to SPSS To open the SPSS software using U of Iowa Virtual Desktop... Go to https://virtualdesktop.uiowa.edu and choose SPSS 24. Contents NOTE: Save data files in a drive that is accessible
Here is Kellogg s custom menu for their core statistics class, which can be loaded by typing the do statement shown in the command window at the very
 Here is Kellogg s custom menu for their core statistics class, which can be loaded by typing the do statement shown in the command window at the very bottom of the screen: 4 The univariate statistics command
Conducting a Path Analysis With SPSS/AMOS
 Conducting a Path Analysis With SPSS/AMOS Download the PATH-INGRAM.sav data file from my SPSS data page and then bring it into SPSS. The data are those from the research that led to this publication: Ingram,
Lecture 7: Linear Regression (continued)
") Lecture 7: Linear Regression (continued) Reading: Chapter 3 STATS 2: Data mining and analysis Jonathan Taylor, 10/8 Slide credits: Sergio Bacallado 1 / 14 Potential issues in linear regression 1. Interactions
Lecture 7: Linear Regression (continued) Reading: Chapter 3 STATS 2: Data mining and analysis Jonathan Taylor, 10/8 Slide credits: Sergio Bacallado 1 / 14 Potential issues in linear regression 1. Interactions
Beta-Regression with SPSS Michael Smithson School of Psychology, The Australian National University
 9/1/2005 Beta-Regression with SPSS 1 Beta-Regression with SPSS Michael Smithson School of Psychology, The Australian National University (email: Michael.Smithson@anu.edu.au) SPSS Nonlinear Regression syntax
Ronald H. Heck 1 EDEP 606 (F2015): Multivariate Methods rev. November 16, 2015 The University of Hawai i at Mānoa
: Multivariate Methods rev. November 16, 2015 The University of Hawai i at Mānoa") Ronald H. Heck 1 In this handout, we will address a number of issues regarding missing data. It is often the case that the weakest point of a study is the quality of the data that can be brought to bear
Ronald H. Heck 1 In this handout, we will address a number of issues regarding missing data. It is often the case that the weakest point of a study is the quality of the data that can be brought to bear
Detecting and Circumventing Collinearity or Ill-Conditioning Problems
 Chapter 8 Detecting and Circumventing Collinearity or Ill-Conditioning Problems Section 8.1 Introduction Multicollinearity/Collinearity/Ill-Conditioning The terms multicollinearity, collinearity, and ill-conditioning
JMP 10 Student Edition Quick Guide
 JMP 10 Student Edition Quick Guide Instructions presume an open data table, default preference settings and appropriately typed, user-specified variables of interest. RMC = Click Right Mouse Button Graphing
Excel 2010 with XLSTAT
 Excel 2010 with XLSTAT J E N N I F E R LE W I S PR I E S T L E Y, PH.D. Introduction to Excel 2010 with XLSTAT The layout for Excel 2010 is slightly different from the layout for Excel 2007. However, with
CH5: CORR & SIMPLE LINEAR REFRESSION =======================================
 STAT 430 SAS Examples SAS5 ===================== ssh xyz@glue.umd.edu, tap sas913 (old sas82), sas https://www.statlab.umd.edu/sasdoc/sashtml/onldoc.htm CH5: CORR & SIMPLE LINEAR REFRESSION =======================================
Copyright 2015 by Sean Connolly
 1 Copyright 2015 by Sean Connolly All rights reserved. No part of this publication may be reproduced, distributed, or transmitted in any form or by any means, including photocopying, recording, or other
Correctly Compute Complex Samples Statistics
 SPSS Complex Samples 15.0 Specifications Correctly Compute Complex Samples Statistics When you conduct sample surveys, use a statistics package dedicated to producing correct estimates for complex sample
Resources for statistical assistance. Quantitative covariates and regression analysis. Methods for predicting continuous outcomes.
 Resources for statistical assistance Quantitative covariates and regression analysis Carolyn Taylor Applied Statistics and Data Science Group (ASDa) Department of Statistics, UBC January 24, 2017 Department
Everything taken from (Hair, Hult et al. 2017) but some formulas taken elswere or created by Erik Mønness.
 but some formulas taken elswere or created by Erik Mønness.") /Users/astacbf/Desktop/Assessing smartpls (engelsk).docx 1/8 Assessing smartpls Everything taken from (Hair, Hult et al. 017) but some formulas taken elswere or created by Erik Mønness. Run PLS algorithm,
/Users/astacbf/Desktop/Assessing smartpls (engelsk).docx 1/8 Assessing smartpls Everything taken from (Hair, Hult et al. 017) but some formulas taken elswere or created by Erik Mønness. Run PLS algorithm,
6:1 LAB RESULTS -WITHIN-S ANOVA
 6:1 LAB RESULTS -WITHIN-S ANOVA T1/T2/T3/T4. SStotal =(1-12) 2 + + (18-12) 2 = 306.00 = SSpill + SSsubj + SSpxs df = 9-1 = 8 P1 P2 P3 Ms Ms-Mg 1 8 15 8.0-4.0 SSsubj= 3x(-4 2 + ) 4 17 15 12.0 0 = 96.0 13
Fathom Dynamic Data TM Version 2 Specifications
 Data Sources Fathom Dynamic Data TM Version 2 Specifications Use data from one of the many sample documents that come with Fathom. Enter your own data by typing into a case table. Paste data from other
Product Catalog. AcaStat. Software
 Product Catalog AcaStat Software AcaStat AcaStat is an inexpensive and easy-to-use data analysis tool. Easily create data files or import data from spreadsheets or delimited text files. Run crosstabulations,
Predict Outcomes and Reveal Relationships in Categorical Data
 PASW Categories 18 Specifications Predict Outcomes and Reveal Relationships in Categorical Data Unleash the full potential of your data through predictive analysis, statistical learning, perceptual mapping,
Stat 5100 Handout #19 SAS: Influential Observations and Outliers
 Stat 5100 Handout #19 SAS: Influential Observations and Outliers Example: Data collected on 50 countries relevant to a cross-sectional study of a lifecycle savings hypothesis, which states that the response
Index. Bar charts, 106 bartlett.test function, 159 Bottles dataset, 69 Box plots, 113
 Index A Add-on packages information page, 186 187 Linux users, 191 Mac users, 189 mirror sites, 185 Windows users, 187 aggregate function, 62 Analysis of variance (ANOVA), 152 anova function, 152 as.data.frame
Minitab Study Card J ENNIFER L EWIS P RIESTLEY, PH.D.
 Minitab Study Card J ENNIFER L EWIS P RIESTLEY, PH.D. Introduction to Minitab The interface for Minitab is very user-friendly, with a spreadsheet orientation. When you first launch Minitab, you will see
Subset Selection in Multiple Regression
 Chapter 307 Subset Selection in Multiple Regression Introduction Multiple regression analysis is documented in Chapter 305 Multiple Regression, so that information will not be repeated here. Refer to that
Module 25.1: nag lin reg Regression Analysis. Contents
 Correlation and Regression Analysis Module Contents Module 25.1: nag lin reg Regression Analysis nag lin reg contains procedures that perform a simple or multiple linear regression analysis. Contents Introduction...
Study Guide. Module 1. Key Terms
 Study Guide Module 1 Key Terms general linear model dummy variable multiple regression model ANOVA model ANCOVA model confounding variable squared multiple correlation adjusted squared multiple correlation
Getting started with Stata 2017: Cheat-sheet
 Getting started with Stata 2017: Cheat-sheet 4. september 2017 1 Get started Graphical user interface (GUI). Clickable. Simple. Commands. Allows for use of do-le. Easy to keep track. Command window: Write
Section 2.2: Covariance, Correlation, and Least Squares
 Section 2.2: Covariance, Correlation, and Least Squares Jared S. Murray The University of Texas at Austin McCombs School of Business Suggested reading: OpenIntro Statistics, Chapter 7.1, 7.2 1 A Deeper
Multidimensional Scaling Presentation. Spring Rob Goodman Paul Palisin
 1 Multidimensional Scaling Presentation Spring 2009 Rob Goodman Paul Palisin Social Networking Facebook MySpace Instant Messaging Email Youtube Text Messaging Twitter 2 Create a survey for your MDS Enter
Regression on SAT Scores of 374 High Schools and K-means on Clustering Schools
 Regression on SAT Scores of 374 High Schools and K-means on Clustering Schools Abstract In this project, we study 374 public high schools in New York City. The project seeks to use regression techniques
Hypermarket Retail Analysis Customer Buying Behavior. Reachout Analytics Client Sample Report
 Hypermarket Retail Analysis Customer Buying Behavior Report Tools Used: R Python WEKA Techniques Applied: Comparesion Tests Association Tests Requirement 1: All the Store Brand significance to Gender Towards
range: [1,20] units: 1 unique values: 20 missing.: 0/20 percentiles: 10% 25% 50% 75% 90%
![range: [1,20] units: 1 unique values: 20 missing.: 0/20 percentiles: 10% 25% 50% 75% 90%](/thumbs/95/123687023.jpg "range: [1,20] units: 1 unique values: 20 missing.: 0/20 percentiles: 10% 25% 50% 75% 90%") ------------------ log: \Term 2\Lecture_2s\regression1a.log log type: text opened on: 22 Feb 2008, 03:29:09. cmdlog using " \Term 2\Lecture_2s\regression1a.do" (cmdlog \Term 2\Lecture_2s\regression1a.do
------------------ log: \Term 2\Lecture_2s\regression1a.log log type: text opened on: 22 Feb 2008, 03:29:09. cmdlog using " \Term 2\Lecture_2s\regression1a.do" (cmdlog \Term 2\Lecture_2s\regression1a.do
One Factor Experiments
 One Factor Experiments 20-1 Overview Computation of Effects Estimating Experimental Errors Allocation of Variation ANOVA Table and F-Test Visual Diagnostic Tests Confidence Intervals For Effects Unequal
Example Using Missing Data 1
 Ronald H. Heck and Lynn N. Tabata 1 Example Using Missing Data 1 Creating the Missing Data Variable (Miss) Here is a data set (achieve subset MANOVAmiss.sav) with the actual missing data on the outcomes.
PSY 9556B (Feb 5) Latent Growth Modeling
 Latent Growth Modeling") PSY 9556B (Feb 5) Latent Growth Modeling Fixed and random word confusion Simplest LGM knowing how to calculate dfs How many time points needed? Power, sample size Nonlinear growth quadratic Nonlinear growth
PSY 9556B (Feb 5) Latent Growth Modeling Fixed and random word confusion Simplest LGM knowing how to calculate dfs How many time points needed? Power, sample size Nonlinear growth quadratic Nonlinear growth
NLREG COM Interface. Copyright , Phillip H. Sherrod All Rights Reserved
 NLREG COM Interface Copyright 2002-2005, Phillip H. Sherrod All Rights Reserved Phillip H. Sherrod 6430 Annandale Cove Brentwood, TN 37027-6313 USA phil.sherrod@sandh.com www.nlreg.com Contents Contents...
An Example of Using inter5.exe to Obtain the Graph of an Interaction
 An Example of Using inter5.exe to Obtain the Graph of an Interaction This example covers the general use of inter5.exe to produce data from values inserted into a regression equation which can then be
Correctly Compute Complex Samples Statistics
 PASW Complex Samples 17.0 Specifications Correctly Compute Complex Samples Statistics When you conduct sample surveys, use a statistics package dedicated to producing correct estimates for complex sample
STAT:5201 Applied Statistic II
 STAT:5201 Applied Statistic II Two-Factor Experiment (one fixed blocking factor, one fixed factor of interest) Randomized complete block design (RCBD) Primary Factor: Day length (short or long) Blocking
Data Analysis and Hypothesis Testing Using the Python ecosystem
 ARISTOTLE UNIVERSITY OF THESSALONIKI Data Analysis and Hypothesis Testing Using the Python ecosystem t-test & ANOVAs Stavros Demetriadis Assc. Prof., School of Informatics, Aristotle University of Thessaloniki
9.1 Random coefficients models Constructed data Consumer preference mapping of carrots... 10
 St@tmaster 02429/MIXED LINEAR MODELS PREPARED BY THE STATISTICS GROUPS AT IMM, DTU AND KU-LIFE Module 9: R 9.1 Random coefficients models...................... 1 9.1.1 Constructed data........................
Data Management - 50%
 Exam 1: SAS Big Data Preparation, Statistics, and Visual Exploration Data Management - 50% Navigate within the Data Management Studio Interface Register a new QKB Create and connect to a repository Define
Stat 500 lab notes c Philip M. Dixon, Week 10: Autocorrelated errors
 Week 10: Autocorrelated errors This week, I have done one possible analysis and provided lots of output for you to consider. Case study: predicting body fat Body fat is an important health measure, but
SAS/STAT 13.1 User s Guide. The SCORE Procedure
 SAS/STAT 13.1 User s Guide The SCORE Procedure This document is an individual chapter from SAS/STAT 13.1 User s Guide. The correct bibliographic citation for the complete manual is as follows: SAS Institute
Stat 5100 Handout #6 SAS: Linear Regression Remedial Measures
 Stat 5100 Handout #6 SAS: Linear Regression Remedial Measures Example: Age and plasma level for 25 healthy children in a study are reported. Of interest is how plasma level depends on age. (Text Table
For Additional Information...
 For Additional Information... The materials in this handbook were developed by Master Black Belts at General Electric Medical Systems to assist Black Belts and Green Belts in completing Minitab Analyses.
Lab Session 1. Introduction to Eviews
 Albert-Ludwigs University Freiburg Department of Empirical Economics Time Series Analysis, Summer 2009 Dr. Sevtap Kestel To see the data of m1: 1 Lab Session 1 Introduction to Eviews We introduce the basic
Basics of Multivariate Modelling and Data Analysis
 Basics of Multivariate Modelling and Data Analysis Kurt-Erik Häggblom 9. Linear regression with latent variables 9.1 Principal component regression (PCR) 9.2 Partial least-squares regression (PLS) [ mostly
CREATING THE ANALYSIS
 Chapter 14 Multiple Regression Chapter Table of Contents CREATING THE ANALYSIS...214 ModelInformation...217 SummaryofFit...217 AnalysisofVariance...217 TypeIIITests...218 ParameterEstimates...218 Residuals-by-PredictedPlot...219
ANSWERS -- Prep for Psyc350 Laboratory Final Statistics Part Prep a
 ANSWERS -- Prep for Psyc350 Laboratory Final Statistics Part Prep a Put the following data into an spss data set: Be sure to include variable and value labels and missing value specifications for all variables
SPSS INSTRUCTION CHAPTER 9
 SPSS INSTRUCTION CHAPTER 9 Chapter 9 does no more than introduce the repeated-measures ANOVA, the MANOVA, and the ANCOVA, and discriminant analysis. But, you can likely envision how complicated it can
[/TTEST [PERCENT={5}] [{T }] [{DF } [{PROB }] [{COUNTS }] [{MEANS }]] {n} {NOT} {NODF} {NOPROB}] {NOCOUNTS} {NOMEANS}
![[/TTEST [PERCENT={5}] [{T }] [{DF } [{PROB }] [{COUNTS }] [{MEANS }]] {n} {NOT} {NODF} {NOPROB}] {NOCOUNTS} {NOMEANS}](/thumbs/81/84586501.jpg "[/TTEST [PERCENT={5}] [{T }] [{DF } [{PROB }] [{COUNTS }] [{MEANS }]] {n} {NOT} {NODF} {NOPROB}] {NOCOUNTS} {NOMEANS}") MVA MVA [VARIABLES=] {varlist} {ALL } [/CATEGORICAL=varlist] [/MAXCAT={25 ** }] {n } [/ID=varname] Description: [/NOUNIVARIATE] [/TTEST [PERCENT={5}] [{T }] [{DF } [{PROB }] [{COUNTS }] [{MEANS }]] {n}
MVA MVA [VARIABLES=] {varlist} {ALL } [/CATEGORICAL=varlist] [/MAXCAT={25 ** }] {n } [/ID=varname] Description: [/NOUNIVARIATE] [/TTEST [PERCENT={5}] [{T }] [{DF } [{PROB }] [{COUNTS }] [{MEANS }]] {n}
LAMPIRAN Hubungan Job..., Dian Tri Utami, F.PSI UI, 2008
 LAMPIRA Case Processing Summary a. Listwise deleti based all variables in the procedure. % Crbach's Alpha Items a of Items,812 815 4 Case Processing Summary % Crbach's Alpha Items of Items,671,654 4 Case
Bluman & Mayer, Elementary Statistics, A Step by Step Approach, Canadian Edition
 Bluman & Mayer, Elementary Statistics, A Step by Step Approach, Canadian Edition Online Learning Centre Technology Step-by-Step - Minitab Minitab is a statistical software application originally created
RSM Split-Plot Designs & Diagnostics Solve Real-World Problems
 RSM Split-Plot Designs & Diagnostics Solve Real-World Problems Shari Kraber Pat Whitcomb Martin Bezener Stat-Ease, Inc. Stat-Ease, Inc. Stat-Ease, Inc. 221 E. Hennepin Ave. 221 E. Hennepin Ave. 221 E.
SPSS. (Statistical Packages for the Social Sciences)
") Inger Persson SPSS (Statistical Packages for the Social Sciences) SHORT INSTRUCTIONS This presentation contains only relatively short instructions on how to perform basic statistical calculations in SPSS.
Inger Persson SPSS (Statistical Packages for the Social Sciences) SHORT INSTRUCTIONS This presentation contains only relatively short instructions on how to perform basic statistical calculations in SPSS.
Stat 5100 Handout #14.a SAS: Logistic Regression
 Stat 5100 Handout #14.a SAS: Logistic Regression Example: (Text Table 14.3) Individuals were randomly sampled within two sectors of a city, and checked for presence of disease (here, spread by mosquitoes).
Genotype x Environmental Analysis with R for Windows
 Genotype x Environmental Analysis with R for Windows Biometrics and Statistics Unit Angela Pacheco CIMMYT,Int. 23-24 Junio 2015 About GEI In agricultural experimentation, a large number of genotypes are
The linear mixed model: modeling hierarchical and longitudinal data
 The linear mixed model: modeling hierarchical and longitudinal data Analysis of Experimental Data AED The linear mixed model: modeling hierarchical and longitudinal data 1 of 44 Contents 1 Modeling Hierarchical
Introduction to Statistical Analyses in SAS
 Introduction to Statistical Analyses in SAS Programming Workshop Presented by the Applied Statistics Lab Sarah Janse April 5, 2017 1 Introduction Today we will go over some basic statistical analyses in
DESIGN OF EXPERIMENTS and ROBUST DESIGN
 DESIGN OF EXPERIMENTS and ROBUST DESIGN Problems in design and production environments often require experiments to find a solution. Design of experiments are a collection of statistical methods that,
Conditional and Unconditional Regression with No Measurement Error
 Conditional and with No Measurement Error /* reg2ways.sas */ %include 'readsenic.sas'; title2 ''; proc reg; title3 'Conditional Regression'; model infrisk = stay census; proc calis cov; /* Analyze the
Week 4: Simple Linear Regression III
 Week 4: Simple Linear Regression III Marcelo Coca Perraillon University of Colorado Anschutz Medical Campus Health Services Research Methods I HSMP 7607 2017 c 2017 PERRAILLON ARR 1 Outline Goodness of
Nonparametric Testing
 Nonparametric Testing in Excel By Mark Harmon Copyright 2011 Mark Harmon No part of this publication may be reproduced or distributed without the express permission of the author. mark@excelmasterseries.com
INTRODUCTION TO PANEL DATA ANALYSIS
 INTRODUCTION TO PANEL DATA ANALYSIS USING EVIEWS FARIDAH NAJUNA MISMAN, PhD FINANCE DEPARTMENT FACULTY OF BUSINESS & MANAGEMENT UiTM JOHOR PANEL DATA WORKSHOP-23&24 MAY 2017 1 OUTLINE 1. Introduction 2.
Poisson Regression and Model Checking
 Poisson Regression and Model Checking Readings GH Chapter 6-8 September 27, 2017 HIV & Risk Behaviour Study The variables couples and women_alone code the intervention: control - no counselling (both 0)
SOCY7706: Longitudinal Data Analysis Instructor: Natasha Sarkisian. Panel Data Analysis: Fixed Effects Models
 SOCY776: Longitudinal Data Analysis Instructor: Natasha Sarkisian Panel Data Analysis: Fixed Effects Models Fixed effects models are similar to the first difference model we considered for two wave data
AMELIA II: A Program for Missing Data
 AMELIA II: A Program for Missing Data Amelia II is an R package that performs multiple imputation to deal with missing data, instead of other methods, such as pairwise and listwise deletion. In multiple
Package robustreg. R topics documented: April 27, Version Date Title Robust Regression Functions
 Version 0.1-10 Date 2017-04-25 Title Robust Regression Functions Package robustreg April 27, 2017 Author Ian M. Johnson Maintainer Ian M. Johnson Depends
Instruction on JMP IN of Chapter 19
 Instruction on JMP IN of Chapter 19 Example 19.2 (1). Download the dataset xm19-02.jmp from the website for this course and open it. (2). Go to the Analyze menu and select Fit Model. Click on "REVENUE"
Solution to Bonus Questions
 Solution to Bonus Questions Q2: (a) The histogram of 1000 sample means and sample variances are plotted below. Both histogram are symmetrically centered around the true lambda value 20. But the sample