Building and Customizing an Interactive Report
|
|
|
- Georgina Douglas
- 6 years ago
- Views:
Transcription
1 Building and Customizing an Interactive Report Purpose This tutorial shows you how to build, use and customize an Interactive Report in Oracle Application Express 3.1. Time to Complete Approximately 30 minutes Topics This tutorial covers the following topics: Overview Prerequisites Create an Application with an Interactive Report Manipulating Your Interactive Report Customizing Your Interactive Report Summary Related Information Viewing Screenshots Place the cursor over this icon to load and view all screenshots for this tutorial. (Caution: This action loads all screenshots simultaneously, so response time may be slow depending on your Internet connection.) Note: Alternatively, you can place the cursor over an individual icon in the following steps to load and view only the screenshot associated with that step. You can hide an individual screenshot by clicking it. Overview Interactive Reporting Regions enable end users to customize reports. Users can alter the layout of report data by choosing the columns they are interested in, applying filters, highlighting, and sorting. They can also define breaks, aggregations, different charts, and their own computations. Users can create multiple variations of the report and save them as named reports and download to various file formats including comma-delimited file (CSV) format, Microsoft Excel (XLS) format, Adobe Portable Document Format (PDF), and Microsoft Word Rich Text Format (RTF). For further information, click on help and search on Interactive Reports. Another new feature shown in this tutorial is Application Date Format. You can define a date format that will be used throughout your application. This date format will be used to alter the NLS_DATE_FORMAT database session setting prior to showing or submitting any page within the application. This format is used by all reports showing dates and is also picked up by form items of type 'Date Picker (use Application Date Format)'. This can be set using: 1. Application Builder > Application Builder Defaults (under Tasks): These are specific to a Workspace, not a

2 developer, and will be used as the default when using the create application wizard. 2. Application Builder > Create Application Wizard > Attributes page 3. Application Builder > Your Application > Shared Components > Edit Globalization Attributes To get more information about the 3.1 New Features, click here. This tutorial shows the developer how to create and customize an Interactive Report for an end user. Back to Topic List Prerequisites Before you perform this tutorial, you should: 1. Install Oracle Database 11g. 2. Install and configure Oracle Application Express. See documentation on OTN. 3. Create a Workspace and User in the Oracle Application Express Administration tool. Back to Topic List Create an Application with an Interactive Report To create an Application with an Interactive Report, perform the following steps: 1. Enter the following URL to log in to Oracle Application Express (change the <hostname> to localhost, your specific hostname or apex.oracle.com) To log in to Oracle Application Express, enter the following details, and click Login. Workspace: <your workspace name> Username: <your username> Password: <your password>


3 2. Click Application Builder. 3. Click Create. 4. Click Create Application.


4 5. Enter an Application Name and click Next. 6. Select Report for Page Type, make sure Page Source is set to Table and Implementation is set to Interactive. Click the up arrow to select a table.
5 7. Select the OEHR_EMPLOYEES table. 8. Click Add Page.

6 9. Click Next.


7 10. Accept the default to create One Level of Tabs and click Next. 11. Click Next. 12. You want to accept the default authentication scheme. You can now in Application Express specify a Date Format for the entire application. Click the up arrow for Date Format.

8 13. Select the 12-JAN-2004 link. Note: By setting the date format when you create the application, the same date format will be used for all report columns and items.

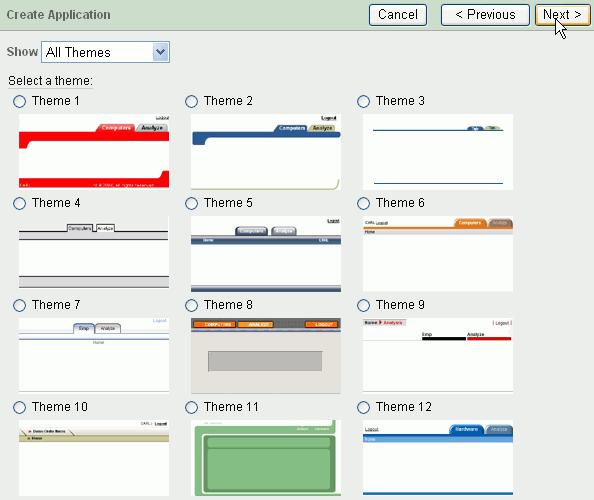
9 14. Click Next. 15. There are 2 new themes in Application Express 3.1: theme 19 and 20. In this tutorial, you want to select Theme 20 and click Next.
10


11 16. Click Create.

12 17. Run the Application. 18. Login with the username/password you use when you login to Application Express and click Login. 19. The Report is displayed. Notice that the date format is set according to the date you specified when you created the application. In the next section, you examine some of the Interactive Report features.

13 Back to Topic List Manipulating Your Interactive Report Now that the Interactive Report has been created, you can manipulate the report in many ways. In this section, only some of them are discussed. You can review more on this topic in the OBE Using Interactive Report Regions with Oracle Application Express 3.1. Perform the following steps:


14 1. You can search for values. Enter John in the search bar and click Go. 2. Notice that only the rows where john is found are listed. A filter was also created above the report data.


15 3. To hide a column, you can select the column header link and then click the hide icon column. 4. Notice that the column no longer appears in the report. Note: You can show the column again by clicking Select Columns from the Actions menu (discussed later in this tutorial).


16 5. To sort on a column, click the header you want to sort on and select the Sort Ascending or Sort Descending icon. Select the Last Name column and click the Sort Ascending icon. 6. The report is now sorted on Last Name.

17 7. You can delete the filter you created earlier. Click the red X next to the filter. 8. You can create a control break on a column. Select the Actions menu pulldown and select Control Break.

18 9. You want to break on the Department ID. Select Department ID from the list of columns and click Apply.

19 10. The control break was created. Notice that the column was eliminated in the list and now appears before each breakpoint in the report.

20 11. You can also highlight a particular cell or row in the report based on some criteria. Click the Actions menu and select Highlight.

21 12. You want to highlight the row of an employee if their salary is higher than $10,000. Enter Top Tier Salary for the Name, make sure Enabled is set to Yes, and Highlight Type is set to Row. Select [red] for Background color and [blue] for Text color. Under Highlight Condition, select Salary for the Column, select > for the Operator and for the Expression and click Apply.

22 13. Notice that a highlight rule was created at the top of the report and the rows that met the criteria are highlighted.

23 14. You can create a computed column. In this case, you will create a column to show the monthly salary for each employee. Click the Actions menu and then select Compute.

24 15. Enter Monthly Salary for the column header and select the down arrow for Format Mask and select the $5, from the list.

25 16. From the list of Columns scroll down and select Salary. Notice that the letter corresponding to the column appears in the computation area. This is the column alias. Click / in the keypad and then enter 12 after the / in the computation area. Then click Apply.

26 17. Notice that the computed column now appears in the report.

27 18. You can also aggregate a particular column. Click the Actions menu and select Aggregate.

28 19. You want to total the Monthly Salary column. Select Sum for the Function and **Monthly Salary (the ** indicates that the column is a computed column) for the Column. Then click Apply.

29 20. You now see a total salary for each department. Note: the aggregated column inherits any formatting from the base column.

30 21. You can save all the customization you have made to this report. Click the Actions menu and select Save Report.

31 22. Enter My Report for the Name and click Apply. Note: Save as Named Report is available to all authenticated end users (when saving reports is enabled for the region). The report settings are displayed as a tab above the report, with the name you provide, and is visible *only* for the APP_USER who saved it. Save as Default Report Settings is only available to developers. These settings are applied to anyone who comes to the page for the first time in a session.

32 23. Notice that you now see a tab with all the display changes you made. This customized view will be available each time you login.

33 24. You can view a record in the report by clicking the icon before the row you want to view.

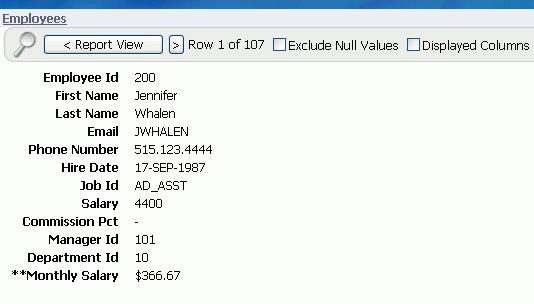
34 25. The record is displayed.
35 26. To navigate back to the report, click Report View. 27. To show the original report (without the customizations), click the Working Report tab.

36 28. Click the Action menu and click Reset.

37 28. Click Apply.

38 29. The report is displayed. In the next section, you review some of the changes you can make to the report itself.

39 Back to Topic List Customizing Your Interactive Report As a developer you can change the way that the Interactive Report is rendered for all users. Perform the following steps: 1. Click the Edit Page 1 link in the Developer Toolbar.

40 2. Under Regions, select the Interactive Report link.

41 3. You can hide columns so that they do not appear in the report. For the EMPLOYEE_ID and PHONE_NUMBER, select Hidden for Display Text As and click Apply Changes. 4. Run the page to see that the 2 columns are now hidden from the report. Note that the columns will also no longer appear under Select Columns from the Actions menu. You want to make some additional changes, click Edit Page 1 in the Developer toolbar.

42 5. Under Regions, select the Interactive Report link again.

43 6. Select the Search Bar tab.

44 7. You can change the way that your Interactive report is rendered to the end user. You can change the search bar and Actions menu in this section. In this case, deselect the Highlight check box. Then click the Download tab. 8. Notice that CSV is the only download format selected. Select XLS and PDF. Then click the Region Definition tab.


45 9. You can change the query that is executed when the report is run. In this case, you want to change the column for DEPARTMENT_ID to the DEPARTMENT_NAME in the OEHR_DEPARTMENTS table. Click the Source tab.

46 10. Change the query to the following and click Apply Changes. select a."employee_id", a."first_name", a."last_name", a." ", a."phone_number", a."hire_date", a."job_id", a."salary", a."commission_pct", a."manager_id", b."department_name" from "OEHR_EMPLOYEES" a, "OEHR_DEPARTMENTS" b where a."department_id"=b."department_id" 11. Since you modified the query, a confirmation window appears that tells you that you need to select Reset from the Actions menu in order for you to see the changes in your report. Click Apply Changes.


47 12. Click Run Page 1 to see the changes you made. 13. The report is displayed. In order for the Department Name column to appear, you need to reset the report.

48 14. Select the Actions menu. Notice that the Highlight option is no longer in the list. Click Reset. 15. Click Apply.


49 16. The Department Name column is now shown.

50 17. To check that the other download options are displayed, click the Actions menu and select Download.


51 18. The three options you selected are displayed. Click PDF. 19. When the download dialogue appears, click OK (or Open depending on what browser you have). The PDF is displayed. In the Creating PDF Reports with Oracle Application Express 3.1 tutotial, you learn ways to format this PDF file. Close this window.
52 20. Navigate to the Page 1 Page Definition. Under Regions, select the Interactive Report link again. 21. From the Interactive Report, you can create a group that will organize the single row view and group columns together in Select Columns from the Actions menu. Click the Groups tab.

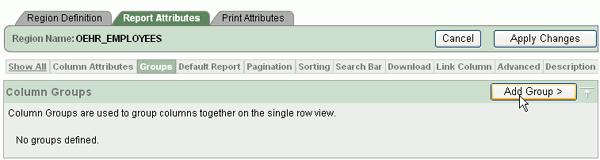
53 22. Click Add Group.


54 23. Enter Sensitive Data for the Group Name and click Create. 24. To add the columns to assign to the Sensitive Data Group, click the Edit icon.


55 25. Select Salary and Commission Pct from the list and click >. Then click Apply Changes. 26. Click Run Page 1.

56 27. Select the Single Row View icon in front of a row. 28. Notice that on the Single Row View page, the two columns are now grouped together. Click Report View to return to the report.

57 29. You can also change what happens when the Single Row View icon is clicked. You can link to a custom page or exclude the Single Row View from the report altogether. Navigate to the Page 1 Page Definition. Under Regions, select the Interactive Report link again. 30. Click the Link Column tab.
 or Exclude this")
58 31. Select the Link Column drop down list. 32. Notice that you can link to a Custom Target (or another page or URL) or Exclude this column altogether. Select Exclude Link Column.

59 33. Click Apply Changes.


60 34. Click Run Page Notice that the Single Row View icon for each row in the report no longer appears.

61 Back to Topic List Summary In this tutorial, you learned how to: Create an Application with an interactive report Manipulate and customize your interactive report Back to Topic List Related Information To learn more about Application Express, you can review the following: Related Documentation Description
62 Online Help To access this help, click the Help button displayed in the top right corner of Application Express. Search on topics of interest. Release Notes These notes contain important information not included in the Oracle Application Express documentation. Installation Guide This guide explains how to install and configure Oracle Application Express. 2 Day + Developer s Guide This guide shows you how to set up a development environment or access a hosted demonstration environment to use with this guide. It then walks you through building an initial application, modifying it, and previewing it. User s Guide This guide describes how to use the Oracle Application Express development environment to build and deploy database-centric Web applications. Oracle Application Express turns a single Oracle database into a shared service by enabling multiple workgroups to build and access applications as if they were running in separate databases. Advanced Tutorial Tutorials with step-by-step instructions that explain how to create a variety of application components and entire applications using the Oracle Application Express development environment. Back to Topic List Place the cursor over this icon to hide all screenshots.
Manipulating Database Objects
 Manipulating Database Objects Purpose This tutorial shows you how to manipulate database objects using Oracle Application Express. Time to Complete Approximately 30 minutes. Topics This tutorial covers
Creating a PDF Report with Multiple Queries
 Creating a PDF Report with Multiple Queries Purpose This tutorial shows you how to create a PDF report that contains a table and graph utilizing two report queries. Time to Complete Approximately 15 minutes
Including Dynamic Images in Your Report
 Including Dynamic Images in Your Report Purpose This tutorial shows you how to include dynamic images in your report. Time to Complete Approximately 15 minutes Topics This tutorial covers the following
Introduction to Microsoft Access 2016
 Introduction to Microsoft Access 2016 A database is a collection of information that is related. Access allows you to manage your information in one database file. Within Access there are four major objects:
Installing Oracle Database 11g on Windows
 Page 1 of 11 Installing Oracle Database 11g on Windows Purpose In this tutorial, you learn how to install Oracle Database 11g on Windows. Topics This tutorial covers the following topics: Overview Installing
You will need the unique URL for your site and your username and password to login to Data- Director.
 Getting Started Step 1: Login to the DataDirector website: You will need the unique URL for your site and your username and password to login to Data- Director. You may change your password after you login.
My Query Builder Function
 My Query Builder Function The My Query Builder function is used to build custom SQL queries for reporting information out of the TEAMS system. Query results can be exported to a comma-separated value file,
ACTIVE Net Insights user guide. (v5.4)
") ACTIVE Net Insights user guide (v5.4) Version Date 5.4 January 23, 2018 5.3 November 28, 2017 5.2 October 24, 2017 5.1 September 26, 2017 ACTIVE Network, LLC 2017 Active Network, LLC, and/or its affiliates
ACTIVE Net Insights user guide (v5.4) Version Date 5.4 January 23, 2018 5.3 November 28, 2017 5.2 October 24, 2017 5.1 September 26, 2017 ACTIVE Network, LLC 2017 Active Network, LLC, and/or its affiliates
INSERT SUBTOTALS Database Exercise Sort the Data Department Department Data Tab Sort and Filter Group
 INSERT SUBTOTALS Subtotals are used to summarize data in a range of data. This command offers many kinds of summary information, including counts, sums, averages, minimums, and maximums. When this feature
Login: Quick Guide for Qualtrics May 2018 Training:
 Qualtrics Basics Creating a New Qualtrics Account Note: Anyone with a Purdue career account can create a Qualtrics account. 1. In a Web browser, navigate to purdue.qualtrics.com. 2. Enter your Purdue Career
Management Reports Centre. User Guide. Emmanuel Amekuedi
 Management Reports Centre User Guide Emmanuel Amekuedi Table of Contents Introduction... 3 Overview... 3 Key features... 4 Authentication methods... 4 System requirements... 5 Deployment options... 5 Getting
SmartView. User Guide - Analysis. Version 2.0
 SmartView User Guide - Analysis Version 2.0 Table of Contents Page i Table of Contents Table Of Contents I Introduction 1 Dashboard Layouts 2 Dashboard Mode 2 Story Mode 3 Dashboard Controls 4 Dashboards
Veco User Guides. Grids, Views, and Grid Reports
 Veco User Guides Grids, Views, and Grid Reports Introduction A Grid is defined as being a list of data records presented to the user. A grid is shown generally when an option is selected from the Tree
Style Report Enterprise Edition
 INTRODUCTION Style Report Enterprise Edition Welcome to Style Report Enterprise Edition! Style Report is a report design and interactive analysis package that allows you to explore, analyze, monitor, report,
Secure Transfer Site (STS) User Manual
 User Manual") Secure Transfer Site (STS) User Manual (Revised 3/1/12) Table of Contents Basic System Display Information... 3 Command Buttons with Text... 3 Data Entry Boxes Required / Enabled... 3 Connecting to the
Secure Transfer Site (STS) User Manual (Revised 3/1/12) Table of Contents Basic System Display Information... 3 Command Buttons with Text... 3 Data Entry Boxes Required / Enabled... 3 Connecting to the
Excel Level 1
 Excel 2016 - Level 1 Tell Me Assistant The Tell Me Assistant, which is new to all Office 2016 applications, allows users to search words, or phrases, about what they want to do in Excel. The Tell Me Assistant
Table of Contents COURSE OVERVIEW... 5
 Table of Contents COURSE OVERVIEW... 5 DISCUSSION... 5 THE NEW DATABASE FORMAT... 5 COURSE TOPICS... 6 CONVENTIONS USED IN THIS MANUAL... 7 Tip Open a File... 7 LESSON 1: THE NEW INTERFACE... 8 LESSON
BANNER 9 QUICK NAVIGATION GUIDE
 Application Navigator Application Navigator provides a single interface to navigate the Banner 9 JAVA pages. It is a tool that allows you to go back and forth between the current Banner forms and the new
Faculty Guide to Grade Center in Blackboard 9.1
 Faculty Guide to Grade Center in Blackboard 9.1 Grade Center, formally known as Gradebook, is a central repository for assessment data, student information, and instructor notes. Although it includes items
Tutorial: Input Grades in Blackboard
 Tutorial: Input Grades in Blackboard Get into the Grade Center The following steps will lead you to the Full Grade Center page (❶ - ❽). ❶ Enter the URL: blackboard.indstate.edu ❷ Enter username and password
Finding Your Way Around Aspen IMS
 Finding Your Way Around Aspen IMS 12181A 60 minutes - - - - - - - - - - - - - - - - - - - - - - - - - - - - - - - - - - - - - - - - - - - - - - - - - Description Knowing your way around Aspen IMS makes
Faculty Guide to Grade Center in Blackboard
 Faculty Guide to Grade Center in Blackboard Grade Center, formally known as Gradebook, is a central repository for assessment data, student information, and instructor notes. Although it includes items
IRA Basic Running Financial Reports
 IRA Basic Running Financial Reports Updated 6-7-2013 1 Training Index Part I Introduction to the IRA Reporting Tool IRA Resources (3) Logging onto the system (4) Navigating the Dashboard (5-9) Running
Enterprise Reporting -- APEX
 Quick Reference Enterprise Reporting -- APEX This Quick Reference Guide documents Oracle Application Express (APEX) as it relates to Enterprise Reporting (ER). This is not an exhaustive APEX documentation
eschoolplus+ General Information Training Guide Version 2.4
 eschoolplus+ General Information Training Guide Version 2.4 August 2013 Arkansas Public School Computer Network This page is intentionally left blank 8/23/2013 Page 2 of 29 Table of Contents eschoolplus
Wholesale Lockbox User Guide
 Wholesale Lockbox User Guide August 2017 Copyright 2017 City National Bank City National Bank Member FDIC For Client Use Only Table of Contents Introduction... 3 Getting Started... 4 System Requirements...
Generating a Custom Bill of Materials
 Generating a Custom Bill of Materials Old Content - visit altium.com/documentation Modified by on 6-Nov-2013 This tutorial describes how to use the Report Manager to set up a Bill of Materials (BOM) report.
Quick Guide FAST HR. For more resources, including a guide on FAST HR codes, visit # Instructions Screenshot
 Tips & tricks This quick guide describes basic navigation within the FAST HR reporting tool, including how to use filter options, format columns and export reports. For more resources, including a guide
OBIEE. Oracle Business Intelligence Enterprise Edition. Rensselaer Business Intelligence Finance Author Training
 OBIEE Oracle Business Intelligence Enterprise Edition Rensselaer Business Intelligence Finance Author Training TABLE OF CONTENTS INTRODUCTION... 1 USER INTERFACE... 1 HOW TO LAUNCH OBIEE... 1 TERMINOLOGY...
EXCEL Using Excel for Data Query & Management. Information Technology. MS Office Excel 2007 Users Guide. IT Training & Development
 Information Technology MS Office Excel 2007 Users Guide EXCEL 2007 Using Excel for Data Query & Management IT Training & Development (818) 677-1700 Training@csun.edu TABLE OF CONTENTS Introduction... 1
Getting Started with Access
 MS Access Chapter 2 Getting Started with Access Course Guide 2 Getting Started with Access The Ribbon The strip across the top of the program window that contains groups of commands is a component of the
User Guide. Web Intelligence Rich Client. Business Objects 4.1
 User Guide Web Intelligence Rich Client Business Objects 4.1 2 P a g e Web Intelligence 4.1 User Guide Web Intelligence 4.1 User Guide Contents Getting Started in Web Intelligence 4.1... 5 Log into EDDIE...
Managing Your Database Using Oracle SQL Developer
 Page 1 of 54 Managing Your Database Using Oracle SQL Developer Purpose This tutorial introduces Oracle SQL Developer and shows you how to manage your database objects. Time to Complete Approximately 50
sohodox Quick Start Guide
 sohodox Quick Start Guide Starting Sohodox Click on Start > All Programs > Sohodox or double click Sohodox icon desktop to run Sohodox. Login as Superadmin. Username: superadmin Password: superadmin Sohodox
Getting Started Guide
 Getting Started Guide Welcome to the new Contact Management. The login process has changed from classic Contact Management to the new. This guide will walk you through those changes and help you begin
User Guide Product Design Version 1.7
 User Guide Product Design Version 1.7 1 INTRODUCTION 3 Guide 3 USING THE SYSTEM 4 Accessing the System 5 Logging In Using an Access Email 5 Normal Login 6 Resetting a Password 6 Logging Off 6 Home Page
Integrating Sintelix and ANB. Learn how to access and explore Sintelix networks in IBM i2 Analyst s Notebook
 Integrating Sintelix and ANB Learn how to access and explore Sintelix networks in IBM i2 Analyst s Notebook 2 Integrating Sintelix and ANB By the end of this tutorial you will know how to: 1 2 3 Install
Argos Creating Labels with Word
 Argos Creating Labels with Word This document explains how create mailing labels using Argos. For information about Argos, refer to the document, Argos for Typical Users. There are two (2) basic steps
Getting started with Ms Access Getting Started. Primary Key Composite Key Foreign Key
 Getting started with Ms Access 2007 Getting Started Customize Microsoft Office Toolbar The Ribbon Quick Access Toolbar Navigation Tabbed Document Window Viewing Primary Key Composite Key Foreign Key Table
Frequency tables Create a new Frequency Table
 Frequency tables Create a new Frequency Table Contents FREQUENCY TABLES CREATE A NEW FREQUENCY TABLE... 1 Results Table... 2 Calculate Descriptive Statistics for Frequency Tables... 6 Transfer Results
Business Process Procedures
 Business Process Procedures 14.40 MICROSOFT EXCEL TIPS Overview These procedures document some helpful hints and tricks while using Microsoft Excel. Key Points This document will explore the following:
Learn about the Display options Complete Review Questions and Activities Complete Training Survey
 Intended Audience: Staff members who will be using the AdHoc reporting tools to query the Campus database. Description: To learn filter and report design capabilities available in Campus. Time: 3 hours
Oracle Application Express
 Oracle Application Express Advanced Tutorials Release 3.2 E11945-02 February 2012 Oracle Application Express Advanced Tutorials, Release 3.2 E11945-02 Copyright 2003, 2012, Oracle and/or its affiliates.
 Page 1 of 6 Procedures > Pages > Procedures Use -the-system > MI-generate-report MI - Generate Report I Like It Tags & Notes MI - Generate Report This is an explanation of how to access, view and filter
Today s workshop introduces CommonSpot, ECU s Web Content Management System, through hands-on training.
 Belinda Perkinson ITCS Training and Communication perkinsons@ecu.edu Introduction Today s workshop introduces CommonSpot, ECU s Web Content Management System, through hands-on training. 1. Introduction
BANNER 9 QUICK NAVIGATION GUIDE
 MARCH 2017 Application Navigator Application Navigator provides a single interface to seamlessly navigate between Banner 9 JAVA pages and Banner 8 Oracle forms. It is a tool that allows you to go back
course notes quick reference guide
 course notes quick reference guide Microsoft Excel 2010 Welcome to Excel 2010 Excel 2010 is the premier spreadsheet application from Microsoft. Excel 2010 makes it easier to analyze data quickly with new
Welcome. Accessing Your Banner Reports
 Welcome Accessing Your Banner Reports Objective Introduction Show e~print users how to select, retrieve, view, save, and print e~print reports from their browsers. Intended Use Self-Training Guided Training
Morningstar Advisor Workstation SM Research QuickTips
 Launch Morningstar Advisor Workstation Launch your Internet browser and go to www.morningstaradvisor.ca In the MorningstarAdvisor.ca tool bar, click Workstation. The Advisor Workstation launches in a separate
VUEWorks Report Generation Training Packet
 VUEWorks Report Generation Training Packet Thursday, June 21, 2018 Copyright 2017 VUEWorks, LLC. All rights reserved. Page 1 of 53 Table of Contents VUEWorks Reporting Course Description... 3 Generating
Report Designer Report Types Table Report Multi-Column Report Label Report Parameterized Report Cross-Tab Report Drill-Down Report Chart with Static
 Table of Contents Report Designer Report Types Table Report Multi-Column Report Label Report Parameterized Report Cross-Tab Report Drill-Down Report Chart with Static Series Chart with Dynamic Series Master-Detail
Institutional Reporting and Analysis (IRA) For help, blitz "Financial Reports", or
 For help, blitz Financial Reports, or") Institutional Reporting and Analysis (IRA) 1 Training Agenda Introduction to the IRA Reporting Tool Logging onto the system (4-5) Navigating the Dashboard (6-10) Running Reports (11-12) Working with Reports
Institutional Reporting and Analysis (IRA) 1 Training Agenda Introduction to the IRA Reporting Tool Logging onto the system (4-5) Navigating the Dashboard (6-10) Running Reports (11-12) Working with Reports
EXCEL 2003 DISCLAIMER:
 EXCEL 2003 DISCLAIMER: This reference guide is meant for experienced Microsoft Excel users. It provides a list of quick tips and shortcuts for familiar features. This guide does NOT replace training or
Contents. Announcer Pro Version 4.6 Page 2 of 35 Version V4.6
 User Guide Contents 1. Introduction... 3 1.1. Getting Started... 3 1.2. Navigation... 4 2. Create a Newsletter... 6 2.1. Confirm Company Details... 6 2.2. Choose Template... 8 2.3. Edit Newsletter... 8
Using Sitecore 5.3.1
 Using Sitecore 5.3.1 An End-User s Guide to Using and Administrating Sitecore Author: Sitecore Corporation Date: December 12, 2007 Release: Rev. 1.0 Language: English Sitecore is a registered trademark.
GOOGLE SHEETS TUTORIAL
 GOOGLE SHEETS TUTORIAL STM TRAINING PROGRAM BY BREANA NARINE (Instructional Design Assistant) Google Sheets Tutorial Google Sheet is an online service provided by Google where you are able to create new
Paragon Essentials: Getting Started with Paragon 4 This manual sets the foundation for all future work in Paragon 4. It covers the basic activities
 Paragon Essentials: Getting Started with Paragon 4 This manual sets the foundation for all future work in Paragon 4. It covers the basic activities necessary to navigate the MLS. Table of Contents 1. Accessing
Introduction to IBM Rational HATS For IBM System i (5250)
") Introduction to IBM Rational HATS For IBM System i (5250) Introduction to IBM Rational HATS 1 Lab instructions This lab teaches you how to use IBM Rational HATS to create a Web application capable of transforming
Introduction to IBM Rational HATS For IBM System i (5250) Introduction to IBM Rational HATS 1 Lab instructions This lab teaches you how to use IBM Rational HATS to create a Web application capable of transforming
SAS Report Viewer 8.3 Documentation
 SAS Report Viewer 8.3 Documentation About SAS Report Viewer Introduction to SAS Report Viewer SAS Report Viewer (the report viewer) enables users who are not report designers to view a report using a web
Qualtrics Survey Software
 Qualtrics Survey Software GETTING STARTED WITH QUALTRICS Qualtrics Survey Software 0 Contents Qualtrics Survey Software... 2 Welcome to Qualtrics!... 2 Getting Started... 2 Creating a New Survey... 5 Homepage
Working with Mailbox Manager
 Working with Mailbox Manager A user guide for Mailbox Manager supporting the Message Storage Server component of the Avaya S3400 Message Server Mailbox Manager Version 5.0 February 2003 Copyright 2003
Legal Kiosk TM v3.0. Internal User Guide
 Legal Kiosk TM v3.0 Internal User Guide Table of Contents Overview... 2 Legal Kiosk Admin Management... 3 User Access Section... 3 Adding A New User... 3 Adding a New Contact... 6 Granting Access to Files
Microsoft How to Series
 Microsoft How to Series Getting Started with EXCEL 2007 A B C D E F Tabs Introduction to the Excel 2007 Interface The Excel 2007 Interface is comprised of several elements, with four main parts: Office
AMP User Manual Reports
 AMP User Manual Reports AMP s reporting capabilities are designed to allow you the ability to create various types of customized reports that organize data in the way you need it presented. It is worth
Document Management System GUI. v6.0 User Guide
 Document Management System GUI v6.0 User Guide Copyright Copyright HelpSystems, LLC. All rights reserved. www.helpsystems.com US: +1 952-933-0609 Outside the U.S.: +44 (0) 870 120 3148 IBM, AS/400, OS/400,
DEPARTMENT OF EDUCATION. Schedules
 DEPARTMENT OF EDUCATION EDUCATOR CERTIFICATION Contents Revision History... 2 Revision History Chart... 2 1. How do I get started?... 3 2. Selecting a Schedule?... 5 3. Viewing the selected results...
Excel 2013 Intermediate
 Excel 2013 Intermediate Quick Access Toolbar... 1 Customizing Excel... 2 Keyboard Shortcuts... 2 Navigating the Spreadsheet... 2 Status Bar... 3 Worksheets... 3 Group Column/Row Adjusments... 4 Hiding
Steps: 1. Log in to the Dmitri application through the following website URL, as appropriate:
 Dmitri Suite Getting Started Logging In and Logging Out Logging In Use the following steps to log in to the Dmitri application. Steps: 1. Log in to the Dmitri application through the following website
Course Overview. Copyright 2010, Oracle and/or its affiliates. All rights reserved.
 Course Overview Course Objectives After completing this course, you should be able to do the following: Manage application navigation by using hierarchical lists with images, database-driven navigation,
My Sysco Reporting Job Aid for CMU Customers. My Sysco Reporting. For CMU Customers (Serviced by Program Sales)
") My Sysco Reporting For CMU Customers (Serviced by Program Sales) 1 Accessing My Sysco Reporting... 2 Logging In... 2 The Reporting Dashboard... 3 My Sysco Reporting Process... 6 Generating a Report...
My Sysco Reporting For CMU Customers (Serviced by Program Sales) 1 Accessing My Sysco Reporting... 2 Logging In... 2 The Reporting Dashboard... 3 My Sysco Reporting Process... 6 Generating a Report...
Data Should Not be a Four Letter Word Microsoft Excel QUICK TOUR
 Toolbar Tour AutoSum + more functions Chart Wizard Currency, Percent, Comma Style Increase-Decrease Decimal Name Box Chart Wizard QUICK TOUR Name Box AutoSum Numeric Style Chart Wizard Formula Bar Active
HOW TO UTILIZE MICROSOFT WORD TO CREATE A CLICKABLE ADOBE PORTABLE DOCUMENT FORMAT (PDF)
") HOW TO UTILIZE MICROSOFT WORD TO CREATE A CLICKABLE ADOBE PORTABLE DOCUMENT FORMAT (PDF) This tutorial expects a basic familiarity with Word 2010. If you can open a document, navigate tabs within a document,
HOW TO UTILIZE MICROSOFT WORD TO CREATE A CLICKABLE ADOBE PORTABLE DOCUMENT FORMAT (PDF) This tutorial expects a basic familiarity with Word 2010. If you can open a document, navigate tabs within a document,
Getting Started With the Cisco PAM Desktop Software
 CHAPTER 3 Getting Started With the Cisco PAM Desktop Software This chapter describes how to install the Cisco PAM desktop client software, log on to Cisco PAM, and begin configuring access control features
A Tutorial for Excel 2002 for Windows
 INFORMATION SYSTEMS SERVICES Data Manipulation with Microsoft Excel 2002 A Tutorial for Excel 2002 for Windows AUTHOR: Information Systems Services DATE: August 2004 EDITION: 1.0 TUT 130 UNIVERSITY OF
Running a Report in SPARRA Online. A Guide for Consumer Users
 Running a Report in SPARRA Online A Guide for Consumer Users Version 4.0 Health and Social Care, ISD May 2016 Page 1 of 17 Contents: Logging On... 3 Navigating to a Report... 4 Running a Report... 7 Saving
Administrator Quick Guide
 1 Administrator Quick Guide Login Screen The first page employees will see when visiting their training site is the login screen. This is where employees must enter their username and password to access
New User Orientation PARTICIPANT WORKBOOK
 New User Orientation PARTICIPANT WORKBOOK INTEGRATED SOFTWARE SERIES New User Orientation PARTICIPANT WORKBOOK Version 2.0 Copyright 2005 2009. Interactive Financial Solutions, Inc. All Rights Reserved.
IP4 - Running reports
 To assist with tracking and monitoring HRIS recruitment and personnel, reports can be run from Discoverer Plus. This guide covers the following process steps: Logging in... 2 What s changed? Changed reference
Managing Administrator Preferences
 Managing Administrator Preferences Purpose This lesson shows you how to use Grid Control to manage administrator preferences. Topics This module will discuss the following topics: Overview Prerequisites
Oracle Database. 2 Day + Application Express Developer s Guide Release 4.2 for Oracle Database 12c E
 Oracle Database 2 Day + Application Express Developer s Guide Release 4.2 for Oracle Database 12c E17960-05 March 2013 Oracle Database 2 Day + Application Express Developer's Guide, Release 4.2 for Oracle
Interim Standards New Directions Workbook One EASI Tool Excel Support Document Contents:
 Interim Standards New Directions Workbook One EASI Tool Excel Support Document Contents: 1. EASI Tool Template.... 2 2. Accessing and Saving the Tool Template.... 2 3. Screen View... 3 4. Comments/Guidance
Basic Query for Human Resources
 Basic Query for Human Resources Open browser Log into PeopleSoft Human Resources: Go to: https://cubshr9.clemson.edu/psp/hpprd/?cmd=login Enter your Novell ID and Password Click Sign In Navigation into
Department of Instructional Technology & Media Services Blackboard Grade Book
 Department of Instructional Technology & Media Services Blackboard Grade Book In your control panel, go to Assessment and grade center. Creating a Test In the Assessment section of the Control Panel, click
GSA QMAC. Transportation Service Provider (TSP) TransPort Integrator User Guide. TransPort Integrator Service. Version 3.0
 TransPort Integrator User Guide. TransPort Integrator Service. Version 3.0") GSA QMAC TransPort Integrator Service Transportation Service Provider (TSP) TransPort Integrator User Guide Version 3.0 Change Log Version # Date of Change Section Description of Change Changed By 1.0
GSA QMAC TransPort Integrator Service Transportation Service Provider (TSP) TransPort Integrator User Guide Version 3.0 Change Log Version # Date of Change Section Description of Change Changed By 1.0
GETTING STARTED. A Step-by-Step Guide to Using MarketSight
 GETTING STARTED A Step-by-Step Guide to Using MarketSight Analyze any dataset Run crosstabs Test statistical significance Create charts and dashboards Share results online Introduction MarketSight is a
Administrative Training Mura CMS Version 5.6
 Administrative Training Mura CMS Version 5.6 Published: March 9, 2012 Table of Contents Mura CMS Overview! 6 Dashboard!... 6 Site Manager!... 6 Drafts!... 6 Components!... 6 Categories!... 6 Content Collections:
Using WebNow to Process the Fund Establishment Form
 Using WebNow to Process the Fund Establishment Form Fund Est in WebNow 1 Last Updated 3/28/14 Table of Contents TOPIC PAGE 1. General WebNow Information a. Introduction 3 b. Log in 3 c. Adobe Reader 3
Oracle Application Express
 Oracle Application Express End User s Guide Release 4.2 E35124-03 January 2013 Oracle Application Express End User's Guide, Release 4.2 E35124-03 Copyright 2012, 2013, Oracle and/or its affiliates. All
Excel Tables & PivotTables
 Excel Tables & PivotTables A PivotTable is a tool that is used to summarize and reorganize data from an Excel spreadsheet. PivotTables are very useful where there is a lot of data that to analyze. PivotTables
eschoolplus+ Cognos Query Studio Training Guide Version 2.4
 + Training Guide Version 2.4 May 2015 Arkansas Public School Computer Network This page was intentionally left blank Page 2 of 68 Table of Contents... 5 Accessing... 5 Working in Query Studio... 8 Query
RONA e-billing User Guide
 RONA e-billing Contractor Self-Service Portal User Guide RONA e-billing User Guide 2015-03-10 Table of Contents Welcome to RONA e-billing What is RONA e-billing?... i RONA e-billing system requirements...
End User s Guide Release 5.0
 [1]Oracle Application Express End User s Guide Release 5.0 E39146-04 August 2015 Oracle Application Express End User's Guide, Release 5.0 E39146-04 Copyright 2012, 2015, Oracle and/or its affiliates. All
Working with Data in Microsoft Excel 2010
 Working with Data in Microsoft Excel 2010 This document provides instructions for using the sorting and filtering features in Microsoft Excel, as well as working with multiple worksheets in the same workbook
This document contains information that will help you to create and send graphically-rich and compelling HTML s through the Create Wizard.
 This document contains information that will help you to create and send graphically-rich and compelling HTML emails through the Create Email Wizard. or warranty by AT&T and is subject to change. 1 Contents
myvirena.com User Manual / Training Guide
 myvirena.com User Manual / Training Guide Registering as a New User... 3 User Roles... 5 Healthcare Provider Roles... 5 Organizational Administrator... 5 Authorized User... 5 Public Health Roles... 5 Country...
Division of School Facilities
 Division of School Facilities Module 3 EXCEL HIDE/ FILTER/ SORT & PRINT New York City Department of Education Office of Enterprise Development and Support Applications Support Group 2011 TABLE of CONTENTS
Help Contents. Custom Query Builder Functionality Synopsis
 Help Contents Custom Query Builder Functionality Synopsis... Section : General Custom Query Builder Functions... Section : Query Tool Main Menu Functions... Section : Query Tool Choose Datasource Functions...
Blackboard Learn: Basics
 Blackboard Learn: Basics This document includes the following topics: 1. Log in Page 2 2. Find Your Courses Page 2 3. View Course Content Page 3 4. Add a Folder Page 3 5. Add a File Page 5 6. Add a Web
Chapter 4. Microsoft Excel
 Chapter 4 Microsoft Excel Topic Introduction Spreadsheet Basic Screen Layout Modifying a Worksheet Formatting Cells Formulas and Functions Sorting and Filling Borders and Shading Charts Introduction A
Version 1.6. UDW+ Quick Start Guide to Functionality. Program Services Office & Decision Support Group
 Version 1.6 UDW+ Quick Start Guide to Functionality Program Services Office & Decision Support Group Table of Contents Access... 2 Log in/system Requirements... 2 Data Refresh... 2 00. FAME Chartfield