How to Create Excel Dashboard used in Solutions Conference By Matt Mason
|
|
|
- Bartholomew Carson
- 6 years ago
- Views:
Transcription

 To create Vendor Balances Excel Report Open Vendor Balances from GP Screen: Purchasing Excel Reports (from Navigation List). Find Vendor Vendor Balance. Double click to open.")
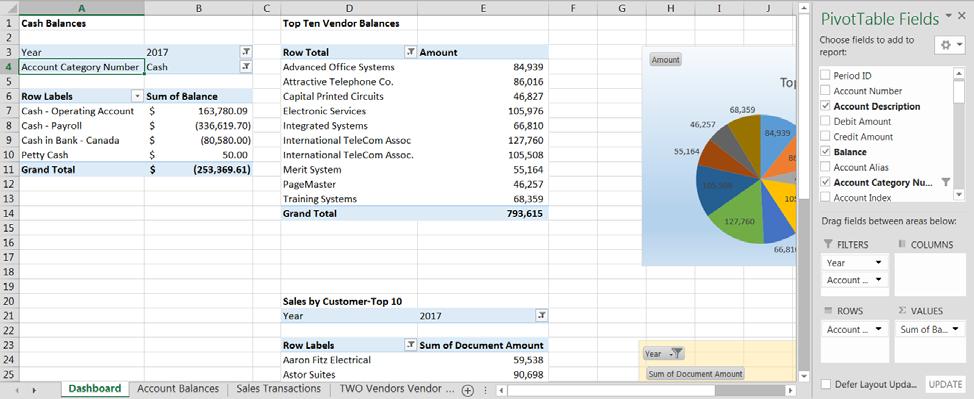
1 How to Create Excel Dashboard used in Solutions Conference 2017 By Matt Mason The following is a step by step procedure to create the Dashboard presented by Matt Mason in the Excel Tips and Tricks session of the Maner 2017 Solution Conference. NOTE: This presumes that Excel Reports have been deployed and that user has appropriate security to run them. The result: Dashboard will look similar to this: Summary: This is a combination of three Excel Reports: Vendor Balances (Purchasing) Sales Transactions Default (Sales) Account Summary (Financial) To create Vendor Balances Excel Report Open Vendor Balances from GP Screen: Purchasing Excel Reports (from Navigation List). Find Vendor Vendor Balance. Double click to open. Click Enable if prompted.

2 SAVE UNDER DIFFERENT NAME! File Save As. Create Company Dashboard Click Pivot Chart from the ribbon. Choose Pivot Chart and Pivot Table option. Click OK. This opens a new tab in same spreadsheet.


3 On Pivot Chart fields on right, drag Vendor Name down into Axis box area. Drag Current Balance into Values box area. If necessary, click on that value to change to Sum of Values In Row Labels on left, click drop down. Pick Value Filters then choose Top Ten. Highlight all the numbers in Column B and reformat to $ or,. Reduce Decimals to 0. (Right click is the easiest way to find formatting). Rename Sheet1 to Dashboard. Right click on Sheet 1 Rename


4 Cosmetics Right click on blank space in Chart. Choose Change Chart Type. Choose Pie. Click Ok. Right click on Pie in Chart. Click Add Data Labels. Click Add Data Labels again. Right click on blank space in Chart. Click Fill. Choose Gradient Fill. Click the title Total. Change to Top 10 Vendors. Put Title at Top of Spreadsheet: Top 10 Vendor Balances

5 To create Sales by Customer Excel Report Open Sales Transactions Default from GP Screen: Sales Excel Reports (from Navigation List). Find SalesTransactions Default. Double click to open. Click Enable if prompted. Modify the spreadsheet to add a column for year Right click on Column D. Insert to add column. Right click again. Format Cells. Use General Put cursor in first cell in column D. Type in the following formula: =YEAR(c2) When you hit Enter, ALL the cells below with populate with the year of the document. In Header cell, Replace Column 1 with Year MOST IMPORTANT POINT. Copy this to Company Dashboard spreadsheet. Place cursor on upper left cell to highlight entire spreadsheet. Copy using Ctrl C.
6 Go to Company Dashboard spreadsheet. Create a new Tab by clicking + at bottom of spreadsheet Paste spreadsheet using Ctrl V. This is now a separate tab Rename tab Sales Transactions You can close the original SalesTransaction Default Excel Report. Don t Save Changes Insert this onto Dashboard tab Click Pivot Chart from the ribbon. Choose Pivot Chart and Pivot Table option. Click Existing Spreadsheet radio button. Go to Dashboard Tab, click any cell below the Vendor Balances Pivot table. Click OK on the Create PivotTable window. Your pivot table and chart boxes will appear on the Dashboard tab. Move them as desired. On Pivot Chart fields on right, drag Customer Name down into Rows box area. Drag Document Amount into Values box area. If necessary, click on that value to change to Sum of Values Drag Year into Filters box area. In Row Labels on left, click drop down. Pick Value Filters then choose Top Ten. Highlight all the numbers in Column B and reformat to $ or,. Reduce Decimals to 0. (Right click is the easiest way to find formatting). On Pivot Table, on Year cell, pick 2017


7 Cosmetics Right click on blank space in Chart. Choose Change Chart Type. Choose Pie. Click Ok. Right click on Pie in Chart. Click Add Data Labels. Click Add Data Labels again. Right click on blank space in Chart. Click Fill. Choose Solid Fill. Pick a color. Change Transparency to 50%. Close Both Pivot Table Fields and Format Chart Area. Click the title Total. Change to 2017 Sales Top 10 Customers. Widen chart for better look. Type in Header Sales by Customer Top 10


8 To create Cash Balance Excel Report Open Account Summary Report from GP Screen: Financial Excel Reports (from Navigation List). Find AccountSummary. Double click to open. Click Enable if prompted. Note: this may prompt for Pivot table. Click OK Modify the spreadsheet to add a column for Balance Right click on Column G. Insert to add column. Put cursor in first cell in column D. Type in the following formula: =Debit Balance Credit Balance When you hit Enter, ALL the cells below with populate with the year of the document. In Header cell, Replace Column 1 with Balance MOST IMPORTANT POINT. Copy this to Company Dashboard spreadsheet. Place cursor on upper left cell to highlight entire spreadsheet. Copy using Ctrl C. Go to Company Dashboard spreadsheet. Create a new Tab by clicking + at bottom of spreadsheet Paste spreadsheet using Ctrl V. This is now a separate tab Rename tab Account Balances You can close the original AccountSummary Excel Report. Don t Save Changes

9 Insert this onto Dashboard tab First, go to Dashboard tab and insert two columns for A and B Click Pivot Table (NOT Pivot Chart) from the ribbon. Click Existing Spreadsheet radio button. Go to Dashboard Tab, click on Cells in Columns A and B below the Sales Transactions Pivot table. Click OK on the Create PivotTable window. Your pivot table and chart boxes will appear on the Dashboard tab. Move them as desired. On Pivot Chart fields on right, drag Account Description down into Rows box area. Drag Balance into Values box area. If necessary, click on that value to change to Sum of Values Drag Year into Filters box area. Drag Account Category Number into Filters box area. Highlight all the numbers in Column B and reformat to $ or,. (Right click is the easiest way to find formatting). On Pivot Table, on Year cell, pick 2017 On Pivot Table, on Account Category Number cell, pick Cash Move Pivot Table up to top of Spreadsheet, next to Vendor Balances. Insert a column C to provide space between data. Make a header called Cash Balances
10
. Same Font. Click View on ribbon. Unmark Grid Lines, Headings, Formula Bar.")
11 Final Cosmetics Holding down Ctrl key, highlight all tabs BUT Dashboard tab. Click Hide Insert 5 or 6 Rows at top of Dashboard tab Find your company logo and copy and paste it into Cell A1. To the right of your logo, type Company Dashboard. Make it a large font and Bold Underneath, create the formula =today(). Same Font. Click View on ribbon. Unmark Grid Lines, Headings, Formula Bar. Make it smaller but clicking size line at bottom right of spreadsheet and making 75% or so. Last, hide the ribbon by clicking the Ribbon. icon in upper right side of whole window. Click Auto Hide YOU RE DONE! Close Window and Save Changes.
Candy is Dandy Project (Project #12)
") Candy is Dandy Project (Project #12) You have been hired to conduct some market research about M&M's. First, you had your team purchase 4 large bags and the results are given for the contents of those
Candy is Dandy Project (Project #12) You have been hired to conduct some market research about M&M's. First, you had your team purchase 4 large bags and the results are given for the contents of those
Sort, Filter, Pivot Table
 Sort, Filter, Pivot Table Sort A common database task is to rearrange the information based on a header/field or headers/fields. This is called Sorting or Filtering. Sorting rearranges all of the information
WAAT-PivotTables Accounting Seminar
 WAAT-PivotTables-08-26-2016-Accounting Seminar Table of Contents What does a PivotTable do?... 2 How to create PivotTable:... 2 Add conditions to the PivotTable:... 2 Grouping Daily Dates into Years, Quarters,
Excel Tables & PivotTables
 Excel Tables & PivotTables A PivotTable is a tool that is used to summarize and reorganize data from an Excel spreadsheet. PivotTables are very useful where there is a lot of data that to analyze. PivotTables
Open Excel by following the directions listed below: Click on Start, select Programs, and the click on Microsoft Excel.
 Candy is Dandy Grading Rubric You have been hired to conduct some market research about M&M's. First, you had your team purchase 4 large bags and the results are given for the contents of those bags. You
Contents. Group 2 Excel Handouts 2010
 Contents Styles... 2 Conditional Formatting... 2 Create a New Rule... 4 Format as Table... 5 Create your own New Table Style... 8 Cell Styles... 9 New Cell Style... 10 Merge Styles... 10 Sparklines...
Excel Tables and Pivot Tables
 A) Why use a table in the first place a. Easy to filter and sort if you only sort or filter by one item b. Automatically fills formulas down c. Can easily add a totals row d. Easy formatting with preformatted
Basic Excel. Helen Mills OME-RESA
 Basic Excel Helen Mills OME-RESA Agenda Introduction- Highlight Basic Components of Microsoft Excel Entering & Formatting Data, Numbers, & Tables Calculating Totals & Summaries Using Formulas Conditional
Pivot Tables in Excel Contents. Updated 5/19/2016
 Pivot Tables in Excel 2010 Updated 5/19/2016 Contents Setup a Pivot Table in Excel 2010... 2 General Field List Features... 4 Summing and Counting Together... 6 Grouping Date Data... 7 Grouping Non-Date
Introduction to Excel 2013 Part 2
 Introduction to Excel 2013 Part 2 Open a file Select File from the Menu bar, select Open from the drop down menu, navigate to the place where the file was stored, double-left click on the file name. Modify
Excel Level 1
 Excel 2016 - Level 1 Tell Me Assistant The Tell Me Assistant, which is new to all Office 2016 applications, allows users to search words, or phrases, about what they want to do in Excel. The Tell Me Assistant
Pivot Table Project. Objectives. By the end of this lesson, you will be able to:
 Pivot Table Project Objectives By the end of this lesson, you will be able to: Set up a Worksheet Enter Labels and Values Use Sum and IF functions Format and align cells Change column width Use AutoFill
Business Process Procedures
 Business Process Procedures 14.40 MICROSOFT EXCEL TIPS Overview These procedures document some helpful hints and tricks while using Microsoft Excel. Key Points This document will explore the following:
Contents. What is the purpose of this app?
 Contents What is the purpose of this app?... 1 Setup and Configuration... 3 Guides... 4 nhanced 365 Panels and Tiles... 4 nhanced 365 Fields and Tables... 9 nhanced 365 Views... 12 What is the purpose
Rev. C 11/09/2010 Downers Grove Public Library Page 1 of 41
 Table of Contents Objectives... 3 Introduction... 3 Excel Ribbon Components... 3 Office Button... 4 Quick Access Toolbar... 5 Excel Worksheet Components... 8 Navigating Through a Worksheet... 8 Making
Creating Automated Dashboard Excel 2013 Contents
 Creating Automated Dashboard Excel 2013 Contents Summarize Data Using Pivot Table... 2 Constructing Report Summary... 2 Create a PivotTable from worksheet data... 2 Add fields to a PivotTable... 2 Grouping
Using Excel This is only a brief overview that highlights some of the useful points in a spreadsheet program.
 Using Excel 2007 This is only a brief overview that highlights some of the useful points in a spreadsheet program. 1. Input of data - Generally you should attempt to put the independent variable on the
PivotTables & Charts for Health
 PivotTables & Charts for Health Data Inputs PivotTables Pivot Charts Global Strategic Information UCSF Global Health Sciences Version Malaria 1.0 1 Table of Contents 1.1. Introduction... 3 1.1.1. Software
MICROSOFT EXCEL BIS 202. Lesson 1. Prepared By: Amna Alshurooqi Hajar Alshurooqi
 MICROSOFT EXCEL Prepared By: Amna Alshurooqi Hajar Alshurooqi Lesson 1 BIS 202 1. INTRODUCTION Microsoft Excel is a spreadsheet application used to perform financial calculations, statistical analysis,
Excel. Spreadsheet functions
 Excel Spreadsheet functions Objectives Week 1 By the end of this session you will be able to :- Move around workbooks and worksheets Insert and delete rows and columns Calculate with the Auto Sum function
Skittles Excel Project
 Skittles Excel Project Entering Your Data and Creating Data Displays 1. Open Microsoft Excel 2. Create a table for your Skittles colors: a. In cell A1 type in a title for your chart b. In cell A2 type
Excel Basics. TJ McKeon
 Excel Basics TJ McKeon What is Excel? Electronic Spreadsheet in a rows and columns layout Can contain alphabetical and numerical data (text, dates, times, numbers) Allows for easy calculations and mathematical
ADVANCED INQUIRIES IN ALBEDO: PART 2 EXCEL DATA PROCESSING INSTRUCTIONS
 ADVANCED INQUIRIES IN ALBEDO: PART 2 EXCEL DATA PROCESSING INSTRUCTIONS Once you have downloaded a MODIS subset, there are a few steps you must take before you begin analyzing the data. Directions for
Chapter-2 Digital Data Analysis
 Chapter-2 Digital Data Analysis 1. Securing Spreadsheets How to Password Protect Excel Files Encrypting and password protecting Microsoft Word and Excel files is a simple matter. There are a couple of
Basic tasks in Excel 2013
 Basic tasks in Excel 2013 Excel is an incredibly powerful tool for getting meaning out of vast amounts of data. But it also works really well for simple calculations and tracking almost any kind of information.
Using Numbers, Formulas, and Functions
 UNIT FOUR: Using Numbers, Formulas, and Functions T o p i c s : Using the Sort function Create a one-input data table Hide columns Resize columns Calculate with formulas Explore functions I. Using the
MS Office 2016 Excel Pivot Tables - notes
 Introduction Why You Should Use a Pivot Table: Organize your data by aggregating the rows into interesting and useful views. Calculate and sum data quickly. Great for finding typos. Create a Pivot Table
Introduction to Microsoft Excel 2010 Quick Reference Sheet
 Spreadsheet What is a spreadsheet? How is Excel 2010 different from previous versions? A grid of rows and columns that help to organize, summarize and calculate data. Microsoft Excel 2010 is built on the
Reference Services Division Presents. Excel Introductory Course
 Reference Services Division Presents Excel 2007 Introductory Course OBJECTIVES: Navigate Comfortably in the Excel Environment Create a basic spreadsheet Learn how to format the cells and text Apply a simple
Excel Contents. MS Excel /3/2011 JSD#2-Neptune Page 1
 Excel 2013 Contents Contents... 1 Opening Start Screen... 2 Formatting cells... 2 Modifying information in a cell... 2 Autofil... 3 Merge and Center Headings and Merge Cells... 3 Auto Calculation... 3
Working with Data in Microsoft Excel 2010
 Working with Data in Microsoft Excel 2010 This document provides instructions for using the sorting and filtering features in Microsoft Excel, as well as working with multiple worksheets in the same workbook
EXCEL 2010 TIPS & TRICKS
 EXCEL 2010 TIPS & TRICKS Training and Reference Guide Starlight Education Table of Contents Move to the End of a Row or Column of Data... 1 Select Cells Without Scrolling... 1 Select Non-Adjacent Ranges...
Starting Excel application
 MICROSOFT EXCEL 1 2 Microsoft Excel: is a special office program used to apply mathematical operations according to reading a cell automatically, just click on it. It is called electronic tables Starting
MicroStrategy Desktop
 MicroStrategy Desktop Quick Start Guide MicroStrategy Desktop is designed to enable business professionals like you to explore data, simply and without needing direct support from IT. 1 Import data from
Pivot Tables and Pivot Charts Activities
 PMI Online Education Pivot Tables and Pivot Charts Activities Microcomputer Applications Updated 12.16.2011 Table of Contents Objective 1: Create and Modify PivotTable Reports... 3 Organizing Data to Display
Excel 2007 Fundamentals
 Excel 2007 Fundamentals Introduction The aim of this document is to introduce some basic techniques for using Excel to enter data, perform calculations and produce simple charts based on that information.
Excel Training - Beginner March 14, 2018
 Excel Training - Beginner March 14, 2018 Working File File was emailed to you this morning, please log in to your email, download and open the file. Once you have the file PLEASE CLOSE YOUR EMAIL. Open
Presenter: Susan Campbell Wild Rose School Division
 Presenter: Susan Campbell Wild Rose School Division What is Excel? An electronic spreadsheet program and a powerful tool for analyzing and presenting information: Spreadsheet Used for entering and analyzing
Status Bar: Right click on the Status Bar to add or remove features.
 Excel 2013 Quick Start Guide The Excel Window File Tab: Click to access actions like Print, Save As, etc. Also to set Excel options. Ribbon: Logically organizes actions onto Tabs, Groups, and Buttons to
Spreadsheet definition: Starting a New Excel Worksheet: Navigating Through an Excel Worksheet
 Copyright 1 99 Spreadsheet definition: A spreadsheet stores and manipulates data that lends itself to being stored in a table type format (e.g. Accounts, Science Experiments, Mathematical Trends, Statistics,
Excel Advanced
 Excel 2016 - Advanced LINDA MUCHOW Alexandria Technical & Community College 320-762-4539 lindac@alextech.edu Table of Contents Macros... 2 Adding the Developer Tab in Excel 2016... 2 Excel Macro Recorder...
Application of Skills: Microsoft Excel 2013 Tutorial
 Application of Skills: Microsoft Excel 2013 Tutorial Throughout this module, you will progress through a series of steps to create a spreadsheet for sales of a club or organization. You will continue to
Excel 2013 PivotTables and PivotCharts
 Excel 2013 PivotTables and PivotCharts PivotTables... 1 PivotTable Wizard... 1 Creating a PivotTable... 2 Groups... 2 Rows Group... 3 Values Group... 3 Columns Group... 4 Filters Group... 5 Field Settings...
Unit 12. Electronic Spreadsheets - Microsoft Excel. Desired Outcomes
 Unit 12 Electronic Spreadsheets - Microsoft Excel Desired Outcomes Student understands Excel workbooks and worksheets Student can navigate in an Excel workbook and worksheet Student can use toolbars and
Checking whether the protocol was followed: gender and age 51
 Checking whether the protocol was followed: gender and age 51 Session 4: Checking whether the protocol was followed: gender and age In the data cleaning workbook there are two worksheets which form the
Data Should Not be a Four Letter Word Microsoft Excel QUICK TOUR
 Toolbar Tour AutoSum + more functions Chart Wizard Currency, Percent, Comma Style Increase-Decrease Decimal Name Box Chart Wizard QUICK TOUR Name Box AutoSum Numeric Style Chart Wizard Formula Bar Active
HO-1: BASIC SPREADSHEET SKILLS - CREATING A WORKBOOK
 HO-1: BASIC SPREADSHEET SKILLS - CREATING A WORKBOOK After completing this exercise you will be able to: Create a new workbook and add and rename worksheets. Enter data (text labels, numerical values and
Pivot Tables, Lookup Tables and Scenarios
 Introduction Format and manipulate data using pivot tables. Using a grading sheet as and example you will be shown how to set up and use lookup tables and scenarios. Contents Introduction Contents Pivot
WEEK NO. 12 MICROSOFT EXCEL 2007
 WEEK NO. 12 MICROSOFT EXCEL 2007 LESSONS OVERVIEW: GOODBYE CALCULATORS, HELLO SPREADSHEET! 1. The Excel Environment 2. Starting A Workbook 3. Modifying Columns, Rows, & Cells 4. Working with Worksheets
SPREADSHEET (Excel 2007)
") SPREADSHEET (Excel 2007) 1 U N I T 0 4 BY I F T I K H A R H U S S A I N B A B U R Spreadsheet Microsoft Office Excel 2007 (or Excel) is a computer program used to enter, analyze, and present quantitative
SPREADSHEET (Excel 2007) 1 U N I T 0 4 BY I F T I K H A R H U S S A I N B A B U R Spreadsheet Microsoft Office Excel 2007 (or Excel) is a computer program used to enter, analyze, and present quantitative
User Guide. DataInsight-Web
 User Guide DataInsight-Web Table of Contents DataInsight-Web... i Table of Contents... i Overview... 2 Documentation and Support... 2 Finding Data... 3 Keyword Search... 3 Basic Search... 3 Advanced Search...
Advanced Excel for EMIS Coordinators
 Advanced Excel for EMIS Coordinators Helen Mills helenmills@metasolutions.net 2015 Metropolitan Educational Technology Association Outline Macros Conditional Formatting Text to Columns Pivot Tables V-Lookup
Data. Selecting Data. Sorting Data
 1 of 1 Data Selecting Data To select a large range of cells: Click on the first cell in the area you want to select Scroll down to the last cell and hold down the Shift key while you click on it. This
The Menu and Toolbar in Excel (see below) look much like the Word tools and most of the tools behave as you would expect.
 look much like the Word tools and most of the tools behave as you would expect.") Launch the Microsoft Excel Program Click on the program icon in Launcher or the Microsoft Office Shortcut Bar. A worksheet is a grid, made up of columns, which are lettered and rows, and are numbered.
Launch the Microsoft Excel Program Click on the program icon in Launcher or the Microsoft Office Shortcut Bar. A worksheet is a grid, made up of columns, which are lettered and rows, and are numbered.
Microsoft Excel 2007 Beginning The information below is devoted to Microsoft Excel and the basics of the program.
 Microsoft Excel 2007 Beginning The information below is devoted to Microsoft Excel and the basics of the program. Starting Excel Option 1: Click the Start button on the taskbar, then Programs>Microsoft
Using Excel 2011 at Kennesaw State University
 Using Excel 2011 at Kennesaw State University Getting Started Information Technology Services Outreach and Distance Learning Technologies Copyright 2011 - Information Technology Services Kennesaw State
Introduction to Excel
 Office Button, Tabs and Ribbons Office Button The File menu selection located in the upper left corner in previous versions of Excel has been replaced with the Office Button in Excel 2007. Clicking on
Rev. B 12/16/2015 Downers Grove Public Library Page 1 of 40
 Objectives... 3 Introduction... 3 Excel Ribbon Components... 3 File Tab... 4 Quick Access Toolbar... 5 Excel Worksheet Components... 8 Navigating Through a Worksheet... 9 Downloading Templates... 9 Using
Microsoft Excel 2010 Training. Excel 2010 Basics
 Microsoft Excel 2010 Training Excel 2010 Basics Overview Excel is a spreadsheet, a grid made from columns and rows. It is a software program that can make number manipulation easy and somewhat painless.
Office of Instructional Technology
 Office of Instructional Technology Microsoft Excel 2016 Contact Information: 718-254-8565 ITEC@citytech.cuny.edu Contents Introduction to Excel 2016... 3 Opening Excel 2016... 3 Office 2016 Ribbon... 3
1. What is a PivotTable? What is a Cross Tab Report?
 Data Analysis & Business Intelligence Made Easy with Excel Power Tools Excel Data Analysis Basics = E-DAB Notes for Video: E-DAB-04: Summary Reports with Standard PivotTables & Slicers Objectives of Video:
Excel. Excel Options click the Microsoft Office Button. Go to Excel Options
 Excel Excel Options click the Microsoft Office Button. Go to Excel Options Templates click the Microsoft Office Button. Go to New Installed Templates Exercise 1: Enter text 1. Open a blank spreadsheet.
Creating Pivot Charts
 Creating Pivot Charts Pivot Tables in Microsoft Excel may be turned into dynamic charts to present data in a graphic manner. These charts are linked to the data in the Pivot Table, and change when filters
Basic Microsoft Excel 2011
 Basic Microsoft Excel 2011 Table of Contents Starting Excel... 2 Creating a New Workbook... 3 Saving a Workbook... 3 Creating New Worksheets... 3 Renaming a Worksheet... 3 Deleting a Worksheet... 3 Selecting
Advanced Microsoft Excel 2010
 Agenda: 1. Introduction 2. Complex formulas & cell references 3. Functions 4. Charts 5. Pivot Tables 6. Practice and Questions In order to keep computer literacy programs running in the future, we must
Technical White Paper
 Technical White Paper Via Excel (VXL) Item Templates This technical white paper is designed for Spitfire Project Management System users. In this paper, you will learn how to create Via Excel Item Templates
Microsoft Excel Tutorial
 Microsoft Excel Tutorial 1. GETTING STARTED Microsoft Excel is one of the most popular spreadsheet applications that helps you manage data, create visually persuasive charts, and thought-provoking graphs.
Getting Started with. Office 2008
 Getting Started with Office 2008 Copyright 2010 - Information Technology Services Kennesaw State University This document may be downloaded, printed, or copied, for educational use, without further permission
Excel 2013 Intermediate
 Excel 2013 Intermediate Quick Access Toolbar... 1 Customizing Excel... 2 Keyboard Shortcuts... 2 Navigating the Spreadsheet... 2 Status Bar... 3 Worksheets... 3 Group Column/Row Adjusments... 4 Hiding
Excel. Dashboard Creation. Microsoft # KIRSCHNER ROAD KELOWNA, BC V1Y4N TOLL FREE:
 Microsoft Excel Dashboard Creation #280 1855 KIRSCHNER ROAD KELOWNA, BC V1Y4N7 250-861-8324 TOLL FREE: 1-877-954-8433 INFO@POWERCONCEPTS.CA WWW.POWERCONECPTS.CA Dashboard Creation Contents Process Overview...
Excel 2013 Part 2. 2) Creating Different Charts
 Creating Different Charts") Excel 2013 Part 2 1) Create a Chart (review) Open Budget.xlsx from Documents folder. Then highlight the range from C5 to L8. Click on the Insert Tab on the Ribbon. From the Charts click on the dialogue
Excel 2013 Part 2 1) Create a Chart (review) Open Budget.xlsx from Documents folder. Then highlight the range from C5 to L8. Click on the Insert Tab on the Ribbon. From the Charts click on the dialogue
Using Excel to Troubleshoot EMIS Data
 Using Excel to Troubleshoot EMIS Data Overview Basic Excel techniques can be used to analyze EMIS data from Student Information Systems (SISs), from the Data Collector, and on ODE EMIS reports This session
Creating an Excel resource
 Excel Mobile Excel Mobile is a Microsoft application similar to Excel, but designed to run on handhelds. This mobile version of Excel is a spreadsheet application that allows you to manipulate numbers,
Advanced Excel Charts : Tables : Pivots
 Advanced Excel Charts : Tables : Pivots Protecting Your Tables/Cells Protecting your cells/tables is a good idea if multiple people have access to your computer or if you want others to be able to look
Table of Contents Data Validation... 2 Data Validation Dialog Box... 3 INDIRECT function... 3 Cumulative List of Keyboards Throughout Class:...
 Highline Excel 2016 Class 10: Data Validation Table of Contents Data Validation... 2 Data Validation Dialog Box... 3 INDIRECT function... 3 Cumulative List of Keyboards Throughout Class:... 4 Page 1 of
Copyright 2018 MakeUseOf. All Rights Reserved.
 The Beginner s Guide to Microsoft Excel Written by Sandy Stachowiak Published April 2018. Read the original article here: https://www.makeuseof.com/tag/beginners-guide-microsoftexcel/ This ebook is the
Chapter 4. Microsoft Excel
 Chapter 4 Microsoft Excel Topic Introduction Spreadsheet Basic Screen Layout Modifying a Worksheet Formatting Cells Formulas and Functions Sorting and Filling Borders and Shading Charts Introduction A
Advanced Excel. Click Computer if required, then click Browse.
 Advanced Excel 1. Using the Application 1.1. Working with spreadsheets 1.1.1 Open a spreadsheet application. Click the Start button. Select All Programs. Click Microsoft Excel 2013. 1.1.1 Close a spreadsheet
Making Excel Work for Your Tribal Community
 Making Excel Work for Your Tribal Community Excel Basics: Intermediate Skills PHONE: 1-800-871-8702 EMAIL: INFO@CBC4TRIBES.ORG WEB: TRIBALINFORMATIONEXCHANGE.ORG MAKING EXCEL WORK FOR YOUR TRIBAL COMMUNITY
A PRACTICAL TUTORIAL TO EXCEL
 2010 BEGINNERS A PRACTICAL TUTORIAL TO EXCEL by: Julio C. Fajardo A Practical Tutorial to Excel About: Excel is one of the early software tools developed by Microsoft. The program has been widely adopted
EXCEL 2007 TIP SHEET. Dialog Box Launcher these allow you to access additional features associated with a specific Group of buttons within a Ribbon.
 EXCEL 2007 TIP SHEET GLOSSARY AutoSum a function in Excel that adds the contents of a specified range of Cells; the AutoSum button appears on the Home ribbon as a. Dialog Box Launcher these allow you to
Hands-On Lab. Developing BI Applications. Lab version: Last updated: 2/23/2011
 Hands-On Lab Developing BI Applications Lab version: 1.0.0 Last updated: 2/23/2011 CONTENTS OVERVIEW... 3 EXERCISE 1: USING THE CHART WEB PART... 4 Task 1 Add the Chart Web Part to the page... 4 Task 2
Basics of Spreadsheet
 106 :: Data Entry Operations 6 Basics of Spreadsheet 6.1 INTRODUCTION A spreadsheet is a large sheet having data and information arranged in rows and columns. As you know, Excel is one of the most widely
Objective: Class Activities
 Objective: A Pivot Table is way to present information in a report format. The idea is that you can click drop down lists and change the data that is being displayed. Students will learn how to group data
download instant at
 CHAPTER 1 - LAB SESSION INTRODUCTION TO EXCEL INTRODUCTION: This lab session is designed to introduce you to the statistical aspects of Microsoft Excel. During this session you will learn how to enter
WELCOME TO BEGINNER EXCEL. Where we hope to EXCEL lerate Your Life
 WELCOME TO BEGINNER EXCEL Where we hope to EXCEL lerate Your Life What is Excel? An electronic spreadsheet program and a powerful tool for analyzing and presenting information: Spreadsheet Used forentering
SHOW ME THE NUMBERS: DESIGNING YOUR OWN DATA VISUALIZATIONS PEPFAR Applied Learning Summit September 2017 A. Chafetz
 SHOW ME THE NUMBERS: DESIGNING YOUR OWN DATA VISUALIZATIONS PEPFAR Applied Learning Summit September 2017 A. Chafetz Overview In order to prepare for the upcoming POART, you need to look into testing as
PIVOT TABLES IN MICROSOFT EXCEL 2016
 PIVOT TABLES IN MICROSOFT EXCEL 2016 A pivot table is a powerful tool that allows you to take a long list of data and transform it into a more compact and readable table. In the process, the tool allows
ADD AND NAME WORKSHEETS
 1 INTERMEDIATE EXCEL While its primary function is to be a number cruncher, Excel is a versatile program that is used in a variety of ways. Because it easily organizes, manages, and displays information,
An Introduction to Microsoft Excel For Adult Learners. A Project-Based Approach
 An Introduction to Microsoft Excel For Adult Learners A Project-Based Approach Introduction Why should you use Microsoft Excel? Microsoft Excel is one of the most common tools in any business. It may be
The Basics of PowerPoint
 MaryBeth Rajczewski The Basics of PowerPoint Microsoft PowerPoint is the premiere presentation software. It enables you to create professional presentations in a short amount of time. Presentations using
Microsoft Excel 2016 / 2013 Basic & Intermediate
 Microsoft Excel 2016 / 2013 Basic & Intermediate Duration: 2 Days Introduction Basic Level This course covers the very basics of the Excel spreadsheet. It is suitable for complete beginners without prior
4) Study the section of a worksheet in the image below. What is the cell address of the cell containing the word "Qtr3"?
 Study the section of a worksheet in the image below. What is the cell address of the cell containing the word Qtr3?") Choose The Correct Answer: 1) Study the highlighted cells in the image below and identify which of the following represents the correct cell address for these cells: a) The cell reference for the selected
Choose The Correct Answer: 1) Study the highlighted cells in the image below and identify which of the following represents the correct cell address for these cells: a) The cell reference for the selected
THE AMERICAN LAW INSTITUTE Continuing Legal Education
 67 THE AMERICAN LAW INSTITUTE Continuing Legal Education Using Everyday Tech Tools To Maximize Your Law Practice Plus Ethics April 26, 2018 Philadelphia, Pennsylvania Utilizing Microsoft Excel for a More
Microsoft Excel Office 2016/2013/2010/2007 Tips and Tricks
 Microsoft Excel Office 2016/2013/2010/2007 Tips and Tricks In Office 2007, the OFFICE BUTTON is the symbol at the top left of the screen. 1 Enter Fractions That Will Display And Calculate Properly a. Type
Service Line Export and Pivot Table Report (Windows Excel 2010)
") Service Line Export and Pivot Table Report (Windows Excel 2010) In this tutorial, we will take the Service Lines of the Active Students only and only the most recent record to take a snapshot look at approximate
Service Line Export and Pivot Table Report (Windows Excel 2010) In this tutorial, we will take the Service Lines of the Active Students only and only the most recent record to take a snapshot look at approximate
Dynamics GP SmartList Lab. Matt Mason
 Dynamics GP SmartList Lab Matt Mason mmason@manersolutions.com Exercise 1 - Warmup Exercise Income Statement Accounts Open SmartList Screen: Microsoft Dynamics GP SmartList Choose + next to Financial
WHY USE EXCEL? KEY EXCEL TERMINOLOGY
 WHY USE EXCEL? Excel allows users to organize, format, and calculate data with formulas using a spreadsheet system broken up by rows and columns. Excel allows us the ability to create templates with multiple
Advanced Excel Selecting and Navigating Cells
 Advanced Excel 2007 One major organizational change in Excel 2007, when compared to 2003, is the introduction of ribbons. Each ribbon reveals many more options depending on what tab is selected. The Help
Excel Part 2 Textbook Addendum
 Excel Part 2 Textbook Addendum 1. Page 9 Range Names Sort Alert After completing Activity 1-1, observe what happens if you sort the data in ascending order by Quarter 3. After sorting the data, chances