Integrated Clinical Systems, Inc. announces JReview 13.1 with new AE Incidence
|
|
|
- Rebecca Sims
- 5 years ago
- Views:
Transcription
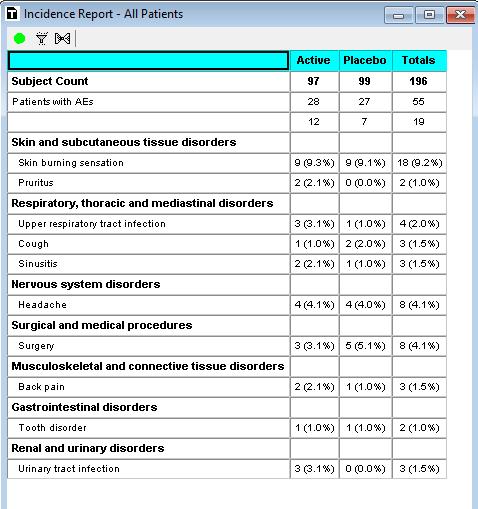
1 Integrated Clinical Systems, Inc. announces JReview 13.1 with new AE Incidence Table (nested descending sort AE Table) Report Template, additional Graph Types, and a major new area Data Quality Analysis for centralized statistical monitoring, and many other features. Frenchtown, NJ July 25, 2018 Integrated Clinical Systems, Inc. (ICS) developers of Integrated Review & JReview, the world s most comprehensive clinical review and analysis software tool, today announced JReview version 13.1 Here are some of the major highlights of this new JReview version: Template Reports major addition to template report area. Initially introduced in version 13.0 with the Demographic Summary Table template, version 13.1 adds the very commonly used AE Incidence Table to the set. As with the demographic summary table it s an easy to use drag and drop interface adding the AE coded term levels to the definition typically SOC and PT, as well as a column variable either Study, some other categorical item, etc. and some general overview statistics to display number of patients with AEs as well as different subsets, for example, number of patients with Serious AEs, etc. The default presentation is in descending order of most frequent SOC reports with PTs nested below, also in descending order of most frequent PT reports. The other very commonly requested feature is to be able to specify a cutoff % - for example 2, which means that detail levels (PT) entries are only included if at least one of the entries for the PT are at least 2% of the population. And the SOCs are included only if at least one of their PTs meet the cutoff. Interestingly, the cutoff % or cutoff count is also interactive so users can experiment with different cutoff % - to see the resulting content. If multiple columns, such as treatment group, are included, the user can choose which to use for descending sort, or <totals>. Here s a screenshot of the preview display of the Incidence table showing the cutoff % selection of 2%:

2 When the user either saves and executes the saved definition from the Object Explorer, or clicks the Create Report button a window displaying the results is displayed. Please note that the results are also clickable just like a crosstab so if the user clicks on any of the cells in the table they ll see which patients are contained within the count (highlighting those patients in any reports, graphs, patient profiles displayed).
3

4 Scheduling The print server/scheduling server has been updated supporting multiple threads (configurable max number of threads), to multiple jobs at the same time. Scheduling of patient profiles and patient narratives continues to be supported as an optional module. Graph Browser More control over graph properties more colors including more subdued colors as default, line thickness, symbol size, etc. Continuing the addition of several graph patterns/types popular in oncology version 13.1 adds two new graph types - a mean plus/minus standard error line chart and spider plot. Line Chart Mean +- SE (Standard Error) The error bars included in this line chart are Standard Error bars. Previously, only Std Dev was available. Here s an example screenshot:
, and by default plotting change from baseline values of")

5 The spider plot is used to display data over time (calculating days since a reference date on the fly), and by default plotting change from baseline values of the item on the y-axis. Here s the definition window, and a preview. Here s a generated spider plot, with filter controls, to include/exclude specific groups, sites, etc.


6 General HRZ panels throughout Previously, the HRZ panels (Vertical to Horizontal Panel definitions) were only available in the New UI in Graphs and Reports. Now HRZ panels appear throughout JReview- including their use in Patient Selection Criteria, Output Filter, and any of the browser definition areas. AE Risk Assessment Added ability to export Risk Assessment information at multiple levels. After executing an AE Risk Assessment the user can select File Export which displays the following dialog where they can select if they want to export the details of the AE Risk Assessment with All Levels of MEDDRA terms, or just the top level. Also another option is to export the presentation (graphics). If the user selects Export to Excel All Levels here s an example screenshot of the display which includes a column for each of the MEDDRA levels that were included in the AE Risk Assessment in this case SOC and PT, with the SOC repeated on each row for each PT:

7 Data Quality Analysis major new area A major new capability has been added to JReview version 13.1 which provides an unsupervised centralized statistical review of data in a trial on an ongoing basis directly against the data accessed by JReview. This area runs a battery of tests against the data including duplicate patient detection, and a wide range of statistical tests, then generates a global score for each geographic area (country, for example), and each site within the region. The data to be included in the evaluation, as well as which tests should be included (default is all the tests that are included), plus weighting factors for generating the global score from the contributing tests can all be selected/modified by the user setting up the definitions. Here s a walk-through of the results once an analysis has been conducted, followed by an overview of the definition area. 1. An overview display under the Statistical Analysis tab, and Site Score Treemap shows the coloration of global score sites within country (optional level). When click on one of the sites, the darker color, the higher the global score the table below displays the analysis details behind the global score.

8 When you click on the Site Analysis Table or Geo Location Analysis Table (Geo Location in this screenshot) you see the countries, and their respective global score, and the results of each of the specific analyses a check mark means that country was flagged for that analysis and each of the flagged analyses contribute to the global score based on weighting factors that are defined in the definition screen described below. If one of the analyses is blank (no checkbox) that means the analysis wasn t run due to either not enough information, or the user had asked that the analysis not be included. Clicking on any of the country lines updates the Analysis Details table on the bottom of the window.
9 2. Clicking on the Data Distribution tab displays a list of tables/datasets in the data, and items/columns within each. Clicking on any of the tables -> Items, then displays the details of a variety of statistics for that item displayed by country, then clicking on + opens the country to display the included sites in the country. The Score (global score) column is included for information, but isn t specific to the item selected the other statistics are but the score is present for information, and sorting purposes. Clicking on any of the countries or sites then updates the other graphics on the page data distribution for the item, histogram of distribution, etc.

10 3. Clicking on the Last Digit Preference tab toward the bottom of the window displays the digit preference for the country or site compared to all others:

11 4. Clicking on the Duplicates tab toward the bottom displays the possible duplicate patients and percent duplicates. This info is driven by information provided during the definition step described below:

12 5. Definition step done prior to scheduling analysis selects which variables should be included (checked in the general column, which items should be considered for duplicate patient determination checking items in the Patient Info column. Next area is Categories those are the types of analyses that will be conducted all are included by default. The weight column lets the user change the relative importance of each of the analyses. The definition areas to the right are for options GeoLocation definition (Country typically), as well as information for Start and Stop dates (used during some of the analyses), location of an Adverse Event variable (with filtering possible), and Patient Completion information. All of these are considered during some of the analyses. About JReview JReview is the fastest, easiest way to review, graph, report, and analyze your clinical data. It is a webenabled software application written specifically for pharmaceutical, biotech and medical device companies doing clinical research. It provides many vital tools needed to perform clinical data review, ad hoc reporting, data visualization, analysis, and risk assessment of clinical studies data. By interacting with various patient subsets and using any combination of browser modules or dashboards within the product, users can easily review and/or monitor their clinical trials for safety, efficacy, etc.
13 About Integrated Clinical Systems, Inc. Integrated Clinical Systems, Inc. (ICS) headquartered in Frenchtown, NJ, is an industry-leading developer of software applications for pharmaceutical, biotech and medical device companies worldwide. Their original software application, Integrated Review, provides ongoing, realtime review of clinical data and an easy-to-use, intuitive means of profiling patients, reporting, graphing, ad-hoc data mining and signal detection for clinical data stored in third-party or in-house data management software systems or data warehouses. This functionality has been ported to a web-enabled software application, JReview, and has been expanded even more with new features. These products have been developed by professionals from the pharmaceutical industry, and they continue to be refined and enhanced by customer and FDA feedback. It is this specialization and industry focus that provides their clients with the reporting and analysis capabilities that allow them to bring products to the market safely, efficiently, speedily and cost effectively. Integrated Review is trademarked and JReview is a registered trademark of Integrated Clinical Systems, Inc. Copyright All rights reserved. For Further Information Eric S. Herbel, President Integrated Clinical Systems, Inc. 900 State Hwy 12 Frenchtown, NJ eherbel@i-review.com # # #
Integrated Clinical Systems, Inc. releases JReview with Report Reviewer
 Integrated Clinical Systems, Inc. releases JReview 12.0.1 with Report Reviewer Note extensions, volcano plots, histogram distribution plots, composite Hy s Law plot, Dashboard Views performance improvements
JMP Clinical. Release Notes. Version 5.0
 JMP Clinical Version 5.0 Release Notes Creativity involves breaking out of established patterns in order to look at things in a different way. Edward de Bono JMP, A Business Unit of SAS SAS Campus Drive
Standard Safety Visualization Set-up Using Spotfire
 Paper SD08 Standard Safety Visualization Set-up Using Spotfire Michaela Mertes, F. Hoffmann-La Roche, Ltd., Basel, Switzerland ABSTRACT Stakeholders are requesting real-time access to clinical data to
Advanced Data Visualization using TIBCO Spotfire and SAS using SDTM. Ajay Gupta, PPD
 Advanced Data Visualization using TIBCO Spotfire and SAS using SDTM Ajay Gupta, PPD INTRODUCTION + TIBCO Spotfire is an analytics and business intelligence platform, which enables data visualization in
GETTING STARTED. A Step-by-Step Guide to Using MarketSight
 GETTING STARTED A Step-by-Step Guide to Using MarketSight Analyze any dataset Run crosstabs Test statistical significance Create charts and dashboards Share results online Introduction MarketSight is a
Getting Started With. A Step-by-Step Guide to Using WorldAPP Analytics to Analyze Survey Data, Create Charts, & Share Results Online
 Getting Started With A Step-by-Step Guide to Using WorldAPP Analytics to Analyze Survey, Create Charts, & Share Results Online Variables Crosstabs Charts PowerPoint Tables Introduction WorldAPP Analytics
ehepqual- HCV Quality of Care Performance Measure Program
 NEW YORK STATE DEPARTMENT OF HEALTH AIDS INSTITUTE ehepqual- HCV Quality of Care Performance Measure Program USERS GUIDE A GUIDE FOR PRIMARY CARE AND HEPATITIS C CARE PROVIDERS * * For use with ehepqual,
SAS Visual Analytics 8.2: Getting Started with Reports
 SAS Visual Analytics 8.2: Getting Started with Reports Introduction Reporting The SAS Visual Analytics tools give you everything you need to produce and distribute clear and compelling reports. SAS Visual
OneView. User s Guide
 OneView User s Guide Welcome to OneView. This user guide will show you everything you need to know to access and utilize the wealth of information available from OneView. The OneView program is an Internet-based
SedonaOffice Users Conference. San Francisco, CA January 21 24, Query Builders. Presented by: Matt Howe
 SedonaOffice Users Conference San Francisco, CA January 21 24, 2018 Query Builders Presented by: Matt Howe This Page Intentionally Left Blank Page 2 of 20 Table of Contents Overview... 4 Example 1 Sales
MicroStrategy Desktop
 MicroStrategy Desktop Quick Start Guide MicroStrategy Desktop is designed to enable business professionals like you to explore data, simply and without needing direct support from IT. 1 Import data from
JMP Clinical. Getting Started with. JMP Clinical. Version 3.1
 JMP Clinical Version 3.1 Getting Started with JMP Clinical Creativity involves breaking out of established patterns in order to look at things in a different way. Edward de Bono JMP, A Business Unit of
Real Time Clinical Trial Oversight with SAS
 PharmaSUG 2017 - Paper DA01 Real Time Clinical Trial Oversight with SAS Ashok Gunuganti, Trevena ABSTRACT A clinical trial is an expensive and complex undertaking with multiple teams working together to
Management Reports Centre. User Guide. Emmanuel Amekuedi
 Management Reports Centre User Guide Emmanuel Amekuedi Table of Contents Introduction... 3 Overview... 3 Key features... 4 Authentication methods... 4 System requirements... 5 Deployment options... 5 Getting
AudienceView How To Guides How to Run a Crosstab Report
 AudienceView How To Guides How to Run a Crosstab Report What is a Crosstab report? A Crosstab Report allows you to conduct data exploration and profiling exercises for selected audiences using the full
Pooling Clinical Data: Key points and Pitfalls. October 16, 2012 Phuse 2012 conference, Budapest Florence Buchheit
 Pooling Clinical Data: Key points and Pitfalls October 16, 2012 Phuse 2012 conference, Budapest Florence Buchheit Introduction Are there any pre-defined rules to pool clinical data? Are there any pre-defined
Shopping Cart: Queries, Personalizations, Filters, and Settings
 Shopping Cart: Queries, Personalizations, Filters, and Settings on the Shopping Cart Home Page Use this Job Aid to: Learn how to organize the Shopping Cart home page so that it is easier to use. BEFORE
OnCore Enterprise Research. Subject Administration Full Study
 OnCore Enterprise Research Subject Administration Full Study Principal Investigator Clinical Research Coordinator June 2017 P a g e 1 This page is intentionally blank. P a g e 2 Table of Contents What
Create Custom Tables in No Time
 PASW Custom Tables 18 Create Custom Tables in No Time Easily analyze data and communicate your results with PASW Custom Tables Show the results of analyses clearly and quickly You often report the results
Comprehensive Capabilities Comparison
 page 1 of 9 Comprehensive Capabilities Comparison General Key Included, no added cost Add-on/Low cost $ Not Available X Add-on/High cost $$$ Cost $ $ $$$ $$$ Complete cross-functionality between native
MicroStrategy Desktop Quick Start Guide
 MicroStrategy Desktop Quick Start Guide Version: 10.4 10.4, December 2017 Copyright 2017 by MicroStrategy Incorporated. All rights reserved. Trademark Information The following are either trademarks or
ARM Apps. What are ARM Apps?
 ARM Apps Active Risk Manager (ARM) Apps make it affordable to bring a range of risk management and compliance functionality to employees throughout the business and supply chain. ARM Apps provide a simple
AdisInsight User Guide. July 2015
 AdisInsight User Guide July 2015 Table of Contents Registering an account on AdisInsight Log In AdisInsight Subscription Access Basic Search Advanced Search Refine Your Search Viewing a DRUG Profile Record
QuickStart Manual Basic navigation techniques to get to your data fast. scan.com/tascangui
 QuickStart Manual Basic navigation techniques to get to your data fast http://www.ta- scan.com/tascangui 1 The Homepage... 3 2 Top Menu... 4 3 Graphic User Interphase (GUI) philosophy... 4 4 Portfolio
Getting started with Inspirometer A basic guide to managing feedback
 Getting started with Inspirometer A basic guide to managing feedback W elcome! Inspirometer is a new tool for gathering spontaneous feedback from our customers and colleagues in order that we can improve
SAS Web Report Studio 3.1
 SAS Web Report Studio 3.1 User s Guide SAS Documentation The correct bibliographic citation for this manual is as follows: SAS Institute Inc. 2006. SAS Web Report Studio 3.1: User s Guide. Cary, NC: SAS
Key. General. Host Account Functionality. Included, no-cost Not Included Add-on/Low cost $ Add-on/High cost $$$
 Key Included, no-cost Not Included Add-on/Low cost $ Add-on/High cost $$$ General X Cost $ $ $$$ $$$ Complete cross-functionality between native mobile app and web-based system Ability to create host accounts
Note: The default password for all Professional programs is hhgold (lowercase).
.") Getting Started To start Professional, double-click the following icon. The first form Professional displays is the Password screen. Enter your password here. See the Change Password section below on how
Getting Started To start Professional, double-click the following icon. The first form Professional displays is the Password screen. Enter your password here. See the Change Password section below on how
Recording Vital Signs and Test Results in Med-Center
 Recording Vital Signs and Test Results in Med-Center Introduction This technical note discusses Med-Center s ability to record and plot lab test results or patient vital signs. This capability is a new
Go back to your Excel sheet. Choose Paste to Sheet tab at the bottom.
 PCC: How to easily calculate monthly weights. All names on this report are fictitious to protect patient information. The images contained are from a Mac computer, if you use a PC and have difficulty with
IBM InfoSphere Information Server Version 8 Release 7. Reporting Guide SC
 IBM InfoSphere Server Version 8 Release 7 Reporting Guide SC19-3472-00 IBM InfoSphere Server Version 8 Release 7 Reporting Guide SC19-3472-00 Note Before using this information and the product that it
Indenting with Style
 ABSTRACT Indenting with Style Bill Coar, Axio Research, Seattle, WA Within the pharmaceutical industry, many SAS programmers rely heavily on Proc Report. While it is used extensively for summary tables
Instructional Improvement System (IIS) Dashboard District User Guide Statewide Longitudinal Data System (SLDS)
 Dashboard District User Guide Statewide Longitudinal Data System (SLDS)") Instructional Improvement System (IIS) Dashboard District User Guide Statewide Longitudinal Data System (SLDS) June 10, 2014 Page 1 of 36 IIS Dashboard District User Guide 2 Contents Project Overview...
Instructional Improvement System (IIS) Dashboard District User Guide Statewide Longitudinal Data System (SLDS) June 10, 2014 Page 1 of 36 IIS Dashboard District User Guide 2 Contents Project Overview...
Master Reports Guide. Table of Contents
 Table of Contents Welcome to Master Reports... 2 Report Basics... 2 Access Reports... 2 Download or Print a Report... 2 Report Help... 2 Save or Share a Report... 2 Master Report Formulas... 3 Filter a
Intellicus Enterprise Reporting and BI Platform
 Designing Adhoc Reports Intellicus Enterprise Reporting and BI Platform Intellicus Technologies info@intellicus.com www.intellicus.com Designing Adhoc Reports i Copyright 2012 Intellicus Technologies This
Introduction to Nesstar
 Introduction to Nesstar Nesstar is a software system for online data analysis. It is available for use with many of the large UK surveys on the UK Data Service website. You will know whether you can use
XLCubed Version 9 QuickStart
 XLCubed Version 9 QuickStart 1 P a g e Contents Welcome... 3 Connecting to your data... 3 XLCubed for Pivot Table users... 3 Adding a Grid, and the Report Designer... 5 Working with Grids... 7 Grid Components...
Study Data Reviewer s Guide Completion Guideline
 Study Data Reviewer s Guide Completion Guideline 22-Feb-2013 Revision History Date Version Summary 02-Nov-2012 0.1 Draft 20-Nov-2012 0.2 Added Finalization Instructions 10-Jan-2013 0.3 Updated based on
Importing Career Standards Benchmark Scores
 Importing Career Standards Benchmark Scores The Career Standards Benchmark assessments that are reported on the PIMS Student Fact Template for Career Standards Benchmarks can be imported en masse using
gc4you.com User Guide 2010
 Table of Contents Introduction... 2 Sign On and Authentication... 3 Standard Portal Page Components... 4 Navigation... 8 Searching Portal Search... 10 Search Results... 11 Bring2Mind\DMX... 12 Document
Business Insight Authoring
 Business Insight Authoring Getting Started Guide ImageNow Version: 6.7.x Written by: Product Documentation, R&D Date: August 2016 2014 Perceptive Software. All rights reserved CaptureNow, ImageNow, Interact,
Work Instruction Study Setup
 THE UNIVERSITY OF TEXAS HEALTH SCIENCE CENTER AT SAN ANTONIO Work Instruction Study Setup Velos - eresearch 10.0 Version: 1.0, 02/16/2018 Revision History Version/Amendment #: Version Date: Description:
The results section of a clinicaltrials.gov file is divided into discrete parts, each of which includes nested series of data entry screens.
 OVERVIEW The ClinicalTrials.gov Protocol Registration System (PRS) is a web-based tool developed for submitting clinical trials information to ClinicalTrials.gov. This document provides step-by-step instructions
Verint Enterprise Feedback Management TM. EFM 15.1 FP3 Release Overview October 2016
 Verint Enterprise Feedback Management TM EFM 15.1 FP3 Release Overview October 2016 Table of Contents Welcome to 15.1 FP3... 1 Advanced Dashboard... 1 Custom Filters By Question... 2 Custom Filter Groups...
Section 1. Introduction. Section 2. Getting Started
 Section 1. Introduction This Statit Express QC primer is only for Statistical Process Control applications and covers three main areas: entering, saving and printing data basic graphs control charts Once
CERTIFICATE IN BIG DATA TECHNIQUES ON SMALL DATA FORMAT UTILIZING MICROSOFT EXCEL
 CERTIFICATE IN BIG DATA TECHNIQUES ON SMALL DATA FORMAT UTILIZING MICROSOFT EXCEL Conducted by: Palani Murugappan Contact Palani / Aaron : http://www.malaysia-training.com Certificate from the United Kingdom
Microsoft Office Illustrated. Using Tables
 Microsoft Office 2007 - Illustrated Using Tables Objectives Plan a Table Create a Table Add Table Data Find and Replace Table Data Delete Table Data 2 Objectives Sort Table Data Use Formulas in a Table
Statistics with a Hemacytometer
 Statistics with a Hemacytometer Overview This exercise incorporates several different statistical analyses. Data gathered from cell counts with a hemacytometer is used to explore frequency distributions
Advanced Visualization using TIBCO Spotfire and SAS
 PharmaSUG 2018 - Paper DV-04 ABSTRACT Advanced Visualization using TIBCO Spotfire and SAS Ajay Gupta, PPD, Morrisville, USA In Pharmaceuticals/CRO industries, you may receive requests from stakeholders
 Page 1 of 6 Procedures > Pages > Procedures Use -the-system > MI-generate-report MI - Generate Report I Like It Tags & Notes MI - Generate Report This is an explanation of how to access, view and filter
Clinical Data Visualization using TIBCO Spotfire and SAS
 ABSTRACT SESUG Paper RIV107-2017 Clinical Data Visualization using TIBCO Spotfire and SAS Ajay Gupta, PPD, Morrisville, USA In Pharmaceuticals/CRO industries, you may receive requests from stakeholders
Work Instruction Study Startup
 THE UNIVERSITY OF TEXAS HEALTH SCIENCE CENTER AT SAN ANTONIO Work Instruction Study Startup Velos - eresearch 9.2 Version: 2.0, 04/29/2015 Version 2.0, 04/29/2015 Revision History Version/Amendment #:
Elixir Ad-hoc Report. Release Elixir Technology Pte Ltd
 Elixir Ad-hoc Report Release 3.5.0 Elixir Technology Pte Ltd Elixir Ad-hoc Report: Release 3.5.0 Elixir Technology Pte Ltd Published 2014 Copyright 2014 Elixir Technology Pte Ltd All rights reserved. Java
Construction IC User Guide. Analyse Markets.
 Construction IC User Guide Analyse Markets clientservices.construction@globaldata.com https://construction.globaldata.com Analyse Markets Our Market Analysis Tools are designed to give you highly intuitive
Working with Data in Microsoft Excel 2010
 Working with Data in Microsoft Excel 2010 This document provides instructions for using the sorting and filtering features in Microsoft Excel, as well as working with multiple worksheets in the same workbook
Getting started with Ms Access Getting Started. Primary Key Composite Key Foreign Key
 Getting started with Ms Access 2007 Getting Started Customize Microsoft Office Toolbar The Ribbon Quick Access Toolbar Navigation Tabbed Document Window Viewing Primary Key Composite Key Foreign Key Table
One-PROC-Away: The Essence of an Analysis Database Russell W. Helms, Ph.D. Rho, Inc.
 One-PROC-Away: The Essence of an Analysis Database Russell W. Helms, Ph.D. Rho, Inc. Chapel Hill, NC RHelms@RhoWorld.com www.rhoworld.com Presented to ASA/JSM: San Francisco, August 2003 One-PROC-Away
Nightingale On Demand. Data Miner 2-1
 Nightingale On Demand Data Miner 2-1 Table of Contents Data Miner Overview... 3 To Run a Report... 3 To Edit a Report... 3 To Search for a Report... 5 To Create a New Report... 5 2-2 Nightingale Informatix
DOWNLOADING YOUR BENEFICIARY SAMPLE Last Updated: 11/16/18. CMS Web Interface Excel Instructions
 DOWNLOADING YOUR BENEFICIARY SAMPLE Last Updated: 11/16/18 CMS Web Interface Excel Instructions Last updated: 11/16/2018 1 Smarter reporting. Smarter care. CMS Web Interface file upload. Using the Excel
DXWeb Webenabled Version 4.0 Supplement
 DXWeb Webenabled Version 4.0 1 DXWeb Webenabled Version 4.0 Supplement To be used with the DENTRIX 9.0 User s Guide 727 E. Utah Valley Drive, Suite 500 American Fork, UT 84003 Tel. (801) 763-9300 Fax (801)
Automate Clinical Trial Data Issue Checking and Tracking
 PharmaSUG 2018 - Paper AD-31 ABSTRACT Automate Clinical Trial Data Issue Checking and Tracking Dale LeSueur and Krishna Avula, Regeneron Pharmaceuticals Inc. Well organized and properly cleaned data are
Report Writing, SAS/GRAPH Creation, and Output Verification using SAS/ASSIST Matthew J. Becker, ST TPROBE, inc., Ann Arbor, MI
 Report Writing, SAS/GRAPH Creation, and Output Verification using SAS/ASSIST Matthew J. Becker, ST TPROBE, inc., Ann Arbor, MI Abstract Since the release of SAS/ASSIST, SAS has given users more flexibility
Document Generator (EHR)
") Pulse Complete EHR Document Generator (EHR) www.pulseinc.com About This Reference Guide Functionality described within the document is intended for 4.1.10 or newer versions of the Pulse Complete EHR software.
Pulse Complete EHR Document Generator (EHR) www.pulseinc.com About This Reference Guide Functionality described within the document is intended for 4.1.10 or newer versions of the Pulse Complete EHR software.
ACTIVE Net Insights user guide. (v5.4)
") ACTIVE Net Insights user guide (v5.4) Version Date 5.4 January 23, 2018 5.3 November 28, 2017 5.2 October 24, 2017 5.1 September 26, 2017 ACTIVE Network, LLC 2017 Active Network, LLC, and/or its affiliates
ACTIVE Net Insights user guide (v5.4) Version Date 5.4 January 23, 2018 5.3 November 28, 2017 5.2 October 24, 2017 5.1 September 26, 2017 ACTIVE Network, LLC 2017 Active Network, LLC, and/or its affiliates
CRSTAR TREATMENT SUMMARY AND CUSTOM FORMS
 A Treatment Summary feature has been added to CRStar. It is located under Abstract Management, Abstract Utilities and Print TX Summary. With the first release, the treatment summary should be utilized
idata User Manual September 2015
 idata User Manual September 2015 Table of Contents What is idata? 3 How to log in 4 6 Dashboards 7 15 What data is available in? Data Warehouse Level 1 Subgroups and Program Service Data NYS Test Scores
USING HASH TABLES FOR AE SEARCH STRATEGIES Vinodita Bongarala, Liz Thomas Seattle Genetics, Inc., Bothell, WA
 harmasug 2017 - Paper BB08 USING HASH TABLES FOR AE SEARCH STRATEGIES Vinodita Bongarala, Liz Thomas Seattle Genetics, Inc., Bothell, WA ABSTRACT As part of adverse event safety analysis, adverse events
A Practical and Efficient Approach in Generating AE (Adverse Events) Tables within a Clinical Study Environment
 Tables within a Clinical Study Environment") A Practical and Efficient Approach in Generating AE (Adverse Events) Tables within a Clinical Study Environment Abstract Jiannan Hu Vertex Pharmaceuticals, Inc. When a clinical trial is at the stage of
A Practical and Efficient Approach in Generating AE (Adverse Events) Tables within a Clinical Study Environment Abstract Jiannan Hu Vertex Pharmaceuticals, Inc. When a clinical trial is at the stage of
Elixir Ad-hoc Report. Release Elixir Technology Pte Ltd
 Elixir Ad-hoc Report Release 4.0.0 Elixir Technology Pte Ltd Elixir Ad-hoc Report: Release 4.0.0 Elixir Technology Pte Ltd Published 2015 Copyright 2015 Elixir Technology Pte Ltd All rights reserved. Java
How to write ADaM specifications like a ninja.
 Poster PP06 How to write ADaM specifications like a ninja. Caroline Francis, Independent SAS & Standards Consultant, Torrevieja, Spain ABSTRACT To produce analysis datasets from CDISC Study Data Tabulation
Product Documentation SAP Business ByDesign August Analytics
 Product Documentation PUBLIC Analytics Table Of Contents 1 Analytics.... 5 2 Business Background... 6 2.1 Overview of Analytics... 6 2.2 Overview of Reports in SAP Business ByDesign... 12 2.3 Reports
Supplier Engagement (HE): Dashboard Guidance
: Dashboard Guidance") Supplier Engagement (HE): Dashboard Guidance Logging in To access your data, you will need to click on the About You tab and enter your username and password. These will have been supplied to you on sign-up
Supplier Engagement (HE): Dashboard Guidance Logging in To access your data, you will need to click on the About You tab and enter your username and password. These will have been supplied to you on sign-up
Solo 4.6 Release Notes
 June9, 2017 (Updated to include Solo 4.6.4 changes) Solo 4.6 Release Notes This release contains a number of new features, as well as enhancements to the user interface and overall performance. Together
ScholarOne Manuscripts. COGNOS Reports User Guide
 ScholarOne Manuscripts COGNOS Reports User Guide 1-May-2018 Clarivate Analytics ScholarOne Manuscripts COGNOS Reports User Guide Page i TABLE OF CONTENTS USE GET HELP NOW & FAQS... 1 SYSTEM REQUIREMENTS...
Data Management, Data Management PLUS User Guide
 Data Management, Data Management PLUS User Guide Table of Contents Introduction 3 SHOEBOX Data Management and Data Management PLUS (DM+) for Individual Users 4 Portal Login 4 Working With Your Data 5 Manually
UIS USER GUIDE SEPTEMBER 2013 USER GUIDE FOR UIS.STAT (BETA)
") UIS USER GUIDE SEPTEMBER 2013 USER GUIDE FOR UIS.STAT (BETA) Published in 2013 by: UNESCO Institute for Statistics P.O. Box 6128, Succursale Centre-Ville Montreal, Quebec H3C 3J7 Canada Tel: (1 514) 343-6880
UIS USER GUIDE SEPTEMBER 2013 USER GUIDE FOR UIS.STAT (BETA) Published in 2013 by: UNESCO Institute for Statistics P.O. Box 6128, Succursale Centre-Ville Montreal, Quebec H3C 3J7 Canada Tel: (1 514) 343-6880
Searching and Favorites in Datatel Web UI 4.3
 Searching and Favorites in Datatel Web UI 4.3 Search Field The Search field uses icons and text prompts (see Figure 1) to switch between Person Search and Form Search. You can click the icon to the left
Morningstar Add-In (Microsoft Excel ) Release Notes
 Release Notes") Morningstar Add-In (Microsoft Excel ) Release Notes Release 7.8 Auto-complete search suggestions for Time Series Create Favorite List for frequently-used feeds in Time Series New on and off peak average
Morningstar Add-In (Microsoft Excel ) Release Notes Release 7.8 Auto-complete search suggestions for Time Series Create Favorite List for frequently-used feeds in Time Series New on and off peak average
0Acknowledgement. This application has been developed with the cooperation of the Inter-agency Group for Child Mortality Estimation.
 r4 0Acknowledgement This application has been developed with the cooperation of the Inter-agency Group for Child Mortality Estimation. 1Contents Introduction... 6 User Levels... 6 Learning CME Info...
ENVIRONMENTAL MANAGEMENT SYSTEMS (EMS) EMS Reporting.
 EMS Reporting.") ENVIRONMENTAL MANAGEMENT SYSTEMS (EMS) EMS Reporting www.chemicalsafety.com Contents Introduction...1 Crystal Reports...1 Reporting on a Selection of Data...2 Reporting on a Single Record of Data...3 Reporting
ENVIRONMENTAL MANAGEMENT SYSTEMS (EMS) EMS Reporting www.chemicalsafety.com Contents Introduction...1 Crystal Reports...1 Reporting on a Selection of Data...2 Reporting on a Single Record of Data...3 Reporting
UNDERSTANDING AND CREATING ROSTERS
 UNDERSTANDING AND CREATING ROSTERS Rosters are groups of students associated with a teacher in a particular school. Rosters typically represent entire classrooms in lower grades, or individual classroom
HQ Account Viewer Site Guide
 HQ Account Viewer Site Guide Table of Contents Accessing Your HQ Account... 3 The Viewer Site... 3 Edit Memory... 3 MSDS Search Tab... 4 Advanced Search... 5 Search Suggest... 5 All Products Tab... 6 Locations
A quick guide to... List Segmentation
 A quick guide to... List Segmentation In this guide... Learn how to create razor-sharp list segments based on precise combinations of conditions then use those segments to generate profitable email marketing
Track the entire global pharmaceutical R&D pipeline live from your desktop
 Track the entire global pharmaceutical R&D pipeline live from your desktop Pipeline dynamic dashboard reporting The new dynamic dashboard results view in Pipeline is available by selecting Dashboard from
Access Office Integration for Excel
 Access Office Integration for Excel Introduction The following document has been designed to guide you through the process of downloading Dimensions data in to Excel via the Access Office Integration tool.
EST151: Maintain Parts
 EST151: Maintain Parts CERTIFIED COURSE CURRICULUM SAGE UNIVERSITY IMPORTANT NOTICE This document and the Sage 100 Contractor software may be used only in accordance with the Sage 100 Contractor End User
Online Business Account How to view and download reports
 Online Business Account How to view and download reports Online Business Account How to view and download reports There are a range of reports in the reporting suite that can provide you with information
Using McKesson Specialty Care Solutions US Oncology Order Center
 Using Specialty Care Solutions US Oncology Order The, mscs.mckesson.com, is an online destination that provides easy access to everything you need to manage your purchasing relationship with Specialty
Online Reports. ACS NSQIP National Conference Salt Lake City, Utah Pre-Conference Session July 21, 2012
 Online Reports ACS NSQIP National Conference Salt Lake City, Utah Pre-Conference Session July 21, 2012 Accessing Online Reports Data Main Page Right Hand Side Menu o Quick link that jumps you to an individual
Mayo Clinic CareLink Quick Start Guide. May 5, 2018
 Mayo Clinic CareLink Quick Start Guide May 5, 2018 1 Mayo Clinic CareLink Quick Start Guide Getting Started... 3 Help and contact information... 4 Browser, system, and connection requirements... 4 How
InForm Functionality Reference Manual for Sites. Version 1.0
 InForm Functionality Reference Manual for Sites Version 1.0 1-Mar-2012 2012 by Merck & Co., Inc., Whitehouse Station, New Jersey, USA All Rights Reserved No part of this book may be reproduced in any form
Using Interactive Reports and Dashboards
 Using Interactive Reports and Dashboards Typical interactive features Use onscreen filters to modify a dashboard or report and choose whether to see all or only some of the data available. The screen will
Total Record Getting Started Guide
 Total Record Overview Total Record is the electronic medical records system used at InVision Human Services. Total Record maintains information about the programs at InVision and the clients participating
Query Studio Training Guide Cognos 8 February 2010 DRAFT. Arkansas Public School Computer Network 101 East Capitol, Suite 101 Little Rock, AR 72201
 Query Studio Training Guide Cognos 8 February 2010 DRAFT Arkansas Public School Computer Network 101 East Capitol, Suite 101 Little Rock, AR 72201 2 Table of Contents Accessing Cognos Query Studio... 5
VERINT EFM 7.1 Release Overview
 VERINT EFM 7.1 Release Overview Throughout the winter, Verint will upgrade its EFM software to the latest release, version 7.1. SaaS customers will receive this update as part of their regularly scheduled
Business Edition Basic License User Guide
 Business Edition Basic License User Guide Table of Contents 1. Dashboard-----------------------------------------------------------------------------------------3 2. Catalog Search-----------------------------------------------------------------------------------4
Using Excel Tables to Manipulate Billing Data, Part 2
 Using Excel Tables to Manipulate Billing Data, Part 2 By Nate Moore, CPA, MBA, CMPE The May-June 2012 issue of Billing introduced tables in Excel, a powerful tool that is used to sort, filter, and organize
ActiveReports 12 Server 1
 ActiveReports 12 Server 1 Table of Contents Table of Contents 1-2 ActiveReports 12 Server Designer User Guide 3 Report Portal 3-7 Mobile Report Portal 7-11 Get Started with ActiveReports Web Designer 11-12
DATABASE MANAGERS. Basic database queries. Open the file Pfizer vs FDA.mdb, then double click to open the table Pfizer payments.
 DATABASE MANAGERS We ve already seen how spreadsheets can filter data and calculate subtotals. But spreadsheets are limited by the amount of data they can handle (about 65,000 rows for Excel 2003). Database
Frequency tables Create a new Frequency Table
 Frequency tables Create a new Frequency Table Contents FREQUENCY TABLES CREATE A NEW FREQUENCY TABLE... 1 Results Table... 2 Calculate Descriptive Statistics for Frequency Tables... 6 Transfer Results