Note: The default password for all Professional programs is hhgold (lowercase).
|
|
|
- Moses Ward
- 5 years ago
- Views:
Transcription
.")

1 Getting Started To start Professional, double-click the following icon. The first form Professional displays is the Password screen. Enter your password here. See the Change Password section below on how to change this password. Note: The default password for all Professional programs is hhgold (lowercase). Latest News from Home Health Gold RSS Feed In the upper right hand corner of the Dashboard, the program will scroll through current news that we would like to make you aware of. These topics include recently published articles, recent updates, and tips on how to use Home Health Gold more productively. Clicking on any topic will open a webpage with further detail or a video. Dashboards At startup, you will see one of Professional s two Dashboards. To toggle between the two dashboards simply click File on the Main Menu and select which dashboard you would like to display. 9

2 Classic Dashboard The Dashboard displayed below is our Classic Dashboard. In this section, we will discuss the abilities of the Classic Dashboard. For information on the New Dashboard, please progress to the section labeled New Dashboard. For a while now, we have been accumulating requests for a variety of summary statistics that agencies often have to calculate when participating in benchmarking programs or filling out a State report, and which would offer indicators of agency performance in key areas. Recently dashboards have been very much in vogue. The idea of a dashboard provides a useful metaphor for the kinds of statistical measures we have developed. Many of you have been producing these measures by building and running reports using our query tools. However, we hope that the more immediate and routine availability of these measures will help you to drive your agency to better success. There is one way in which the dashboard metaphor falls short: in your car, there are relatively few indicators that you have to track, but you are also tracking many 10

3 other phenomena by looking out the window. In a home health agency, much of what must be tracked is not visible to you. It is more like flying blind, and in that sense, our dashboard is more like the instrument panel in a Jumbo Jet. There are many things we have been asked to track. You will have to study our dashboard and decide what you want to focus on. Once displayed you may work with the Dashboard, or ignore it and use the menu. You can switch from the Dashboard to the Main Menu at any time. However, if you open an option on the Main Menu, for example, view assessments, you will see the Dashboard peeking through from the background but you will not be able to use it until you close down the Main Menu option. Here is how the Professional s Dashboard works: Professional saves the settings each time you configure the Dashboard. Therefore, the Dashboard will show the statistics based on the settings when you last exited the program. Here are some example items from a portion of the Dashboard: Note that there are blue numbers and black numbers. Move your mouse over one of the blue numbers and the mouse pointer will change showing that you can drill down to learn which assessments were used in producing this count. Click a blue number and a form will appear allowing you select an output format, as follows: You can display a preview of a report, or you can send the data directly to an Excel-format spreadsheet. If you select the Spreadsheet option, you must provide a filename. 11

4 Once you enter the name, click OK. This creates the spreadsheet and returns you to the Dashboard. The spreadsheet will be stored in the Professional folder in your my Documents folder, unless a different path has been designated. The sample of items above also shows a spinner. Spinner Click the up and down arrows to change the number. As it does, the blue number to the right might also change. This allows you to set your own thresholds for various measures. Finally, there are several places where there is blue text, as follows: In these instances, if you click the blue text, a form will appear showing you the top 10 diagnosis, HHRGs, etc., as follows: 12

5 Once one of these forms appears, you can click the blue numbers to identify the specific assessments. Professional on startup, or when new data is imported, calculates Dashboard statistics. Statistics based on a spinner are refreshed automatically whenever the spinner changes. These calculations always are made based on your latest settings for the spinners and for the date range and M0150 value, you have selected. The Dashboard gives you the ability to change the date range and M0150 setting at any time. Click Selections and the following form will appear: 13

6 Click OK to refresh the Dashboard calculations. The Dashboard title will change to reflect your latest selections. The Dashboard will quickly help you get key indicators of overall performance. You then have all of the other tools available from the Main Menu to help you to probe further. Edit Notification When the Dashboard is re-calculated, it now checks to see what assessment edits exist for a specified period. If there are outstanding edits, the Dashboard looks like this: Click New Edits!! and the outstanding edits will be displayed as follows: 14

7 You can scroll through the edits or print them all out. Also, you can check them off indicating that you do not want to see them again. If, for example, you have followed up on a Clinical Inconsistency edit and found that for this particular patient there is no real inconsistency, you may click the check box in the Ignore column. If you later check edits for the same timeframe, the checked-off item will not appear. There are two ways to remove an edit from the New Edits list. One is to place a check in the Ignore column. The other is to correct the assessment in your OASIS system and re-import assessments. If your correction addresses the issue, the edit will no longer appear. Here are three other things to know about the New Edits feature: Checking Ignore only hides an edit on this form. It does not affect its appearance on any other edit reports. If you fear that you have checked an important edit by mistake, you can run the Comprehensive Assessment Audits report for the same period to double-check. The settings on the Preferences Form affect which edits are checked for the New Edits feature. Edits are checked for ALL assessments for the target period, regardless of the selection you have made for Payer for the Dashboard. 15

8 Finally, you have control over the range of days for which edits are identified. There is an option on the Selections form for the Dashboard, as follows: Change the Audit assessments for past X days to reflect the period for which you wish to do the edit scan. Note: The higher the number, the longer it will take to recalculate the Dashboard. RAC Risks The RAC Risk report identifies episodes, either starts or completed, that may draw the attention of auditors and surveyors. Identifying these episodes will allow you to perform a thorough chart review. 16

9 Financial Profile The Financial Profile shows month-by-month averages or totals for key Dashboard measures. The Dashboard s ending date will determine the ending date for the Profile. Similarly, the numbers shown on the Profile will be based on episodes which conform to the selections you have made for the Dashboard. This means you can get a profile for episodes for patients who have a particular payer or Case manager, or doctor, or diagnosis or team. When you click the graph icon for a particular row on the Profile, a graph appears, as follows: 17


10 Home Health Compare Outcomes The Dashboard will display all of the Home Health Compare Outcomes. Click Home Health Compare Outcomes and the following form will appear: Click a number to see the assessments behind the number. Our Home Health Compare calculations are based on a 12-month period ending when the Dashboard period ends. This matches the length of time used by CMS 18
11 and eliminates the need for you to reset your Dashboard for a one-year period. To use a period based on your Dashboard dates select the use Dashboard s Starting and Ending date option when making selections for the Dashboard, shown below: Process Measures Process Based Quality Improvement Index (PBQI) report on how your agency is performing on the OASIS C items that are designed to show compliance with best practice standards. Like the Home Health Compare report, from your Selections you can have this report calculated for a 12-month span or for your Dashboard dates. There are 47 Process Measure questions, so you will need to scroll through the report to find the item of interest. Items denoted with an * indicate those that will be publicly reported by CMS. The first blue number on each line indicates the number of assessments where best practice standards were met. The second blue number indicates situations where the best practice was not met and the third number indicates the total number of assessments that had the potential to meet the standard. As with all of our Dashboard reports, the blue number allows you to drill down to the patient specific detail of any list. The black number in the right column is the percentage of patients for which the standard was achieved. Here is a screenshot of the Process Measure Report: 19

12 My Hot Spots This feature allows each user to select reports that they wish to have immediate access to. Select Hot Spots on the Special Reports option at the bottom of your Dashboard. The possible Hot reports will be displayed on three tabs and you can select the ones which are of particular concern to you. New Episodes. This will give you immediate access to some of the Dashboard reports as well as identifying assessments with certain OASIS responses that may indicate high-risk patients. 20
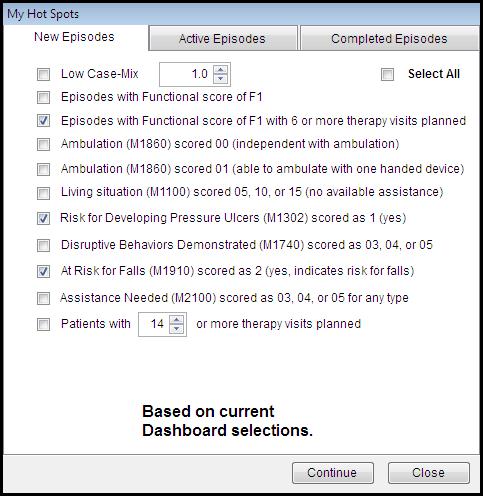
13 21

14 Active Episodes Identify from your current patients, those who at risk for compliance issues as well as those who remain at the LUPA or Therapy Downgrade level at a given point in their care. 22

15 Completed Episodes.For episodes that have ended, identify certain care patterns, reimbursement impact, emergent care reasons, and transfers with some common diagnoses. Once you have made your selections, clicking on Continue will generate a report that looks like this. 23

16 Clicking on the blue number will drill down to the specific patients that meet each selection criteria. Side-by-Side Comparisons The Side-by-side Comparisons button will generate the form below. This form has several possible selections. Once you choose which of the options you want select, click OK and Professional will generate an Excel spreadsheet that compares all the process measures organized by your selection. The columns will be grouped and organized in the same manner as the New Dashboard graphs. Each row will represent one of the entities (team, assessor, payer, etc.) An example spreadsheet is displayed below. The rows are populated by your teams or case-managers depending upon your selections. 24


17 Clicking on the drop down arrow in the corner of the box will allow you to easily sort the column. Readmit Frequency 25

18 The increased discussion of the potential future role of ACOs has led to repeated requests for readmission statistics for the patients referred by particular hospitals. Click the Readmit Frequency button and you will see the following form: The referral sources which have been gathered from your systems admission records will be displayed. Select the referral source(s) of interest and click Continue and you will see the following frequency distribution: 26

19 Patients who were admitted within the selected timeframe, who have since had an 06 or 07 (Transfer) assessment, and whose admission record lists the selected entity(s) as Referral Source, have been organized in terms of the number of days between that transfer and the preceeding SOC or ROC. The report groups patients in terms of days in care and the percentage is shown for each group. Also, the Cumulative Percent shows proportion of admitted patients who transferred in that number of days or less. In this report you can see that 11.27% were readmitted within 15 days. Be careful in selecting your timeframe. If, for example, you select the current month, the patients admitted within that period will not have had a chance to be in care for a long enough time and your results will be misleading. If, for example, you are trying to determine the percentage of patients readmitted within 30 days, choose a period which ended at least 30 days ago. 27

20 New Dashboard In November 2013 we introduced an updated version of Home Health Gold Professional with much more grahing and trending on the Dashboard. There are dozens of measures from which each user of the progam can choose from to have displayed on their Dashboard. These measures range from information about Admissions, Beginning Episode calculations, End of Episode calculations, and Re-admission measures. Each graph will show a 12-month span ending with the current calendar month regardless of you Dashboard timeframes. The graphing will follow the settings of your Dashboard in regards to Payer, Team, Primary Provider, etc 28
 for the calculations.")
21 Clicking on any data point on the graph will immediately drill down to the patient detail that comprises the measure. Many of the graphs show a percentage of occurance of the measure that you are studying. Be mindful that when you click on the month, you will see the detailed count (numerator) for the calculations. (i.e. if you hover over a data point and see the number 12 displayed. When you click on the 12 you will not see 12 assessments but rather the full number of assessments that comprise the numerator). Right clicking on any of the 9 graphs will give you the option to select a different measure, switch between line graphs and bar graphs, and print preview. 29


22 Choosing the Select a Different Measure will bring you to this selection screen. 30

23 The graph position from where you were when you chose to select a diffent measure is now blank. You may select a new measure then click on the Add (>) button. You may also clear any other slots and replace them with new measures. Rebuilding your Dashboard with the new graph selections will happen very quickly. When transitioning from the Classic Dashboard to the New Dashboard all of the selections (time frame, payer source, team, etc.) that you had chosen in the Classic Dashboard will flow to the NEW Dashboard (and vice versa). Note: At any time, you can revert to the Classic Dashboard. Just go to the Main Menu, click File, then Choose Classic Dashboard. To get back to the New Dashboard, again choose File from the Main Menu and select Choose New Dashboard. Additional functionality that is found only on the New Dashboard s Dashboard Options screen is the Dashboard Group Selection. Whenever you select a blue number from any Dashboard report, you will see the Create Dashboard Group output option. By choosing the Create Dashboard Group feature, you are saving this group of patients (i.e. patients that had a Therapy Upgrade episode in March). You can then return to your Dashboard selections and choose the Dashboard Group button. Then highlight the group that you would like to use to create a new custom Dashboard. 31

24 Reporting Options Each of the individual topics along the left margin of the New Dashboard generates statistics and/or tools related to a specific topic. Selecting any of these will display the associated reports. Note: Each Reporting Option will follow your Dashboard selections and rules. If you would like to modify these settings, click Change Settings and you will be brought to the appropriate screen. After modifying your selections, you will be returned to the open Report Option. There is some information that is duplicated on more than one area. For example, final case-mix weight is included on the Study Completed Episodes as well as in Track Financial Measures. 32

25 Monitor Episodes in Progress The Monitor Episodes in Progress button is the easiest way to access vital information about active episodes. Selecting the Monitor Episodes in Progress button will display a sub-dashboard with statistics related to active episodes that is displayed below. This section has many options. The first option is contained in two drop down menus that will allow you to select what episodes are to be displayed. If you want to see episodes that are all within the same week, simply select the same week for each dropdown menu (as shown in the example above). The other selections are entered via a spinner, to increase or decrees the number within the spinner simply click the corresponding 33

26 arrows that are located adjacent to the spinner. When the spinner number is changed the number located to the right of the spinner. You can click on the blue number and Professional will generate a report to reflect the selection of information that you have made. Study Completed Episodes This Sub-Dashboard allows you access to information that is associated with all of the episodes that have ended within the period of your Dashboard selection. Clicking on this button will produce the following Sub-Dashboard The information that is presented, is segregated into three separate categories: # of Episodes Ended, Average Case Mix, and Visit-adjusted Episodes. If you click on any of the blue numbers, Professional will generate a report that displays all the details associated with that number. This sub-dashboard has two spinners and one dropdown menu that allows you to build a report to show detailed information of episodes that fit your criteria. The 34
27 drop down menu will allow you to select the main criteria of the search such as PT visits, and the two spinners will allow you to select a numerical value that corresponds with the dropdown menu selection. From the example above Professional will generate a report of all the patients that received anywhere between eight and ten Physical Therapy visits. This Sub-Dashboard has two clickable buttons labeled: Visits by Discipline, and Visits by HHRG. Clicking on the Visits by Discipline will generate a chart that will display the total and average visits for all episodes and episodes that are not LUPAs, organized by discipline (PT, ST, etc.). When the Visits by HHRG button is selected a report, displaying detailed information will be displayed. Scrub Assessments for Consistency, etc. The Scrub Assessments for Consistency, etc. sub-dashboard, has some unique features. When making your Dashboard selections, you are asked to select a range of time for which you want to audit assessments. In the Classic Dashboard, this only affects your New Edits, in the NEW Dashboard this will affect all of the statistics and tools included in the Scrub Assessments sub-dashboard. 35

28 The Works!! is a Comprehensive Assessment report available for all types of assessments. The Works includes a wide range of analysis related to OASIS assessment. Sections of The Works include: Readmission Risks, Clinical and Coding alerts, Comparison to earlier assessments, Home Health Compare Outcome Potential, Home Health Compare results, Process Measure analysis, and Compliance auditing. New Edits!! New Edits is the same as the New Edits!! that is explained in depth under the Classic Dashboard section above; if you are unclear as to its operation please refer to that section. 36

29 Assessment Comparisons As with New Edits this feature is covered in depth under the Assessment Comparisons section located under the Pre-Submission Auditing. For an explanation of this feature, please progress to that section. Assessment Sequence Violation This feature is also covered in length under Assessment Sequence Auditing below. Show New Assessments This will open a screen shows the assessments performed recently, based on the Audit Assessments value you have set on your Dashboard selections. Double clicking on any assessment will give you the OASIS Data Form. 37

30 This new tool allows you to immediately look at the detail for assessments which have been done recently. Benchmark Teams and Providers The Benchmark Teams and Providers button is a useful tool for comparing unit and staff performance Clicking on this button will generate the form below. 38

31 Within this section, there are two buttons, the Side-by-Side Comparisons, and Assessing Clinicians Statistics buttons. The Side-by-Side Comparisons button generates a report that is covered in depth in the Classic Dashboard section, and under the title of Side-by-Side Comparisons The Assessing Clinicians Statistics generates the same report that is covered in depth later in this manual, if you have any question please scroll down to the Assessing Clinicians Report below. Home Health Compare Detailed information about this topic can be found under the Classic Dashboard section of this manual under Home Health Compare. Process Measures Detailed information on this topic can be found under the Classic Dashboard section of this manual under Process Measures 39

32 Potentially Avoidable Events Detailed information on this topic can be found under the Classic Dashboard section of this manual under Potentially Avoidable Events. Review Caseload Statistics This button houses vital information pertaining to caseload statistics. Clicking the above button will generate the form below. This form aggregates all the information that is needed to review caseload statistics. Professional allows you to modify the results by adjusting the four different spinners that are associated with results that you may want to change. 40

33 When you select Readmissions from the left side of the Dashboard, you will be presented with this form that will follow your Dashboard settings for timeframe, payer sources, and agency components. At this point, the program is showing that for my selected timeframe and payer sources, we have had 504 episodes Transferred or Discharged. Without adding 41

34 any exclusion rules I can see, in two ways, which of these patients left our agency because of a Re-hospitalization. If my curiosity is to see how long patients are in may care before they are readmitted to the hospital, I would choose to see the distribution By Days in Care Prior to Readmission. This will produce a report that will show the daily occurrence of Rehospitalizations as well as the cumulative total for each day. Typically you will be interested in observing your performance at the 30 or 60 day mark. In this case, 61 of our 504 (12.1%) patients who were transferred or discharged, left the agency due to a hospital readmission within their first 30 days of care Alternatively, we may be looking for information about the proportion of our Rehospitalizations as related to which referral source provided us with the patient. In this case, choose the By Referral Source distribution. 42
 we re-hospitalized at some point. Note* this rehospitalization could have been following many episodes of home care and will not negatively affect any hospital penalty reporting.")
35 This report shows that during this period, of the 504 Transfers and Discharges in this period, 167 of those patients were referred to the agency by Eastern MMC. Of that group, 41 (or 24.55%) we re-hospitalized at some point. Note* this rehospitalization could have been following many episodes of home care and will not negatively affect any hospital penalty reporting. Fine-tuning: As your need for information is ever changing, we provide tools with flexibility. The Readmission reporting is no exception. As you focus on a particular referral source or add exclusion rules, you will see in the bottom of the selection screen that the patients being included will decrease. Referrals source: For our Home Health Gold Professional agencies, you have the ability to focus the above reporting and analysis on only those patients who were referred to you from a particular referral source(s). The names and locations that you see in your list are coming from your billing system. Agencies that are careful in identifying the facility of the referral will see more benefit from this tool. Exclusions: Using the following check boxes allow you to exclude patients that you do not wish to have in your re-hospitalization studies. Selecting this option will eliminate patients who were not in the Hospital in the 14 days prior to SOC or ROC. This is determined by your response to M

36 An alternative way to define patients who have recently been hospitalized is to set a spinner to meet your preference. In this case, if the patient had not been in the hospital in the 15 days prior to the SOC or ROC, then they would be excluded. In this case, M1005 is used to determine the hospitalization date. **Note; these first two exclusions are very similar. It is not necessary to use both. Please use the exclusion criteria that best suits your needs. This group of exclusions can be selected by checking the Use the Criteria box. This selection will apply to your OASIS data, the rules to mimic the calculations that CMS puts in place when examining claims based readmissions for your Home Health Compare reporting. Also, each of these indented lines could be chosen individually. Of most frequent occurrence would be the preference to not have scheduled treatment or procedures included in your calculations. Further focus can be placed on your performance for the specific hospital diagnoses (identified in M1010) that are most important to your hospitals. If your hospitals readmission rate for these key diagnoses are too high, they will receive financial penalties. Demonstrating your ability to successfully prevent readmission of these patients will be a vital marketing strategy. 44

37 Financial Measures This button allows you to run reports that will analyze and sort data that pertain to financial measures. Clicking on this button will produce the following form. The Month-by-Month Financial Profile button is explained in the Classic Dashboard section of this manual under the label Financial Profile. Hot Spots 45

38 The form that is generated by clicking this button is covered in depth in the Classic Dashboard section of this Dashboard, under the title My Hot Spots. Find Compliance/ Takeback Risks This button is used for examining any episodes that have the potential to be a RAC risk. Clicking this button will generate the following form. This form will highlight episodes that have the potential to be a RAC risk. Clicking on any of the blue numbers will build and display a detailed report, explaining the potential risk. Review New Episodes This button produces a form that displays all the general information of the new episodes within the agency. Clicking this button produces the form below. 46

39 This form aggregates all of the important information that you might need to better analyze the starting episodes within the agency. Menu Commands Menus provide access to the features of Professional. Take note of the menu names located at the top of the screen when you first run Professional. Clicking one of these menu names will either initiate a process or display a dropdown menu. File Click File and you will see the following submenu. 47
ehepqual- HCV Quality of Care Performance Measure Program
 NEW YORK STATE DEPARTMENT OF HEALTH AIDS INSTITUTE ehepqual- HCV Quality of Care Performance Measure Program USERS GUIDE A GUIDE FOR PRIMARY CARE AND HEPATITIS C CARE PROVIDERS * * For use with ehepqual,
Desktop Charge Capture
 Version 4.2 Quick Start Guide for Healthcare Providers Desktop Charge Capture Physician Information System Contents Logging Into Desktop Charge Capture... 1 Introduction to Desktop Charge Capture... 3
Exit Clicking this command will close Professional. This is the preferred way of closing Professional.
 Exit Clicking this command will close Professional. This is the preferred way of closing Professional. View Assessments The Assessment Manager is your window to all the imported OASIS assessments in Professional.
PHYSICIAN S OFFICE STAFF Instructions for Paragon s WebStation for Physicians
 PHYSICIAN S OFFICE STAFF Instructions for Paragon s WebStation for Physicians Login with your assigned individual User Name and Password. Physician Office Staff are issued inquiry access only in WebStation
Patient Tracking Spreadsheet Template Instructions for Care Managers
 Patient Tracking Spreadsheet Template Instructions for Care Managers Effective management of common mental health conditions requires the ability to track clinical outcomes for populations of patients
User Guide for TASKE Contact Web Interface
 User Guide for TASKE Contact Web Interface For Avaya Communication Manager with Application Enablement Services Version: 8.9 Date: 2011-06 This document is provided to you for informational purposes only.
Netsmart Sandbox Tour Guide Script
 Netsmart Sandbox Tour Guide Script March 2012 This document is to be used in conjunction with the Netsmart Sandbox environment as a guide. Following the steps included in this guide will allow you to get
DASHBOARD USER GUIDE
 DASHBOARD USER GUIDE TABLE OF CONTENTS DASHBOARD... 3 1. Your Program Information... 4 2. Multiple Program Toggle... 4 3. Invite a Colleague... 4 4. Add Service Site... 5 5. Start/Edit Survey... 7 6. Reports...
MAQ DASHBOARD USERS GUIDE
 USERS GUIDE V10 - July 2014 eclinicalworks, 2014. All rights reserved CONTENTS ABOUT THIS GUIDE 4 Product Documentation 4 Webinars 4 eclinicalworks Newsletter 4 Getting Support 5 Conventions 5 MAQ DASHBOARD
USER GUIDE. Document ID: D. Abbott Point of Care Inc. Abbott Park, IL 60064
 USER GUIDE Document ID: 732029-00D Abbott Point of Care Inc. Abbott Park, IL 60064 This page intentionally left blank. Table of Contents Preface 1 1 - Getting started 1-1 1.1 Point-of-Care testing (POCT)
INTRODUCTION to the REPORT PORTAL
 INTRODUCTION to the REPORT PORTAL As soon as your practice captures complete discharged episodes, FOTO will produce Quarterly Profile Reports that are distributed to the authorized report recipient for
PROPRIETARY MATERIALS
 PROPRIETARY MATERIALS No use of these proprietary materials is permitted without the express written consent of or license from Thomson Reuters. Altering, copying, distributing or reproducing any of these
HIE Clinical Portal Non-Provider Manual 1 Last update: 2016/08/30 Alaska ehealth Network
 HIE Clinical Portal Non-Provider Manual 1 Last update: 2016/08/30 Alaska ehealth Network Table of Contents Overview... 2 Patient Privacy Policy & Access... 3 User Levels... 5 User Homepage... 7 Common...
DXWeb Webenabled Version 4.0 Supplement
 DXWeb Webenabled Version 4.0 1 DXWeb Webenabled Version 4.0 Supplement To be used with the DENTRIX 9.0 User s Guide 727 E. Utah Valley Drive, Suite 500 American Fork, UT 84003 Tel. (801) 763-9300 Fax (801)
Instructional Guide for the Behavioral Support Plan (BSP) for IIH Providers
 for IIH Providers") Instructional Guide for the Behavioral Support Plan (BSP) for IIH Providers November 2014 Instructions for Use Table of Contents I. Introduction... 2 II. Accessing CYBER... 3 III. Update to the Welcome
Instructional Guide for the Behavioral Support Plan (BSP) for IIH Providers November 2014 Instructions for Use Table of Contents I. Introduction... 2 II. Accessing CYBER... 3 III. Update to the Welcome
ADMINISTRATOR OVERVIEW TRAINING MANUAL
 1 ADMINISTRATOR OVERVIEW TRAINING MANUAL 2 Table of Contents MANAGE COMPANY INFORMATION:... 4 1. Company Information... 4 2. Subscription Plan... 7 3. OASIS Scrubber Information... 7 4. Average Discipline
Scottish Care Information. SCI Gateway v11.1. Receiving Referrals User Guide
 Scottish Care Information SCI Gateway v11.1 Receiving Referrals User Guide Contents 1 Introduction...1-1 2 Accessing SCI Gateway...2-1 Accessing SCI Gateway...2-2 Passwords & Security...2-3 Logging on
Netsmart Sandbox Tour Guide Script
 Netsmart Sandbox Tour Guide Script March 2012 This document is to be used in conjunction with the Netsmart Sandbox environment as a guide. Following the steps included in this guide will allow you to get
Scottish Care Information. SCI Gateway v10.3. Sending Referrals & Receiving Discharges User Guide
 Scottish Care Information SCI Gateway v10.3 Sending Referrals & Receiving Discharges User Guide Contents 1 Introduction... 1-1 2 Accessing SCI Gateway... 2-1 Accessing SCI Gateway Through GPASS... 2-2
AccountsIQ Tips and Tricks. Updated 20/10/2008. Purpose. 1. List and describe what heading and text will be containing in each of the Tip s and tricks
 AccountsIQ Tips and Tricks Updated 20/10/2008 Purpose 1. List and describe what heading and text will be containing in each of the Tip s and tricks 2. Outline what FAQ s will be released on the System
Tellus EVV Introduction and Dashboard TRAINING REFERENCE GUIDE
 Tellus EVV Introduction and Dashboard TRAINING REFERENCE GUIDE REV: 03/18 Sponsored by Centric Consulting, LLC, and the State of Florida, AHCA TELLUS EVV System Training Reference Guide Table of Contents
PROPRIETARY MATERIALS
 PROPRIETARY MATERIALS No use of these proprietary materials is permitted without the express written consent of or license from Thomson Reuters. Altering, copying, distributing or reproducing any of these
Maine ASO Provider Portal Atrezzo End User Guide
 Maine ASO Provider Portal Atrezzo End User Guide October 2018 CONTENTS INTRODUCTION... 4 The KEPRO/Maine s Atrezzo Portal Guide... 4 SETUP AND ACCESS ATREZZO... 5 A. New Provider Registration/ Register
PROPRIETARY MATERIALS
 SMART PRACTICE AIDS SINGLE AUDIT USER GUIDE FOR PERIODS ENDING PRIOR TO 12/25/2015 NOTE: SMART Single Audit will work for more than one engagement date or fiscal period, but with different functionality
WCB Online A User Guide for Tiered Service Providers
 WCB Online User Guide for Tiered Service Providers WCB Online A User Guide for Tiered Service Providers A Nova Scotians safe and secure from workplace injury Table of Contents WCB Online 1 Profile Creation
RITIS Training Module 9 Script
 RITIS Training Module 9 Script Welcome to the Regional Integrated Information System or RITIS Module 09 CBT. To begin, select the start button or press Shift+N on your keyboard. This training module will
CareDx Customer Web Portal User Guide Version 3.6.3
 CareDx Customer Web Portal User Guide Version 3.6.3 Copyright Notice CareDx, Inc, 3260 Bayshore Blvd, Brisbane, CA 94005 Copyright 2015 CareDx All rights reserved. This document is protected by the copyright
Secure Data Portal Users Guide
 Secure Data Portal Users Guide Updated: Table of Contents Introduction... 1 System Requirements... 1 Technical Assistance... 1 Initial Login... 2 Setting Up User Accounts... 3 Data Submission... 5 Patient
ProScript User Guide. Chronic Medication Service (CMS) Version Release Date 21/10/2010 Author Rx Systems
 Version Release Date 21/10/2010 Author Rx Systems") User Guide Chronic Medication Service (CMS) Version 5.0.4 Release Date 21/10/2010 Author Rx Systems Table of Contents Objectives... 3 Introduction... 4 Getting Started CMS Main Screen... 5 Registering
User Guide Chronic Medication Service (CMS) Version 5.0.4 Release Date 21/10/2010 Author Rx Systems Table of Contents Objectives... 3 Introduction... 4 Getting Started CMS Main Screen... 5 Registering
SIMPLIFi Compliance Software User Manual
 SIMPLIFi Compliance Software User Manual Version 1.7 2013 Simplifi-Solutions Ltd, Environmental Center, Unit B5, The Gordon Manley Building, Lancaster University, LA1 4WA Telephone: 01524 510431 Email:
Volunteer Management Information System. AVCC User Guide
 Volunteer Management Information System AVCC User Guide Contents 1.0 - Welcome to VMIS... 4 Glossary... 4 VMIS Registration... 5 Army Family Web Portal (AFWP) & AFWP Accounts... 5 Single Sign-On (SSO)...
Qualifying Alternative Payment Model Participants (QPs) Methodology Fact Sheet
 Methodology Fact Sheet") Qualifying Alternative Payment Model Participants (QPs) Methodology Fact Sheet Overview This methodology fact sheet describes the process and methodology that the Centers for Medicare & Medicaid Services
Qualifying Alternative Payment Model Participants (QPs) Methodology Fact Sheet Overview This methodology fact sheet describes the process and methodology that the Centers for Medicare & Medicaid Services
CareFirst 6.8 Module 3 Children/Young Person s Processes
 CareFirst 6.8 Module 3 Children/Young Person s Processes Integrated Children s System (ICS) Version 6.8 CAREFIRST HELPDESK: 616199 CONTENTS Flowchart Child/Young Person in need of Emergency Accommodation...
Harmony Claims Submission Process
 Vendor data prerequisites (completed by DSP Vendor Manager) Required fields in provider record: Vendor No., taxpayer ID, & claims identifier Provider open to fund code Services attached to provider Participant
Steps: 1. Log in to the Dmitri application through the following website URL, as appropriate:
 Dmitri Suite Getting Started Logging In and Logging Out Logging In Use the following steps to log in to the Dmitri application. Steps: 1. Log in to the Dmitri application through the following website
vrealize Hyperic Monitoring and Management Guide vrealize Hyperic 5.8.4
 vrealize Hyperic Monitoring and Management Guide vrealize Hyperic 5.8.4 You can find the most up-to-date technical documentation on the VMware website at: https://docs.vmware.com/ If you have comments
CERECONS. Provider Training
 CERECONS Provider Training February 2012 Table of Contents 1. Physician Dashboard 2 Eligibility Highlights 2 Clinical Alerts 3 Referral Alerts and Stats 4 Group Information 5 2. Edit Profile 6 3. Eligibility
Investigator Site OC RDC PDF User Guide
 Investigator Site OC RDC PDF User Guide Version 1.0 Page 1 of 40 TABLE OF CONTENTS Accessing OC RDC Steps for Access 3 Logging On 4 Change Password 4 Laptop and System Security 5 Change Study 5 Navigating
Provider Secure Portal User Manual
 Provider Secure Portal User Manual Copyright 2011 Centene Corporation. All rights reserved. Operational Training 2 August 2011 Table of Contents Provider Secure Portal... 5 Registration... 6 Provider -
PROPRIETARY MATERIALS
 SINGLE AUDIT USER GUIDE & SINGLE AUDIT SUITE WITH FIELD WORK USER GUIDE FOR PERIODS ENDING AFTER 12/25/2015 NOTE: SMART Single Audit will work for more than one engagement date or fiscal period, but with
myvirena.com User Manual / Training Guide
 myvirena.com User Manual / Training Guide Registering as a New User... 3 User Roles... 5 Healthcare Provider Roles... 5 Organizational Administrator... 5 Authorized User... 5 Public Health Roles... 5 Country...
Netsmart Sandbox Tour Guide Script
 Netsmart Sandbox Tour Guide Script April 2013 This document is to be used in conjunction with the Netsmart Sandbox environment as a guide. Following the steps included in this guide will allow you to get
myvirena.com Training Guide
 myvirena.com Training Guide Registering as a New User... 3 User Roles... 5 Healthcare Provider Roles... 5 Organizational Administrator... 5 Authorized User... 5 Public Health Roles... 5 Country... 5 State...
Integrated MS-DRG Grouper & Calculator Printable How To Guide
 Integrated MS-DRG Grouper & Calculator Printable How To Guide MediRegs provides an integrated MS-DRG Grouper & Calculator that demonstrates MS-DRG grouping and payment under the Inpatient Prospective Payment
EHS RegTracker. User Guide. (800)
") EHS RegTracker User Guide (800) 372-1033 www.bna.com EHS RegTracker User Guide Table of Contents Getting Started.... 2 Includes Initial Setup and Logging On. Company Inbox... 5 Status Icons, Inbox Filter,
EHS RegTracker User Guide (800) 372-1033 www.bna.com EHS RegTracker User Guide Table of Contents Getting Started.... 2 Includes Initial Setup and Logging On. Company Inbox... 5 Status Icons, Inbox Filter,
User Manual. perfectionlearning.com/technical-support
 User Manual perfectionlearning.com/technical-support 1 User Manual Accessing Math X... 3 Login... 3 Forgotten Password... 3 Navigation Menu... 4 Logout... 4 Admin... 5 Creating Classes and Students...
Topics Covered in Class: Page #
 Topics Covered in Class: Page # Starting Powerchart 2 Signing In, Securing Session 3 Finding a Patient 4-5 The Banner 6 Frequently Used Pages of the Chart 7 Clinical Notes page 8-9 Form Browser page 10
RITIS Training Module 4 Script
 RITIS Training Module 4 Script Welcome to the Regional Integrated Information System or RITIS Module 04 CBT. To begin, select the start button or press Shift+N on your keyboard. This training module will
AGENCYCORE MOBILE ios MANUAL
 1 AGENCYCORE MOBILE ios MANUAL 2 Table of Contents DOWNLOADING APP... 3 HOME PAGE... 8 MY MESSAGES... 9 Common Icons & Buttons Messages... 9 Compose New Message:... 12 MY SCHEDULE... 13 Visit Information...
E-Report. User Manual
 E-Report User Manual 2011 All rights reserved. No parts of this work may be reproduced in any form or by any means graphic, electronic, or mechanical, including photocopying, recording, taping, or information
Gradebook Entering, Sorting, and Filtering Student Scores March 10, 2017
 Gradebook Entering, Sorting, and Filtering Student Scores March 10, 2017 1. Entering Student Scores 2. Exclude Student from Assignment 3. Missing Assignments 4. Scores by Class 5. Sorting 6. Show Filters
ABA Advantage Web Portal User Guide
 ABA Advantage Web Portal User Guide Table of Contents 1.0 Signing in... 1 2.0 Clients... 2 2.1 Clients Status... 4 2.2 Viewing a Client... 5 Client Status... 6 Case Info... 8 3.0 Creating a Treatment
Enterprise Comp Search Claims &Claim Details
 Enterprise Comp Search Claims &Claim Details Care mc May 2012 Table of Contents About Search Claims & Claim Details... 3 Instant Search... 3 Claim Note View... 4 Document View... 4 Favorites... 5 View
How to use the Sales Based Availability Dashboard
 How to use the Sales Based Availability Dashboard Supplier Guide Sept 2017 v1 1 Contents What is Sales Based Availability and why is it important?... 3 How is Sales Based Availability calculated and how
Quick Reference. eivf Quick Reference Frequently Asked Questions 1
 Quick Reference Quick Reference...1 Frequently Asked Questions...4 Where s the IUI schedule?...4 How do I schedule an IUI...4 How do I double-book an appointment?...4 How do I print lab schedules...4 How
SMU Financials Created on April 29, 2011
 Created on April 29, 2011 Notice 2011, Southern Methodist University. All Rights Reserved. Published 2011. The information contained in this document is proprietary to Southern Methodist University. This
RITIS Training Module 10 Script. To return to the Florida Analytics main page, select Florida Analytics Tools in the upper left corner of the page.
 RITIS Training Module 10 Script Welcome to the Regional Integrated Transportation Information System or RITIS Module 10 CBT. To begin, select the start button or press Shift+N on your keyboard. To return
Covisint DocSite Enterprise
 Covisint DocSite Enterprise June 2013 Site Administrator User Guide Covisint DocSite Enterprise Site Administrator Guide Compuware-Covisint All rights reserved 2013 SiteAdminGuideDocSite-2013.5-061113
ABA Advantage Web Portal User Guide
 ABA Advantage Web Portal User Guide Version v2.1.18.4092 Page 1 of 63 1.0 Signing in Version v2.1.18.4092 Page 2 of 63 1.0 Signing in Table of Contents 1.0 Signing in... 6 2.0 Clients... 7 2.1 Clients
Release Notes v9.0.20
 Release Notes v9.0.20 Some exciting features in this release! EMR Features Redesigned Co-Sign and In-Progress Encounter modules Enhanced Group Appointments Ability to Copy Patient Details from Existing
Provider Portal User Guide. For the Provider Portal External Use
 Provider Portal User Guide For the Provider Portal External Use IT Department Issued January 2017 mynexus 2017. All rights reserved. Version 1.4 Revised 07122017 Contents Getting Started with the Portal...
Welcome to the New SHPSolutions Dashboard! STRATEGIC HEALTHCARE PROGRAMS. REAL-TIME. REAL-SMART.
 Welcome to the New SHPSolutions Dashboard! STRATEGIC HEALTHCARE PROGRAMS. REAL-TIME. REAL-SMART. How It Benefits You Activation Setup and Utilization What s Next? The SHPSolutions Dashboard Benefits Monitor
VisRMS Resident Scheduling Module Visits Quick Tracker Visits Quick Tracker Overview... 3 Set Up Information... 3
 VisRMS Resident Scheduling Module Visits Quick Tracker Visits Quick Tracker Overview... 3 Set Up Information... 3 Changing the Therapy Type... 3 Selecting a Resident... 4 Select the Date... 4 Calendar
SERVER FOR PRESCRIBING INFORMATION REPORTING AND ANALYSIS (SPIRA) USER GUIDE CONTENTS
 USER GUIDE CONTENTS") SERVER FOR PRESCRIBING INFORMATION REPORTING AND ANALYSIS (SPIRA) USER GUIDE CONTENTS INTRODUCTION TO SPIRA... 2 GETTING STARTED: LOGGING IN AND LOADING THE DASHBOARD... 2 TABLEAU AS A DYNAMIC DATA DISCOVERY
SERVER FOR PRESCRIBING INFORMATION REPORTING AND ANALYSIS (SPIRA) USER GUIDE CONTENTS INTRODUCTION TO SPIRA... 2 GETTING STARTED: LOGGING IN AND LOADING THE DASHBOARD... 2 TABLEAU AS A DYNAMIC DATA DISCOVERY
TurnItIn How Do I Set Up My Turnitin Assignment? How Do I Give Feedback to My Students in Turnitin?...109
 ASSIGNMENTS Table of Contents Assignment Settings... 4 How Do I Create an Assignment?... 5 How Do I Edit an Assignment?... 8 How Do I Create a Group Assignment?...11 How Do I Delete an Assignment?...18
CRA OC RDC Classic User Guide
 CRA OC RDC Classic User Guide Version 1.0 Page 1 of 37 TABLE OF CONTENTS Accessing OC RDC Steps for Access 3 Logging On 3 Change Password 5 Change Study 5 Laptop and System Security 6 Navigating OC RDC
SmartView. User Guide - Analysis. Version 2.0
 SmartView User Guide - Analysis Version 2.0 Table of Contents Page i Table of Contents Table Of Contents I Introduction 1 Dashboard Layouts 2 Dashboard Mode 2 Story Mode 3 Dashboard Controls 4 Dashboards
Engagement Portal. Physician Engagement User Guide Press Ganey Associates, Inc.
 Engagement Portal Physician Engagement User Guide 2015 Press Ganey Associates, Inc. Contents Logging In... 3 Summary Dashboard... 4 Results For... 5 Filters... 6 Summary Page Engagement Tile... 7 Summary
BYU-Idaho Online Knowledgebase
 ASSIGNMENTS Table of Contents Assignment Settings...4 How Do I Create an Assignment?...5 How Do I Edit an Assignment?...8 How Do I Create a Group Assignment?...12 How Do I Delete an Assignment?...21 "Dropbox"
RL6 - WORKING WITH REPORTS
 RL6 - WORKING WITH REPORTS If you have RL6 Risk questions please contact: RL_support@wrha.mb.ca or (204) 926-1070 WRHA Quality Improvement & Patient Safety Version: 3.0, November 2, 2018 WORKING WITH REPORTS
Mayo Clinic CareLink Quick Start Guide. May 5, 2018
 Mayo Clinic CareLink Quick Start Guide May 5, 2018 1 Mayo Clinic CareLink Quick Start Guide Getting Started... 3 Help and contact information... 4 Browser, system, and connection requirements... 4 How
User Guide. Last Updated June 201 6
 User Guide Last Updated June 201 6 1 TABLE OF CONTENTS 1 Basics 4 1.1Logging In 4 1.2Dashboard 5 1.2.1 Tabs 5 1.2.2 Action Items 6 1.2.3 Coordinator s Dashboard 6 2 Forms 6 2.1Common Form Operations 6
General Radiology Improvement Database
 The American College of Radiology General Radiology Improvement Database User Guide October 12, 2010 American College of Radiology 1891 Preston White Drive Reston, VA 20191-4397 Copyright 2010, American
Oregon Maternal Data Center (OMDC) Steps for First-Time Participants
 Steps for First-Time Participants") Oregon Maternal Data Center (OMDC) Steps for First-Time Participants Thank you for participating in the Oregon Maternal Data Center (MDC). The Oregon MDC is being implemented by the Oregon Health Care
Oregon Maternal Data Center (OMDC) Steps for First-Time Participants Thank you for participating in the Oregon Maternal Data Center (MDC). The Oregon MDC is being implemented by the Oregon Health Care
Table of Contents. I. Logging into Camden HIE... 3 II. Basic Home View... 4
 Clinical User Guide Revised April, 2018 Table of Contents HIE Basics I. Logging into Camden HIE..... 3 II. Basic Home View... 4 Applications Dashboard III. My Patients List... 5-7 IV. Inside a patient
The LifeVest Network Patient Data Management System Quick Start Guide. Information for Healthcare Professionals
 The LifeVest Network Patient Data Management System Quick Start Guide Information for Healthcare Professionals Monitor and prioritize your patient s needs anywhere, anytime. The LifeVest Network is ZOLL
HealthConnect User Guide
 HealthConnect User Guide What is HealthConnect?... 2 Benefits of HealthConnect... 4 HealthConnect Homepage Initial Setup... 5 Tack Down the Menu Bar... 7 Setting Default Home Page... 7 Add HealthConnect
Provider User Guides
 Provider User Guides Table of Contents What's New... 1 Overview of Changes:... 1 User Interface Changes... 2 Data Model Changes... 2 First Time Logging In... 5 SmartCare Basics... 9 Open a Client... 13
Using Reports and Graphs
 Using Reports and Graphs Information in this section explains how to generate and use PCS Axis reports and graphs. The information is intended for PCS Axis users with SysAdmin, User, and Read Only user
Navigating ROM (Results Oriented Management) Knowledge Base Article
 Knowledge Base Article") (Results Oriented Management) Knowledge Base Article TableofContents ROM Overview... 3 Background... 3 Browsers... 4 Login... 4 My ROM Reports Home Screen Overview... 5 Header Overview... 5 Main Menu Links
(Results Oriented Management) Knowledge Base Article TableofContents ROM Overview... 3 Background... 3 Browsers... 4 Login... 4 My ROM Reports Home Screen Overview... 5 Header Overview... 5 Main Menu Links
SPS Commerce Dashboards & Alerts User Guide
 SPS Commerce Dashboards & Alerts User Guide 1 Table of Contents Introduction... 3 Additional Resources... 3 Logging In... 4 Changing your password... 4 The Portal Homepage... 5 Administration... 5 My Reports...
Module 2: Health Information Exchange Services
 Module 2: Health Information Exchange Services Introduction In this module, Health Information Exchange (HIE) will be introduced. This system is designed to provide patient information for THR facilities
Records Center Training Guide
 WEB MODULE Updated June 2013 Records Center Training Guide Florida State Records Center Division of Library and Information Services This page intentionally left blank. Total Recall Web Module Records
Table of Contents. Contents. 1 Introduction. 2 The Main Menu Step #2 - PM Schedule. 8 Notification Popups. 9 Service Calendar
 Contents I Table of Contents 1 Introduction...1 2 The Main Menu...1 3 The Equipment...3 Manager...6 4 Step #1 - Establishing Locations/Categories...6 5 Step #2 - PM Schedule Setup...9 6 Step #3 - Adding
Hidden Gems for Avatar Champions May 15, Title. Subtitle
 Hidden Gems for Avatar Champions May 15, 2017 Title Subtitle 1 Purpose As a token of our appreciation for your participation as an Avatar Champion, we are pleased to share with you hidden gems, helpful
Clackamas Education Service District Special Education User Guide
 Clackamas Education Service District Special Education User Guide Canby CESD Colton Estacada Gladstone Lake Oswego Molalla River North Clackamas Oregon City Oregon Trail West Linn-Wilsonville Support Options
Qualtrics Survey Software
 Qualtrics Survey Software GETTING STARTED WITH QUALTRICS Qualtrics Survey Software 0 Contents Qualtrics Survey Software... 2 Welcome to Qualtrics!... 2 Getting Started... 2 Creating a New Survey... 5 Homepage
New Finance Officer & Staff Training
 New Finance Officer & Staff Training Overview MUNIS includes many programs and tools to allow for the management of the District financials. As newer finance officers and staff, you are charged with understanding,
JBI PACES. Version 2. User Guide
 JBI PACES Version 2 User Guide User Guide Quick Reference Guide The quick reference guide for Clinician or Organisational audits can be downloaded from the menu system in PACES, the PACES home page, and
Analysis and Reports. Safety Event Manager with QPrecision
 Analysis and Reports Safety Event Manager with QPrecision Analyzing Safety Event Data Safety Event Manager with QPrecision supports datadriven decision making through its Reports features. Reports leverage
Quick Start Guide to Dynamic Templates
 Quick Start Guide to Dynamic Templates CS Version 2.7.7 (EMIS) Getting Started CHECKLIST: You must be logged into your Clinical System (EMIS) with a patient selected to access Clinical Support (CS) o Double
Customise your module structure
 VITAL how to guides Customise your module structure Creating new menu items in a module menu Editing menu items in a module menu Re-ordering items in a module menu The Module Page elearning Unit Last updated:
Entering and Managing Data in EvaluationWeb for CDC Program Announcement PS
 Entering and Managing Data in EvaluationWeb for CDC Program Announcement PS17-1704 User Guide Version 1.1 May 2017 All rights reserved Table of Contents Change History... iii Getting Help... iv Accessing
OpenEMR Users Guide. Based on Version 4.0. Getting Started Getting to the Login Page. Changing Passwords Main Screen & Navigation.
 OpenEMR Users Guide Based on Version 4.0 Table of Contents Getting Started Getting to the Login Page Logging In Changing Passwords pg 3 pg 3 pg 3 pg 3 Main Screen & Navigation Navigation Traditional Tree
Getting Started in CAMS Enterprise
 CAMS Enterprise Getting Started in CAMS Enterprise Unit4 Education Solutions, Inc. Published: 18 May 2016 Abstract This document is designed with the new user in mind. It details basic features and functions
vcenter Hyperic Monitoring and Management Guide
 vcenter Hyperic Monitoring and Management Guide vcenter Hyperic 5.8 This document supports the version of each product listed and supports all subsequent versions until the document is replaced by a new
WEST TEXAS A&M UNIVERSITY
 WEST TEXAS A&M UNIVERSITY Instructional Technology Services WTClass Training Manual Grade Center July 2014 WTClass Blackboard 9.1 For technical support call (806) 651-4357 Support website: http://angel.wtamu.edu/online
Log onto Meditech. User Name. Password
 Log onto the Network Ensure that the Check XenApp application is highlighted and then click on that to activate the log on screen. Once you get a log on screen please in lower case enter in your user ID.
Installation 3. PerTrac Reporting Studio Overview 4. The Report Design Window Overview 8. Designing the Report (an example) 13
 13") Contents Installation 3 PerTrac Reporting Studio Overview 4 The Report Design Window Overview 8 Designing the Report (an example) 13 PerTrac Reporting Studio Charts 14 Chart Editing/Formatting 17 PerTrac
Contents Installation 3 PerTrac Reporting Studio Overview 4 The Report Design Window Overview 8 Designing the Report (an example) 13 PerTrac Reporting Studio Charts 14 Chart Editing/Formatting 17 PerTrac
User Guide for Explorer Users
 User Guide for Explorer Users Version 2015.1 Hubble Suite (Edition 2) Document Information....................................................... 1 Notices.........................................................................