CREATING DESMOS ETOOLS
|
|
|
- Camilla Oliver
- 5 years ago
- Views:
Transcription
1 CREATING DESMOS ETOOLS
2 Table of Contents Using Desmos... 3 Creating & Using a Desmos Account (Top Black Bar)... 4 Domain/Range & Axis Labels & Zoom: (Right side Icons)... 6 Adding Items in the List Tray: (Left Light Gray Bar)... 8 Create a Moveable Line Using a Moveable Point...11 Creating Sliders...13 Creating Tables...15 Creating Tables: Scatter Plots...17 Restricting Domain and Range...18 Geometry...20 Create a Rigid Moveable Shape...21 Create Polygons...23 Side Lengths & Perimeter...25 Regressions...27 Creating a Regression Line...28 Creating a Line of Best Fit...29 Algebra...31 Inequalities & Shading...32 Piecewise Functions...33
3 Using Desmos Page 3

4 Creating & Using a Desmos Account (Top Black Bar) Students and teachers would benefit by attaining a Desmos Account in order to save their work and share with others. EXPLORE: Desmos Calculator Look at the top BLACK bar. Click all words and icons on the top bar. What do each do? TASK: Get a Desmos Account Click on "Create Account". We recommend using your Google Account because it is easy and no new password to remember! Or, you can create a Desmos Account. Page 4


5 SAVE: To access your Saved projects or create a New Blank Graph: 1. Click on the three parallel bars to open and close your saved graphs! 2. Click on any saved project. Then click on the "Open Graph". 3. Click on "New Blank Graph" to create a new graph. Page 5

6 Domain/Range & Axis Labels & Zoom: (Right side Icons) You will create a graph changing the Domain/Range, adding labels, and zooming in and out. EXPLORE: The following is an example of the task you will be doing. Time/Distance Graph Create: Modify the file by domain restricting the function so that the graph is between -1 and 10 seconds. Scale the y-axis from -50 to 320 feet. Add the labels Time and Distance on the x- and y-axis. SAVE: Rename the graph Save to your Desmos Account! Page 6
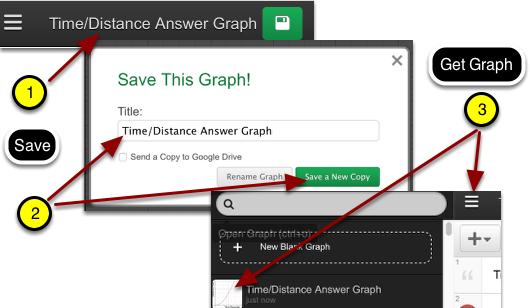
7 Page 7

8 Adding Items in the List Tray: (Left Light Gray Bar) EXPLORE: Click on the "Bar Graph" link below. Then explore the items in the light gray bar at left! Click on the arrow next to the "+" sign. Try each option. Click on the arrow in front of "Bar Graph". Then click the Gear icon/"done" to exit. What is its purpose? Click on the "<<" icon twice! What is its purpose? Bar Graph CREATE: Add a 5th orange bar. Make the width 1.5 units and the height 8 units. Add an Orange image and position it above the orange bar. Add your steps inside the Bar Graph folder. Step 1: Add the orange bar. 1. Click the "+arrow" button and select "f(x) expression". 2. Type in the function. You may need to access the bottom left key board icon to select from a keyboard. 3. Change color by clicking the BLUE circle. Hold 3 seconds for the color palette to show. Select the orange color. Step 2: Make the image that says "Orange". 1. Select "Note" from the "+arrow" button. 2. In the new note, type: "Orange". Capture the word using your computer's image capture. 3. Select "Image" from the "+arrow" button. Browse to your image and upload. 4. Shrink the image by dragging the bottom right handle diagonally up. Move the image by click/drag from the center. Page 8


9 Step 3: Create an additional Folder and move your steps into it. 1. Add folder. Name your folder. Drag the folder icon to any place in the list. 2. Drag your steps just under each other to add to folder. Vertical lines will appear. 3. Click the folder arrow to close. Step 4: Add a note. 1. Select a new Note. 2. Type on your note: Modified by <your name>. Position the note by dragging the step up or down. 3. Save your work! SAVE: 1. Click the name of the graph. 2. Rename and Save. Page 9

10 3. Find the graph under the 3 parallel bars! Page 10

11 Create a Moveable Line Using a Moveable Point EXPLORE: In the example below: Drag the BLUE points. Drag along the line. Drag the grid. Click the arrow in front of "Line" in step 3 to view how this is created! Moveable Line Create: Create a line with a stationary point at (0,0) and a moveable point which allows the user to pivot the line about the origin thereby changing the Slope. Step 1: 1. Add a new folder from the "+" menu and name it such as "Moveable Line about the Origin" 2. Delete the current lines so that you do not repeat variable names. Step 2: Type the following steps without the comments in the ovals. The sliders are automatically created when clicking "add sliders" ALL! Page 11


12 SAVE: Click on the "Moveable line" to resave! Rename the graph. Click on "Save a New Copy". Page 12


13 Creating Sliders EXPLORE: Create Sliders Desmos has a built in tutorial for sliders: Click the "?". Click Sliders. Follow all of the steps in the tutorial! Create: Type the equation: y= a sin(b(x-c)) + d Add ALL sliders. Manually or automatically move the sliders! Change the speed when on automatic! Change the domain/step of the sliders. Page 13

14 Save: 1. Click "Untitled Graph" 2. Name and "Save Graph". 3. Click the 3 parallel bars to access the file. Page 14
 CREATE: Create one of the letters in your initials! Be sure to connect your points!")
15 Creating Tables EXPLORE: Use the following "New Blank Desmos Graph" to complete the work below. New Blank Desmos Graph 1. At the upper right corner, click the "?". 2. Click "Tables". Follow the directions. 3. Note: When clicking the circle next to "y", try the other submenus.) CREATE: Create one of the letters in your initials! Be sure to connect your points! An example for "A" is below! Page 15

16 SAVE: Click on the Untitled Graph on the upper left corner. Add a title. Click "Save Graph". Check your saved list for the file. Page 16


17 Creating Tables: Scatter Plots EXPLORE: Click on the link below. Scroll down watching the animation showing how to create scatter plots. Scatter Plots CREATE: Scatter Plots: House 1. Click the table so that all columns show. 2. Click the white circle in the 2nd column. An orange house will appear above the purple house. 3. Click just after the green circle in the 3rd column to select the column. Type:.5y1 SAVE: Page 17

18 Restricting Domain and Range EXPLORE: Click on the list below. Restricting Domain and Range Click on the "?" at the upper right of Desmos. Click on "Restrictions". Follow the tutorial. CREATE: Add 3 domain restricted equations to draw the triangle below. Do NOT use a table. SAVE: 1. Click Untitled Graph. Page 18

19 2. Rename and "Save Graph". 3. Click the 3 parallel bars to access saved graph. Page 19
20 Geometry Page 20

21 Create a Rigid Moveable Shape EXPLORE: Click on the link below. Move the shapes about. Look at the expressions under the arrow for several shapes. Moveable Shapes CREATE: Step 1: Create a moveable "L" or other letter of your choice! Follow the two steps below. Delete all of the shapes before starting your own. Add your own title or notes. Step 2: Follow the steps below to create an "L". Or be creative and make your own shape! Add a table. Be sure to click the circle in front of the output and change it to connect lines! Page 21


22 SAVE: 1. Click the name next to the GREEN SAVE BUTTON. 2. Rename & Save. 3. Click the 3 parallel bars to access the saved file in the future. Page 22
.")
23 Create Polygons EXPLORE: Click on the link below. Move each vertex. How many different quadrilaterals can you form? Click the arrow on the folder and investigate the table and the moveable point. Create Quadrilaterals CREATE: Resave the file and call it "Create Polygons". Add two more folders. Name the first: 3-Sides (Triangles). Name the second: 5-Sides (Pentagons) Below are the expressions and table to add to the 3-Sides (Triangles) folder. Add similar expressions and table to add to the folder for pentagons. Additional Notes: A moveable point must start and end the table to connect the sides of the figure. Hold the circle until the menu shows. Select the icon to connect the points and to move them in all directions. The variables MUST be unique. Choose a system that makes sense to you. In this case the columns are named P3x and P3y representing the x-column for a polygon of 3 sides and the y- column for a polygon of 3 sides. The variable point was named: (x3,y3) for a variable point for the 3-sided figure. Check how the variables are named for the 4-sided polygon. Follow a similar pattern for the 5-sided polygon. Page 23

24 SAVE: Save your work in your Desmos Account. Save the link to your google spreadsheet for your partner to access or the link to your partner. Page 24

25 Side Lengths & Perimeter EXPLORE: Click on the link below. Drag the vertices of the rectangle. Notice the changes of the side lengths and the perimeter. Side Lengths & Perimeter CREATE: 5-sided pentagon Modify the file: Add a 5th point and sliders in the Points folder. Add an additional side in the table. Link the image "E" (found in the Images folder) to the 5th vertex. Modify the expressions and formulas found in the Calculations & Table folder. Modify the "DA" formula to "DE" formula. Add a "EA" formula. Change the formula for the perimeter to reflect all 5 sides. At the top, add the DE and EA formulas. Verify your work! Page 25


26 SAVE: Rename the file: Pentagons: Side Lengths and Perimeter Save to your Desmos Account & save to your Google spreadsheet. Page 26
27 Regressions Page 27

28 Creating a Regression Line EXPLORE: Watch the video below. Click on the "Blank Desmos Graph" to get started! How To: Create Regressions Blank Desmos Graph CREATE: Use the built-in tutorial for creating regressions using Desmos. 1. Click the "?". Then Click the Regressions icon. 2. Follow the given steps. SAVE: Give your finished file a name such as "Regressions Example". Save to your Desmos Account. You will be able to go back to it later to modify over it or use it as a guide for a new project. Page 28

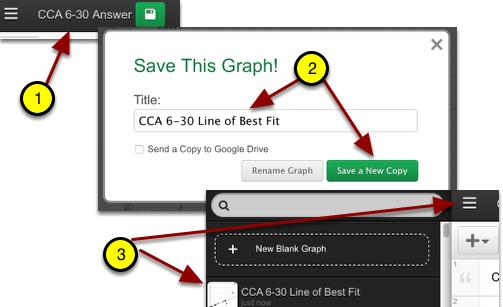
29 Creating a Line of Best Fit Create a moveable line to "fit" over a set of data. EXPLORE: Fit a line to this set of data. Creating a Line of Best Fit CREATE: A Moveable Line Add a new folder, name it, and add the following expressions below. Create 2 moveable points. Calculate the slope between them. Use the point/slope form of a line. SAVE: Save your work to your account. Page 29
30 Page 30
31 Algebra Page 31


32 Inequalities & Shading EXPLORE: The inequality for each shape is on the left with the same color. You can add variables/sliders to the inequalities to allow the shape to change. Inequalities & Shading CREATE: Delete the shapes on the examples above. Create a simple shape writing the inequality which is somewhat different from the examples. Shade the interior with a color. SAVE: Click on the "Inequalities & Shading". Rename and save. View your file. Page 32
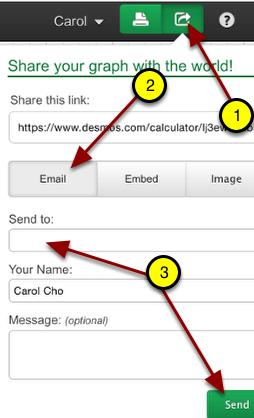
33 Piecewise Functions EXPLORE: Click on the link below. How is each segment of the graph drawn? Drag along all segments from beginning to the end. How are the endpoints depicted? Piecewise Functions CREATE: Change the above file so that functions are restricted reflecting the graph below Click on the green arrow at the far top right. 2. Click " " 3. Add your address and send it. Page 33
34 Page 34
CC INTEGRATED II ETOOLS
 CC INTEGRATED II ETOOLS Table of Contents General etools... 4 Algebra Tiles (CPM)... 5 Pattern Tile & Dot Tool (CPM)... 8 Similarity Toolkit (CPM)...10 Probability Tools (CPM)...12 Desmos Graphing Calculator...16
GeoGebra. 10 Lessons. maths.com. Gerrit Stols. For more info and downloads go to:
 GeoGebra in 10 Lessons For more info and downloads go to: http://school maths.com Gerrit Stols Acknowledgements Download GeoGebra from http://www.geogebra.org GeoGebra is dynamic mathematics open source
Fixed Perimeter Rectangles Geometry Creating a Document
 Activity Overview: This activity provides the steps to create a TI-Nspire document that will be used to investigate side length and area in a rectangle with a fixed perimeter. An algebraic approach is
Grasp the Geometry! Using Data Capture with TI-Nspire Technology. Karen D. Campe
 Grasp the Geometry! Using Data Capture with TI-Nspire Technology Karen D. Campe skcampe@optonline.net National Council of Teachers of Mathematics Regional Conference October 2012 Opportunities to make
Maximizing the Area of a Garden
 Math Objectives Students will determine the relationship between the width and length of a garden with a rectangular shape and a fixed amount of fencing. The garden is attached to a barn, and exactly three
For more info and downloads go to: Gerrit Stols
 For more info and downloads go to: http://school-maths.com Gerrit Stols Acknowledgements GeoGebra is dynamic mathematics open source (free) software for learning and teaching mathematics in schools. It
12.4 Rotations. Learning Objectives. Review Queue. Defining Rotations Rotations
 12.4. Rotations www.ck12.org 12.4 Rotations Learning Objectives Find the image of a figure in a rotation in a coordinate plane. Recognize that a rotation is an isometry. Review Queue 1. Reflect XY Z with
Quickstart for Desktop Version
 Quickstart for Desktop Version What is GeoGebra? Dynamic Mathematics Software in one easy-to-use package For learning and teaching at all levels of education Joins interactive 2D and 3D geometry, algebra,
PLC Papers Created For:
 PLC Papers Created For: Year 10 Topic Practice Papers: Polygons Polygons 1 Grade 4 Look at the shapes below A B C Shape A, B and C are polygons Write down the mathematical name for each of the polygons
City of La Crosse Online Mapping Website Help Document
 City of La Crosse Online Mapping Website Help Document This document was created to assist in using the new City of La Crosse online mapping sites. When the website is first opened, a map showing the City
Recipes4Success. Draw and Animate a Rocket Ship. Frames 5 - Drawing Tools
 Recipes4Success You can use the drawing tools and path animation tools in Frames to create illustrated cartoons. In this Recipe, you will draw and animate a rocket ship. 2012. All Rights Reserved. This
Algebra 2 Graphing Project. 1. You must create a picture or artistic design using the graphs of at least 10 different functions and relations.
 Algebra 2 Graphing Project Directions: 1. You must create a picture or artistic design using the graphs of at least 10 different functions and relations. 2. Your picture must include at least one of each
Quickstart for Web and Tablet App
 Quickstart for Web and Tablet App What is GeoGebra? Dynamic Mathematic Software in one easy-to-use package For learning and teaching at all levels of education Joins interactive 2D and 3D geometry, algebra,
Student Outcomes. Lesson Notes. Classwork. Opening Exercise (3 minutes)
") Student Outcomes Students solve problems related to the distance between points that lie on the same horizontal or vertical line Students use the coordinate plane to graph points, line segments and geometric
Student Outcomes Students solve problems related to the distance between points that lie on the same horizontal or vertical line Students use the coordinate plane to graph points, line segments and geometric
National Weather Map
 Weather Map Objectives Each student will utilize the Google Docs drawing application to create a map using common weather map symbols that show the current state of the weather in the United States. Benchmarks
Unit 1, Lesson 1: Moving in the Plane
 Unit 1, Lesson 1: Moving in the Plane Let s describe ways figures can move in the plane. 1.1: Which One Doesn t Belong: Diagrams Which one doesn t belong? 1.2: Triangle Square Dance m.openup.org/1/8-1-1-2
A "Quick and Dirty" Introduction to THE GEOMETER'S SKETCHPAD
 A "Quick and Dirty" Introduction to the GEOMETER'S SKETCHPAD v. 4.0 Dynamic Geometry in the Mathematics Classroom _/_/_/ _/_/_/ _/_/ _/_/ Dr. _/ _/ _/ _/ Distinguished Teaching Professor _/_/_/ _/_/ _/
Expression Design Lab Exercises
 Expression Design Lab Exercises Creating Images with Expression Design 2 Beaches Around the World (Part 1: Beaches Around the World Series) Information in this document, including URL and other Internet
Pre-Lab Excel Problem
 Pre-Lab Excel Problem Read and follow the instructions carefully! Below you are given a problem which you are to solve using Excel. If you have not used the Excel spreadsheet a limited tutorial is given
Find Closed Lines. Put an on the lines that are not closed. Circle the closed lines. Who wins:,, or nobody?
 Find Closed Lines Put an on the lines that are not closed. Circle the closed lines. Who wins:,, or nobody? Blackline Master Geometry Teacher s Guide for Workbook 2.1 1 Crossword Polygons Fill in the names
Geometer s Sketchpad Techno Polly
 Geometer s Sketchpad Techno Polly Opening an Existing Sketch 1. To open an existing sketch in Geometer s Sketchpad, first click on the icon on your desktop then when the program opens click on File, Open.
Ancient Cell Phone Tracing an Object and Drawing with Layers
 Ancient Cell Phone Tracing an Object and Drawing with Layers 1) Open Corel Draw. Create a blank 8.5 x 11 Document. 2) Go to the Import option and browse to the Graphics 1 > Lessons folder 3) Find the Cell
Selects an object on the screen.
 G e t t i n g Sta r t e d w i t h t h e T I - N s p i r e Key Name xclick Key (See Figures 1 and 2.) TouchPad descape Key» Scratch Pad etab Key c Home Key ~ Document Key b Menu Key Function Selects an
FSA Algebra 1 EOC Practice Test Guide
 FSA Algebra 1 EOC Practice Test Guide This guide serves as a walkthrough of the Algebra 1 EOC practice test. By reviewing the steps listed below, you will have a better understanding of the test functionalities,
ame Date Class Practice A 11. What is another name for a regular quadrilateral with four right angles?
 ame Date Class Practice A Polygons Name each polygon. 1. 2. 3. 4. 5. 6. Tell whether each polygon appears to be regular or not regular. 7. 8. 9. 10. What is another name for a regular triangle? 11. What
FSA Algebra 1 EOC Practice Test Guide
 FSA Algebra 1 EOC Practice Test Guide This guide serves as a walkthrough of the Florida Standards Assessments (FSA) Algebra 1 End-of- Course (EOC) practice test. By reviewing the steps listed below, you
The Fundamentals. Document Basics
 3 The Fundamentals Opening a Program... 3 Similarities in All Programs... 3 It's On Now What?...4 Making things easier to see.. 4 Adjusting Text Size.....4 My Computer. 4 Control Panel... 5 Accessibility
Lesson 1. Unit 2 Practice Problems. Problem 2. Problem 1. Solution 1, 4, 5. Solution. Problem 3
 Unit 2 Practice Problems Lesson 1 Problem 1 Rectangle measures 12 cm by 3 cm. Rectangle is a scaled copy of Rectangle. Select all of the measurement pairs that could be the dimensions of Rectangle. 1.
STANDARDS OF LEARNING CONTENT REVIEW NOTES HONORS GEOMETRY. 3 rd Nine Weeks,
 STANDARDS OF LEARNING CONTENT REVIEW NOTES HONORS GEOMETRY 3 rd Nine Weeks, 2016-2017 1 OVERVIEW Geometry Content Review Notes are designed by the High School Mathematics Steering Committee as a resource
Geometry. Name. Use AngLegs to model each set of shapes. Complete each statement with the phrase "is" or "is not." Triangle 1 congruent to Triangle 2.
 Lesson 1 Geometry Name Use AngLegs to model each set of shapes. Complete each statement with the phrase "is" or "is not." 1. 2. 1 2 1 2 3 4 3 4 Triangle 1 congruent to Triangle 2. Triangle 2 congruent
Course Guide (/8/teachers/teacher_course_guide.html) Print (/8/teachers/print_materials.html) LMS (/8
 Print (/8/teachers/print_materials.html) LMS (/8") (http://openupresources.org)menu Close OUR Curriculum (http://openupresources.org) Professional Development (http://openupresources.org/illustrative-mathematics-professional-development) Implementation
(http://openupresources.org)menu Close OUR Curriculum (http://openupresources.org) Professional Development (http://openupresources.org/illustrative-mathematics-professional-development) Implementation
Introduction to Google SketchUp
 Introduction to Google SketchUp When initially opening SketchUp, it will be useful to select the Google Earth Modelling Meters option from the initial menu. If this menu doesn t appear, the same option
Shapes & Transformations and Angles & Measurements Spatial Visualization and Reflections a.) b.) c.) d.) a.) b.) c.)
 b.) c.) d.) a.) b.) c.)") Chapters 1 & 2 Team Number Name Shapes & Transformations and Angles & Measurements 1.2.1 Spatial Visualization and Reflections 1-47. d.) 1-48. 1-49. 1-50. 1-51. d.) 1-52. On the axes at right, graph the
Chapters 1 & 2 Team Number Name Shapes & Transformations and Angles & Measurements 1.2.1 Spatial Visualization and Reflections 1-47. d.) 1-48. 1-49. 1-50. 1-51. d.) 1-52. On the axes at right, graph the
This is a structured tutorial demonstrating the features of the GEdit system. The tutorial guides the designer through three structured examples.
 Tutorial on Gedit This is a structured tutorial demonstrating the features of the GEdit system. The tutorial guides the designer through three structured examples. Background GEdit is a program that allows
House Build Tutorial NAME: GRADE: ARTD 240 3D Modeling & Animation Deborah Ciccarelli, Assistant Professor
 ARTD 240 3D Modeling & Animation Deborah Ciccarelli, Assistant Professor NAME: GRADE: House Build Tutorial Goal: Create a model of a house by referencing drafts of a front and side elevation. Follow the
Learning Microsoft Word By Greg Bowden. Chapter 10. Drawing Tools. Guided Computer Tutorials
 Learning Microsoft Word 2007 By Greg Bowden Chapter 10 Drawing Tools Guided Computer Tutorials www.gct.com.au PUBLISHED BY GUIDED COMPUTER TUTORIALS PO Box 311 Belmont, Victoria, 3216, Australia www.gct.com.au
WEEK NO. 12 MICROSOFT EXCEL 2007
 WEEK NO. 12 MICROSOFT EXCEL 2007 LESSONS OVERVIEW: GOODBYE CALCULATORS, HELLO SPREADSHEET! 1. The Excel Environment 2. Starting A Workbook 3. Modifying Columns, Rows, & Cells 4. Working with Worksheets
Student Name: Teacher: Date: Miami-Dade County Public Schools. Test: 9_12 Mathematics Geometry Exam 2
 Student Name: Teacher: Date: District: Miami-Dade County Public Schools Test: 9_12 Mathematics Geometry Exam 2 Description: GEO Topic 5: Quadrilaterals and Coordinate Geometry Form: 201 1. If the quadrilateral
Chapter 2 Surfer Tutorial
 Chapter 2 Surfer Tutorial Overview This tutorial introduces you to some of Surfer s features and shows you the steps to take to produce maps. In addition, the tutorial will help previous Surfer users learn
3ds Max Cottage Step 1. Always start out by setting up units: We re going with this setup as we will round everything off to one inch.
 3ds Max Cottage Step 1 Always start out by setting up units: We re going with this setup as we will round everything off to one inch. File/Import the CAD drawing Be sure Files of Type is set to all formats
Google My Maps. What can you do with My Maps? Check out some info from Google: https://www.google.com.au/maps/about/mymaps/
 Google My Maps What can you do with My Maps? Check out some info from Google: https://www.google.com.au/maps/about/mymaps/ Explore the EZEC map: https://drive.google.com/open?id=153_82bl_wypwbt5wn8ebvqfoxgs&usp=sharing
Dynamic-Geometry Activities with GeoGebra for Virtual Math Teams VMT Project Team The Math Forum at Drexel University
 Dynamic-Geometry Activities with GeoGebra for Virtual Math Teams VMT Project Team The Math Forum at Drexel University Draft for review only page 1 Tuesday, May 1, 2012 Introduction Dynamic-Geometry Activities
TI- Nspire Testing Instructions
 TI- Nspire Testing Instructions Table of Contents How to Nsolve How to Check Compositions of Functions How to Verify Compositions of Functions How to Check Factoring How to Use Graphs to Backward Factor
Standard Toolbar. Main Toolbar. Page Sorter. Action Toolbar
 TEAMBOARD DRAW This is an annotation software that can be used with the interactive pen to write or draw on the projection surface. This software also provides advanced tools for saving and editing annotations
Grade 8 - geometry investigation - Rene Rix *
 OpenStax-CNX module: m35699 1 Grade 8 - geometry investigation - Rene Rix * Pinelands High School This work is produced by OpenStax-CNX and licensed under the Creative Commons Attribution License 3.0 An
Math Geometry FAIM 2015 Form 1-A [ ]
![Math Geometry FAIM 2015 Form 1-A [ ]](/thumbs/80/81205175.jpg "Math Geometry FAIM 2015 Form 1-A [ ]") Math Geometry FAIM 2015 Form 1-A [1530458] Student Class Date Instructions Use your Response Document to answer question 13. 1. Given: Trapezoid EFGH with vertices as shown in the diagram below. Trapezoid
Math Geometry FAIM 2015 Form 1-A [1530458] Student Class Date Instructions Use your Response Document to answer question 13. 1. Given: Trapezoid EFGH with vertices as shown in the diagram below. Trapezoid
ROSE-HULMAN INSTITUTE OF TECHNOLOGY
 Introduction to Working Model Welcome to Working Model! What is Working Model? It's an advanced 2-dimensional motion simulation package with sophisticated editing capabilities. It allows you to build and
8. prove that triangle is a scalene triangle, right triangle, and/or an isosceles triangle. (evaluation)
") Subject: Geometry Unit: Analytic Geometry Grade: 10 Students will: 1. compare parallel and perpendicular slopes. (analysis) 2. find the slope of a line given two points. (application) 3. find the length
Subject: Geometry Unit: Analytic Geometry Grade: 10 Students will: 1. compare parallel and perpendicular slopes. (analysis) 2. find the slope of a line given two points. (application) 3. find the length
High School Geometry. Correlation of the ALEKS course High School Geometry to the ACT College Readiness Standards for Mathematics
 High School Geometry Correlation of the ALEKS course High School Geometry to the ACT College Readiness Standards for Mathematics Standard 5 : Graphical Representations = ALEKS course topic that addresses
Adobe Flash CS5. Creating a web banner. Garvin Ling Juan Santa Cruz Bruno Venegas
 Adobe Flash CS5 Creating a web banner Garvin Ling Juan Santa Cruz Bruno Venegas Introduction In this tutorial, you will be guided through a step-by-step process on how to create your very own animated
Number of Regions An Introduction to the TI-Nspire CAS Student Worksheet Created by Melissa Sutherland, State University of New York at Geneseo
 1 Name Number of Regions An Introduction to the TI-Nspire CAS Student Worksheet Created by Melissa Sutherland, State University of New York at Geneseo Below you will find copies of the notes provided on
Creating a Title Block & Border Using Chief Architect. Architectural Design & Residential Construction Penncrest High School
 Creating a Title Block & Border Using Chief Architect Architectural Design & Residential Construction Penncrest High School 2017-2018 Select New Layout to begin designing your Title Block. Note: Once the
v Annotation Tools GMS 10.4 Tutorial Use scale bars, North arrows, floating images, text boxes, lines, arrows, circles/ovals, and rectangles.
 v. 10.4 GMS 10.4 Tutorial Use scale bars, North arrows, floating images, text boxes, lines, arrows, circles/ovals, and rectangles. Objectives GMS includes a number of annotation tools that can be used
How to create self-grading multiple-choice tests with Google Docs
 How to create self-grading multiple-choice tests with Google Docs There are many ways that we can use Google Docs to improve learning experiences for our students in Middle and high schools. We can promote
Polygons in the Coordinate Plane
 Polygons in the Coordinate Plane LAUNCH (8 MIN) Before How can you find the perimeter of the sandbox that the park worker made? During How will you determine whether the park worker s plan for the sandbox
2011 Excellence in Mathematics Contest Team Project Level II (Below Precalculus) School Name: Group Members:
 School Name: Group Members:") 011 Excellence in Mathematics Contest Team Project Level II (Below Precalculus) School Name: Group Members: Reference Sheet Formulas and Facts You may need to use some of the following formulas and facts
011 Excellence in Mathematics Contest Team Project Level II (Below Precalculus) School Name: Group Members: Reference Sheet Formulas and Facts You may need to use some of the following formulas and facts
Grade 8 FSA Mathematics Practice Test Guide
 Grade 8 FSA Mathematics Practice Test Guide This guide serves as a walkthrough of the Grade 8 Florida Standards Assessments (FSA) Mathematics practice test. By reviewing the steps listed below, you will
Fun with Diagonals. 1. Now draw a diagonal between your chosen vertex and its non-adjacent vertex. So there would be a diagonal between A and C.
 Name Date Fun with Diagonals In this activity, we will be exploring the different properties of polygons. We will be constructing polygons in Geometer s Sketchpad in order to discover these properties.
Spreadsheet View and Basic Statistics Concepts
 Spreadsheet View and Basic Statistics Concepts GeoGebra 3.2 Workshop Handout 9 Judith and Markus Hohenwarter www.geogebra.org Table of Contents 1. Introduction to GeoGebra s Spreadsheet View 2 2. Record
Geometry SOL Prep Verify solutions using your graphing calculator!
 Geometry SOL Prep Verify solutions using your graphing calculator! The purpose of this document is to show students how to verify and check their answers. These are the calculator keystrokes that teachers
Geometry: Semester 2 Practice Final Unofficial Worked Out Solutions by Earl Whitney
 Geometry: Semester 2 Practice Final Unofficial Worked Out Solutions by Earl Whitney 1. Wrapping a string around a trash can measures the circumference of the trash can. Assuming the trash can is circular,
Using Symbolic Geometry to Teach Secondary School Mathematics - Geometry Expressions Activities for Algebra 2 and Precalculus
 Using Symbolic Geometry to Teach Secondary School Mathematics - Geometry Expressions Activities for Algebra and Precalculus Irina Lyublinskaya, CUNY College of Staten Island, Staten Island, NY, USA and
Grade 6 Mathematics Item Specifications Florida Standards Assessments
 Content Standard MAFS.6.G Geometry MAFS.6.G.1 Solve real-world and mathematical problems involving area, surface area, and volume. Assessment Limits Calculator s Context A shape is shown. MAFS.6.G.1.1
AREA Judo Math Inc.
 AREA 2013 Judo Math Inc. 6 th grade Problem Solving Discipline: Black Belt Training Order of Mastery: Area 1. Area of triangles by composition 2. Area of quadrilaterals by decomposing 3. Draw polygons
POLYGONS
 POLYGONS 8.1.1 8.1.5 After studying triangles and quadrilaterals, the students now extend their knowledge to all polygons. A polygon is a closed, two-dimensional figure made of three or more non-intersecting
FSA Geometry EOC Practice Test Guide
 FSA Geometry EOC Practice Test Guide This guide serves as a walkthrough of the Florida Standards Assessments (FSA) Geometry End-of- Course (EOC) practice test. By reviewing the steps listed below, you
Big Ideas Math Digital Platform. Student Orientation
 Big Ideas Math Digital Platform Student Orientation Big Ideas Math Big Ideas Math is the name of the new series we are using at Edwardsville High School for the following courses: Algebra 1 Geometry Algebra
GEOMETRY CURRICULUM GUIDE Overview and Scope & Sequence
 GEOMETRY CURRICULUM GUIDE Overview and Scope & Sequence Loudoun County Public Schools 2013-2014 (Additional curriculum information and resources for teachers can be accessed through CMS) Geometry Nine
You can retrieve the chart by inputting the symbol of stock, warrant, index futures, sectoral
 Chart Menu Chart menu displays graphical data with histories and 16 major technical analysis tools and Trend Line. You can click at the tool you like. Chart will be changed according to your selection.
Unit 6 Quadratic Functions
 Unit 6 Quadratic Functions 12.1 & 12.2 Introduction to Quadratic Functions What is A Quadratic Function? How do I tell if a Function is Quadratic? From a Graph The shape of a quadratic function is called
Slide 1 / 96. Linear Relations and Functions
 Slide 1 / 96 Linear Relations and Functions Slide 2 / 96 Scatter Plots Table of Contents Step, Absolute Value, Piecewise, Identity, and Constant Functions Graphing Inequalities Slide 3 / 96 Scatter Plots
Integer Operations. Summer Packet 7 th into 8 th grade 1. Name = = = = = 6.
 Summer Packet 7 th into 8 th grade 1 Integer Operations Name Adding Integers If the signs are the same, add the numbers and keep the sign. 7 + 9 = 16-2 + -6 = -8 If the signs are different, find the difference
Lines and Circles Guided Practice: Teacher Instructions
 Lines and Circles Guided Practice: Teacher Instructions Overview 1. Together, as a class, go through the Lines and Circles Guided Practice (exercises 1-22) described below. 2. Then have student teams conduct
A QUICK TOUR OF ADOBE ILLUSTRATOR CC (2018 RELEASE)
") A QUICK TOUR OF ADOBE ILLUSTRATOR CC (2018 RELEASE) Lesson overview In this interactive demonstration of Adobe Illustrator CC (2018 release), you ll get an overview of the main features of the application.
A QUICK TOUR OF ADOBE ILLUSTRATOR CC (2018 RELEASE) Lesson overview In this interactive demonstration of Adobe Illustrator CC (2018 release), you ll get an overview of the main features of the application.
HP Prime Advanced Graphing Calculator
 HP Prime Advanced Graphing Calculator HP Prime is the latest advanced graphing calculator from Hewlett-Packard. It incorporates a fullcolor, multi-touch screen and comes pre-loaded with 18 HP Apps. HP
Section Quiz Lessons 12-1 Through 12-4
 Section Quiz Lessons - Through - hoose the best answer.. What is the image of (, ) when it is reflected across the line y x? (, ) (, ),, Use the figure for Exercises 7. The coordinates of the vertices
I can identify reflections, rotations, and translations. I can graph transformations in the coordinate plane.
 Page! 1 of! 14 Attendance Problems. 1. Sketch a right angle and its angle bisector. 2. Draw three different squares with (3, 2) as one vertex. 3. Find the values of x and y if (3, 2) = (x + 1, y 3) Vocabulary
Algebra II. Slide 1 / 181. Slide 2 / 181. Slide 3 / 181. Conic Sections Table of Contents
 Slide 1 / 181 Algebra II Slide 2 / 181 Conic Sections 2015-04-21 www.njctl.org Table of Contents click on the topic to go to that section Slide 3 / 181 Review of Midpoint and Distance Formulas Introduction
Measurement and Geometry (M&G3)
") MPM1DE Measurement and Geometry (M&G3) Please do not write in this package. Record your answers to the questions on lined paper. Make notes on new definitions such as midpoint, median, midsegment and any
MPM1DE Measurement and Geometry (M&G3) Please do not write in this package. Record your answers to the questions on lined paper. Make notes on new definitions such as midpoint, median, midsegment and any
Dulwich College. SAMPLE PAPER Mathematics
 1+ Dulwich College YEAR 9 ENTRANCE AND SCHOLARSHIP EXAMINATION SAMPLE PAPER Mathematics 1 HOUR 0 MINUTES Use a calculator where appropriate. Answer all the questions. Show all your working. Marks for parts
This user guide covers select features of the desktop site. These include:
 User Guide myobservatory Topics Covered: Desktop Site, Select Features Date: January 27, 2014 Overview This user guide covers select features of the desktop site. These include: 1. Data Uploads... 2 1.1
A Guide to Autodesk Maya 2015
 A Guide to Autodesk Maya 2015 Written by Mitchell Youngerman Table of Contents Layout of Toolbars...pg 1 Creating Objects...pg 2 Selecting & Deselecting Objects...pg 3 Changing Perspective... pg 4 Transforming
Lab - Introduction to Finite Element Methods and MATLAB s PDEtoolbox
 Scientific Computing III 1 (15) Institutionen för informationsteknologi Beräkningsvetenskap Besöksadress: ITC hus 2, Polacksbacken Lägerhyddsvägen 2 Postadress: Box 337 751 05 Uppsala Telefon: 018 471
Slammin Sammy. Name Date. Finger. Shoulder. Back. Toe. Heel
 Name Date Slammin Sammy Finger Shoulder Back Toe Heel (0, 0) Fist 1. Give the coordinates of Sammy s six body parts: Finger (, ) Shoulder (, ) Back (, ) Toe (, ) Heel (, ) Fist (, ) Classroom Strategies
Chapter 12 Transformations: Shapes in Motion
 Name Geometry Honors Date Per. Teacher Chapter 12 Transformations: Shapes in Motion 1 Table of Contents Reflections Day 1.... Page 3 Translations Day 2....... Page 10 Rotations/Dilations Day 3.... Page
Contents COORDINATE METHODS REGRESSION AND CORRELATION
 Contents UNIT 3 UNIT 4 COORDINATE METHODS Lesson 1 A Coordinate Model of a Plane.............. 162 Investigations 1 Representing Geometric Ideas with Coordinates............... 164 2 Reasoning with Slopes
Translations Lesson Bundle
 We are excited that you will be using these interactive investigations to assist your students in exploring and learning about Transformational Geometry. They are designed so that students investigate
SmartBoard & Smart Notebook Software
 SmartBoard & Smart Notebook Software A SMART Board is an interactive whiteboard that is connected to a computer, touch sensitive display acting as both a monitor and input device. SMART Notebook software
Part 1: Basics. Page Sorter:
 Part 1: Basics Page Sorter: The Page Sorter displays all the pages in an open file as thumbnails and automatically updates as you add content. The page sorter can do the following. Display Pages Create
Standardized Tests: Best Practices for the TI-Nspire CX
 The role of TI technology in the classroom is intended to enhance student learning and deepen understanding. However, efficient and effective use of graphing calculator technology on high stakes tests
About...1. Quick Start...2. Features and options...3. Thematic Map...3. Indicators Panel Graph Panel Options Panel...
 USER GUIDE TABLE OF CONTENTS About...1 Quick Start...2 Features and options...3 Thematic Map...3 Indicators Panel... 5 Graph Panel... 6 Options Panel... 7 Data-table Panel... 8 Selection Panel... 8 Time
Vertical Line Test a relationship is a function, if NO vertical line intersects the graph more than once
 Algebra 2 Chapter 2 Domain input values, X (x, y) Range output values, Y (x, y) Function For each input, there is exactly one output Example: Vertical Line Test a relationship is a function, if NO vertical
Paint Tutorial (Project #14a)
") Paint Tutorial (Project #14a) In order to learn all there is to know about this drawing program, go through the Microsoft Tutorial (below). (Do not save this to your folder.) Practice using the different
Paint Tutorial (Project #14a) In order to learn all there is to know about this drawing program, go through the Microsoft Tutorial (below). (Do not save this to your folder.) Practice using the different
Triangle Inequality Theorem
 Triangle Inequality Theorem Preparation Open a new GeoGebra file For this construction, we will not use the coordinate axes or the Algebra window. Click on the View menu on the top of the page. Select
Picket Patterns. Overview
 Ornamental Pro 2010 Rail Section and Picket Pattern Drawing Manual Table of Contents Picket Patterns... 1 Overview... 1 Creating a Picket Pattern... 2 Example 1... 2 Vertical Bar Behavior... 2 Example
a. Plot the point (x, y, z) and understand it as a vertex of a rectangular prism. c. Recognize and understand equations of planes and spheres.
 and understand it as a vertex of a rectangular prism. c. Recognize and understand equations of planes and spheres.") Standard: MM3G3 Students will investigate planes and spheres. a. Plot the point (x, y, z) and understand it as a vertex of a rectangular prism. b. Apply the distance formula in 3-space. c. Recognize and
Standard: MM3G3 Students will investigate planes and spheres. a. Plot the point (x, y, z) and understand it as a vertex of a rectangular prism. b. Apply the distance formula in 3-space. c. Recognize and
Geometry. Geometry is the study of shapes and sizes. The next few pages will review some basic geometry facts. Enjoy the short lesson on geometry.
 Geometry Introduction: We live in a world of shapes and figures. Objects around us have length, width and height. They also occupy space. On the job, many times people make decision about what they know
Lesson 1. Rigid Transformations and Congruence. Problem 1. Problem 2. Problem 3. Solution. Solution
 Rigid Transformations and Congruence Lesson 1 The six frames show a shape's di erent positions. Describe how the shape moves to get from its position in each frame to the next. To get from Position 1 to
HOW TO. In this section, you will find. miscellaneous handouts that explain. HOW TO do various things.
 In this section, you will find miscellaneous handouts that explain do various things. 140 SAVING Introduction Every time you do something, you should save it on the DESKTOP. Click Save and then click on
Unit 7. Transformations
 Unit 7 Transformations 1 A transformation moves or changes a figure in some way to produce a new figure called an. Another name for the original figure is the. Recall that a translation moves every point