Working with Data in Windows and Descriptive Statistics
|
|
|
- Clifford Mitchell
- 5 years ago
- Views:
Transcription
1 Working with Data in Windows and Descriptive Statistics HRP223 Topic 2 October 3 rd, 2012 Copyright Leland Stanford Junior University. All rights reserved. Warning: This presentation is protected by copyright law and international treaties. Unauthorized reproduction of this presentation, or any portion of it, may result in severe civil and criminal penalties and will be prosecuted to maximum extent possible under the law.
2 In this lecture How SAS works in Windows SAS vs EG files Libraries vs. Folders Importing Data Subsets and creating new variables Describing Data Making better summary tables
3 Sources of Data Small data sets (aka Toy data) You may be able to type in the data directly into a SAS code file with EG like in The Little SAS Book for EG. Excel For small amounts of HIPAA safe data you can use Excel with validation. Text files with columns of numbers and text Exports created by databases frequently provide a text file full of data and a program for loading it into SAS (like REDCap). Data from the CDC Wonder database SAS Native SAS datasets created by somebody else.
4 Types of Files Suffix File Type.pdf Adobe portable document format.zip Archives full of compressed data.xls Excel prior to 2007.xlsx Excel 2007 and later.csv Comma separated values (text which Excel likes).txt Text files (letters number and punctuation without formats.sas SAS code files.egp Enterprise Guide projects.sas7bdat SAS data files.htm or.html Web pages.css Cascading style sheets for web pages
5 In this lecture How SAS works in Windows SAS vs EG files Libraries vs. Folders Importing Data Subsets and creating new variables Describing Data Making better summary tables


6 SAS and EG files.sas files are text files full of instructions that a programmer can easily write and/or edit..egp files are not.

7 What is an EGP file? EGP files are actually zip archives (with a.egp suffix instead of.zip) which contain XML text and other text files.
8 Searching Because the contents of.egp files are compressed, the built in Windows file finder will not be able to find files by searching for keywords inside the projects. This affects me when I can t remember the file name for a project and to find it I want to search for key words in the code (like the principal investigator s name or the name of the source data file).

9 Searching Inside.egp files File Locator Pro can search inside the egp files: Tools menu > Configuration Click here Add egp here. Without the.
10 Files in Enterprise Guide Alternatively, you can save SAS code files outside of the EG project. Most people create EG projects that reference data files that live outside of EG. SAS datasets Excel files Text files full of data Native Excel format Converted to SAS format
 SAS EG Saved")
11 How SAS EG works SAS Data (.xls,.sas7bdat, etc) SAS EG Saved output

12 Shortcuts Windows indicates a shortcut to a file that lives elsewhere with an arrow in the bottom left corner of an icon. EG uses the same symbol to denote a shortcut to a file outside of the project.
 contains information and instructions but it will also have links to a lot of external files.")
13 What is in an EGP file? An EG project file ( a file with an.egp suffix) contains information and instructions but it will also have links to a lot of external files. Shortcut to a file NOT in the project. This is part of the project Shortcut to a file NOT in the project.


14 EG and Code Most of the time you will point and click to build an analysis but you can write and store your code instructions to SAS inside of the EG project or you can create a short cut to the code file which lives outside of EG. Right click and choose New > Program Look at the process flow No shortcut icon


15 External SAS files You can easily save a code file outside of the project by choosing Save Program As from the File menu or clicking the Save or Save As from the program tab (when the code is open).
16 In this lecture How SAS works in Windows SAS vs EG files Libraries vs. Folders Importing Data Subsets and creating new variables Describing Data Making better summary tables
17 Where are SAS data sets Stored? While SAS can refer to files using their Windows path, it is easier to type a short name instead of a long path. SAS calls the short names libraries. EG automatically knows about a couple of places where data can be stored. It creates a temporary work folder whenever EG starts. It creates a permanent sasuser folder when EG is installed. The locations for data are called libraries.


18 Where are those folders? Look at the servers list and expand out the tree to show: Servers - Local - Libraries - WORK Right click on WORK and choose Properties. If the Server List display is not showing use view menu.
19 In this lecture How SAS works in Windows SAS vs EG files Libraries vs. Folders Importing Data Subsets and creating new variables Describing Data Making better summary tables


20 Importing the Easy Way The most bulletproof way for importing with EG 5.1 is to use the import wizard and save into the Work library.


21 Always check this on.


22 Double check that it guesses the right Type, especially for dates.


23 By default you don t see the library or path to the Excel file. Check this on
24 Libraries Prior to the version of EG that shipped with SAS 9.3, the default behavior was for EG to save all data into the same folder/library, sasuser. This is a very bad idea. Naïve students would end up with every SAS data set in one folder. Anybody using SAS can access that folder, so there are significant HIPAA issues. You can right click on a file and pick Properties to see where it is stored.


25 Change the Default File Location If you are working with an old SAS install, change the default file location to the work library. Do this once per machine.


26 Click 1st Click 2x
27 Permanent Store I suggest that you save your data into the temporary work library by default. If you have a huge file which you only want to import once, or if you want to keep a permanent copy of a SAS data file, you will want to set up a permanent library. A library reference is just a fancy way of specifying what folder SAS should use to save the.sas7bdat data files.
28 Fix the Registry (Once) then Make a Library First fix the problematic registry entries that are described in my instructions on installing SAS. If you do not do this, if you have mixtures of characters and number values in a column from Excel, programs reading the data (including SAS) can drop the cells that have character data without warning. Using Windows, make a folder c:\blah\librarydemo to hold the data set. Using SAS, make a library to point to the folder where your data should be stored.


29 Tell SAS that there is a folder which can hold data by creating a library. This only makes SAS aware of the folder. It does not automatically put stuff into the folder.

30 It s just a folder! When the library is created it is just a pointer to a preexisting folder. That folder can contain anything. When you want to use the folder you need to explicitly tell EG to store data in the folder. First rename your input the node and draw an arrow to indicate where the library is used. These changes are mostly just aesthetic.


31 2 nd add a line to the flowchart connecting the library to the import. It just looks good. 1 st rename the node to match the library name Now it looks good but the import is still into work.


32 Find your library here.


33 Notice it is in the library. You can see it in Windows. A design feature is that you have to Refresh the library to see the freshly added file.
34 In this lecture How SAS works in Windows SAS vs EG files Libraries vs. Folders Importing Data Subsets and creating new variables Describing Data Making better summary tables


35 Playing with Data Once the data is imported you can add code nodes to the flowchart or use the graphical user interface to tweak the data and do analyses. Quick and easy subset and sorting Complex changes Select all variables for the new dataset


36


37


38 Push Validate to see the SQL code. Notice the tabs in the output.

39 Notice Analysis.css hidden in the voodoo. It has the appearance scheme (color, bold, etc.)


40 Convert From a Character to a Number Remember that page I told you to bookmark in OnlineDoc? Hold the control key and type f to bring up the find box.

41


42 2 nd 3 rd Click New 4 th Click Advanced expression 5 th Click Next


43 Convert to a 4 digit number with the input function: input( t1.score, 4. )


44 Before After Context sensitive menus help you describe the data you are browsing.
45 In this lecture How SAS works in Windows SAS vs EG files Libraries vs. Folders Importing Data Subsets and creating new variables Describing Data Making better summary tables

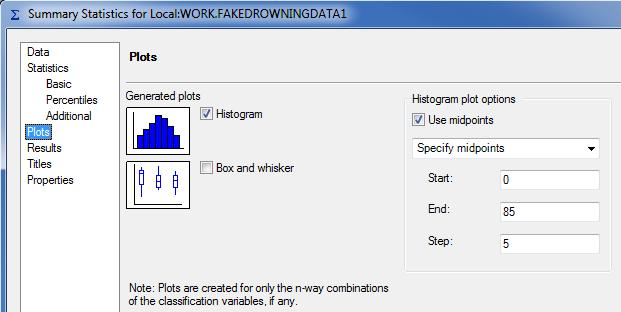
46 Descriptive Statistics


47

48 Turn on Higher Quality Graphics Tools > Options > Tasks > Custom Code

49

50


51 This is SAS code that can be cut and pasted into a.sas file and run outside of EG.
52
53

54 I like this color scheme.
55 Fixing the title is too advanced for now but it is trivial to cut it in Illustrator or to mask it in PowerPoint.

56 Clean the Project 1 st Right click and rename it. 2 nd Right click and rename. 3 rd Right click and link it to the code
57 In this lecture How SAS works in Windows SAS vs EG files Libraries vs. Folders Importing Data Subsets and creating new variables Describing Data Making better summary tables
58 Table 1 Table 1 in a manuscript describes data grouped by something, typically a treatment. Frequency count by gender Means for age
59 Drowning. is bad SCUBA divers practically never drown. Can I find any patterns in who dies? Load the fakedrowningdata Excel file. It is real data based on the CDC s mortality data from : wonder.cdc.gov/controller/datarequest/d53 The actual ages are sampled from the age bins the CDC gives and the SCUBA rate is simulated.
60 For each treatment table 1 always has For continuous data, a measure of central tendency and variability. Number of people Mean and standard deviation Median, min, max, 25 th and 75 th percentiles For categorical data Frequency counts, percentages
61 Too Many Nodes Continuous You can request lots of tables. Typically people do one node per variable.

62


63

64


65


66


67 .M (dot M)


68 Add agefixed
69 Now there is a useful dataset Now the analysis is running on the wrong data. Select the new input data and modify the node to run on the new variable.

70 The new variable The minimum is not -1. N is not the number of observations.

71 Notice the bug it lost the 5 year bins. Right click the node and reset it.
72
73 Categorical: several variables cross tabulated


74

75 Outcome Exposure Notice the table request


76 Typically I want row not column percentages. Watch the code change as you click.

77 Women don t drown while diving and there is no evidence of a SCUBA effect You can rinse and repeat building this table but then you need to copy and paste a LOT for your paper.


78 Bug with Reports If your table has missing data you may get an Unable to read SAS Report file error. Use the Tools > Options menu to turn on the procedure titles in the output.
79 Categorical and continuous pretty tables. I am going to want to count people. The easiest way to do this is to add a new column. Every person should have the value 1 then I can count or sum that variable. I am going to write a program to do this Add a programming node to the project by right clicking on the process flow and choosing new program.

80 Make a new dataset called analysisfinal Base the new dataset on everything in the analysis dataset. What library will the new dataset live in? Is the variable one character or numeric? Make a new variable call it one and have it contain the number one. Describe> Summary Tables Rename and link the program


81

82


83

84 Add Race then State.

85


86 This is too confusing with row and column percentages.

87


88


89


90


91 It is too advanced for now but you can do fancy formatting like using colors for big or impossible values/patterns. You can save this as HTML and open it in Excel to do final touches.
Barchard Introduction to SPSS Marks
 Barchard Introduction to SPSS 22.0 3 Marks Purpose The purpose of this assignment is to introduce you to SPSS, the most commonly used statistical package in the social sciences. You will create a new data
Instructions for Using the Databases
 Appendix D Instructions for Using the Databases Two sets of databases have been created for you if you choose to use the Documenting Our Work forms. One set is in Access and one set is in Excel. They are
The purpose of this tutorial is to introduce you to the Construct 2 program. First, you will be told where the software is located on the computer
 Learning Targets: Students will be introduced to industry recognized game development software Students will learn how to navigate within the software Students will learn the basics on how to use Construct
Digital Mapping with OziExplorer / ozitarget
 Going Digital 2 - Navigation with computers for the masses This is the 2nd instalment on using Ozi Explorer for digital mapping. This time around I am going to run through some of the most common questions
Using Microsoft Excel
 About Excel Using Microsoft Excel What is a Spreadsheet? Microsoft Excel is a program that s used for creating spreadsheets. So what is a spreadsheet? Before personal computers were common, spreadsheet
QUICK EXCEL TUTORIAL. The Very Basics
 QUICK EXCEL TUTORIAL The Very Basics You Are Here. Titles & Column Headers Merging Cells Text Alignment When we work on spread sheets we often need to have a title and/or header clearly visible. Merge
Introduction to Cascade Server (web content management system) Logging in to Cascade Server Remember me Messages Dashboard Home
 Logging in to Cascade Server Remember me Messages Dashboard Home") Introduction to Cascade Server (web content management system) Last Updated on Jul 14th, 2010 The College of Charleston's web site is being produced using a Content Management System (CMS) called Cascade
Introduction to Cascade Server (web content management system) Last Updated on Jul 14th, 2010 The College of Charleston's web site is being produced using a Content Management System (CMS) called Cascade
Configuring Microsoft Edge Browser By Tom Krauser
 Configuring Microsoft Edge Browser By Tom Krauser Browsers are the interface between the computer and internet. They provide the frame in which the website content is displayed. Having more than one browser
Barchard Introduction to SPSS Marks
 Barchard Introduction to SPSS 21.0 3 Marks Purpose The purpose of this assignment is to introduce you to SPSS, the most commonly used statistical package in the social sciences. You will create a new data
How To Use My Alternative High
 How To Use My Alternative High Preface Preface I put this together to address the issues and questions that come up all the time in class, especially for newer students. Preface I did this so that I could
TABLE OF CONTENTS. TECHNICAL SUPPORT APPENDIX Appendix A Formulas And Cell Links Appendix B Version 1.1 Formula Revisions...
 SPARC S INSTRUCTIONS For Version 1.1 UNITED STATES DEPARTMENT OF AGRICULTURE Forest Service By Todd Rivas December 29, 1999 TABLE OF CONTENTS WHAT IS SPARC S?... 1 Definition And History... 1 Features...
Biology 345: Biometry Fall 2005 SONOMA STATE UNIVERSITY Lab Exercise 2 Working with data in Excel and exporting to JMP Introduction
 Biology 345: Biometry Fall 2005 SONOMA STATE UNIVERSITY Lab Exercise 2 Working with data in Excel and exporting to JMP Introduction In this exercise, we will learn how to reorganize and reformat a data
Excel Basics Rice Digital Media Commons Guide Written for Microsoft Excel 2010 Windows Edition by Eric Miller
 Excel Basics Rice Digital Media Commons Guide Written for Microsoft Excel 2010 Windows Edition by Eric Miller Table of Contents Introduction!... 1 Part 1: Entering Data!... 2 1.a: Typing!... 2 1.b: Editing
Introduction to Microsoft Office 2007
 Introduction to Microsoft Office 2007 What s New follows: TABS Tabs denote general activity area. There are 7 basic tabs that run across the top. They include: Home, Insert, Page Layout, Review, and View
College of Pharmacy Windows 10
 College of Pharmacy Windows 10 Windows 10 is the version of Microsoft s flagship operating system that follows Windows 8; the OS was released in July 2015. Windows 10 is designed to address common criticisms
HOW TO EXPORT BUYER NAMES & ADDRESSES FROM PAYPAL TO A CSV FILE
 HOW TO EXPORT BUYER NAMES & ADDRESSES FROM PAYPAL TO A CSV FILE If your buyers use PayPal to pay for their purchases, you can quickly export all names and addresses to a type of spreadsheet known as a
MAKING TABLES WITH WORD BASIC INSTRUCTIONS. Setting the Page Orientation. Inserting the Basic Table. Daily Schedule
 MAKING TABLES WITH WORD BASIC INSTRUCTIONS Setting the Page Orientation Once in word, decide if you want your paper to print vertically (the normal way, called portrait) or horizontally (called landscape)
Windows Computer A to Z Shortcut Key list with PDF
 Windows Computer A to Z Shortcut Key list with PDF In the Computer world, a keyboard shortcut is a combination of one or more command to execute a particular action. These shortcuts are really helpful
[Type text] Windows Quick Start Guide Version 3.5
![[Type text] Windows Quick Start Guide Version 3.5](/thumbs/86/93850691.jpg "[Type text] Windows Quick Start Guide Version 3.5") [Type text] Windows Quick Start Guide Version 3.5 PRO-STUDY QUICK START GUIDE Contents The Pro-Study Toolbar... 2 Getting Started with a Project... 3 Selecting Different Projects... 4 Categories... 4 Collecting
[Type text] Windows Quick Start Guide Version 3.5 PRO-STUDY QUICK START GUIDE Contents The Pro-Study Toolbar... 2 Getting Started with a Project... 3 Selecting Different Projects... 4 Categories... 4 Collecting
Module 1: Introduction RStudio
 Module 1: Introduction RStudio Contents Page(s) Installing R and RStudio Software for Social Network Analysis 1-2 Introduction to R Language/ Syntax 3 Welcome to RStudio 4-14 A. The 4 Panes 5 B. Calculator
Intro to Excel. To start a new workbook, click on the Blank workbook icon in the middle of the screen.
 Excel is a spreadsheet application that allows for the storing, organizing and manipulation of data that is entered into it. Excel has variety of built in tools that allow users to perform both simple
Electronic Committees (ecommittees) Frequently Asked Questions v1.0
 Frequently Asked Questions v1.0") 3 Electronic Committees (ecommittees) Frequently Asked Questions v1.0 SABS 2012-12-06 Table of Contents 1 Contents 1 Login and access... 3 1.1 How to access the ecommittee workspace... 3 1.1.1 Via the
3 Electronic Committees (ecommittees) Frequently Asked Questions v1.0 SABS 2012-12-06 Table of Contents 1 Contents 1 Login and access... 3 1.1 How to access the ecommittee workspace... 3 1.1.1 Via the
Using Microsoft Excel
 Using Microsoft Excel Introduction This handout briefly outlines most of the basic uses and functions of Excel that we will be using in this course. Although Excel may be used for performing statistical
Become strong in Excel (2.0) - 5 Tips To Rock A Spreadsheet!
 - 5 Tips To Rock A Spreadsheet!") Become strong in Excel (2.0) - 5 Tips To Rock A Spreadsheet! Hi folks! Before beginning the article, I just wanted to thank Brian Allan for starting an interesting discussion on what Strong at Excel means
Become strong in Excel (2.0) - 5 Tips To Rock A Spreadsheet! Hi folks! Before beginning the article, I just wanted to thank Brian Allan for starting an interesting discussion on what Strong at Excel means
General Guidelines: SAS Analyst
 General Guidelines: SAS Analyst The Analyst application is a data analysis tool in SAS for Windows (version 7 and later) that provides easy access to basic statistical analyses using a point-and-click
1 Welcome to Microsoft Excel 2007
 1 Welcome to Microsoft Excel 2007 The Excel Window With Office 2007, Microsoft has abandoned the interface consisting of a menu and a collection of toolbars so common in all Windows applications until
The first thing we ll need is some numbers. I m going to use the set of times and drug concentration levels in a patient s bloodstream given below.
 Graphing in Excel featuring Excel 2007 1 A spreadsheet can be a powerful tool for analyzing and graphing data, but it works completely differently from the graphing calculator that you re used to. If you
GIS LAB 1. Basic GIS Operations with ArcGIS. Calculating Stream Lengths and Watershed Areas.
 GIS LAB 1 Basic GIS Operations with ArcGIS. Calculating Stream Lengths and Watershed Areas. ArcGIS offers some advantages for novice users. The graphical user interface is similar to many Windows packages
Lab 7 Macros, Modules, Data Access Pages and Internet Summary Macros: How to Create and Run Modules vs. Macros 1. Jumping to Internet
 Lab 7 Macros, Modules, Data Access Pages and Internet Summary Macros: How to Create and Run Modules vs. Macros 1. Jumping to Internet 1. Macros 1.1 What is a macro? A macro is a set of one or more actions
Instructions for Using the Databases
 Appendix D Instructions for Using the Databases Two sets of databases have been created for you if you choose to use the Documenting Our Work forms. One set is in Access and one set is in Excel. They are
Chapter 11 Dealing With Data SPSS Tutorial
 Chapter 11 Dealing With Data SPSS Tutorial 1. Visit the student website at for this textbook at www.clowjames.net/students. 2. Download the following files: Chapter 11 Dealing with Data (SPSS data file)
Statistics with a Hemacytometer
 Statistics with a Hemacytometer Overview This exercise incorporates several different statistical analyses. Data gathered from cell counts with a hemacytometer is used to explore frequency distributions
Data Cleaning: Student Workbook
 2016 Data Cleaning: Student Workbook Created by: EVA CONSTANTARAS / Independent Consultant & Data Scientist WITH SUPPORT FROM THE WORLD BANK AND THE UK DEPARTMENT FOR INTERNATIONAL DEVELOPMENT (DFID) Lab
Document Imaging User Guide
 Release 4.9 IMAGING TECHNOLOGY GROUP Document Imaging Systems Document Imaging User Guide IMAGING TECHNOLOGY GROUP IMIGIT tm Document Imaging User Guide Release 4.91 March 2007 Imaging Technology Group
Introduction to Excel
 Introduction to Excel Written by Jon Agnone Center for Social Science Computation & Research 145 Savery Hall University of Washington Seattle WA 98195 U.S.A. (206)543-8110 November 2004 http://julius.csscr.washington.edu/pdf/excel.pdf
BIOSTATISTICS LABORATORY PART 1: INTRODUCTION TO DATA ANALYIS WITH STATA: EXPLORING AND SUMMARIZING DATA
 BIOSTATISTICS LABORATORY PART 1: INTRODUCTION TO DATA ANALYIS WITH STATA: EXPLORING AND SUMMARIZING DATA Learning objectives: Getting data ready for analysis: 1) Learn several methods of exploring the
Instructions on Adding Zeros to the Comtrade Data
 Instructions on Adding Zeros to the Comtrade Data Required: An excel spreadshheet with the commodity codes for all products you want included. In this exercise we will want all 4-digit SITC Revision 2
For many people, learning any new computer software can be an anxietyproducing
 1 Getting to Know Stata 12 For many people, learning any new computer software can be an anxietyproducing task. When that computer program involves statistics, the stress level generally increases exponentially.
Office 2016 Excel Basics 25 Video/Class Project #37 Excel Basics 25: Power Query (Get & Transform Data) to Convert Bad Data into Proper Data Set
 to Convert Bad Data into Proper Data Set") Office 2016 Excel Basics 25 Video/Class Project #37 Excel Basics 25: Power Query (Get & Transform Data) to Convert Bad Data into Proper Data Set Goal in video # 25: Learn about how to use the Get & Transform
Office 2016 Excel Basics 25 Video/Class Project #37 Excel Basics 25: Power Query (Get & Transform Data) to Convert Bad Data into Proper Data Set Goal in video # 25: Learn about how to use the Get & Transform
Department of Instructional Technology & Media Services Blackboard Grade Book
 Department of Instructional Technology & Media Services Blackboard Grade Book In your control panel, go to Assessment and grade center. Creating a Test In the Assessment section of the Control Panel, click
Excel 2013 Beyond TheBasics
 Excel 2013 Beyond TheBasics INSTRUCTOR: IGNACIO DURAN Excel 2013 Beyond The Basics This is a class for beginning computer users. You are only expected to know how to use the mouse and keyboard, open a
1 Introduction to Using Excel Spreadsheets
 Survey of Math: Excel Spreadsheet Guide (for Excel 2007) Page 1 of 6 1 Introduction to Using Excel Spreadsheets This section of the guide is based on the file (a faux grade sheet created for messing with)
1.a) Go to it should be accessible in all browsers
 Go to it should be accessible in all browsers") ECO 445: International Trade Professor Jack Rossbach Instructions on doing the Least Traded Product Exercise with Excel Step 1 Download Data from Comtrade [This step is done for you] 1.a) Go to http://comtrade.un.org/db/dqquickquery.aspx
ECO 445: International Trade Professor Jack Rossbach Instructions on doing the Least Traded Product Exercise with Excel Step 1 Download Data from Comtrade [This step is done for you] 1.a) Go to http://comtrade.un.org/db/dqquickquery.aspx
Introduction to SPSS on the Macintosh. Scott Patterson,Ph.D. Broadcast and Electronic Communication Arts San Francisco State University.
 Introduction to SPSS on the Macintosh. Scott Patterson,Ph.D. Broadcast and Electronic Communication Arts San Francisco State University Spring 2000 This is a brief guide to using SPSS in the Macintosh
Chapter 5 Making Life Easier with Templates and Styles
 Chapter 5: Making Life Easier with Templates and Styles 53 Chapter 5 Making Life Easier with Templates and Styles For most users, uniformity within and across documents is important. OpenOffice.org supports
Title of Resource Introduction to SPSS 22.0: Assignment and Grading Rubric Kimberly A. Barchard. Author(s)
") Title of Resource Introduction to SPSS 22.0: Assignment and Grading Rubric Kimberly A. Barchard Author(s) Leiszle Lapping-Carr Institution University of Nevada, Las Vegas Students learn the basics of SPSS,
Title of Resource Introduction to SPSS 22.0: Assignment and Grading Rubric Kimberly A. Barchard Author(s) Leiszle Lapping-Carr Institution University of Nevada, Las Vegas Students learn the basics of SPSS,
Let s Make a Front Panel using FrontCAD
 Let s Make a Front Panel using FrontCAD By Jim Patchell FrontCad is meant to be a simple, easy to use CAD program for creating front panel designs and artwork. It is a free, open source program, with the
Mac: Beyond Basics. Window 2 (Microsoft Word) Window 1 (folder contents)
 Window 1 (folder contents)") Mac: Beyond Basics Working with windows When you open a file or application, you will see a window. This window is your working area. It is possible to have many windows open at the same time. This allows
Mac: Beyond Basics Working with windows When you open a file or application, you will see a window. This window is your working area. It is possible to have many windows open at the same time. This allows
Simply Accounting Intelligence Tips and Tricks Booklet Vol. 1
 Simply Accounting Intelligence Tips and Tricks Booklet Vol. 1 1 Contents Accessing the SAI reports... 3 Copying, Pasting and Renaming Reports... 4 Creating and linking a report... 6 Auto e-mailing reports...
Bridge Program Computer Skills Self-Inventory
 Name Date Bridge Program Computer Skills Self-Inventory This inventory is a lengthy but non-comprehensive list of beginning, intermediate and advanced computer skills a typical college graduate would have.
Producing Summary Tables in SAS Enterprise Guide
 Producing Summary Tables in SAS Enterprise Guide Lora D. Delwiche, University of California, Davis, CA Susan J. Slaughter, Avocet Solutions, Davis, CA ABSTRACT This paper shows, step-by-step, how to use
EXCEL BASICS: MICROSOFT OFFICE 2010
 EXCEL BASICS: MICROSOFT OFFICE 2010 GETTING STARTED PAGE 02 Prerequisites What You Will Learn USING MICROSOFT EXCEL PAGE 03 Opening Microsoft Excel Microsoft Excel Features Keyboard Review Pointer Shapes
Introduction to Access 97/2000
 Introduction to Access 97/2000 PowerPoint Presentation Notes Slide 1 Introduction to Databases (Title Slide) Slide 2 Workshop Ground Rules Slide 3 Objectives Here are our objectives for the day. By the
Introduction to SPSS
 Introduction to SPSS Purpose The purpose of this assignment is to introduce you to SPSS, the most commonly used statistical package in the social sciences. You will create a new data file and calculate
Basic Microsoft Excel 2007
 Basic Microsoft Excel 2007 Contents Starting Excel... 2 Excel Window Properties... 2 The Ribbon... 3 Tabs... 3 Contextual Tabs... 3 Dialog Box Launchers... 4 Galleries... 5 Minimizing the Ribbon... 5 The
Lesson 4: Introduction to the Excel Spreadsheet 121
 Lesson 4: Introduction to the Excel Spreadsheet 121 In the Window options section, put a check mark in the box next to Formulas, and click OK This will display all the formulas in your spreadsheet. Excel
Frances Provan i #)# #%'
# #%'") !"#$%&#& Frances Provan i ##+), &'!#( $& #)# *% #%' & SPSS Versions... 2 Some slide shorthand... 2 Did you know you could... 2 Nice newish graphs... 2 Population Pyramids... 2 Population Pyramids: categories...
!"#$%&#& Frances Provan i ##+), &'!#( $& #)# *% #%' & SPSS Versions... 2 Some slide shorthand... 2 Did you know you could... 2 Nice newish graphs... 2 Population Pyramids... 2 Population Pyramids: categories...
Creating a new form with check boxes, drop-down list boxes, and text box fill-ins. Customizing each of the three form fields.
 In This Chapter Creating a new form with check boxes, drop-down list boxes, and text box fill-ins. Customizing each of the three form fields. Adding help text to any field to assist users as they fill
Book IX. Developing Applications Rapidly
 Book IX Developing Applications Rapidly Contents at a Glance Chapter 1: Building Master and Detail Pages Chapter 2: Creating Search and Results Pages Chapter 3: Building Record Insert Pages Chapter 4:
To Plot a Graph in Origin. Example: Number of Counts from a Geiger- Müller Tube as a Function of Supply Voltage
 To Plot a Graph in Origin Example: Number of Counts from a Geiger- Müller Tube as a Function of Supply Voltage 1 Digression on Error Bars What entity do you use for the magnitude of the error bars? Standard
Microsoft Excel 2007
 Learning computers is Show ezy Microsoft Excel 2007 301 Excel screen, toolbars, views, sheets, and uses for Excel 2005-8 Steve Slisar 2005-8 COPYRIGHT: The copyright for this publication is owned by Steve
FRONTPAGE STEP BY STEP GUIDE
 IGCSE ICT SECTION 15 WEB AUTHORING FRONTPAGE STEP BY STEP GUIDE Mark Nicholls ICT lounge P a g e 1 Contents Introduction to this unit.... Page 4 How to open FrontPage..... Page 4 The FrontPage Menu Bar...Page
What is an Operating System?
 What is an Operating System? Hi! I m Sarah, and I m here to tell you about a computer s operating system and guide you through navigating a computer. We ll follow along with Jane. Jane wants to use the
You might think of Windows XP as a set of cool accessories, such as
 Controlling Applications under Windows You might think of Windows XP as a set of cool accessories, such as games, a calculator, and an address book, but Windows is first and foremost an operating system.
Using Respondus with D2L
 Using Respondus with D2L What does Respondus do? Respondus s greatest strength is importing tests into D2L. These tests can come from textbook publishers or Word documents, or they can be created directly
Excel Select a template category in the Office.com Templates section. 5. Click the Download button.
 Microsoft QUICK Excel 2010 Source Getting Started The Excel Window u v w z Creating a New Blank Workbook 2. Select New in the left pane. 3. Select the Blank workbook template in the Available Templates
CCRS Quick Start Guide for Program Administrators. September Bank Handlowy w Warszawie S.A.
 CCRS Quick Start Guide for Program Administrators September 2017 www.citihandlowy.pl Bank Handlowy w Warszawie S.A. CitiManager Quick Start Guide for Program Administrators Table of Contents Table of Contents
Microsoft Excel Level 2
 Microsoft Excel Level 2 Table of Contents Chapter 1 Working with Excel Templates... 5 What is a Template?... 5 I. Opening a Template... 5 II. Using a Template... 5 III. Creating a Template... 6 Chapter
Data. Selecting Data. Sorting Data
 1 of 1 Data Selecting Data To select a large range of cells: Click on the first cell in the area you want to select Scroll down to the last cell and hold down the Shift key while you click on it. This
RiskyProject Enterprise 7
 RiskyProject Enterprise 7 Project Risk Management Software RiskyProject Enterprise User Guide Intaver Institute Inc. www.intaver.com email: info@intaver.com COPYRIGHT Copyright 2017 Intaver Institute.
Excel VBA. Microsoft Excel is an extremely powerful tool that you can use to manipulate, analyze, and present data.
 Excel VBA WHAT IS VBA AND WHY WE USE IT Microsoft Excel is an extremely powerful tool that you can use to manipulate, analyze, and present data. Sometimes though, despite the rich set of features in the
The toolbars at the top are the standard toolbar and the formatting toolbar.
 Lecture 8 EXCEL Excel is a spreadsheet (all originally developed for bookkeeping and accounting). It is very useful for any mathematical or tabular operations. It allows you to make quick changes in input
Adobe Dreamweaver CS5 Tutorial
 Adobe Dreamweaver CS5 Tutorial GETTING STARTED This tutorial focuses on the basic steps involved in creating an attractive, functional website. In using this tutorial you will learn to design a site layout,
SharePoint: Fundamentals
 SharePoint: Fundamentals This class will introduce you to SharePoint and cover components available to end users in a typical SharePoint site. To access SharePoint, you will need to log into Office 365.
Depending on the computer you find yourself in front of, here s what you ll need to do to open SPSS.
 1 SPSS 11.5 for Windows Introductory Assignment Material covered: Opening an existing SPSS data file, creating new data files, generating frequency distributions and descriptive statistics, obtaining printouts
Intro To Excel Spreadsheet for use in Introductory Sciences
 INTRO TO EXCEL SPREADSHEET (World Population) Objectives: Become familiar with the Excel spreadsheet environment. (Parts 1-5) Learn to create and save a worksheet. (Part 1) Perform simple calculations,
Lab #1: Introduction to Basic SAS Operations
 Lab #1: Introduction to Basic SAS Operations Getting Started: OVERVIEW OF SAS (access lab pages at http://www.stat.lsu.edu/exstlab/) There are several ways to open the SAS program. You may have a SAS icon
Microsoft Excel 2007
 Microsoft Excel 2007 Objective To provide a review of the new features in the Microsoft Excel 2007 screen. Overview Introduction Office Button Quick Access Toolbar Tabs Scroll Bar Status Bar Clipboard
FROM 4D WRITE TO 4D WRITE PRO INTRODUCTION. Presented by: Achim W. Peschke
 4 D S U M M I T 2 0 1 8 FROM 4D WRITE TO 4D WRITE PRO Presented by: Achim W. Peschke INTRODUCTION In this session we will talk to you about the new 4D Write Pro. I think in between everyone knows what
LEIAG-Excel Workshop
 Random Sample Excel has a simple formula we can utilize to obtain a random sample (cases, citations, city, etc.) At the Sheriff s Department, we are able to run a case management report that generates
Minerva. Quick Start Guide
 Minerva Quick Start Guide Welcome to IRR s new Minerva reporting system! Powered by SAS Visual Analytics, this tool is pretty user-friendly, but there are some basic orientation tips we d like to walk
Excel 2016 for Mac Financial Analysis with Microsoft Excel, 8 th Edition Mac User Guide
 Excel 2016 for Mac Financial Analysis with Microsoft Excel, 8 th Edition Mac User Guide Unfortunately, Mac users of Microsoft Office don t have 100% compatibility with the Windows version. However, the
Light Speed with Excel
 Work @ Light Speed with Excel 2018 Excel University, Inc. All Rights Reserved. http://beacon.by/magazine/v4/94012/pdf?type=print 1/64 Table of Contents Cover Table of Contents PivotTable from Many CSV
MI Pro Research Studio 6
 MI Pro Research Studio 6 Quick start Guide A simple guide for new users showing the most relevant features of Research Studio 6 Page 1 Table of contents Chapter Page Get started 3 Create a new project
WINDOWS 8.X SIG SEPTEMBER 22, 2014
 New Start Screen: Top RIGHT corner next to your Sign in Name is the OFF button. To the Right of Off button is a Search icon You can click on Search icon OR just start typing anywhere in open area of Start
Using Mail Merge in Microsoft Word 2003
 Using Mail Merge in Microsoft Word 2003 Mail Merge Created: 12 April 2005 Note: You should be competent in Microsoft Word before you attempt this Tutorial. Open Microsoft Word 2003 Beginning the Merge
IN THIS CLASS WE ARE GOING TO LEARN THE BASIC FEATURES OF WINDOWS 8.1 WITH HANDS ON TRAINING THE CLASS WILL RUN ON THE SPEED OF THE AVERAGE STUDENT
 1 IN THIS CLASS WE ARE GOING TO LEARN THE BASIC FEATURES OF WINDOWS 8.1 WITH HANDS ON TRAINING EACH CLASS WILL RUN APPROXIMATELY 40 MINUTES WE WILL PICK UP WHERE WE LEFT OFF AT THE NEXT CLASS THE CLASS
BeAware Corporate Edition Admin Console Version 6.8 Ascentive LLC
 User Manual BeAware Corporate Edition Admin Console Version 6.8 Ascentive LLC User Manual 1 Copyright Notice Copyright 2006 Ascentive LLC All Rights Reserved This document is protected by copyright law
GETTING STARTED. A Step-by-Step Guide to Using MarketSight
 GETTING STARTED A Step-by-Step Guide to Using MarketSight Analyze any dataset Run crosstabs Test statistical significance Create charts and dashboards Share results online Introduction MarketSight is a
MAPLOGIC CORPORATION. GIS Software Solutions. Getting Started. With MapLogic Layout Manager
 MAPLOGIC CORPORATION GIS Software Solutions Getting Started With MapLogic Layout Manager Getting Started with MapLogic Layout Manager 2011 MapLogic Corporation All Rights Reserved 330 West Canton Ave.,
MANAGING SHOW DATA This document introduces a method using Microsoft Excel and Microsoft Word to manage show data, including:
 MANAGING SHOW DATA This document introduces a method using Microsoft Excel and Microsoft Word to manage show data, including: TOPIC PAGE FADS Online Entries Record Entry Data 3 Scheduling (includes calculating
Survey of Math: Excel Spreadsheet Guide (for Excel 2016) Page 1 of 9
 Page 1 of 9") Survey of Math: Excel Spreadsheet Guide (for Excel 2016) Page 1 of 9 Contents 1 Introduction to Using Excel Spreadsheets 2 1.1 A Serious Note About Data Security.................................... 2 1.2
Survey of Math: Excel Spreadsheet Guide (for Excel 2016) Page 1 of 9 Contents 1 Introduction to Using Excel Spreadsheets 2 1.1 A Serious Note About Data Security.................................... 2 1.2
Style Report Enterprise Edition
 INTRODUCTION Style Report Enterprise Edition Welcome to Style Report Enterprise Edition! Style Report is a report design and interactive analysis package that allows you to explore, analyze, monitor, report,
Chapter One: Getting Started With IBM SPSS for Windows
 Chapter One: Getting Started With IBM SPSS for Windows Using Windows The Windows start-up screen should look something like Figure 1-1. Several standard desktop icons will always appear on start up. Note
Excel 2007/2010. Don t be afraid of PivotTables. Prepared by: Tina Purtee Information Technology (818)
") Information Technology MS Office 2007/10 Users Guide Excel 2007/2010 Don t be afraid of PivotTables Prepared by: Tina Purtee Information Technology (818) 677-2090 tpurtee@csun.edu [ DON T BE AFRAID OF
Information Technology MS Office 2007/10 Users Guide Excel 2007/2010 Don t be afraid of PivotTables Prepared by: Tina Purtee Information Technology (818) 677-2090 tpurtee@csun.edu [ DON T BE AFRAID OF
Adobe Dreamweaver CS3 English 510 Fall 2007
 Adobe Dreamweaver CS3 English 510 Fall 2007 Important: Before going through this handout, you should create a WWW directory on your ISU e-mail account. Otherwise, you will not be able to upload and view
Introduction to Adobe Acrobat X. Ken Dickinson Bay Area Computer Training
 Introduction to Adobe Acrobat X Ken Dickinson Bay Area Computer Training www.bactrain.com Table of Contents What s the best way to create a PDF?... 3 Convert Microsoft Word, PowerPoint, and Excel files
GSAK (Geocaching Swiss Army Knife) GEOCACHING SOFTWARE ADVANCED KLASS GSAK by C3GPS & Major134
 GEOCACHING SOFTWARE ADVANCED KLASS GSAK by C3GPS & Major134") GSAK (Geocaching Swiss Army Knife) GEOCACHING SOFTWARE ADVANCED KLASS GSAK - 102 by C3GPS & Major134 Table of Contents About this Document... iii Class Materials... iv 1.0 Locations...1 1.1 Adding Locations...
GSAK (Geocaching Swiss Army Knife) GEOCACHING SOFTWARE ADVANCED KLASS GSAK - 102 by C3GPS & Major134 Table of Contents About this Document... iii Class Materials... iv 1.0 Locations...1 1.1 Adding Locations...
[Type text] Quick Start Guide Version 3
![[Type text] Quick Start Guide Version 3](/thumbs/84/89525491.jpg "[Type text] Quick Start Guide Version 3") [Type text] Quick Start Guide Version 3 PRO-STUDY QUICK START GUIDE Contents The Pro-Study Toolbar... 2 Getting Started with a Project... 3 Selecting Different Projects... 4 Categories... 4 Collecting
[Type text] Quick Start Guide Version 3 PRO-STUDY QUICK START GUIDE Contents The Pro-Study Toolbar... 2 Getting Started with a Project... 3 Selecting Different Projects... 4 Categories... 4 Collecting
Computer Literacy Guide. for use in a Family Literacy Center
 Computer Literacy Guide for use in a Family Literacy Center ISBN: 1-931507-94-5 2003 FAMILY LITERACY CENTERS, INC. All rights reserved. No part of this book may be reproduced or used in any form, including