Model S665. Sound Level Analyzer. Users Manual
|
|
|
- Derrick Shelton
- 5 years ago
- Views:
Transcription


1 Model S665 Sound Level Analyzer Users Manual
2 May All rights reserved. Specifications are subject to change without notice. All product names are trademarks of their respective companies.
3 Introduction Safety Precautions...1 Product Contents and Inspection...2 Instrument Controls Microphone Input Interface Output interface ON / Off / Display Contrast Range Setup Software Operation Parameter Setting Operating Instructions Overview...8 Operation Interface...8 Measurement Name Listing...9 Measurement Name Input...10 Integrated Measuring Time Setting...11 Operation Of Statistical Analysis Function List interface...12 Entering Name...13 Changing Date...13 Starting the Measurement...13 Graph Interface H Measurement List Interface...16 Graph Interface...18 Integrated Measurement /1 oct and 1/3 oct Analysis Operation...22 Low Frequency Noise Measurement...23 List Interface:...23 Graph Interface...26 Total Interface...27 Recording User Test Parameters i
4 Data Management Overview...29 Data Recall...29 Data Transferred to Flash Disk...30 OCT Analysis Result Recall...31 Total Analysis Result Recall...32 Statistical Analysis Result Recall H Measured Result Recall...34 Integrated Measuring Result Recall /3 OCT Analysis Result Recall...36 Computer Software Instructions Overview...37 Functions...37 Software Installation...38 Software Operation Instruction...38 Acoustical Calibration with CAL Direct Input Sensitivity...42 View Calibration Record...43 Maintenance General Information...43 Battery Replacement...43 Cleaning...44 End of Life...44 Specifications Optional Accessories...47 Service Warranty...47 Non-Warranty Service...48 Appendices Appendix 1: Frequency weighting characteristics...49 Appendix 2: 1/3 OCT filter characteristics...50 Appendix 3: A, C frequency weighting...52 Appendix 3: A, C frequency weighting...53 Appendix 4: 4 Hz digital high-pass filter characteristics...54 ii
5 Introduction Model S665 is a Class 1 Integrating Sound Analyzer. A handheld real-time analyzer that performs integrated measurement and statistical analysis on noise or other electrical signals. Additionally it includes their frequency spectrum and amplitude, 1/1 OTC and 1/3 OTC value through digital signal processing technology. This analyzer can be widely used in various fields such as environmental protection, labor hygiene, research and teaching, industrial enterprise, noise measuring and testing etc. It can perform environmental noise measurement, machinery noise analysis, sound power level measurement, building acoustics and aircraft noise measurement. Safety Precautions When taking measurements: Avoid taking measurements in hot, humid or wet places - be sure the temperature and humidity is within the limits indicated in the Technical Specification section of this manual. Avoid making measurements in the presence of explosive gas, combustible gas, steam or excessive dust. The following symbols are used: Caution: refer to the instruction manual; improper usage may damage the analyzer or its components Meter is in compliance to the CE mark standards Note: Read the recommendation which follows this symbol and the instructions in this manual: CAUTION If the user does not observe this warning and/or operation instruction, it is possible to either damage the instrument components or the user. Do not operate the instrument in a hot temperature or humid environment outside its specifications. Refer to Technical Specification page. Wind blowing across the microphone can potentially add extraneous noise to a measurement. Position the provided windscreen on the microphone to prevent undesirable signals. Keep the microphone dry and avoid severe vibration. Page 1
6 Product Contents and Inspection This instrument has been checked both mechanically and electrically prior to shipment. Confirm the instrument is undamaged. If damage is suspected, submit a claim to the distributor immediately. Check the packaged contents according to this list: Model S665 Sound Level Analyzer User s manual Mini USB cable AC to DC Power Adaptor: 100V ~ 240V AC to DC 5V/1A Deluxe Aluminum carrying case. 4 batteries 1.5 V LR6 AA AM3 MN mm diameter windscreen Flash disk, 2 Gb Page 2


7 Instrument Controls 1. Microphone 1A. Preamplifier 2. Turn on the analyzer or reset the analyzer 3. Turn off the analyzer 4. Delete the information stored in the analyzer 5. Press the this button once to turn on the LCD backlight. The LCD backlight automatically turns off after 15 seconds. 6. Liquid Crystal Display 7. Enter the next menu or confirm the current input 8. Exit to the upper menu from the current interface 9. Output stops current measurements 10. Start or pause the integrated measurement 11. : Increase the parameter where the cursor is located by 1. Press it to increase the parameter upwards continually 12. Decrease the parameter where the cursor is located by 1. Press it to decrease the parameter downwards continually 13. Move the cursor to the right. Press it to move the cursor right continually 14. Move the cursor to the left. Press it to move the cursor left continually 15. Enter the parameter setup interface Page 3

8 Microphone Input Interface The input uses an X9-6Z signal input receptacle. The receptacle pins are arranged as shown below. The pins have the following functions: Pin 1 Power supply Pin 2 Null Pin 3 Signal input Pin 4 Null Pin 5 Signal ground Pin 6 Null On the input receptacle, pin 1 is the power supply pin that the analyzer uses to transmit power to the sensor (36 V, 2 ma max.). Inside this power supply, a 2 kω current limiting resistor is connected in series. The signal input pin receives the input electrical signal, in which a DC isolated capacitor is connected (Maximum input voltage: 10 V (RMS), input impedance: 150 kω, input capacitor: 100 pf). Two optional extension cables are available to place the microphone away from the unit: up to 5m (15 ft) Model MC15 or up to 20m (60 ft) Model MC60. Output interface The bottom of the S665 has three signal output receptacles. The left one is AC output receptacle. This receptacle is a stereo output. When it is matched with the plug, the plug s pins are defined as shown: Signal Fig. 1 Ground Fig. 2 Output Receptacle 3.5mm Output Plug The AC output is proportional to the input signal. The proportion between the output and the input is related to the analyzer s range controller. When the range controller is in -10 db shift (namely the maximum measuring range shift), the AC output is times of the input signal. The AC output signal s output impedance Page 4
9 is 1 kω. It is recommended that the connected load resistor be higher than 100 kω and the connected load capacitor be lower than 200 pf. Range Gain Output /Input (Gain) Range Display -10dB ~140 0dB 1 40~130 10dB ~120 20dB 10 20~110 30dB ~100 40dB 100 0~90 The RS 232 interface which can be connected to a PC to transfer the measuring results and real-time analysis results. Optional RS 232 cable is available, Model RSCBL3. The USB output receptacle uses a Mini B type output receptacle that complies with USB1.1and USB2.0 standards. The data is transferred in a full speed manner. It supports USB-host and USB-Device/Slave devices. The analyzer can connect to computers or Flash disks V 2. D- 3. D+ 4. 5VCC 5. GND ON / Off / Display Contrast Press the ON key on the front of the analyzer for 1 second or longer for the screen to display the list of three installed software programs: Statistical Analyzer, 1/1 OCT Analyzer and 1/3 OCT Analyzer. The cursor stays on the name of the software which was used last time. Press the and keys to move the cursor to select a different program. Press ENTER key to choose the desired software. For each particular software operation, see the corresponding instructions. If no key is pressed within 5 seconds, the system will automatically enter the software where the cursor is located. Or select the appropriate software, and enter the interface with the ENTER key. Page 5
10 Press the and keys, to change the screen s contrast. Press the key to turn off the analyzer. When the power is turned off, the clock inside the analyzer still works by the backup battery. The backup battery is a rechargeable battery, which is recharged when the analyzer is in working status. It is fully recharged within 24 hours. The fully recharged batteries can make the analyzer s clock run for at least 3 months. The measurement results are stored in the Flash memory. No external power supply is required; the data will be stored. Range Setup Model S665 Sound Analyzer Meter has a level Dynamic / Linearity Range of 90 db. When measuring noise in a common environment, the range is not changed. However, it is possible the range will need to be selected. The measuring upper and lower limits of each shift range are related to the microphone s sensitivity. When the microphone sensitivity level is 26 db, the range displays R: db, meaning the measuring upper limit is 130 db and the measuring lower limit is 40 db for a 1 khz sine wave signal. When the measured signal is not sine wave, the measuring upper limit becomes lower due to the peak factor influence. The overload indication is to affirm the measuring signal s peak. Set the range at the location where the overload indicator is not lit in the measuring process. When adjusting the range, move the cursor to the range display location. Press the and keys to change the range. Software Operation Press key for 1 second, the LCD will display the list of software which is installed in the analyzer. Press the and keys to move the cursor to Stat. Analyzer. The cursor will stay on the software which was used last time. Press ENTER key to go to the Stat Analyzer main menu. Page 6

11 The icon where the cursor is located becomes highlighted. Press the and keys to move the cursor. Press the key or do not press any key within 5 seconds to go to the corresponding submenu automatically. The main menu has 6 icons (submenus), including: Statistic: The integrated measurement of A sound level, the statistical analysis of F time weighting A sound level. 24Hours: 24Hours automatic measurement. Integral: The simultaneous integrated measurement of sound pressure level of three frequency weighting modes and three time weighting modes. Data: View the saved measuring results in the analyzer. Setup: Set up the parameters i.e. measurement name, measuring time etc. Calibrate: Calibrate the microphone s sensitivity level with an optional sound level calibrator ( Model CAL601). The number after the icon :XXX on the top right corner of the display indicates the quantity number of the data that can still be saved. Page 7
12 Parameter Setting Operating Instructions Overview Before starting a test, set up the parameters i.e.: measurement name and measurement time etc. Enter the parameter setup interface from the main menu or by pressing the key in the measuring interface mode. The analyzer will save the setting parameters automatically when it is turned off, and import them automatically when it is turned on next time. CAUTION When the measurement is running, it is not possible to enter parameter setup. Operation Interface After entering the Parameter Setup sub-menu, the screen below will appear: At the top of the screen, it displays the battery voltage and back-up battery voltage separately. The value is calculated in Volts with two decimal digits. In case that the voltage is over 10 V, the screen will display Over. Line 1. is the measurement name. The measured results will be saved with this measurement 1 behind the measurement name indicates that the position of this measurement name in the prestored listings of all measurement names is 1. Move the cursor to 1, and press the and keys to select the previous or next prestored measurement names. Line 2. is the measurement name choice. Auto means the measurement name can be generated automatically. After completing one integrated measurement, the measurement name will automatically change to the next one in the next integral measurement. Move the cursor to 2, and press the and Page 8
13 keys to switch to the manual mode. After switching to Manual mode, the measurement name will not change automatically. Line 3. Setup Before Start: When the screen indiates No, this means the integrated measurement can be started by pressing start-up key. Press either the and keys to change from No to Yes. First enter parameter setup by pressing the key, and set the measurement name and integrated measuring time etc. Then press the key to start measuring. In this way, individual measurements are clearly known by the measurement name and integrated measuring time of each measurement. CAUTION This function does not work in the 24H measurement mode. Line 4. indicates that the integrated measurement will begin after delay time set once the the start-up pushbutton is pressed. The delay time is shown. Move the cursor to 4, and use the and keys to adjust the delay time within the range of 0 to 10 seconds. 0 means no delay time with 10 being 10 second delay. Note: This function does not work in the 24H measurement mode. Line 5. This line indicates if the contents shown on the LCD display can be printed with an optional micro printer when pressing the key. Press On to print or press Off to turn off this feature. Micro printer currently not available for Model S665. Line 6 shows the setting of measurement time. Set the desired measurement time from 1 s to 24 h. The analyzer will save the above settings automatically when it is turned off, and import them automatically when it is turned on next time without the need to reset. The last line shows the release date of the software. Measurement Name Listing As shown below, in the Setup interface, when the cursor is on Line 2, press key to enter the display interface of the prestored measurement name listing: Page 9

14 The first row is location number; the second row is measurement name. The measurement name can be English letters or numbers, no more than 14 characters. If there are still some prestored file names upwards and downwards, Press the and keys to turn the page up or down. Press key to return to Setup interface. Measurement Name Input As shown below, in the Setup interface, when the cursor is on 1, Press key to enter the measurement name: Press the key again, the numbers, symbols and English letters that can be used are shown at the bottom of the display. Page 10

15 Press the and keys to move the cursor to the desired character. Press key, and this character is copied to the measurement name input interface. If there is no desired character in the current characters zone, press and keys to turn the page up or down to look for other characters. Move the cursor in the same method as above. Press key to copy the desired character to the measurement name input interface. If the input is incorrect, press the key to delete the character. The measurement name can not exceed 14 characters. When the characters reach 14, no more characters can be inputted. After inputting the characters, press key to save the name. The last line of the display shows the saved location number. Press the key to return to the Setup interface. Note: The analyzer can store up to 256 measurement names. When the list exceeds 256, the analyzer will delete the previous 256 measurement names automatically, and only save the latest one. Option To increase efficiency of inputting the measurement names into the analyzer, it is recommended to enter all the measurement names to be stored into a computer. Then transfer them to the S665 analyzer using RS232 interface. Delete the previous prestored measurement names before transmitting in the PC listing of measurement names. Refer to the relevant operation to the instruction of the software. Integrated Measuring Time Setting For Model S665 Sound Analyzer Meter, set the integrated measuring time in given levels or in h/m/s (hour/minute/second). There are 13 given levels: manual setting, 10 s, 1 min, 5 min, 10 min, 15 min, 20 min, 30 min, 1 h, 2 h, 4 h, 8 h and 24 h. In the Parameter Setup interface, move the cursor to 6, and press the and Page 11


16 keys to switch the integrated measuring time within these 13 levels in sequence. To find the desired integrated measuring time within these 13 levels, move the cursor to the h, m, s of the Ts=00 h00 m00 s, and press the and keys to set the h, m, s of the integrated measuring time separately. The analyzer will save the setting parameters automatically when it is turned off. It will import them automatically when it is turned on next time. Operation Of Statistical Analysis Function List interface In the main menu, move the cursor to Statistic and press ENTER key to go to the screen as shown: On the screen, the first line shows the date, time and range. R: db means the range is from 50 to140 db (gain -10 db). The bottom line of the LCD display is the menu prompt. The left icon shows the battery level. The icon indicates that the software now is in statistical analysis software function. The icon indicates that the software now is in the list measuring interface mode. The middle of the LCD screen displays the various measurement results. The results are refreshed every second. The first 14 characters in the second line is the file measurement name entered. Move the cursor to the date function by pressing the and keys. To increase or decrease the value press the and keys. Page 12
17 Entering Name Press SETUP. The cursor will start at the Name line. Press the ENTER key two times. Use the up/down and right/left scroll keys to select the letters and/or numeric values desired. Press the ENTER key to select. When completed, press the SETUP to store the name of the test file. Changing Date On the screen, a black cursor underscore flashes twice every second. Press and keys to move the cursor on the clock s YY, MM, DD, HH, MM, SS, range and List. When the cursor is moved on the clock s YY, MM, DD, MM, SS, adjust the date and time by pressing and keys. When the cursor is moved to the range zone, set the range by pressing and keys. After the range is changed, it takes about 3 s to become stable. Starting the Measurement To start the measurement, press the START / PAUSE key, the analyzer starts the integrated measurement and statistical analysis, as shown in the figure below: The range zone becomes the measuring time. The range cannot be changed in the integrated measuring process. When the cursor is moved to Tm, set the Page 13
18 measuring time s hours and minutes with the and keys. When the measuring time reaches the set time, the integrated measurement will automatically stop and the integrated measuring result will be saved in the analyzer. In the measuring process, when the key is pressed, the integrated measurement will be suspended. Press the press key, the measurement will end and the measurement results will be saved. When the integrated measurement is suspended, the current measuring result can be deleted by pressing the key. When the integrated measurement is suspended, continue with the integrated measurement by pressing the key again. CAUTION During the integrated measuring process, the S665 will not exit to the main menu. If necessary, stop or delete the measurement in advance. Move the cursor to the List icon and press key to go to the graph interface. In the graph interface, the operations are described below: Graph Interface In the main menu, move the cursor to the Graph icon and press analyzer will change to the screen as shown below: key, the Page 14
19 The screen shows the current statistical distribution diagram. It refreshes every second. On the left of the screen is the location of the reading cursor and the statistical percentage of the corresponding sound pressure level range. As shown above, when the reading cursor points to db, 1.9% of the sound level being measured is between 61 db and 61.9 db. The last line is the menu prompt. It is the same as the list interface. Press and keys to move the cursor from the db to Graph. When the cursor is moved on the db, change the location of reading cursor with and keys. When the cursor is moved on the Graph, the unit enters into the list interface with and keys. Press the key, the statistical distribution diagram can be changed to cumulative distribution diagram. In the cumulative distribution diagram, through changing the location of the reading cursor, the unit displays the statistical sound level. In the graph display interface, it is also possible to start, suspend and delete measurement. CAUTION In the integrated measuring process, the unit will not exit to the main menu. If necessary, stop or delete the measurement in advance. Page 15
, it will stop automatically and calculate Ld, Ln, Ldn. Set the measurement interval time in the range of 1 min. up to 59 min.")

20 24 H Measurement The 24H measuring function allows the S665 analyzer to make measurements automatically at every integrated point time. After it has measured data of 24 intervals (within a 24 hour period), it will stop automatically and calculate Ld, Ln, Ldn. Set the measurement interval time in the range of 1 min. up to 59 min. When the measurement interval time is not set, the analyzer will automatically set the interval time to 20 min. The start up time of every interval can be the integrated point or equal to the time when the key is pressed. List Interface In the main menu, move the cursor to the 24Hours icon and press the key, the analyzer will change to the screen as shown below: On the screen, the first line shows the date, time and range. The middle shows the measurement results of 6 different intervals. The bottom line is the menu prompt. The left icon shows the battery level. The icon indicates that the analyzer now is in 24 h measurement function. The icon indicates that the software now is in the list display interface mode. The Ready icon indicates that the 24 h automatic measuring has not yet started, and is waiting for Start or reaching the integrated point time. The 49.0 db is the current instant sound pressure level being measured. When the menu prompt displays Ready, enter Setup by pressing the key and set the parameters such as measuring time and measurement file name etc. Once the unit starts to measure, the S665 will not enter into the Setup mode. When the clock reaches 00, the analyzer will start measuring automatically. Or Page 16


21 press the key to begin the first interval s measurement. Then, the analyzer will start other interval s measurement when MM of the clock reaches the time of first interval s measurement. The range zone becomes the measuring time. The range cannot be changed in the measuring process. When the cursor is moved to Tm, the screen can display the measuring time in hours and minutes with the and keys. When the measuring time reaches the preset time, the current interval measuring will automatically stop and the measuring result will be saved in the analyzer. The menu prompt displays Wait, which indicates that analyzer is waiting for the arrival of next interval s startup time. On the screen, the cursor is the the black block that flashes twice every second. Press and keys to move the cursor to the clock s YY, MM, DD, HH, MM, SS, range, hh:mm, and List. When the cursor is moved on the clock s YY, MM, DD, MM, SS, adjust the date and time with and keys. When the cursor is moved to the range zone, set the range with and keys. After the range is changed, it will take about 3s to become stable. When the cursor stays on the hh:mm, review the measuring values of other intervals as well as Ld, Ln, Ldn with and keys. When the cursor stays on the, the screen displays other measuring values with and keys. Page 17

22 Graph Interface When the cursor is on, switch to graph display interface mode with the and keys. The analyzer will change to the screen as shown below: On this screen, the first line shows the date, time and range. The middle shows the 24H distribution diagram. The last line is the menu prompt. The displayed contents and meanings are the same as those in the List Display interface. On top of the menu prompt, it displays interval name and its measuring results. In the graph display interface, move the cursor on clock s YY, MM, DD, HH, MM, SS, range, interval name, measuring values and Graph. The change of clock and range is the same as those in the List Display interface. When the cursor is moved to 18: 29, go to the last or next interval with and keys. The measuring value display zone will be changed accordingly. When the cursor is moved to LAeqT, review the other measuring values with and keys. When the measuring values change, the display graph will change accordingly. To exit from the 24H measuring function, press key and the display will show Press Enter Key To Exit! as a note, and then press the key to exit to the main menu. In order to remain in the 24H measuring mode, press the key and return to measuring status. When the analyzer issues these prompts, the noise measuring is not affected. Page 18


23 After the 24H measurement is finished, press the key to return back to the main menu. If another group of 24H measurements are needed, re-enter the 24H measuring mode. CAUTION In the 24H measuring processing, the key does not work. 24H measurement has 24 groups of measuring results. They use the same measurement name. Integrated Measurement In the main menu, move the cursor to the Integral menu and press key in order to enter the integrated measurement function mode. The S665 analyzer will change to the screen as shown below. The integrated measurement function is to measure the instant values, integrated values and peak C sound levels of three different time weighting modes and frequency weighting modes. The dynamic bar chart can show the instant value change of various frequency weighting modes and time weighting modes. Page 19


24 On the screen, the first line shows the date, time and the current measurement range. The middle of the display screen shows the instantaneous values of various frequency modes and time modes. The next is the instant value bar chart. The last line is the menu prompt. The left icon indicates the battery level. The icon indicates the analyzer is now in integrated measuring mode. The icon indicates the values displayed now are instantaneous values. The icon indicates the current screen can be saved. Press the and keys to move the cursor on the clock s YY, MM, DD, HH, MM, SS, range, LinstAF, Inst, and Save. When the cursor is moved on the clock s YY, MM, DD, MM, SS, adjust the date and time with and keys. When the cursor is moved to the range zone, set the range with and keys. After the range is changed, it takes about 3 s to become stable. When the cursor stays on LinstAF, change its status to either LinstAS, LinstAI, LinstCF, LinstCS, LinstCI, LinstZF, LinstZS, LinstZI with the and keys. The display contents of bar chart will be changed accordingly. When the cursor stays on the icon, save the data into the analyzer by pressing the key. When icon becomes highlighted and then returns to normal status, that idicates that the data has been saved completely. When making an integrated measurement, pause the integrated measurement first in order to save the data. After saving the data, press the key to continue with the integrated measurement. When the cursor stays on the Save icon, change it to Lock or Max with and keys. When the screen key shows Lock, move the cursor to this key and press key. When the lock button is selected, the Page 20


25 analyzer is in the lock status and the values will not change. Press the key again to exit from the lock status. When the screen key shows Max, move the cursor to this key and press key. The Max key is highlighted. The data to be displayed will be compared with the data shown in the previous instantaneous time screen. If it is larger than the previous data, the new data will be displayed. Otherwise, the display will not change. When the cursor stays on icon, change it to Integ with and keys. When the key is pressed to start the integrated measurement, it will also change to Integ automatically. The display interface will change to as below: When the measuring time reaches the set time, the integrated measurement will automatically stop and the integrated measuring results will be saved in the analyzer. In the measuring process, press key again to suspend the integrated measurement. Press the key to end the measurement and have the measurement results saved. When the integrated measurement is suspended, it is possible to delete the current measurement results by pressing the key. Or continue with the integrated measurement by pressing the key again. In the Integ interface, it is not possible to move the cursor to Save. While in the measuring process, it is not possible to change the range. Page 21

26 CAUTION In the integrated measurement process, the S665 will not exit to the main menu. It is necessary to stop or delete the measurement in advance. 1/1 oct and 1/3 oct Analysis Operation Press key on the top in the front of instrument for 1 s, the LCD will display the list of all software which is installed in the analyzer. Press and keys to move the cursor to 1/1 OCT Analyzer or 1/3 OCT Analyzer. As shown below, press key to go to 1/3 OCT Analyzer software s main menu. The various modes in this measurement mode are: 1) List: Display the sound pressure level and weighting sound pressure level of all center frequency points on one screen. 2) Graph: Display 1/3 OCT s analysis result in the form of a histogram. 3) Total: Measure the frequency weighting sound pressure level in a parallel manner. 4) Data: View the saved measurement results in the analyzer. 5) Setup: Set up the parameters for measurement file name, measuring time etc. 6) Calibrate: Calibrate the microphone s sensitivity level with an optional sound level calibrator. The number after the icon on the top right corner of the display means the group number of the data that can still be saved. Page 22


.")


27 Low Frequency Noise Measurement In the main menu, move the cursor to List and press screen shown as below: Low Frequency Noise Measurement Total Figure key to go to the 1.A weighting low frequency total. 2.C weighting low frequency total. 3.Z weighting low frequency total. For operation instructions refer to the next paragraph entitled List Interface: List Interface: In the main menu, move the cursor to List and press screen shown as below: key to go to the On the screen, the first line shows the date, time and range. R: db indicates the measurement range is from 40 db to 130dB. The second line means that frequency weighting method is to make the spectral analysis (typically Z weighting). When the cursor stays on the weight mode, change it to A or C frequency weighting with the and keys. When the cursor stays on page and refreshes every second, press and keys to read the different frequencies from 12.5 Hz to 16 khz. The result of the spectral analysis is weighted on the basis of the selected weighting mode. When A weighting is selected, the low frequency attenuation is high. As 1/3 OCT spectral analysis contains a lot of data, the results are shown in three pages. When entering the list interface, it is page 2 that the screen displays. The last line is the menu prompt. Page 23
28 The or icon indicates that the software now is in either 1/1 or 1/3 OCT analysis software function. The icon shows the software is in the List measuring mode. The icon represents that the values displayed are 1 s equivalent values. The icon means the current screen button has saving function capability. The center of the screen center are the the measured results. Press the and keys, to move the cursor (black block that flashes twice every second) to the clock s YY, MM, DD, HH, MM, SS, range, Weight Mode:, Page, List, Leq1s and Save. When the cursor is moved on the clock s YY, MM, DD, MM, SS, adjust the date and time with and keys. When the cursor is moved to the range zone, set the range with and keys. After the range is changed, it takes about 3 s to become stable. When the cursor stays on the Leq1s icon, it is possible to change the status to Leq,T with and keys. Leq1s means that the value displayed now is 1 s equivalent value. Leq,T means that the value displayed now is the equivalent value in an interval. Press the key, it becomes Leq,T automatically and the range zone displays the measuring time. When the cursor stays on the Save icon, save the current data by pressing the key. When Save becomes highlighted and then it returns to normal status that means the data is saved completely. When making an integrated measurement, pause the integrated measurement first in order to save the data. After saving the data, press the measurement. key to continue with the integrated When the cursor stays on the Save icon, change it to Lock or Max with and keys. They respectively mean that the screen key becomes lock function and maximum value hold function. When the screen key shows Lock, move the cursor to this key and press key. The Lock key is highlighted. When the lock button is selected, the analyzer is in the lock status and the values displayed do not change. However, the ongoing measurement and integrated measurements continue. Press the key again to exit from the lock status. When the screen key shows Max, move the cursor to this key and press key, and then the Max key will be highlighted. The data to be displayed will be Page 24


29 compared with the data shown in previous time. If it is larger than the previous data, the new data will be displayed. Otherwise, the display will not change. Note: In the integrated measurement process, the lock and maximum value hold functions do not work for the Leq,T value. By pressing the key, the analyzer starts the integrated measurement, and the screen is as shown below: The display zone automatically changes to the integrated values. The range zone becomes the measuring time. In the integrated measuring process, it is not possible to change the range. When the cursor is moved to Tm, S665 displays the measuring time s hours and minutes with and keys. When the measuring time reaches the set time, the integrated measurement will automatically stop and the integrated measuring results will be saved in the analyzer. During the measuring process, by pressing the key again, the integrated measurement will be suspended. Press the key, the measurement will end in advance and the measuring results will be saved. When the integrated measurement is suspended, it is possible to delete the current measured results and exit from the integrated measurement status by pressing the key. Once the integrated measurement is suspended, continue with the integrated measurement by pressing the key again. If the measurement is not re-started, exit to the main menu from the List Display interface by pressing the key. Page 25
30 CAUTION In the integrated measurement process, the S665 will not exit back into the main menu. It is necessary to stop or delete the measurement in advance. In the integrated measuring process, change of weighting mode and display page does not affect the integrated measurement results. Move the cursor to the List icon and press key to go to the graph interface. In the graph interface, the operations are described below: Graph Interface In the main menu, move the cursor to the Graph icon and press the the screen will change to the screen as shown below: key, In the frequency spectrum graph, the ordinate (y axis) is the sound pressure level and the abscissa (x axis) is the center frequency. The location of the center frequency is indicated by a straight line. The middle is the graph display zone, which can display all center frequencies and A, C, Z weighting sound pressure level in the resolution of 1 db. The maximum and minimum values of the ordinate are respectively determined by the upper and lower limits of the range. The last second line is the center frequency or the sound pressure level under A, C, Z weighting. R: means the current range. The last line is the menu prompt. The icon means that the software now is in the graph measuring interface. The icon indicates that the values displayed now are 1 s equivalent values. The be saved. icon indicates the current screen button allows the data to Press the and keys to move the cursor to the Weight Mode, it will display sound pressure level, range, Graph, Leq1s and Save. Move the cursor on Wei.A as shown above to display other center frequencies and the sound Page 26
31 pressure level under compound C and compound Z by pressing the and keys. By moving the cursor on other locations, the relevant operations are the same as those in the List Interface. Total Interface In the main menu, by moving the cursor to the Total icon and pressing the key, the screen will change to the screen as shown below: On the screen, the first line shows the date, time and measurement range. The middle five lines are the maximum instant 1 s values in the three frequency weighting modes and three time weighting modes. The following are two bar charts, which can be defined by as the instant values of the three frequency weighting modes and three time weighting modes. The bottom line is the menu prompt. The icon indicates that the analyzer now is in 1/3 OCT analysis software function. The icon indicates that the software now is in the total measuring interface. The Linst icon indicates that the values displayed now are instant values. The lock function capability. icon indicates that the current screen button has In the Total Interface, change of the clock and range is the same as that in the List Interface. The function and operation of the screen buttons at the bottom right corner of the display are also the same as those in the List Interface. The maximum value hold function and lock function do not work with the two dynamic bar charts. In the Total Interface, it can also can display the 1 s equivalent value and integrated values. Move the cursor to the Linst icon and go to the 1 s equivalent value or integrated value display by pressing the and keys. The 1 s (Leq1s) equivalent value is displayed as below: Page 27


32 The integrated value is displayed as below: While in the Total Interface measurement, either in the Linst display status or in Leq,1s display status, the system will automatically go to the integrated value display interface by pressing the key. When the measuring time reaches the set time, the integrated measurement will stop automatically and save the integrated measuring results in the S665 analyzer. During the measuring process, by pressing the key again, the integrated measurement will be suspended. Press the key, the measurement will end in advance and the measured results will be saved. When the integrated measurement is suspended, it is possible to delete the current measured results and exit from the integrated measuring status by pressing the key. When the integrated measurement is suspended, The S665 allows continuation of the integrated measurement by pressing the key again. Page 28
33 CAUTION In the integrated measuring process, Model S665 will not exit back into the main menu. If necessary, stop or delete the measurement in advance. The display lock and the maximum value hold functions do not affect the integrated measurement results. While in the integrated measuring process, The S665 will not allow selection or cancellation of the display lock and the maximum value hold functions. Recording User Test Parameters When the key is pressed, the analyzer automatically saves the pertinent parameters that were used for the current measurement. When the S665 analyzer is next turned back on, the system will automatically import these parameters. The saved content includes the cursor location in the main menu, display index, center frequency, screen button s functions, set integral measuring time, selected measurement name, start delay time, prompt status before starting, LCD s contrast, range, measurement name selection method, and selected software module. Data Management Overview Model S665 has 64 kb Flash Ram for storing measurement results. Each measured result takes up 512 bytes, therefore the analyzer can store 128 groups of data. The data stored in the analyzer can be transferred to the Flash disk through the USB interface, or transferred to the computer through the RS-232 or USB interface. The measurement results stored in the analyzer are recalled in the data management menu. Data Recall In the main menu, move the cursor to Data menu and press the key to start the data management function. The display shows the list of the measured results. On the display, the first column displays the location number of the measured results stored in the analyzer. The second column is the measurement file name used for the measured results. The third column is the measurement date. Display the starting time and measuring method of the measured results by pressing the and keys. Page 29
34 In the measuring modes, the common measuring mode codes include: 24Hxx: 24H measurement results in the statistical analysis software. The latter two characters indicates the interval number ALL: Total analysis results OCT: OCT analysis results in the 1/1 OCT analysis software STA: Statistical analysis results in the statistical analysis software INT: Integral measured results in the statistical analysis software 1/3 OCT: 1/3 OCT analysis results in the 1/3 OCT analysis software Move the cursor downwards with the key. When it is moved to the last line, the content in the next page will be displayed by continuing to press the key. Or move the cursor upwards with the key. By moving the cursor on the number of the measured result file, it is then possible to view the details by pressing the key. Then press the key to exit to the main menu. Data Transferred to Flash Disk Enter the Data menu by pressing the key, the screen directs for the insertion of the flash disk. Use the USB to flash disk converter cable to insert the formatted flash disk into the analyzer. The analyzer starts initializing the flash disk and displays the flash disk s total section number and free section number. The system will check whether there is enough space in the flash disk. The system will then create a new folder naming it the current date in the Flash disk s root directory and transfer the measured results stored in the analyzer to this new folder. Each group of measured results is stored in one text file. The name of the text file is the first six 6 characters of the measurement name plus two location numbers. Using extension.txt. After transferring the data, the analyzer will notify the number of transferred files. Turn off the analyzer s power supply and Page 30


35 take the Flash disk out. Insert the Flash disk into the computer to view the measured results. When the system asks to have the Flash disk inserted and data is not ready to be transferred, press the key to exit to the main menu. OCT Analysis Result Recall After entering the Data menu, select the measured result file which was obtained by OCT analysis and press the key. Model S665 displays the content of the measured result in detail. If they cannot be displayed in one page, press the key to display the next page, or press the key to return the previous page. When the OCT analysis result is saved, the first line is the measurement file name. The second line is the date and time when the measurement was started. The third line is the measuring mode. If the saved result is integrated value, the integrated time is also displayed. The fourth line is the measuring range. The fifth line is the measuring index (MaxLeq1s, Leq.T or Linst, Leq.1s). From the sixth line, it displays each center frequency and the sound pressure level under three frequency weighting modes. Press key to display the spectrogram. After viewing the spectrogram, press key to return the list display interface. Page 31


36 Total Analysis Result Recall In the OCT analysis software, the total analysis results format is shown below: The first line is the measurement file name. The second line is the date and time when the instantaneous values were stored. The third line is the measuring mode. The fourth line is the measuring range. From the fifth line, it displays the instant value. If there is integrated measured result, it also displays the date and time when the integral is started as well as the integrated measured result. Page 32


37 Statistical Analysis Result Recall The first line is the measurement name. The second line is the date and time when the measurement was started. In the third line, STA means it is a statistical analysis result. The latter is the integrated measuring time. The fourth line is the measuring range. From the fifth line, it displays the analysis result. Press key to display the statistical distribution diagram. Press key again to display the accumulated distribution diagram. In the distribution diagram display, view the statistical percentage and accumulation percentage under different sound pressure levels by pressing and keys. The sound pressure level is increased or decreased each time the two keys are pressed. In the distribution diagram display, press display. key to return the list Page 33


38 24H Measured Result Recall 24H measured results saving format is the same as the statistical analysis saving format. After entering the Data menu, select any group of measurement results that were obtained by the 24H measuring and press measured result list display interface of the current interval. key. Displayed is the Press key to go to 24H result list display interface. In this interface, it displays eight intervals with four different measuring index. By pressing and keys the display index will change. Press the and keys to view the measured results and Ld, Ln, Ldn in other intervals. Press key to display 24H distribution diagram. Page 34


39 In the 24H distribution diagram display interface, press and keys to change the display index. View the measured data in other intervals with and keys. Press key to return to the measuring result list display interface of the current interval. Integrated Measuring Result Recall In the statistical analysis software, the integrated measuring results saving format is shown: The first line is the measurement file name. The second line is the date and time when the instantaneous value was saved. The third line is the measuring mode. The fourth line is the measuring range. From the fifth line, it displays the instantaneous values. If there are integrated measuring results, press the key to view the next page. The first line is the date and time when the integral started. The second line is the preset measuring time and actual measuring time. The following lines are the integrated measurement results. Page 35

.")
40 1/3 OCT Analysis Result Recall When entering the Data Management menu, move the cursor to the measured result obtained by 1/3 OCT analysis by pressing and keys. Press key to display the content of the measurement result in detail. If it cannot be displayed in one page, press key to display the next page and press key to return the previous page. When the 1/3 OCT analysis results are saved, the first line is the measurement file name. The second line is the date and time when the measurement started. The third line is the measuring mode. If an integrated value is saved, the integrated time is also displayed. The fourth line is the measuring range. The fifth line is the measuring index (Leq.T or Leq1s). From the sixth line, it displays each center frequency and the sound pressure level under three frequency weighting modes. The value before the icon is the normal center frequency and the value behind it is the corresponding sound pressure level. Page 36
41 Note: No matter which weighting mode is selected in the measuring process, the saved result is also the spectral analysis result under Z weighting mode (zero weighting). Press key to display the spectrogram. After viewing the spectrogram, press key to return the list display interface. Computer Software Instructions Overview Model S665 driver is a computer-based system utilizing either RS-232 or USB interface to output saved measurement results. The user is able to read, write or delete prestored measurement files and examine the calibration records from the S665 Sound Analyzer Meter. The saved data can be uploaded to a computer then displayed using a software program such as Excel for viewing and charting. It is real-time signal analysis (one second/ transient real-time analysis). Functions Data transmission methods either USB or RS-232. Read the saved measurement results from the analyzer and save them on a computer in a folder created by the user. All read and transferred data is saved in this folder. Each group of data makes up one file. The file name consists of the measurement file name (14 bits) and the location ID of internal FLASH where the data is stored. Its file extension is txt. Read the prestored measurement file name, delete the prestored file name zone inside the analyzer and enter the prestored point name. It can be saved in the computer for the user s recall. Its file extension is.man. Read the calibration records, and save them in the file of calrecord.xls. Open the saved data with WordPad and open the calibration record with EXCEL. Minimum hardware requirements: CPU Pentium III 500MHZ 128M memory 100M hard disk Windows 2000 OS Page 37


42 Software Installation To describe the software installation, Windows XP Operating System is used as an example. USB device driver installation: Install the USB device driver first in computer before transmitting data to a computer via USB interface for the first time. Connect the analyzer to the computer s USB port with a USB cable. As shown below, turn on the analyzer s power, the computer pop-up note indicates that a new hardware is found and will install the driver automatically: After selecting the Install from list or specific location and clicking Next button, the following prompt will appear: After clicking Finish the new hardware is installed successfully and ready for use. The application file Soundview.exe will be located at C:\Program Files\Soundview\Soundview Software Operation Instruction Upon opening the SoundView.exe file there is a menu bar with File, View, Name, Result, Calibration, Help. Page 38
 on the PC Setup: Assigns Communication Mode for either Serial Port (RS232) or USB, Browse function to locate your")


43 File: Five submenus: Input Name, Input Data, Setup, Conversion, and Exit. Input Name: To open and display the measurement file names stored in PC. Input Data: Allows user to browse for folder (choose directory) on the PC Setup: Assigns Communication Mode for either Serial Port (RS232) or USB, Browse function to locate your file, Save and Exit. Conversion: Converts all the measurement data to an Excel file (.xls). Exit : exit the program. View: Three submenus: Toolbar, Status Bar and Workspace. Name: Five submenus: Read Out, Add, Write In, Save and Clear Read Out: Read out the measure name, it can read out the instrument presaved file name, and display the measures under the roll-call management label in the host interface. Add: Add measurement file name, click Add then screenshot shown below appears: Type the name, for example B. The B measurement file name is added. Write In: Write measurement file name in the instrument, by clicking Write, then key in the six digit serial number to be saved in the instrument and click Ok. Page 39
44 Save: Save measurement file name, click Save then key in the file name, the extension name of man. Clear: Click Clear to delete measure name,same as the above screenshot, key in 6 serial number in the instrument and click Ok. Result: Three submenus: Read Result, Realtime Analyze (with two submenus: Analyze per second, Instant Analyze), Clear Result. Read Result: Download the instruments measurement results, click Result to download the instruments measurement results and save in the computer. The save path is in the Setup, double click the measure name to display data or figures. Realtime Analyze: Clear Result: Click Clear Result then key in the instrument serial number, it will clear all of the instruments result. Calibration: Read Cal:click Read Cal to read out completely the instrument Calibration result and save in the computer,the extension name of Cal. View Cal:open the Cal file. Clear Cal: Click Clear Cal then keyin instrument serial number to delete all the instrument calibration result. Conversion: File conversion, move the cursor on the Measure Data block, click the mouse right key then click coversion to it and save in Excel file. Page 40

45 CAUTION When emptying the point name, enter the machine serial number as shown on the built-in software authorization certificate of the analyzer. If entered incorrectly, it is not possible to remove the original point name or write the new point name. Acoustical Calibration with CAL601 For the first acoustical calibration, set the calibrator sound pressure level according to the verification certificate of s Model CAL601 Sound Level Calibrator. In general, the sound level calibrator s sound pressure level is 94.0 db. When the measured sound pressure level is not 94.0 db, calibrate by the actual result, for example, if the result is 94.2 db, move the cursor to Mod button, press key, then move cursor to 4., and press and key to adjust the value to Press and key once, the value will increase/decrease by 0.01 db, when press and key continuously, the Page 41
46 value will increase/decrease by 1 db continuously until release the key. Then move cursor to Mod button, and press button. CAUTION The above step is carried only when the indicated calibrator s sound pressure is different from that of the working sound level calibrator. Set the CAL601 Sound Level Calibrator on the microphone, turn on the power, and wait a few seconds until the system runs steady. Move the instrument s cursor to calibrate button, press key, then instrument will calibrate automatically. Lp C indicates the sound pressure level, which is around the result that subtracts free field correction from sound pressure level of calibrator. Lpx indicates the sensitivity level. The value showed on the display s top left corner starts from 0 and stops at 9. Move cursor to App button, press key, then microphone s new sensitivity level is stored. If the difference is more than 3 db between the new and stored sensitivity-values, the instrument will indicate: The difference between these two sensitivities is too large. Confirm the calibration is performed correctly. Also check to see if the microphone is damaged. If user does not press button, the analyzer still uses the original sensitivity level. key on App Direct Input Sensitivity When there is no calibrator, microphone s sensitivity level can be input directly. Move cursor to Mod button, press key, then move cursor to 3., and adjust to the required value by pressing and button. Press and key once, the value will increase/decrease by 0.01 db, when depress and key continuously, the value will increase/decrease by 1 db continuously until release the key. Move cursor to App button, press microphone s new sensitivity level is stored. key, the Page 42
47 View Calibration Record Model S665 Sound Analyzer can store every calibration record up to a maximum of 256 times. Once it exceeds 256 records, it automatically removes the 256 records and stores the most recent one. Move cursor to Rec button, press key, it indicates as below: When the data cannot be showed on one screen, press and to pageup or page-down, the most left number of the first line on the screen is page number. Maintenance General Information This is a precision instrument. To guarantee its performances be sure to use it or keep it stored within suitable environmental conditions. Do not expose it to high temperatures or humidity or direct sunlight. Be sure to turn it off after use. If not expected to be used for a long period of time, it is recommended to remove the batteries. Battery Replacement The low battery icon is displayed to indicate the batteries need to be replaced. CAUTION If the symbol or BATTERY LOW appears on the LCD, replace the batteries immediately Turn off the instrument. Remove the battery cover. Remove all the batteries from the battery holder. Insert four new batteries of the same type respecting the polarity signs. Install the battery cover. Fig. 3: Opening and closing of battery cover Page 43
48 Cleaning To clean the instrument, use a soft dry cloth. Never use a wet cloth, solvents or water. End of Life Caution: this symbol indicates that instrument and its accessories should be subject to a separate collection and correct disposal. Specifications EMC This tester was designed in accordance with EMC standards in force and its compatibility has been tested in accordance with EN (2006) Design Standards This S665 instrument complies with IEC (2002) class 1 and CNS 7129 and IEC 61260(1995) Class 1. IEC60651:1979 TYPE 1, IEC60804:1985 TYPE 1, ANSI S1.4:1983 Type1. Microphone 1/2 pre-polarized, sensitivity: 50 mv/pa, frequency range: 10 Hz~20 khz, heat noise: <16 db(a) Frequency range 10 Hz ~ 20 khz ±0.2 db, 1 Hz ~ 23 khz (±1.0 db) Range gain Range control error Max Peak C Sound Sampling Frequency Measuring voltage range Level linear range Time weighting -10 db, 0 db, 10 db, 20 db, 30 db, 40 db 0.1 db. 50 ~ 143 db 20.8 μs (48 khz) 15 μv ~ 10 V (RMS) > 90 db. LINEAR is a flat frequency response curve over the entire measurement frequency range, typically used when performing octave band filter analysis. Parallel (simultaneous) F, S, I, Peak C+, Peak C- Page 44
49 Frequency weighting Analysis Frequency Ranges Background noise Parallel (simultaneous) A, C, Z. Realized by digital filtering OCT Filter center frequency: 16 Hz, 31.5 Hz, 63 Hz, 125 Hz, 250 Hz, 500 Hz, 1 khz, 2 khz, 4 khz, 8 khz, 16 khz 1/3 OCT Filter center frequency: 12.5 Hz, 16 Hz, 20 Hz, 25 Hz, 31.5 Hz, 40 Hz, 50 Hz, 63 Hz, 80 Hz, 100 Hz, 125 Hz, 160 Hz, 200 Hz, 250 Hz, 315 Hz, 400 Hz, 500 Hz, 630 Hz, 80 0Hz, 1 khz, 1.25 khz, 1.6 khz, 2 khz, 2.5 khz, 3.15 khz, 4 khz, 5 khz, 6.3 khz, 8 khz, 10 khz, 12.5 khz, 16 khz < 13 db (A), 15 db (C), 25 db (Z) Anti-aliasing filter Statistic analysis menu 24H measuring menu Cut off frequency 23.5 khz, Stop band attenuation 100 db LAFp, LAFmax, LAF5, LAF10, LAF50, LAF90, LAF95, LAFmin, SD, LAeq1s, LAeq,T, LAE, LAfeqT. Ld, Ln, Ldn, besides all measuring parameters in the statistic analysis menu. Measuring parameters Lfmeq, 1s, Lfmeq, T, Lxyp, Lxyi, Lxeq, 1s, Lxeq, T, LAE, E, Cpeak, Tm Integrated measuring menu Integrated measurement time Starting time Range display Note: fm is center frequency; X is frequency weighting A, C, Z. Y is time weighting F, S, I. The noise exposure (E) s measuring range is Pa2h Lxyp, Lxyi, Lxeq,1s, Lxeq,T, LAE, E, Cpeak+, Cpeak-,LAFmax,LAFmin,LAFeqT, LASeqT, LAIeqT. Note: X is frequency weighting A, C, Z and Y is time weighting F, S, I. 1 s 24 h set in a given range or randomly < 10 s 0 ~ 90, 10 ~ 100, 20 ~ 110, 30 ~ 120, 40 ~ 130, 50 ~ 140 db, reference range 30 ~ 120 db. Page 45
50 Range A weighting C weighting Z weighting Peak C In different range displays, the measuring ranges are as shown below 0 ~ ~ ~ ~ ~ ~ ~ ~ ~ ~ ~ ~ ~ ~ ~ ~ ~ ~ ~ ~ ~ ~ ~ ~ ~ ~ ~ ~ ~ ~ 143 Data storage Internal clock Calibration Display Display refresh Contrast adjustment Input Connection Power Low Battery Indication Battery life Environmental Conditions Operating max height Operating temperature Relative humidity Storage temperature Store statistical analysis, 24H measurement and integrated measuring results (maximum 128 groups). Measurements can also be stored on Flash disk shipped with the analyzer. The S665 analyzer can store 256 calibration records. Error less than 1 min/month Use Model CAL601 or a Class 1 Calibrator with 1000 Hz ± 1 %, harmonic distortion < 1 % Type matrix LCD, with LED backlight 1 Hz for value; 10 Hz for graph 64-class adjustable X9-6Z signal input receptacle Battery: 4 batteries 1.5 V LR6 AA AM3 MN 1500 AC to DC Adapter: 5V/1A When battery voltage becomes too low a battery icon appears Approximately 8 hours For inside use 2000m 5 ~ 40 C (40 ~ 104 F) <80% for temperatures up to 31 C decreasing linearly to <50% RH at 40 C -10 ~ 60 C (14 ~ 140 F) Page 46
51 Storage humidity <70% Dimensions Weight (with batteries) 285(l) x 90(w) x 39(h) mm (11.2x3.5x1.5 ) Approx 500g (1.1 lb) CAUTION When the microphone sensitivity is not 50 mv/pa(-26 db), the analyzer s measuring range and range will change automatically based on the microphone sensitivity. When the microphone sensitivity is less than 50 mv/pa, the measuring range moves upwards. For example: when the microphone with 40 mv/pa(-28 db) sensitivity is equipped,the range moves upwards by 2 db and the reference range display changes to 42~132dB Optional Accessories Model CAL601: Sound level calibrator, 94 and 114dB Model RSCBL3: RS-232 cable Model MC15: 5 m (15 ft) microphone extension cable Model MC60: 20 m (60 ft) microphone extension cable Service Warranty warrants to the original purchaser that its products and the component parts thereof, will be free from defects in workmanship and materials for a period of two years from date of purchase. will, without charge, repair or replace, at its option, defective product or component parts. Returned product must be accompanied by proof of the purchase date in the form of a sales receipt. To obtain warranty coverage in the U.S.A., this product must be registered by completing a warranty registration form on within fifteen (15) days of purchase. Exclusions: This warranty does not apply in the event of misuse or abuse of the product or as a result of unauthorized alterations or repairs. The warranty is void if the serial number is altered, defaced or removed. Page 47
52 shall not be liable for any consequential damages, including without limitation damages resulting from loss of use. Some states do not allow limitations of incidental or consequential damages. So the above limitation or exclusion may not apply to you. This warranty gives you specific rights and you may have other rights, which vary from state-to-state Savi Ranch Parkway Yorba Linda, CA Non-Warranty Service Please return the product in the original packaging with proof of purchase to the address below. Clearly state in writing the performance problem and return any leads, probes, connectors and accessories that you are using with the device. Non-Warranty Service: Return the product in the original packaging to the address below. Clearly state in writing the performance problem and return any leads, probes, connectors and accessories that you are using with the device. Customers not on open account must include payment in the form of a money order or credit card. For the most current repair charges please visit and click on service/repair. Return all merchandise to with pre-paid shipping. The flat-rate repair charge for Non-Warranty Service does not include return shipping. Return shipping to locations in North American is included for Warranty Service. For overnight shipments and non-north American shipping fees please contact. Include with the returned instrument your complete return shipping address, contact name, phone number and description of problem Savi Ranch Parkway Yorba Linda, CA Page 48

53 Appendices Appendix 1: Frequency weighting characteristics Page 49

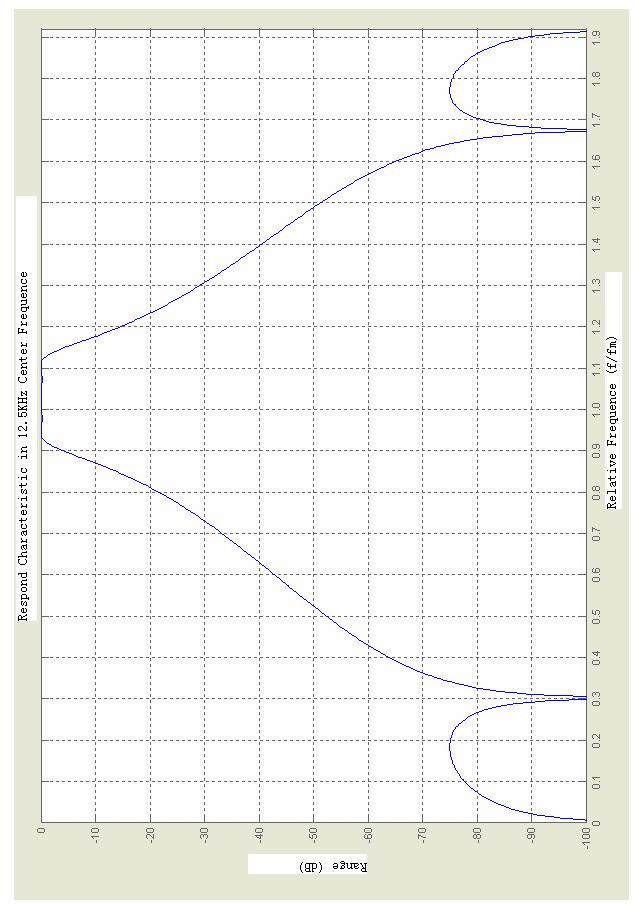
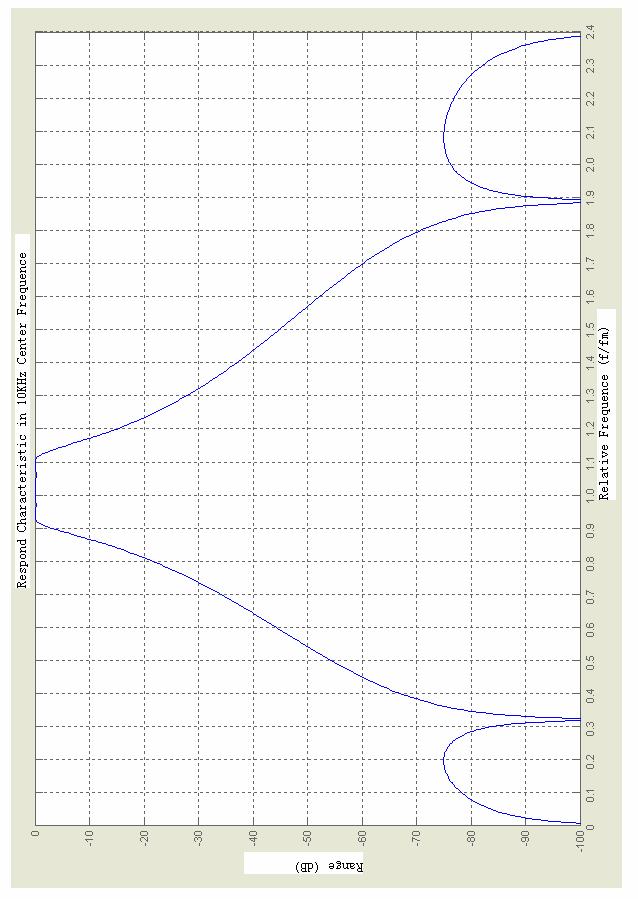
54 Appendix 2: 1/3 OCT filter characteristics Page 50
55 Page 51
56 Page 52
57 Appendix 3: A, C frequency weighting Frequency (Hz) A (db) C (db) Frequency (Hz) A (db) C (db) Page 53

58 Appendix 4: 4 Hz digital high-pass filter characteristics Page 54
Pro II. Sound Level Meter V-9992
 Pro II Sound Level Meter V-9992 Title Page I. Safety Information...1 II. General Description...1-2 III. Specifications...2-3 IV. Name and Functions...4-5 V. Calibration Procedures...6-7 VI. Measurement
Integrating Sound Level Datalogger Model
 User's Guide Integrating Sound Level Datalogger Model 407780 Introduction Congratulations on your purchase of the Extech 407780 Integrating Sound Level Meter. The 407780 with programmable integrating time
1. GENERAL DESCRIPTION & SPECIFICATIONS
 CONTENTS 1. General Description & Specifications... 1 2. Name and Funtions... 3 3. Calibration Procedures... 6 4. Measurement Preparation... 7 5. Operating precautions... 7 6. Measurement... 8 7. Setup
SOUND LEVEL METER DVM1351 INSTRUCTION MANUAL HANDLEIDING MANUEL D UTILISATEUR DVM1351 SOUND LEVEL METER 1
 SOUND LEVEL METER DVM1351 INSTRUCTION MANUAL HANDLEIDING MANUEL D UTILISATEUR DVM1351 SOUND LEVEL METER 1 SAFETY INFORMATION l Read the following safety information carefully before attempting to operate
ASV 5910 Noise Dosimeter
 ACOUSTICS & VIBRATION MEASURING INSTRUMENTS ASV 5910 Noise Dosimeter Instruction Manual HANGZHOU AIHUA INSTRUMENTS CO., LTD Notes 1. Please read the instruction carefully before using the instruments for
RS-232. ital Measurement Metrology, Inc ECISION IS OUR VISION LEVEL REC SETUP MAX MIN FAST SLOW INTV CLOCK.
 A C SETUP MAX MIN CLOCK FAST SLOW INTV REC LEVEL RS-232 Lo = 30 Med= 50 Hi = 80 Auto= 30 POWER-UP OPTIONS 80 db 100 db 130 db 130 db ital Measurement Metrology, Inc ECISION IS OUR VISION 1-866-960-940
AWA6223S Sound Level Calibrator. Instruction Manual HANGZHOU AIHUA INSTRUMENTS CO., LTD
 AWA6223S Sound Level Calibrator Instruction Manual HANGZHOU AIHUA INSTRUMENTS CO., LTD Notes 1. Please read the instruction carefully before using the instruments for the first time. 2. The calibrator
Sound Analyser Real Time 1/1 & 1/3 Octave band Analysis
 ISO-TECH Sound Analyser Real Time 1/1 & 1/3 Octave band Analysis SLA-1358 INSTRUCTION MANUAL L CONTENTS Title Page I. SAFETY INFORMATION...1 II. GENERAL INFORMATION & FEATURES...2 III. SPECIFICATIONS...2
TES-1358 INSTRUCTION MANUAL
 Sound Analyzer Real Time 1/1 & 1/3 Octave band Analysis TES-1358 INSTRUCTION MANUAL FAST L A W 75.2 100 90 80 70 60 50 40 30 Hz 31.5 8k L W 125 500 2k [ 1 / 3 OCT ] 01 / 07 / 27 14:26:39 TES ELECTRICAL
Sound Level Meter SD Card real-time Datalogger
 USER MANUAL Sound Level Meter SD Card real-time Datalogger Model SDL600 Additional User Manual Translations available at www.extech.com Introduction Congratulations on your purchase of the Extech SDL600
TES-1353S INSTRUCTION MANUAL
 INTEGRATING Sound Level Meter TES-1353S INSTRUCTION MANUAL Enclosed CD : Software & Protocol Inside. A/C Leq SEL SPL MAX RECORD ERASE DATE INTEG TES ELECTRICAL ELECTRONIC CORP. CONTENTS Title Page 1. INSTRUMENT
USER S MANUAL. Data Logger SOUND LEVEL METER.
 USER S MANUAL Data Logger SOUND LEVEL METER www.galaxyaudio.com/products/cm-170 This page intentionally left blank Contents Introduction...1 Safety Information...2 Overview...3-4 Before Getting Started...5
Integrating Sound Level Meter ST-107/ST-107S User s Manual
 Integrating Sound Level Meter ST-107/ST-107S User s Manual HB2ST1070003 Contents: 1. SAFETY PRECAUTIONS...3 1.1. Preliminary Description...3 1.2. Note...3 2. PREPARATION FOR USE...4 2.1. Initial...4 2.2.
RS Stock No Instruction Manual RS Input Data Logging Thermometer
 RS Stock No. 730-0458 Instruction Manual RS-1384 4 Input Data Logging Thermometer EN FR IT DE ES TABLE OF CONTENTS / EN TITLE TABLE OF CONTENTS PAGE 1. INTRODUCTION FEATURE... 1 2. SPECIFICATIONS... 2
Instruction Manual Digital Sound Level Meter
 Sauter GmbH Ziegelei 1 D-72336 Balingen E-Mail: info@kern-sohn.com Tel.: +49-[0]7433-9933-0 Fax: +49-[0]7433-9933-149 Internet: www.sauter.eu Instruction Manual Digital Sound Level Meter SAUTER SU V. 1.3
INSTRUCTION MANUAL REC FAST A/C
 SOUND LEVEL METER INSTRUCTION MANUAL REC FAST A/C 1. SAFETY INFORMATION Read the following safety information carefully before attempting to operate or service the meter. Use the meter only as specified
ATE-9051 User s Manual
 SOUND LEVEL METER ATE-9051 User s Manual www.tmatlantic.com 1. SAFETY INFORMATION Read the following safety information carefully before attempting to operate or service the meter. Use the meter only as
TITLE PAGE I. Safety Information II. General Description III. Specifications IV. Controls V. Calibration Procedures VI. Measurement Preparation
 C O N T E N T S TITLE PAGE I. Safety Information. 1 II. General Description.. 1 III. Specifications.. 2-3 IV. Controls... 4-5 V. Calibration Procedures........ 6 VI. Measurement Preparation....7 VII. Operating
Measure Sounds Reliably
 Measure Sounds Reliably Sound Level Meter Class1 NL-52 Sound Level Meter Class2 NL-42 Extremely User Friendly Rion s NL-52 and NL-42 sound level meters provide full support for the process. The NL-52 and
ST-140 Vibration Meter ST-140D Datalogging Vibration Meter User s Manual
 ST-140 Vibration Meter ST-140D Datalogging Vibration Meter User s Manual HB2ST1400000 CONTENTS 1 Introduction... 1 2 Accessories... 1 3 Safety Precaution... 1 4 Meter Description... 2 5 Operation... 3
SOUND LEVEL METER INSTRUCTION MANUAL
 SOUND LEVEL METER INSTRUCTION MANUAL REC FAST A/C 1. SAFETY INFORMATION Read the following safety information carefully before attempting to operate or service the meter. Use the meter only as specified
RS Stock No Instruction Manual RS Input Data Logging Thermometer
 RS Stock No. 730-0458 Instruction Manual RS-1384 4 Input Data Logging Thermometer EN FR IT DE ES TABLE OF CONTENTS / EN TITLE TABLE OF CONTENTS PAGE 1. INTRODUCTION FEATURE... 1 2. SPECIFICATIONS... 2
! SCARLET TECH. Sound Level Meter ST-109/107S User Guide
 SCARLET TECH Sound Level Meter ST-109/107S User Guide Instrument at a Glance 4 Overview 4 Buttons 5 Display 6 Getting Started 7 Before using 7 Measure SPL 7 Data hold 7 Lmax & Lmin 7 Record & view data
CM-140. Instruction Manual SOUND LEVEL METER G A L A X Y A U D I O
 CM-140 Instruction Manual G A L A X Y A U D I O CE GCBC CM140-12000 SOUND LEVEL METER CONTENTS TITLE PAGE I. Safety Information.. 1 II. General Description.... 1-2 III. Specifications.. 2-3 IV. Name and
User s Manual. Sound Level Meter. FSM 30Plus. Lo/Hi MAX HOLD S/F. S F db BAT. SOUND LEVEL: Lo=35~100dB Hi=65~130dB. 94dB
 User s Manual ound Level Meter M 30Plus Lo/Hi MAX / O A C CAL 94 OUND LEVEL: Lo=35~100 Hi=65~130 Contents Title Page I. afety Information...1 II. General Description... III. pecifications... IV. Name And
Manual SOUND LEVEL METER PCE-322 A
 www.pce-industrial-needs.com Tursdale Technical Services Ltd Unit N12B Tursdale Business Park Co. Durham DH6 5PG United Kingdom Phone: +44 ( 0 ) 191 377 3398 Fax: +44 ( 0 ) 191 377 3357 info@tursdaletechnicalservices.co.uk
99 Washington Street Melrose, MA Phone Toll Free Visit us at
 99 Washington Street Melrose, MA 02176 Phone 781-665-1400 Toll Free 1-800-517-8431 Visit us at www.testequipmentdepot.com Table of Contents 1. General Safety Requirements... 1 2. Safety Terms and Symbols...
Bluetooth/USB Data Logger USER S MANUAL. Hantek 365A/B/C/D/E/F V
 Bluetooth/USB Data Logger USER S MANUAL Hantek 365A/B/C/D/E/F V 1.0.3 www.hantek.com Content General Safety Summary... 1 Chapter 1 Getting Start... 3 1.1 General Check... 4 1.2 The User interface... 5
Integrating Sound Level Meter ST-106 CLASS 1 User s Manual
 Integrating Sound Level Meter ST-106 CLASS 1 User s Manual HB2ST1060000 Contents: 1. SAFETY PRECAUTIONS... 3 1.1. Preliminary Description... 3 1.2. Note... 3 2. PREPARATION FOR USE... 4 2.1. Initial...
SD Model. Instruction Manual. Sound Level Meter/ Data logger. reedinstruments. www. com
 Model SD-4023 Sound Level Meter/ Data logger Instruction Manual www com Table of Contents Features... 3 Specifications...4-5 Instrument Description... 6 Operating Instructions...7-11 Function Selection...
7032 Digital-Analog Multimeter
 7032 Digital-Analog Multimeter OPERATOR S MANUAL CONTENTS: 1. Safety precautions and procedures 1 1.1. Preliminary 1 1.2. During Use 2 1.3. After Use.. 2 2. General Description. 3 3. Preparation for Use..
Model R8050. Instruction Manual. Sound Level Meter. reedinstruments. REED Instruments
 Model R8050 Sound Level Meter Instruction Manual reedinstruments www com REED 1-877-849-2127 info@reedinstruments.com www.reedinstruments.com Table of Contents Safety... 2 Specifications... 3 Instrument
S-14 S-14. Compact Digital Multimeter. Compact Digital Multimeter
 S-14 Compact Digital Multimeter S-14 Compact Digital Multimeter SAFETY INFORMATION The following safety information must be observed to insure maximum personal safety during the operation at this meter
FG-3000R Digital Force Gauge Operation Manual
 FG-3000R Digital Force Gauge Operation Manual Operators should wear protection such as a mask and gloves in case pieces or components break away from the unit under test. Whether the unit is ON or OFF,
Personal Sound Level Meter
 User's Guide Personal Sound Level Meter Model SL10 Introduction Congratulations on your purchase of the Extech SL10 Personal Sound Level Meter. The SL10 measures and displays sound pressure levels in db
Sound Level Meter SL-4035SD. Operation Manual PLEASE READ THIS MANUAL CAREFULLY BEFORE OPERATION
 Sound Level Meter SL-4035SD Operation Manual PLEASE READ THIS MANUAL CAREFULLY BEFORE OPERATION Hagavish st. Israel 58817 Tel: 972 3 5595252, Fax: 972 3 5594529 mrc@mrclab.com MRC.8.16 TABLE OF CONTENTS
WARNING: Do not use the thermometer/data logger before you read the users manual and the following instructions.
 55 This unit passes the following tests EN 61326-1:2006 (CISPR11,IEC/EN 61000-3-2:2006, IEC/EN 61000-3-3: 1995+A1 :2001+A2:2005 IEC/EN 61000-4-2/-3/-5/-6/-11) WARNING: Do not use the thermometer/data logger
Table of Contents. 3.1 Front/Rear Panel and User Interface Front Panel Rear Panel User Interface...
 General Warranty OWON warrants that the product will be free from defects in materials and workmanship for a period of 2 years (1 year for accessories) from the date of purchase of the product by the original
FG-3000 Digital Force Gauge Operation Manual
 FG-3000 Digital Force Gauge Operation Manual Operators should wear protection such as a mask and gloves in case pieces or components break away from the unit under test. Whether the unit is ON or OFF,
Vibration Meter SD Card real-time datalogger
 User's Guide Vibration Meter SD Card real-time datalogger Model SDL800 Introduction Congratulations on your purchase of the Extech SDL800 Vibration Meter. This meter displays and stores vibration readings
SL 200 INTEGRATING-AVERAGING SOUND LEVEL METER
 SL 200 INTEGRATING-AVERAGING SOUND LEVEL METER 1. Introduction SL-200 is a high performance, integrating-averaging sound level meter with an easy-to-use interface for quick and simple measurements. This
RIGOL. Quick Guide. DSA1000 Series Spectrum Analyzer. Nov RIGOL Technologies, Inc
 Quick Guide DSA1000 Series Spectrum Analyzer Nov. 2011 RIGOL Technologies, Inc Copyright 2010 RIGOL Technologies, Inc. All Rights Reserved. Trademark Information RIGOL is registered trademark of RIGOL
DM-918 OPERATIONS MANUAL AUTORANGING MULTIMETER
 DM-918 OPERATIONS MANUAL AUTORANGING MULTIMETER SAFETY INFORMATION The following safety information must be observed to ensure maximum personal safety during the operation of this meter: This meter is
Sound Level Meter SLM700 AUDAC PROFESSIONAL AUDIO EQUIPMENT. Sound Level Meter SLM700. User Manual
 Sound Level Meter SLM700 AUDAC PROFESSIONAL AUDIO EQUIPMENT Sound Level Meter SLM700 User Manual AUDAC PROFESSIONAL AUDIO EQUIPMENT User Manual AUDAC http://www.audac.be info@audac.be Introduction This
Digital Sound Level Meter with USB Model:
 Digital Sound Level Meter with USB Model: 72-947 1 IMPORTANT SAFETY INFORMATION Please read these instructions carefully before use and retain for future reference. Please operate according to this manual,
Digital Sound Level Meter MODEL
 User's Guide Digital Sound Level Meter MODEL 407736 Introduction Congratulations on your purchase of the Extech Model 407736 Digital Sound Level Meter. This meter is shipped fully tested and calibrated
-Direct.com FG-3000 Digital Force Gauge Operation Manual
 FG-3000 Digital Force Gauge Operation Manual Operators should wear protection such as a mask and gloves in case pieces or components break away from the unit under test. Whether the unit is ON or OFF,
One (1) acoustic and three (3) seismic channels. Three (3) component velocity output. All units are interchangeable with accuracy within two percent.
 acoustic and three (3) seismic channels. Three (3) component velocity output. All units are interchangeable with accuracy within two percent.") Chapter 2 Specifications Data Recorded Frequency Response Transducer Microphone Memory Clock Timer Mode Display Keyboard Power On Log Printer Chart Width Chart Length Battery Operating Time External Battery
Chapter 2 Specifications Data Recorded Frequency Response Transducer Microphone Memory Clock Timer Mode Display Keyboard Power On Log Printer Chart Width Chart Length Battery Operating Time External Battery
Calibration. Calibration Overview CHAPTER
 CHAPTER 21 Calibration Calibration Overview Sensitivity Determination The primary role of sound level meter calibration is to establish a numerical relationship between the sound level at the diaphragm
OPERATION MANUAL. SD card real time data Recorder, USB/RS232 SOUND LEVEL METER. Model : SL-4023SD. Your purchase of this
 SD card real time data Recorder, USB/RS232 SOUND LEVEL METER Model : SL-4023SD Your purchase of this SOUND LEVEL METER with SD CARD DATA RECORDER marks a step forward for you into the field of precision
ARTiPRO. User Manual. (Model 910 & 920)
") ARTiPRO User Manual (Model 910 & 920) www.rtihub.com Main Keys & Interfaces 1. Main LCD display 2. / button 1 2 3 4 5 8 6 3. button 4. / button 5. Power & Alert LED 6.
ARTiPRO User Manual (Model 910 & 920) www.rtihub.com Main Keys & Interfaces 1. Main LCD display 2. / button 1 2 3 4 5 8 6 3. button 4. / button 5. Power & Alert LED 6.
ENGLISH. User manual.
 ENGLISH User manual Copyright HT ITALIA 2012 Release EN 2.00-18/12/2012 Table of contents: 1. PRECAUTIONS AND SAFETY MEASURES... 2 1.1. Preliminary instructions... 2 1.2. During use... 3 1.3. After use...
Manual Sound level indicator PCE-353
 PCE Americas Inc. 711 Commerce Way Suite 8 Jupiter FL-33458 USA From outside US: +1 Tel: (561) 320-9162 Fax: (561) 320-9176 info@pce-americas.com PCE Instruments UK Ltd. Units 12/13 Southpoint Business
User's Manual Sound Level Alert Model SL130
 User's Manual Sound Level Alert Model SL130 Meets ANSI and IEC Type 2 Sound Level Meter Standards Settable High Limit with large bright High/Low indication and Alarm Output Wall or Desk mountable Extra
Operating Instructions STX Series Digital Strap Tension Meter
 TENSITRON 733 S. Bowen Street Longmont, CO 80501 USA Phone: (303) 702-1980 Fax: (303) 702-1982 E-mail: sales@tensitron.com Web Site: www.tensitron.com Operating Instructions STX Series Digital Strap Tension
SM-10 SM-20-A. Sound Level Meters. Users Manual. For detailed specifications and ordering info go to
 SM-10 SM-20-A Sound Level Meters Users Manual For detailed specifications and ordering info go to www.testequipmentdepot.com SM-10 / SM-20-A Sound Level Meters English Users Manual SM10_Rev002 2009 Amprobe
Integrating Sound Level Meters LA-5570/5560/2560
 Integrating Sound Level Meters LA-5570/5560/2560 High-functionality Integrating Sound Level Meters Type 1 Sound Level Meters High sensitivity Wide band LA-5570/5560 High-functionality Sound Level Meter
DPM Digital DC Power Meter with Data logging capability. User Manual
 DPM-3232 Digital DC Power Meter with Data logging capability User Manual Introduction As a digital DC power meter, it measures the real time DC Voltage (5-60V), DC Current (0-60A), Watt, and it also displays
testo Sound Level Meter Instruction Manual
 testo 816-1 Sound Level Meter Instruction Manual 2 1 Contents 1 Contents 1 Contents...3 2 Safety and the environment...5 2.1. About this document...5 2.2. Safety...5 2.3. Protecting the environment...6
Digital Sound Level Meter
 User Manual Digital Sound Level Meter MODEL 407736 Additional User Manual Translations available at www.extech.com Introduction Thank you for selecting the Extech Model 407736. This device is shipped fully
SOUND LEVEL METER OPERATION MANUAL. Model : SL Your purchase of this
 SOUND LEVEL METER Model : SL-4012 Your purchase of this SOUND LEVEL METER marks a step forward for you into the field of precision measurement. Although this METER is a complex and delicate instrument,
GE Infrastructure Sensing. Druck DPI 832. Electrical loop calibrator User manual - K393
 GE Infrastructure Sensing Druck DPI 832 Electrical loop calibrator User manual - K393 A1 B1 10 1 A 2 9 A 3 8 2 3 7 6 11 4 5 B1 12 A2 13 15 14 A3 19 18 17 16 27 20 21 22 23 26 24 25 K393 Issue 1 Table of
Universal AC Power Source + AC Power Analyzer
 User's Guide Universal AC Power Source + AC Power Analyzer Model 380820 Introduction Congratulations on your purchase of the Extech Model 380820. This Universal AC Power Source and AC Power Analyzer can
Blaze for SoundTrack LxT. Industrial Hygiene Software Technical Reference Manual
 Blaze for SoundTrack LxT Industrial Hygiene Software Technical Reference Manual Larson Davis Blaze Software for use with the SoundTrack LxT Technical Reference Manual IBLZ.02 Rev E Copyright Copyright
User's Manual. Digital Sound Level Meter. Model
 User's Manual Digital Sound Level Meter Model 407768 Introduction Congratulations on your purchase of the Extech 407768 Sound Level Meter. This Auto Range Sound Level Meter meets ANSI and IEC Type II accuracy
TTC Series Torque Tool Tester Operation Manual
 TTC Series Torque Tool Tester Operation Manual Operators should wear protection such as a mask and gloves in case pieces or components break away from the unit under test. Whether the unit is ON or OFF,
OPERATION MANUAL. Green power, Hybrid power Auto range, A/C weighting SOUND LEVEL METER. Model : SL-4113G. Your purchase of this
 Green power, Hybrid power Auto range, A/C weighting SOUND LEVEL METER Model : SL-4113G Your purchase of this SOUND LEVEL METER marks a step forward for you into the field of precision measurement. Although
Digital Sound Level Meter
 USER MANUAL Digital Sound Level Meter Model SL510 Additional User Manual Translations available at www.extech.com Introduction Thank you for selecting the Extech Model SL510. The SL510 measures sound levels
4-Channel Vibration Datalogger
 User's Guide 99 Washington Street Melrose, MA 02176 Phone 781-665-1400 Toll Free 1-800-517-8431 Visit us at www.testequipmentdepot.com 4-Channel Vibration Datalogger Model VB500 Introduction Congratulations
SOUND LEVEL PEN INSTRUCTION MANUAL SPER SCIENTIFIC
 SOUND LEVEL PEN 840018 INSTRUCTION MANUAL SPER SCIENTIFIC CONTENTS I. Introduction... 2 II. Description... 3 III. Operating Instructions... 4 Precautions and Maintenance.. 4 Calibration... 4-5 Measurement...
Sound Level Meter NL-42 / NL-52 Quick Instruction Manual
 Sound Level Meter NL-42 / NL-52 Quick Instruction Manual (Ver.1.0) Sound Level Meter Class 1 NL-52 Sound Level Meter Class 2 NL-42 RION CO., LTD. Technical Support Division, Sound and Vibration Measuring
OPERATION MANUAL. SD card real time datalogger, RS232/USB VIBRATION METER. Model : VB-8206SD
 SD card real time datalogger, RS232/USB VIBRATION METER Model : VB-8206SD Your purchase of this VIBRATION METER with SD CARD DATALOGGER marks a step forward for you into the field of precision measurement.
True RMS AC Voltage/Current Datalogger
 User's Guide True RMS AC Voltage/Current Datalogger Model DL150 Introduction Congratulations on your purchase of this Voltage or Current datalogger. With this meter, you can monitor and log data over long
I. PANEL DESCRIPTION... 1
 Table of Contents I. PANEL DESCRIPTION... 1 II. OPERATING INSTRUCTION... 7 1. MA OUTPUT... 7 1A. GENERAL OPERATION 4-20MA... 7 1B. SELECT 0-20MA OR 0-24MA... 8 1C. ENTER A VALUE LESS THAN 1... 9 2. % (PERCENTAGE)
OPERATING INSTRUCTION
 OPERATING INSTRUCTION AUTORANGING MULTIMETER MAX Ω F C 10A MAX every 15 min. COM V SAFETY INFORMATION The following safety information must be observed to insure maximum personal safety during the operation
Mini Sound Meter. Instruction Manual SPER SCIENTIFIC
 Mini Sound Meter 850014 Instruction Manual SPER SCIENTIFIC CONTENTS 1. INTRODUCTION... 2 2. PANEL DESCRIPTION... 3 3. OPERATING INSTRUCTIONS... 4 3-A. Measuring Procedures... 4 3-B. Hold Function... 5
CL600 SIMPLE LOGGER RMS CLAMP-ON MODULE E N G L I S H. User Manual
 SIMPLE LOGGER RMS CLAMP-ON MODULE CL600 E N G L I S H User Manual Owner s Record The serial number for the Simple Logger Model CL600 is located on the back of the instrument. Please record this number
12-Channel Thermocouple Datalogger
 User Manual 12-Channel Thermocouple Datalogger Model TM500 Additional User Manual Translations available at www.extech.com Introduction Congratulations on your purchase of the Extech TM500 Thermometer,
DSM403SD USER S MANUAL
 99 Washington Street Melrose, MA 02176 Phone 781-665-1400 Toll Free 1-800-517-8431 Visit us at www.testequipmentdepot.com DSM403SD USER S MANUAL CLASS 1 SOUND LEVEL METER WITH DATALOGGING SD CARD Please
FG-7000 Digital Force Gauge Operation Manual
 FG-7000 Digital Force Gauge Operation Manual Operators should wear protection such as a mask and gloves in case pieces or components break away from the unit under test. Whether the unit is ON or OFF,
Sound Level Pen Instruction Manual
 Sound Level Pen 840018 Instruction Manual TABLE OF CONTENTS 1. INTRODUCTION...................2 2. DESCRIPTION.................... 3 3. OPERATING INSTRUCTIONS........... 4 PRECAUTIONS AND MAINTENANCE.......4
ACTIONI/Q Q498. DC Powered DC Input Field Configurable Isolator with Math Functions
 ACTIONI/Q Q498 DC Powered DC Input Field Configurable Isolator with Math Functions Q498-0000 Provides 2 Isolated Analog Inputs, 1 Analog Output & 1 Frequency Output, as well as a Discrete Input & Output
Hygro-Thermometer / Datalogger
 USER GUIDE Hygro-Thermometer / Datalogger Model SDL500 Introduction Congratulations on your purchase of the Extech SDL500 Hygro-Thermometer, an SD Logger Series meter. This meter displays and stores Temperature
HCC-CW-201A. CWDM Analyzer. Operation Guide
 CWDM Analyzer Operation Guide Table of Contents Description... 3 Features... 3 Specifications... 4 Safety Information... 5 Preparing for Operation... 6 Unpacking the instrument... 6 Front keys definition...
Digital Sound Level Meter. Operation Manual
 Digital Sound Level Meter Operation Manual Contents Ⅰ. Preface...1 Ⅱ. Safety information 1 Ⅲ. Functions & Features...1 Ⅳ. Specifications.....3 Ⅴ. Preparation before using.. 5 Ⅵ. The method of usage.....5
Operating Instructions LX-Series Digital Tension Meter
 TENSITRON 733 S. Bowen Street Longmont, CO 80501 USA Phone: (303) 702-1980 Fax: (303) 702-1982 E-mail: sales@tensitron.com Web Site: www.tensitron.com Operating Instructions LX-Series Digital Tension Meter
DLRO 200 High Current, Low Resistance Ohmmeter
 M DLRO 200 High Current, Low Resistance Ohmmeter USER MANUAL GSAFETY WARNINGS THESE SAFETY WARNINGS MUST BE READ AND UNDERSTOOD BEFORE THE INSTRUMENT IS USED. n DLRO200 is supplied without a plug terminating
RADI-CEM. User manual. MPB S.r.l. Via Giacomo Peroni 400/ Rome - Italy. Tel Fax
 MPB S.r.l. Via Giacomo Peroni 400/402 00131 Rome - Italy Tel +39 0641200744 Fax +39 0641200653 info@gruppompb.com www.gruppompb.uk.com User manual RADI-CEM Updated to the Software Version: 0.01 Updated
HDT-318 Thermo-Hygrometer with Data Logger. (Air Humidity/Temperature) Instruction Manual
 Instruction Manual") HDT-318 Thermo-Hygrometer with Data Logger (Air Humidity/Temperature) Instruction Manual CONTENTS 1. SAFETY INFORMATION... 2 2. GENERAL DESCRIPTION... 2 3. FEATURES... 2 4. SPECIFICATIONS... 3 5. SYMBOL
HDT-318 Thermo-Hygrometer with Data Logger (Air Humidity/Temperature) Instruction Manual CONTENTS 1. SAFETY INFORMATION... 2 2. GENERAL DESCRIPTION... 2 3. FEATURES... 2 4. SPECIFICATIONS... 3 5. SYMBOL
OPERATION MANUAL. separate probe, RS-232 SOUND LEVEL METER. Model : SL-4013
 separate probe, RS-232 SOUND LEVEL METER Model : SL-4013 Your purchase of this SOUND LEVEL METER marks a step forward for you into the field of precision measurement. Although this SOUND LEVEL METER is
IV-18 (ИВ-18) VFD Tube Clock. Instructions. Contents. v Energy Pillar
 VFD Tube Clock. Instructions. Contents. v Energy Pillar") IV-18 (ИВ-18) VFD Tube Clock Energy Pillar Instructions v1.2.0 Designer: Yan Zeyuan. China Website: E-mail: yanzeyuan@163.com Contents Attention..... 2 Functional Features.. 2 Technical Specifications....
IV-18 (ИВ-18) VFD Tube Clock Energy Pillar Instructions v1.2.0 Designer: Yan Zeyuan. China Website: E-mail: yanzeyuan@163.com Contents Attention..... 2 Functional Features.. 2 Technical Specifications....
Practical and Compact!
 Practical and Compact! 4ch Data Recorder 8ch Data Recorder Practical and Compact! Direct connection of Sound and Vibration Sensors 50 mm 210 mm 270 mm 8ch Data Recorder Sensitivity calibration of microphones
DPM-3221 Digital DC Power Meter with data logging capability.
 Introduction DPM-3221 Digital DC Power Meter with data logging capability. User Manual As a digital DC power meter, it measures the real time DC Voltage (5-60V), DC Current (0-200 A with the correct shunt),
TENMA INSTRUCTION MANUAL MULTI-TESTER
 TENMA 72-9165 INSTRUCTION MANUAL MULTI-TESTER 6 IN 1 SOUND LEVEL LIGHT HUMIDITY TEMPERATUPRE MULTIMETER Non-contact AC Voltage Test TABLET OF CONTENTS 1. INTRODUCTION 2 2. INFORMATION FOR SAFETY 3 3. FEATURES
OPERATION MANUAL. auto range + type K Temp. optional Humidity, Light, Anemometer SOUND LEVEL METER Model : SL-4112
 auto range + type K Temp. optional Humidity, Light, Anemometer SOUND LEVEL METER Model : SL-4112 Your purchase of this SOUND LEVEL METER marks a step forward for you into the field of precision measurement.
Integrating Sound Level Meter. LA-4440 (Class 1) LA-1410 (Class 2) /LA-1440 (Class 2)
 LA-1410 (Class 2) /LA-1440 (Class 2)") Integrating Sound Level Meter LA-4440 (Class 1) LA-1410 (Class 2) /LA-1440 (Class 2) Focusing on field measurement with versatile functions, New LA LA-1400 / 4400 series integrating sound level meters
Integrating Sound Level Meter LA-4440 (Class 1) LA-1410 (Class 2) /LA-1440 (Class 2) Focusing on field measurement with versatile functions, New LA LA-1400 / 4400 series integrating sound level meters
INSTRUCTION MANUAL. Portable Vibrometer: VM-3024S/H IMV CORPORATION
 INSTRUCTION MANUAL Portable Vibrometer: VM-3024S/H IMV CORPORATION Document Number TVE-6-3790 I s s u a n c e D a t e December 21, 2012 V e r s i o n 1.5.0 Pages (Incl. Cover) 39 Revision History Date
Pocket type SOUND LEVEL METER Model : SL-4030
 Pocket type SOUND LEVEL METER Model : SL-4030 TABLE OF CONTENTS 1 FEATURES...1 2 SPECIFICATIONS...2 3 FRONT PANEL DESCRIPTION... 4 3-1 Electric condenser microphone... 4 3-2 Display...4 3-3 Power switch
TURNKEY idb OPERATING INSTRUCTIONS
 TURNKEY idb OPERATING INSTRUCTIONS The following associated documentation is available from www.ivibe.uk/idb idb Outdoor Installation instructions idb Indoor Installation Installing the Power Portal for
Autoranging True RMS Multimeter User Manual
 Autoranging True RMS Multimeter User Manual Please read this manual before switching the unit on. Important safety information inside. Contents Page 1. Safety Information... 4 2. Safety Symbols... 5 3.