Machine Learning Methods in Visualisation for Big Data 2018
|
|
|
- Emery Garrison
- 5 years ago
- Views:
Transcription


1 Machine Learning Methods in Visualisation for Big Data 2018 Daniel Archambault1 Ian Nabney2 Jaakko Peltonen3 1 Swansea University 2 University of Bristol 3 University of Tampere, Aalto University
2 Evaluating Visualisation Techniques Why is evaluation difficult but important? User-based evaluation: perceptual/subjective evaluation, study design Metric-based evaluation Model-based metrics and their limitations Unsupervised learning metrics Task-based metrics 2
3 Why is evaluation important? There is a need to compare the quality of different visualisations This matters to algorithm developers to demonstrate the value (or lack of it) of new techniques This matters to practitioners since they are likely to generate multiple visualisations (parameter settings, different visualisation methods), sometimes in the thousands, and need to choose between them or guide the process of visualisation. This relates to automation or semi-automation of analysis process. We focus on the use of evaluation in high-dimensional data analysis 3

4 Visualization pipeline Quality metrics can be calculated in the data space, image space or a combination of the two. Metrics calculated at the View stage draw information from the rendered image, whereas the others draw information from the data space and elements of the visual structures Quality metrics generate help evaluate alternatives. Metrics do not replace the user. Indeed, the whole purpose of data visualization is to aid a human user in data analysis. 4

5 How evaluation can guide visualisation Clutter reduction through axes reordering in a scatterplot matrix. (Peng et al. 2004). 5
6 Categories of usability Expressiveness and semantic quality of visualization: usability of visual representation Interface usability: interaction mechanisms Data usability: quality of data supporting users task
7 Why is evaluation difficult? Dimensionality reduction is an inherently unsupervised task there is no ground truth or gold standard. There is no single globally correct definition of what quality means. There is a wide variety of dimensionality reduction methods with different assumptions and modelling approaches How can we tell? Not many papers on the subject! 7
8 Semi-Supervised Models In a supervised task we know the outcome for each example (e.g. a class or continuous value) and we try to develop a model that can predict that outcome. Classification or regression In an unsupervised task we have data, but no variable represents a single outcome for each example and we try to develop a model that looks for groups in the data. Clustering or visualisation In some unsupervised tasks we want a target variable to influence the output: semi-supervised or relative supervision. 8
9 Supervised Task: Classification Learn a method for predicting the instance class from pre-labeled (classified) instances 9

10 Unsupervised Models Find natural grouping of instances given unlabelled data 10
11 Models GTM GPLVM Neuroscale
12 Metric learning Many statistical methods rely on distances as much or more than they do on feature values: nearest neighbor regression/classification uses distances to find the nearest neighbors many clustering approaches such as k-means use distances as part of the algorithm to optimize the clustering in information retrieval, best results are often the ones most similar to the query according to some distance Dimensionality reduction methods such as multidimensional scaling, Sammon mapping, Self-organizing maps, Stochastic Neigbor Embedding, Neighbor Retrieval Visualizer, and others are distance-based In many cases distances from a new distance function can be just plugged in to dimensionality reduction methods. (In some cases more is needed.) 12
13 Topographic Mappings Basic aim is that distances in the visualisation space are as close a possible to those in original data space. Given a dissimilarity matrix we want to map data points x_i to points y_i in a feature space such that their dissimilarities are as close as possible to The map is said to preserve similarities. The stress measure is used as objective function. 13
14 Multi-dimensional Scaling Given distances or dissimilarities between every pair of observations try to preserve these as far as possible in lowerdimensional space. In classical scaling, the distance between the objects is assumed to be Euclidean. A linear projection then corresponds to PCA. The Sammon mapping is a non-linear multidimensional scaling technique more general (and more widely used) than classical scaling. Neuroscale is a neural network based scaling technique that has the advantage of actually giving a map that generalises! 14

15 Neuroscale 15
16 Subjective metrics Modify the stress measure:. Inter-point distances for pairs of points in different classes are modified by the addition of some constant term k, such that their separation should be exaggerated in the resultant map. Other formulations are possible can use a dissimilarity matrix for classes or distance for an auxiliary continuous variable. The relative weight of objective and subjective elements can be controlled by a parameter. 16

17 Neuroscale Operation 17
18 Generative Topographic Mapping Mapping from latent space to data space A thick rubber sheet studded with tennis balls. GTM defines p(y x;w); use Bayes theorem to compute p(x y*;w) for a given point y* in data space. 18
19 Algorithm EM algorithm involves expectation (E-step): extend this to missing values as well as missing kernel. GTM model uses spherical covariance, hence this inference is quite uninformative Class membership (if available) can provide more accurate inference. 19
20 Evaluation depends on purpose Use visualization both for specific tasks but also datadriven hypothesis formation. Metric should measure what the user requires the visualization for: Accurate representation of data point relationships (local/global) Good class separation: clustering (many types) Identification of outliers Reduction of noise Understanding data perception of data characteristics Choosing how to represent data 20
21 User-based evaluation Evaluating user performance Evaluating user experience How large is the search space? How many users do you need? Richer qualitative data (e.g. reaction cards, choosing cards/words to reflect UX) Humans not good at quantifying what they see (e.g. is one plot more structured than another?). 21
22 User study (Pillat, 2005) Compare parallel coordinates and Radviz Taxonomy of user tasks Car dataset from Statlib: 392 records; 7 attributes Tasks: outliers, clusters, class (origin) Four questions and qualitative feedback Five graduate students in study
23 Study Set-up A within-groups, counter-balanced study protocol in which each participant used both our immersive and our non-immersive visualisation environment to complete a set of prescribed tasks. The order in which participants were exposed to the different visualisation environments was counter-balanced to mitigate against the effects of learning i.e., half of the participants used the immersive environment first and then the non-immersive environment, with the other half using the environments in the opposite order. Use of different seeds enabled us to generate non-identical datasets of similar properties. 23
24 Task Definition Participants were shown the first dataset and asked to identify by entering the reference for the centre point as many clusters as they believed were present. Described, in free text, the clustering within the dataset. Also asked to identify again by reference as many outliers as they believed were present in the data. It was left up to the participants to define/interpret what constituted a cluster and an outlier. Repeated for a second dataset. Participants also asked to identify changes between two datasets from four choices. Completed a paper-based NASA TLX1 questionnaire to reflect on the workload associated with the visualisation environment. 24 participants: 17 valid records. No difference in outlier detection. 24

25 Cluster Identification 8 clusters: average identified in immersive was 4.5; non-immersive was


26 Cluster Identification Accuracy Next considered average distance to cluster centre. Excluded outlier rest has a normal distribution. Two-sample t-test was significant (p<10-4). Being able to immerse oneself within a complex dataset increases one s ability to accurately identify data points relative to the spatial location of clusters. 26
 of the participants using the immersive environment could accurately detect the changes in a dataset compared to")
27 Dataset Changes Almost half (47.1%) of the participants using the immersive environment could accurately detect the changes in a dataset compared to less than one quarter (23.5%) of participants using the non-immersive environment. 27
, but this was not statistically significant (p=0.622).")
28 Speed of Analysis Took slightly longer to complete tasks using the immersive environment (average of 1117s compared to an average of 1039s), but this was not statistically significant (p=0.622). 28

29 Subjective Response Of those that responded, 82.6% stated a preference for the immersive environment, 73.9% stated that the immersive environment was more enjoyable, 90% stated that the immersive environment was more effective than the non-immersive environment. 29
30 Conclusions Immersive environment does not reduce the time taken to analyse complex sets of 3D data. It does show potential for supporting users to achieve increased accuracy in data point identification/selection increased ability to visually record and retain dataset patterns and to then accurately identify changes in the data. It also shows potential for reducing the workload associated with complex 3D data analysis activities eliciting a better subjective response from users an important factor in attaining user acceptance and adoption of a technology. 30
31 Metric-based evaluation Model-based evaluation Unsupervised learning metrics Task-based metrics 31
32 Model-based evaluation Most models have an associated cost function Neuroscale, MDS: stress PCA: variance GTM, GPLVM, probabilistic PCA: log likelihood But: Some models don t have a cost function (SOM) Cost functions are incompatible Need some form of regularisation to compare different architectures/parameter spaces So, only enough when comparing a relatively narrow set of possible models 32
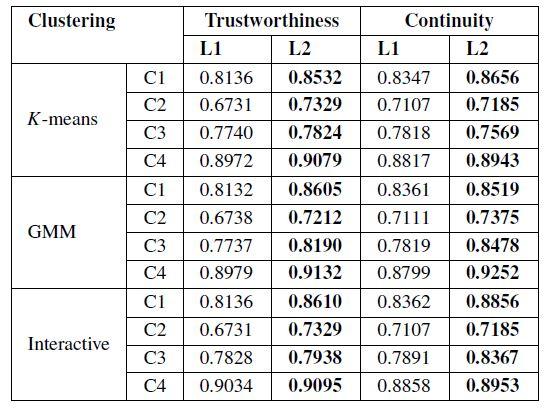
33 Unsupervised learning metrics Stress can always be calculated but is it always relevant? (Alternative is to measure correlation of data and visualization space distances). Metrics that take account of local neighbourhood preservation Visualization Distance Distortion: compute k nearest neighbours for each point and measure the relative stress (or similar) for these points Trustworthiness measures the fraction of data points distant in the data space that become neighbours in the projection space Continuity measures the fraction of neighbouring data points in the data space become distant in the projection space. Mean relative ranks in data and latent space are similar, but consider weighted rankings of neighbourhood points. 33
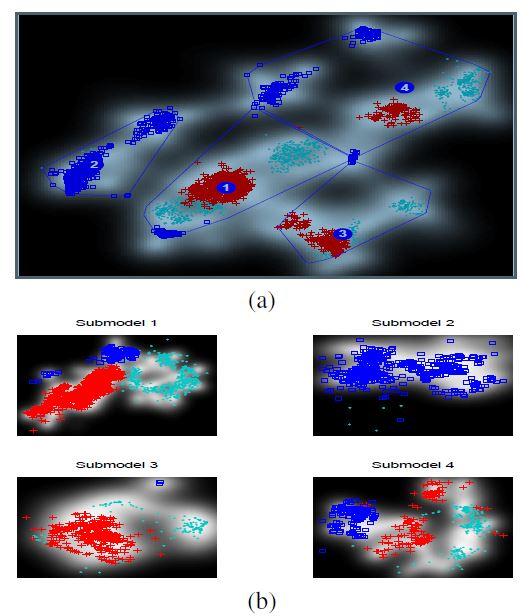
34 Example: hierarchical visualization
35 Task-based metrics Objective metrics based on task to be performed, but without the use of trials or subjective experiments These metrics often work best in a semi-supervised way: with additional class information For example if we want the visualization to tell us about class separation, need a measure of class separation in the visualization space If we want the visualization to preserve class information, use the nearest-neighbour classification error (in visualization space) normalised by value in data space 35
36 Cluster quality Ranking projections according to class density measure favouring projections with minimal overlap between classes: image processing algorithm to detect clusters. (Tatu et al. 2009) Detection of clusters using image processing is highly non-trivial 36


37 Agusta Westland: airframe monitoring 8 sensors measuring vibration; 108 frequency bands

38 Metrics Known classes corresponding to flight modes Fit a Gaussian mixture model (GMM) to each class in visualization space. Use a variational Bayesian to automate model complexity Compute Kullback-Leibler distance between all possible class pairs GMMs as a measure of overall class separation.
39 Conclusions Challenging because no ground truth Task-based metrics acknowledge the purpose of visualization, but tend to be harder to make objective Important to study the correlation between task performance metrics (as carried out by humans) and quantitative task-based metrics Common question asked by practitioners, so important to make progress
40 References E. Bertini, A. Tatu, and D. A. Keim, Quality Metrics in High-Dimensional Data Visualization: An Overview and Systematization, IEEE Trans. on Visualization and Computer Graphics, 17, , D. A. Keim, H-P. Kriegel, Visualization Techniques for Mining Large Databases: A Comparison, IEEE Trans. on Knowledge and Data Engineering, 8, , R. Etemadpour, R. Motta, J. G. S. Paiva, R. Minghim, M. C. F. De Oliveira, L. Linsen, Perception-Based Evaluation of Projection Methods for Multidimensional Data Visualization, IEEE Trans. on Visualization and Computer Graphics, 21, 81-94,
Understanding Clustering Supervising the unsupervised
 Understanding Clustering Supervising the unsupervised Janu Verma IBM T.J. Watson Research Center, New York http://jverma.github.io/ jverma@us.ibm.com @januverma Clustering Grouping together similar data
Exploratory Data Analysis using Self-Organizing Maps. Madhumanti Ray
 Exploratory Data Analysis using Self-Organizing Maps Madhumanti Ray Content Introduction Data Analysis methods Self-Organizing Maps Conclusion Visualization of high-dimensional data items Exploratory data
Unsupervised Learning
 Networks for Pattern Recognition, 2014 Networks for Single Linkage K-Means Soft DBSCAN PCA Networks for Kohonen Maps Linear Vector Quantization Networks for Problems/Approaches in Machine Learning Supervised
MTTTS17 Dimensionality Reduction and Visualization. Spring 2018 Jaakko Peltonen. Lecture 11: Neighbor Embedding Methods continued
 MTTTS17 Dimensionality Reduction and Visualization Spring 2018 Jaakko Peltonen Lecture 11: Neighbor Embedding Methods continued This Lecture Neighbor embedding by generative modeling Some supervised neighbor
Machine Learning and Data Mining. Clustering (1): Basics. Kalev Kask
: Basics. Kalev Kask") Machine Learning and Data Mining Clustering (1): Basics Kalev Kask Unsupervised learning Supervised learning Predict target value ( y ) given features ( x ) Unsupervised learning Understand patterns of
Machine Learning and Data Mining Clustering (1): Basics Kalev Kask Unsupervised learning Supervised learning Predict target value ( y ) given features ( x ) Unsupervised learning Understand patterns of
Classification. Vladimir Curic. Centre for Image Analysis Swedish University of Agricultural Sciences Uppsala University
 Classification Vladimir Curic Centre for Image Analysis Swedish University of Agricultural Sciences Uppsala University Outline An overview on classification Basics of classification How to choose appropriate
Data Preprocessing. Javier Béjar. URL - Spring 2018 CS - MAI 1/78 BY: $\
 Data Preprocessing Javier Béjar BY: $\ URL - Spring 2018 C CS - MAI 1/78 Introduction Data representation Unstructured datasets: Examples described by a flat set of attributes: attribute-value matrix Structured
Machine Learning and Visualisation
 Machine Learning and Visualisation Ian T. Nabney Aston University, Birmingham, UK March 2015 Ian T. Nabney Machine Learning and Visualisation 1/45 Outline The challenge of hidden knowledge Data visualisation:
CSE 6242 A / CS 4803 DVA. Feb 12, Dimension Reduction. Guest Lecturer: Jaegul Choo
 CSE 6242 A / CS 4803 DVA Feb 12, 2013 Dimension Reduction Guest Lecturer: Jaegul Choo CSE 6242 A / CS 4803 DVA Feb 12, 2013 Dimension Reduction Guest Lecturer: Jaegul Choo Data is Too Big To Do Something..
Intro to Artificial Intelligence
 Intro to Artificial Intelligence Ahmed Sallam { Lecture 5: Machine Learning ://. } ://.. 2 Review Probabilistic inference Enumeration Approximate inference 3 Today What is machine learning? Supervised
Bioinformatics - Lecture 07
 Bioinformatics - Lecture 07 Bioinformatics Clusters and networks Martin Saturka http://www.bioplexity.org/lectures/ EBI version 0.4 Creative Commons Attribution-Share Alike 2.5 License Learning on profiles
Further Applications of a Particle Visualization Framework
 Further Applications of a Particle Visualization Framework Ke Yin, Ian Davidson Department of Computer Science SUNY-Albany 1400 Washington Ave. Albany, NY, USA, 12222. Abstract. Our previous work introduced
CIE L*a*b* color model
 CIE L*a*b* color model To further strengthen the correlation between the color model and human perception, we apply the following non-linear transformation: with where (X n,y n,z n ) are the tristimulus
What is machine learning?
 Machine learning, pattern recognition and statistical data modelling Lecture 12. The last lecture Coryn Bailer-Jones 1 What is machine learning? Data description and interpretation finding simpler relationship
Using Statistical Techniques to Improve the QC Process of Swell Noise Filtering
 Using Statistical Techniques to Improve the QC Process of Swell Noise Filtering A. Spanos* (Petroleum Geo-Services) & M. Bekara (PGS - Petroleum Geo- Services) SUMMARY The current approach for the quality
CPSC 340: Machine Learning and Data Mining. Multi-Dimensional Scaling Fall 2017
 CPSC 340: Machine Learning and Data Mining Multi-Dimensional Scaling Fall 2017 Assignment 4: Admin 1 late day for tonight, 2 late days for Wednesday. Assignment 5: Due Monday of next week. Final: Details
Data Mining Chapter 9: Descriptive Modeling Fall 2011 Ming Li Department of Computer Science and Technology Nanjing University
 Data Mining Chapter 9: Descriptive Modeling Fall 2011 Ming Li Department of Computer Science and Technology Nanjing University Descriptive model A descriptive model presents the main features of the data
10/14/2017. Dejan Sarka. Anomaly Detection. Sponsors
 Dejan Sarka Anomaly Detection Sponsors About me SQL Server MVP (17 years) and MCT (20 years) 25 years working with SQL Server Authoring 16 th book Authoring many courses, articles Agenda Introduction Simple
10601 Machine Learning. Hierarchical clustering. Reading: Bishop: 9-9.2
 161 Machine Learning Hierarchical clustering Reading: Bishop: 9-9.2 Second half: Overview Clustering - Hierarchical, semi-supervised learning Graphical models - Bayesian networks, HMMs, Reasoning under
Dimension Reduction CS534
 Dimension Reduction CS534 Why dimension reduction? High dimensionality large number of features E.g., documents represented by thousands of words, millions of bigrams Images represented by thousands of
Unsupervised Learning: Clustering
 Unsupervised Learning: Clustering Vibhav Gogate The University of Texas at Dallas Slides adapted from Carlos Guestrin, Dan Klein & Luke Zettlemoyer Machine Learning Supervised Learning Unsupervised Learning
Network Traffic Measurements and Analysis
 DEIB - Politecnico di Milano Fall, 2017 Introduction Often, we have only a set of features x = x 1, x 2,, x n, but no associated response y. Therefore we are not interested in prediction nor classification,
Machine Learning for OR & FE
 Machine Learning for OR & FE Unsupervised Learning: Clustering Martin Haugh Department of Industrial Engineering and Operations Research Columbia University Email: martin.b.haugh@gmail.com (Some material
Quality Metrics for Visual Analytics of High-Dimensional Data
 Quality Metrics for Visual Analytics of High-Dimensional Data Daniel A. Keim Data Analysis and Information Visualization Group University of Konstanz, Germany Workshop on Visual Analytics and Information
9.1. K-means Clustering
 424 9. MIXTURE MODELS AND EM Section 9.2 Section 9.3 Section 9.4 view of mixture distributions in which the discrete latent variables can be interpreted as defining assignments of data points to specific
Grundlagen der Künstlichen Intelligenz
 Grundlagen der Künstlichen Intelligenz Unsupervised learning Daniel Hennes 29.01.2018 (WS 2017/18) University Stuttgart - IPVS - Machine Learning & Robotics 1 Today Supervised learning Regression (linear
Artificial Neural Networks Unsupervised learning: SOM
 Artificial Neural Networks Unsupervised learning: SOM 01001110 01100101 01110101 01110010 01101111 01101110 01101111 01110110 01100001 00100000 01110011 01101011 01110101 01110000 01101001 01101110 01100001
University of Cambridge Engineering Part IIB Paper 4F10: Statistical Pattern Processing Handout 11: Non-Parametric Techniques
 University of Cambridge Engineering Part IIB Paper 4F10: Statistical Pattern Processing Handout 11: Non-Parametric Techniques Mark Gales mjfg@eng.cam.ac.uk Michaelmas 2015 11. Non-Parameteric Techniques
Statistical Analysis of Metabolomics Data. Xiuxia Du Department of Bioinformatics & Genomics University of North Carolina at Charlotte
 Statistical Analysis of Metabolomics Data Xiuxia Du Department of Bioinformatics & Genomics University of North Carolina at Charlotte Outline Introduction Data pre-treatment 1. Normalization 2. Centering,
CSE 6242 A / CX 4242 DVA. March 6, Dimension Reduction. Guest Lecturer: Jaegul Choo
 CSE 6242 A / CX 4242 DVA March 6, 2014 Dimension Reduction Guest Lecturer: Jaegul Choo Data is Too Big To Analyze! Limited memory size! Data may not be fitted to the memory of your machine! Slow computation!
CHAPTER 4: CLUSTER ANALYSIS
 CHAPTER 4: CLUSTER ANALYSIS WHAT IS CLUSTER ANALYSIS? A cluster is a collection of data-objects similar to one another within the same group & dissimilar to the objects in other groups. Cluster analysis
High throughput Data Analysis 2. Cluster Analysis
 High throughput Data Analysis 2 Cluster Analysis Overview Why clustering? Hierarchical clustering K means clustering Issues with above two Other methods Quality of clustering results Introduction WHY DO
Assignment 4 (Sol.) Introduction to Data Analytics Prof. Nandan Sudarsanam & Prof. B. Ravindran
 Introduction to Data Analytics Prof. Nandan Sudarsanam & Prof. B. Ravindran") Assignment 4 (Sol.) Introduction to Data Analytics Prof. andan Sudarsanam & Prof. B. Ravindran 1. Which among the following techniques can be used to aid decision making when those decisions depend upon
Assignment 4 (Sol.) Introduction to Data Analytics Prof. andan Sudarsanam & Prof. B. Ravindran 1. Which among the following techniques can be used to aid decision making when those decisions depend upon
Generative and discriminative classification techniques
 Generative and discriminative classification techniques Machine Learning and Category Representation 2014-2015 Jakob Verbeek, November 28, 2014 Course website: http://lear.inrialpes.fr/~verbeek/mlcr.14.15
Introduction to Machine Learning CMU-10701
 Introduction to Machine Learning CMU-10701 Clustering and EM Barnabás Póczos & Aarti Singh Contents Clustering K-means Mixture of Gaussians Expectation Maximization Variational Methods 2 Clustering 3 K-
Unsupervised Learning
 Unsupervised Learning Pierre Gaillard ENS Paris September 28, 2018 1 Supervised vs unsupervised learning Two main categories of machine learning algorithms: - Supervised learning: predict output Y from
Courtesy of Prof. Shixia University
 Courtesy of Prof. Shixia Liu @Tsinghua University Outline Introduction Classification of Techniques Table Scatter Plot Matrices Projections Parallel Coordinates Summary Motivation Real world data contain
Information Retrieval and Organisation
 Information Retrieval and Organisation Chapter 16 Flat Clustering Dell Zhang Birkbeck, University of London What Is Text Clustering? Text Clustering = Grouping a set of documents into classes of similar
NeuroScale: Novel Topographic Feature Extraction using RBF Networks
 NeuroScale: Novel Topographic Feature Extraction using RBF Networks David Lowe D.LoweOaston.ac.uk Michael E. Tipping H.E.TippingOaston.ac.uk Neural Computing Research Group Aston University, Aston Triangle,
Overview Citation. ML Introduction. Overview Schedule. ML Intro Dataset. Introduction to Semi-Supervised Learning Review 10/4/2010
 INFORMATICS SEMINAR SEPT. 27 & OCT. 4, 2010 Introduction to Semi-Supervised Learning Review 2 Overview Citation X. Zhu and A.B. Goldberg, Introduction to Semi- Supervised Learning, Morgan & Claypool Publishers,
Machine Learning in the Wild. Dealing with Messy Data. Rajmonda S. Caceres. SDS 293 Smith College October 30, 2017
 Machine Learning in the Wild Dealing with Messy Data Rajmonda S. Caceres SDS 293 Smith College October 30, 2017 Analytical Chain: From Data to Actions Data Collection Data Cleaning/ Preparation Analysis
Homework. Gaussian, Bishop 2.3 Non-parametric, Bishop 2.5 Linear regression Pod-cast lecture on-line. Next lectures:
 Homework Gaussian, Bishop 2.3 Non-parametric, Bishop 2.5 Linear regression 3.0-3.2 Pod-cast lecture on-line Next lectures: I posted a rough plan. It is flexible though so please come with suggestions Bayes
K-Means Clustering 3/3/17
 K-Means Clustering 3/3/17 Unsupervised Learning We have a collection of unlabeled data points. We want to find underlying structure in the data. Examples: Identify groups of similar data points. Clustering
Cluster Analysis. Mu-Chun Su. Department of Computer Science and Information Engineering National Central University 2003/3/11 1
 Cluster Analysis Mu-Chun Su Department of Computer Science and Information Engineering National Central University 2003/3/11 1 Introduction Cluster analysis is the formal study of algorithms and methods
Preface to the Second Edition. Preface to the First Edition. 1 Introduction 1
 Preface to the Second Edition Preface to the First Edition vii xi 1 Introduction 1 2 Overview of Supervised Learning 9 2.1 Introduction... 9 2.2 Variable Types and Terminology... 9 2.3 Two Simple Approaches
Unsupervised learning in Vision
 Chapter 7 Unsupervised learning in Vision The fields of Computer Vision and Machine Learning complement each other in a very natural way: the aim of the former is to extract useful information from visual
Unsupervised Learning
 Unsupervised Learning Learning without Class Labels (or correct outputs) Density Estimation Learn P(X) given training data for X Clustering Partition data into clusters Dimensionality Reduction Discover
Machine Learning. Unsupervised Learning. Manfred Huber
 Machine Learning Unsupervised Learning Manfred Huber 2015 1 Unsupervised Learning In supervised learning the training data provides desired target output for learning In unsupervised learning the training
Clustering Lecture 5: Mixture Model
 Clustering Lecture 5: Mixture Model Jing Gao SUNY Buffalo 1 Outline Basics Motivation, definition, evaluation Methods Partitional Hierarchical Density-based Mixture model Spectral methods Advanced topics
A Taxonomy of Semi-Supervised Learning Algorithms
 A Taxonomy of Semi-Supervised Learning Algorithms Olivier Chapelle Max Planck Institute for Biological Cybernetics December 2005 Outline 1 Introduction 2 Generative models 3 Low density separation 4 Graph
COMP 551 Applied Machine Learning Lecture 13: Unsupervised learning
 COMP 551 Applied Machine Learning Lecture 13: Unsupervised learning Associate Instructor: Herke van Hoof (herke.vanhoof@mail.mcgill.ca) Slides mostly by: (jpineau@cs.mcgill.ca) Class web page: www.cs.mcgill.ca/~jpineau/comp551
SOCIAL MEDIA MINING. Data Mining Essentials
 SOCIAL MEDIA MINING Data Mining Essentials Dear instructors/users of these slides: Please feel free to include these slides in your own material, or modify them as you see fit. If you decide to incorporate
3. Multidimensional Information Visualization II Concepts for visualizing univariate to hypervariate data
 3. Multidimensional Information Visualization II Concepts for visualizing univariate to hypervariate data Vorlesung Informationsvisualisierung Prof. Dr. Andreas Butz, WS 2009/10 Konzept und Basis für n:
Chapter 10. Conclusion Discussion
 Chapter 10 Conclusion 10.1 Discussion Question 1: Usually a dynamic system has delays and feedback. Can OMEGA handle systems with infinite delays, and with elastic delays? OMEGA handles those systems with
CSE 6242 / CX October 9, Dimension Reduction. Guest Lecturer: Jaegul Choo
 CSE 6242 / CX 4242 October 9, 2014 Dimension Reduction Guest Lecturer: Jaegul Choo Volume Variety Big Data Era 2 Velocity Veracity 3 Big Data are High-Dimensional Examples of High-Dimensional Data Image
An Experiment in Visual Clustering Using Star Glyph Displays
 An Experiment in Visual Clustering Using Star Glyph Displays by Hanna Kazhamiaka A Research Paper presented to the University of Waterloo in partial fulfillment of the requirements for the degree of Master
Experimental Analysis of GTM
 Experimental Analysis of GTM Elias Pampalk In the past years many different data mining techniques have been developed. The goal of the seminar Kosice-Vienna is to compare some of them to determine which
Note Set 4: Finite Mixture Models and the EM Algorithm
 Note Set 4: Finite Mixture Models and the EM Algorithm Padhraic Smyth, Department of Computer Science University of California, Irvine Finite Mixture Models A finite mixture model with K components, for
Unsupervised Learning
 Unsupervised Learning Unsupervised learning Until now, we have assumed our training samples are labeled by their category membership. Methods that use labeled samples are said to be supervised. However,
CS 229 Midterm Review
 CS 229 Midterm Review Course Staff Fall 2018 11/2/2018 Outline Today: SVMs Kernels Tree Ensembles EM Algorithm / Mixture Models [ Focus on building intuition, less so on solving specific problems. Ask
Clustering and Visualisation of Data
 Clustering and Visualisation of Data Hiroshi Shimodaira January-March 28 Cluster analysis aims to partition a data set into meaningful or useful groups, based on distances between data points. In some
CIS 520, Machine Learning, Fall 2015: Assignment 7 Due: Mon, Nov 16, :59pm, PDF to Canvas [100 points]
![CIS 520, Machine Learning, Fall 2015: Assignment 7 Due: Mon, Nov 16, :59pm, PDF to Canvas [100 points]](/thumbs/89/100746783.jpg "CIS 520, Machine Learning, Fall 2015: Assignment 7 Due: Mon, Nov 16, :59pm, PDF to Canvas [100 points]") CIS 520, Machine Learning, Fall 2015: Assignment 7 Due: Mon, Nov 16, 2015. 11:59pm, PDF to Canvas [100 points] Instructions. Please write up your responses to the following problems clearly and concisely.
CIS 520, Machine Learning, Fall 2015: Assignment 7 Due: Mon, Nov 16, 2015. 11:59pm, PDF to Canvas [100 points] Instructions. Please write up your responses to the following problems clearly and concisely.
Content-based image and video analysis. Machine learning
 Content-based image and video analysis Machine learning for multimedia retrieval 04.05.2009 What is machine learning? Some problems are very hard to solve by writing a computer program by hand Almost all
Introduction to digital image classification
 Introduction to digital image classification Dr. Norman Kerle, Wan Bakx MSc a.o. INTERNATIONAL INSTITUTE FOR GEO-INFORMATION SCIENCE AND EARTH OBSERVATION Purpose of lecture Main lecture topics Review
( ) =cov X Y = W PRINCIPAL COMPONENT ANALYSIS. Eigenvectors of the covariance matrix are the principal components
 =cov X Y = W PRINCIPAL COMPONENT ANALYSIS. Eigenvectors of the covariance matrix are the principal components") Review Lecture 14 ! PRINCIPAL COMPONENT ANALYSIS Eigenvectors of the covariance matrix are the principal components 1. =cov X Top K principal components are the eigenvectors with K largest eigenvalues
Review Lecture 14 ! PRINCIPAL COMPONENT ANALYSIS Eigenvectors of the covariance matrix are the principal components 1. =cov X Top K principal components are the eigenvectors with K largest eigenvalues
Week 7 Picturing Network. Vahe and Bethany
 Week 7 Picturing Network Vahe and Bethany Freeman (2005) - Graphic Techniques for Exploring Social Network Data The two main goals of analyzing social network data are identification of cohesive groups
Adaptive Learning of an Accurate Skin-Color Model
 Adaptive Learning of an Accurate Skin-Color Model Q. Zhu K.T. Cheng C. T. Wu Y. L. Wu Electrical & Computer Engineering University of California, Santa Barbara Presented by: H.T Wang Outline Generic Skin
MTTS1 Dimensionality Reduction and Visualization Spring 2014, 5op Jaakko Peltonen
 MTTS1 Dimensionality Reduction and Visualization Spring 2014, 5op Jaakko Peltonen Lecture 9: Metric Learning Motivation metric learning Metric learning means learning a better metric (better distance function)
Clustering. CS294 Practical Machine Learning Junming Yin 10/09/06
 Clustering CS294 Practical Machine Learning Junming Yin 10/09/06 Outline Introduction Unsupervised learning What is clustering? Application Dissimilarity (similarity) of objects Clustering algorithm K-means,
Clustering. Supervised vs. Unsupervised Learning
 Clustering Supervised vs. Unsupervised Learning So far we have assumed that the training samples used to design the classifier were labeled by their class membership (supervised learning) We assume now
Day 3 Lecture 1. Unsupervised Learning
 Day 3 Lecture 1 Unsupervised Learning Semi-supervised and transfer learning Myth: you can t do deep learning unless you have a million labelled examples for your problem. Reality You can learn useful representations
PATTERN CLASSIFICATION AND SCENE ANALYSIS
 PATTERN CLASSIFICATION AND SCENE ANALYSIS RICHARD O. DUDA PETER E. HART Stanford Research Institute, Menlo Park, California A WILEY-INTERSCIENCE PUBLICATION JOHN WILEY & SONS New York Chichester Brisbane
CS 1675 Introduction to Machine Learning Lecture 18. Clustering. Clustering. Groups together similar instances in the data sample
 CS 1675 Introduction to Machine Learning Lecture 18 Clustering Milos Hauskrecht milos@cs.pitt.edu 539 Sennott Square Clustering Groups together similar instances in the data sample Basic clustering problem:
Machine Learning: k-nearest Neighbors. Lecture 08. Razvan C. Bunescu School of Electrical Engineering and Computer Science
 Machine Learning: k-nearest Neighbors Lecture 08 Razvan C. Bunescu School of Electrical Engineering and Computer Science bunescu@ohio.edu Nonparametric Methods: k-nearest Neighbors Input: A training dataset
CS839: Probabilistic Graphical Models. Lecture 10: Learning with Partially Observed Data. Theo Rekatsinas
 CS839: Probabilistic Graphical Models Lecture 10: Learning with Partially Observed Data Theo Rekatsinas 1 Partially Observed GMs Speech recognition 2 Partially Observed GMs Evolution 3 Partially Observed
Applying Supervised Learning
 Applying Supervised Learning When to Consider Supervised Learning A supervised learning algorithm takes a known set of input data (the training set) and known responses to the data (output), and trains
Cluster Analysis and Visualization. Workshop on Statistics and Machine Learning 2004/2/6
 Cluster Analysis and Visualization Workshop on Statistics and Machine Learning 2004/2/6 Outlines Introduction Stages in Clustering Clustering Analysis and Visualization One/two-dimensional Data Histogram,
Using Machine Learning to Optimize Storage Systems
 Using Machine Learning to Optimize Storage Systems Dr. Kiran Gunnam 1 Outline 1. Overview 2. Building Flash Models using Logistic Regression. 3. Storage Object classification 4. Storage Allocation recommendation
08 An Introduction to Dense Continuous Robotic Mapping
 NAVARCH/EECS 568, ROB 530 - Winter 2018 08 An Introduction to Dense Continuous Robotic Mapping Maani Ghaffari March 14, 2018 Previously: Occupancy Grid Maps Pose SLAM graph and its associated dense occupancy
Clustering. Bruno Martins. 1 st Semester 2012/2013
 Departamento de Engenharia Informática Instituto Superior Técnico 1 st Semester 2012/2013 Slides baseados nos slides oficiais do livro Mining the Web c Soumen Chakrabarti. Outline 1 Motivation Basic Concepts
Image Classification. RS Image Classification. Present by: Dr.Weerakaset Suanpaga
 Image Classification Present by: Dr.Weerakaset Suanpaga D.Eng(RS&GIS) 6.1 Concept of Classification Objectives of Classification Advantages of Multi-Spectral data for Classification Variation of Multi-Spectra
COSC160: Detection and Classification. Jeremy Bolton, PhD Assistant Teaching Professor
 COSC160: Detection and Classification Jeremy Bolton, PhD Assistant Teaching Professor Outline I. Problem I. Strategies II. Features for training III. Using spatial information? IV. Reducing dimensionality
CS6375: Machine Learning Gautam Kunapuli. Mid-Term Review
 Gautam Kunapuli Machine Learning Data is identically and independently distributed Goal is to learn a function that maps to Data is generated using an unknown function Learn a hypothesis that minimizes
CPSC 340: Machine Learning and Data Mining. Deep Learning Fall 2018
 CPSC 340: Machine Learning and Data Mining Deep Learning Fall 2018 Last Time: Multi-Dimensional Scaling Multi-dimensional scaling (MDS): Non-parametric visualization: directly optimize the z i locations.
Unsupervised Learning
 Harvard-MIT Division of Health Sciences and Technology HST.951J: Medical Decision Support, Fall 2005 Instructors: Professor Lucila Ohno-Machado and Professor Staal Vinterbo 6.873/HST.951 Medical Decision
Solution Sketches Midterm Exam COSC 6342 Machine Learning March 20, 2013
 Your Name: Your student id: Solution Sketches Midterm Exam COSC 6342 Machine Learning March 20, 2013 Problem 1 [5+?]: Hypothesis Classes Problem 2 [8]: Losses and Risks Problem 3 [11]: Model Generation
Machine Learning (BSMC-GA 4439) Wenke Liu
 Wenke Liu") Machine Learning (BSMC-GA 4439) Wenke Liu 01-25-2018 Outline Background Defining proximity Clustering methods Determining number of clusters Other approaches Cluster analysis as unsupervised Learning Unsupervised
Machine Learning (BSMC-GA 4439) Wenke Liu 01-25-2018 Outline Background Defining proximity Clustering methods Determining number of clusters Other approaches Cluster analysis as unsupervised Learning Unsupervised
Unsupervised Learning : Clustering
 Unsupervised Learning : Clustering Things to be Addressed Traditional Learning Models. Cluster Analysis K-means Clustering Algorithm Drawbacks of traditional clustering algorithms. Clustering as a complex
Chapter DM:II. II. Cluster Analysis
 Chapter DM:II II. Cluster Analysis Cluster Analysis Basics Hierarchical Cluster Analysis Iterative Cluster Analysis Density-Based Cluster Analysis Cluster Evaluation Constrained Cluster Analysis DM:II-1
SYDE Winter 2011 Introduction to Pattern Recognition. Clustering
 SYDE 372 - Winter 2011 Introduction to Pattern Recognition Clustering Alexander Wong Department of Systems Design Engineering University of Waterloo Outline 1 2 3 4 5 All the approaches we have learned
10-701/15-781, Fall 2006, Final
 -7/-78, Fall 6, Final Dec, :pm-8:pm There are 9 questions in this exam ( pages including this cover sheet). If you need more room to work out your answer to a question, use the back of the page and clearly
Expectation Maximization (EM) and Gaussian Mixture Models
 and Gaussian Mixture Models") Expectation Maximization (EM) and Gaussian Mixture Models Reference: The Elements of Statistical Learning, by T. Hastie, R. Tibshirani, J. Friedman, Springer 1 2 3 4 5 6 7 8 Unsupervised Learning Motivation
Expectation Maximization (EM) and Gaussian Mixture Models Reference: The Elements of Statistical Learning, by T. Hastie, R. Tibshirani, J. Friedman, Springer 1 2 3 4 5 6 7 8 Unsupervised Learning Motivation
Data Informatics. Seon Ho Kim, Ph.D.
 Data Informatics Seon Ho Kim, Ph.D. seonkim@usc.edu Clustering Overview Supervised vs. Unsupervised Learning Supervised learning (classification) Supervision: The training data (observations, measurements,
Supervised Learning for Image Segmentation
 Supervised Learning for Image Segmentation Raphael Meier 06.10.2016 Raphael Meier MIA 2016 06.10.2016 1 / 52 References A. Ng, Machine Learning lecture, Stanford University. A. Criminisi, J. Shotton, E.
Introduction to machine learning, pattern recognition and statistical data modelling Coryn Bailer-Jones
 Introduction to machine learning, pattern recognition and statistical data modelling Coryn Bailer-Jones What is machine learning? Data interpretation describing relationship between predictors and responses
 http://www.xkcd.com/233/ Text Clustering David Kauchak cs160 Fall 2009 adapted from: http://www.stanford.edu/class/cs276/handouts/lecture17-clustering.ppt Administrative 2 nd status reports Paper review
ABSTRACT. Keywords: visual training, unsupervised learning, lumber inspection, projection 1. INTRODUCTION
 Comparison of Dimensionality Reduction Methods for Wood Surface Inspection Matti Niskanen and Olli Silvén Machine Vision Group, Infotech Oulu, University of Oulu, Finland ABSTRACT Dimensionality reduction
t 1 y(x;w) x 2 t 2 t 3 x 1
 x 2 t 2 t 3 x 1") Neural Computing Research Group Dept of Computer Science & Applied Mathematics Aston University Birmingham B4 7ET United Kingdom Tel: +44 (0)121 333 4631 Fax: +44 (0)121 333 4586 http://www.ncrg.aston.ac.uk/
Neural Computing Research Group Dept of Computer Science & Applied Mathematics Aston University Birmingham B4 7ET United Kingdom Tel: +44 (0)121 333 4631 Fax: +44 (0)121 333 4586 http://www.ncrg.aston.ac.uk/
CSE 158. Web Mining and Recommender Systems. Midterm recap
 CSE 158 Web Mining and Recommender Systems Midterm recap Midterm on Wednesday! 5:10 pm 6:10 pm Closed book but I ll provide a similar level of basic info as in the last page of previous midterms CSE 158
CLASSIFICATION AND CHANGE DETECTION
 IMAGE ANALYSIS, CLASSIFICATION AND CHANGE DETECTION IN REMOTE SENSING With Algorithms for ENVI/IDL and Python THIRD EDITION Morton J. Canty CRC Press Taylor & Francis Group Boca Raton London NewYork CRC