A User Study Comparing 3D Modeling with Silhouettes and Google SketchUp Alec Rivers, Fredo Durand, and Takeo Igarashi
|
|
|
- Annis Cannon
- 5 years ago
- Views:
Transcription
1 Computer Science and Artificial Intelligence Laboratory Technical Report MIT-CSAIL-TR May 5, 2010 A User Study Comparing 3D Modeling with Silhouettes and Google Alec Rivers, Fredo Durand, and Takeo Igarashi massachusetts institute of technology, cambridge, ma usa

2 A User Study Comparing 3D Modeling with Silhouettes and Google Alec Rivers MIT CSAIL Frédo Durand MIT CSAIL Takeo Igarashi The University of Tokyo Oddleg caliper Slide Press box Silhouettes Figure 1: Middle-ranked models: We performed a user study in which users were asked to model three objects using either 3D Modeling with Silhouettes or Google. A separate group of users then ranked the models produced by the first group. Here we show for each object the middle-ranked model done using silhouettes and done using. 1 Introduction We recently introduced 3D Modeling with Silhouettes [1], a new sketch-based modeling approach in which models are interactively designed by drawing their 2D silhouettes from different views. The core idea behind our approach is to limit the input to 2D silhouettes, removing the need to explicitly create or position 3D elements. Arbitrarily complex models can be constructed by assembling them out of parts defined by their silhouettes, which can be combined using CSG operations. In this technical report, we describe a user study comparing 3D Modeling with Silhouettes and Google SkechUp [2]. We chose to compare to as it is also intended for novice users, and also aimed at the creation of man-made objects. 1


3 Rank Oddleg caliper Slide Press box Reviewer a b c d e f g h i j a b c d e f g h i j a b c d e f g h i j Table 1: User study results: Each column is the ranking of a different reviewer (a j) of the models done by the user study participants, with the best models at the top. Green boxes indicate models designed with our approach; red boxes are models designed with. The numbers inside the boxes are the number of the user who created the model. 2 Methodology Our user study involved ten participants, recruited from the general population, all of whom were familiar with computers but none of whom had previous experience doing 3D modeling. Each participant spent twenty minutes following a tutorial of our modeler, and twenty minutes following a tutorial provided by Google for 1, in randomized order. The participant was then shown a series of three photographs of objects: an oddleg caliper, a slide, and a press box, shown in Figure 2. These objects were taken from a random list of man-made objects generated as part of the evaluation in [1]. We tried to select objects from that list that had a range of scales, with each being complex enough to produce interesting results. The participant then modeled each of these objects in sequence, spending a maximum of 25 minutes on each. Each object was modeled only once, with each user alternating between using our modeler and (each participant therefore created a total of three models). Half the participants started with, and half with our modeler. In the second phase of our user study, ten people who had not participated in the first phase were asked to sort rendered images of every model created into a total ordering by quality. The rendered images were produced in a third-party commercial renderer and could not be distinguished as to which modeler was used to create them. We call these users reviewers. 3 Results The models created by the user study participants in the first phase are shown in Table 2, and the rankings done in the second phase are shown in Table 1. We show the middle-ranked model done with our approach and done with for each object in Figure 1. We believe that the rankings in Table 1 illustrate that models done with our modeler were consistently ranked higher than models done with. By ANOVA analysis, the effect of the modeler on the model s ranking was statistically significant with higher than 99% confidence. To quantify the extent of this preference, we calculated that of all the pairs of a model done with our modeler and a model done with, reviewers on average ranked the model done with our modeler higher 83% of the time. However, a direct comparison of the ranks of the models made with our approach and those made with can be misleading, as highly-skilled users models tend to outrank less skilled users models, regardless of the modeler 1 Start a Drawing self-paced tutorial parts 1, 2 & 3, available at 2
4 used. (See, e.g., user 9 in the rankings, who did well enough with to outrank other users models done with our approach, but did even better when using our approach.) It is more appropriate to analyze how each modeler fared when using our approach compared with when using. We therefore calculated for each user the average rank of the user s models done with our modeler and the average rank of the user s models done with. We found that every single user had a higher average rank for their models done with our approach, on average 3.19 places higher than the average for their models done with. By ANOVA analysis, this result is statistically significant with over 99% confidence. 4 Discussion In this section we will discuss some of the differences between these two modeling approaches that could account for the difference in quality of the models produced in our user study. One difference has to do with the nature of the lowest-level building blocks of a model. In, the most basic elements of a model are edges and surfaces, and 3D volumes exist only as boundary representations constructed out of edges and surfaces. By comparison, the lowest-level building block of a model in our approach is a 3D volume, specified by the intersection of 2D silhouettes. We found that working with volumes and silhouettes bypassed a variety of difficulties that novice users had when working with a boundary representation: for example, in, users had to manually ensure the coplanarity of lines when generating a surface, be aware of and avoid T-junctions, ensure watertightness, and so on. Another difference is with the interface that each modeling program presents: uses a single 3D view, while our approach uses three 2D views. We found that users were more immediately comfortable with a single 3D view of the object. However, we also found that having a single view caused certain difficulties: because 2D sketching operations in a single view are ambiguous with regards to depth, users often made the mistake of performing a modeling operation that appeared reasonable in one view, only to rotate to another view and find that the actual shape was greatly distorted. In our interface, by comparison, all shapes are drawn in at least two views, preventing this type of ambiguity. We also observed that users sometimes had difficulty envisioning what steps were necessary to achieve a desired shape in. This was because in there are usually multiple ways to achieve a shape, some being easy and others hard. In our study, users would often try one approach, only to have to delete the shape they had built and try again with a different approach. In our interface, by comparison, there is intended to be only one way to achieve any shape, and this pattern of deleting and trying again generally did not occur. Our user study could have been improved by having an even number of models, so that each user could do an equal number of models with and our approach. We limited the study to three models simply due to time concerns, as even with just three models the user study took roughly hours per user. As a result, the overall statistics on rankings of models done with our approach versus those done with could be affected by the skills of individual users if, for example, more skilled users were randomly selected to make two models with our approach. However, the comparison of each individual user s scores with each modeler is still valid, and shows that individuals always performed better with our approach. References [1] Alec Rivers, Fredo Durand, and Takeo Igarashi. 3D Modeling with Silhouettes. ACM Transactions on Graphics (Proc. SIGGRAPH), 29(3), [2]. Google

 Slide")


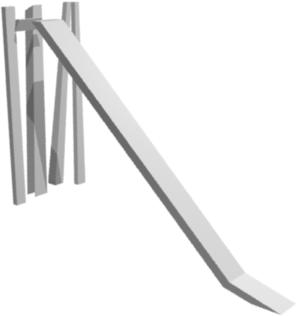


5 (a) Oddleg caliper (b) Slide (c) Press box Figure 2: The photos shown to user study participants. Our modeler Our modeler Our modeler Table 2: User study models: The set of all models generated by our ten users. Note that five users started with our modeler, while the other five started with. 4
6
Alec Rivers. at the. February A uthor... Department of Electrical Engineering and Computer Science January 29th, 2010
 ARCHivES 3D Modeling with Silhouettes by Alec Rivers MASSACHUSETTS INSTrTUTE OF TECHNOLOGY FEB 2 3 2010 LIBRARIES Submitted to the Department of Electrical Engineering and Computer Science in partial fulfillment
3D Modeling with Silhouettes
 3D Modeling with Silhouettes Alec Rivers MIT CSAIL Frédo Durand MIT CSAIL Takeo Igarashi The University of Tokyo Figure 1: Intersecting 2D silhouettes: The silhouettes on the left were used to automatically
CREATING 3D WRL OBJECT BY USING 2D DATA
 ISSN : 0973-7391 Vol. 3, No. 1, January-June 2012, pp. 139-142 CREATING 3D WRL OBJECT BY USING 2D DATA Isha 1 and Gianetan Singh Sekhon 2 1 Department of Computer Engineering Yadavindra College of Engineering,
Physically-Based Laser Simulation
 Physically-Based Laser Simulation Greg Reshko Carnegie Mellon University reshko@cs.cmu.edu Dave Mowatt Carnegie Mellon University dmowatt@andrew.cmu.edu Abstract In this paper, we describe our work on
Ms Nurazrin Jupri. Frequency Distributions
 Frequency Distributions Frequency Distributions After collecting data, the first task for a researcher is to organize and simplify the data so that it is possible to get a general overview of the results.
Graph theory was invented by a mathematician named Euler in the 18th century. We will see some of the problems which motivated its study.
 Graph Theory Graph theory was invented by a mathematician named Euler in the 18th century. We will see some of the problems which motivated its study. However, it wasn t studied too systematically until
Central Limit Theorem Sample Means
 Date Central Limit Theorem Sample Means Group Member Names: Part One Review of Types of Distributions Consider the three graphs below. Match the histograms with the distribution description. Write the
SketchUp Quick Start For Surveyors
 SketchUp Quick Start For Surveyors Reason why we are doing this SketchUp allows surveyors to draw buildings very quickly. It allows you to locate them in a plan of the area. It allows you to show the relationship
Software tools for igemers: BioBrick / Past Project Search & Tutorials
 Software tools for igemers: BioBrick / Past Project Search & Tutorials Background In igem... Important part is: Think & decide your project igem Start to Finish Background Lots of time is spent on finding
Linear combinations of simple classifiers for the PASCAL challenge
 Linear combinations of simple classifiers for the PASCAL challenge Nik A. Melchior and David Lee 16 721 Advanced Perception The Robotics Institute Carnegie Mellon University Email: melchior@cmu.edu, dlee1@andrew.cmu.edu
Disrupting the Personal Lives
 IS WORK EMAIL Disrupting the Personal Lives OF US EMPLOYEES? Samanage Email Overload Survey Report March 30, 2016 SCREENER QUESTION: Do you receive company emails on your mobile device? Only people who
Publication Number spse01695
 XpresRoute (tubing) Publication Number spse01695 XpresRoute (tubing) Publication Number spse01695 Proprietary and restricted rights notice This software and related documentation are proprietary to Siemens
Structured Annotations for 2D-to-3D Modeling
 Structured Annotations for 2D-to-3D Modeling Yotam Gingold (New York University / JST ERATO) Takeo Igarashi (University of Tokyo / JST ERATO) Denis Zorin (New York University) In this talk, Structured
Lecture Week 4. Images
 Lecture Week 4 Images Images can be used: As a backdrop behind text to create a pictorial framework for the text. As a background for the content. As an icon to represent options that can be selected.
An Efficient Visual Hull Computation Algorithm
 An Efficient Visual Hull Computation Algorithm Wojciech Matusik Chris Buehler Leonard McMillan Laboratory for Computer Science Massachusetts institute of Technology (wojciech, cbuehler, mcmillan)@graphics.lcs.mit.edu
Today s Topics. Percentile ranks and percentiles. Standardized scores. Using standardized scores to estimate percentiles
 Today s Topics Percentile ranks and percentiles Standardized scores Using standardized scores to estimate percentiles Using µ and σ x to learn about percentiles Percentiles, standardized scores, and the
lecture 10 - depth from blur, binocular stereo
 This lecture carries forward some of the topics from early in the course, namely defocus blur and binocular disparity. The main emphasis here will be on the information these cues carry about depth, rather
Are Senior Smartphones really better?
 Are Senior Smartphones really better? Nina Ascher, Stephan Schlögl Dept. Management, Communication & IT, MCI Management Center Innsbruck digitalization@mci.edu Abstract Giving our aging society it seems
Evaluating a Visual Information Retrieval Interface: AspInquery at TREC-6
 Evaluating a Visual Information Retrieval Interface: AspInquery at TREC-6 Russell Swan James Allan Don Byrd Center for Intelligent Information Retrieval Computer Science Department University of Massachusetts
Comparing the Usability of RoboFlag Interface Alternatives*
 Comparing the Usability of RoboFlag Interface Alternatives* Sangeeta Shankar, Yi Jin, Li Su, Julie A. Adams, and Robert Bodenheimer Department of Electrical Engineering and Computer Science Vanderbilt
Real-Time Shadows. Computer Graphics. MIT EECS Durand 1
 Real-Time Shadows Computer Graphics MIT EECS 6.837 Durand 1 Why are Shadows Important? Depth cue Scene Lighting Realism Contact points 2 Shadows as a Depth Cue source unknown. All rights reserved. This
What We Can Learn From SILK and DENIM
 What We Can Learn From SILK and DENIM Presenter: Shahla Almasri COMP 762B: Modelling and Simulation Based Design March 2 nd, 2005 Main References This presentation is based on the following four papers:
Page 1. Area-Subdivision Algorithms z-buffer Algorithm List Priority Algorithms BSP (Binary Space Partitioning Tree) Scan-line Algorithms
 Scan-line Algorithms") Visible Surface Determination Visibility Culling Area-Subdivision Algorithms z-buffer Algorithm List Priority Algorithms BSP (Binary Space Partitioning Tree) Scan-line Algorithms Divide-and-conquer strategy:
Visible Surface Determination Visibility Culling Area-Subdivision Algorithms z-buffer Algorithm List Priority Algorithms BSP (Binary Space Partitioning Tree) Scan-line Algorithms Divide-and-conquer strategy:
How to create a basic Orienteering map with Google Earth
 1. Open Google Earth or Google Maps and type in your location/address. Suggestion: Most of the time it is the same image, but sometimes one is better than the other. Google Earth: turn off labels is in
Publication Number spse01695
 XpresRoute (tubing) Publication Number spse01695 XpresRoute (tubing) Publication Number spse01695 Proprietary and restricted rights notice This software and related documentation are proprietary to Siemens
Dataverse Usability Evaluation: Findings & Recommendations. Presented by Eric Gibbs Lin Lin Elizabeth Quigley
 Dataverse Usability Evaluation: Findings & Recommendations Presented by Eric Gibbs Lin Lin Elizabeth Quigley Agenda Introduction Scenarios Findings & Recommendations Next Steps Introduction Scenarios Scenario
MANUAL CODING VERSUS WIZARDS: EXAMING THE EFFECTS OF USER INTERACTION ON MARKUP LANGUAGE PERFORMANCE AND SATISFACTION
 MANUAL CODING VERSUS WIZARDS: EXAMING THE EFFECTS OF USER INTERACTION ON MARKUP LANGUAGE PERFORMANCE AND SATISFACTION Jeffrey Hsu, Information Systems, Silberman College of Business Administration, Fairleigh
Additional Material (electronic only)
") Additional Material (electronic only) This additional material contains a presentation of additional capabilities of the system, a discussion of performance and temporal coherence as well as other limitations.
Additional Material (electronic only) This additional material contains a presentation of additional capabilities of the system, a discussion of performance and temporal coherence as well as other limitations.
v Observations SMS Tutorials Prerequisites Requirements Time Objectives
 v. 13.0 SMS 13.0 Tutorial Objectives This tutorial will give an overview of using the observation coverage in SMS. Observation points will be created to measure the numerical analysis with measured field
Automatically Generating Tutorials to Enable Middle School Children to Learn Programming Independently
 1 Automatically Generating Tutorials to Enable Middle School Children to Learn Programming Independently Kyle Harms, Dennis Cosgrove, Shannon Gray, Caitlin Kelleher Shortage of Programmers An estimated
COMMON ISSUES AFFECTING SECURITY USABILITY
 Evaluating the usability impacts of security interface adjustments in Word 2007 M. Helala 1, S.M.Furnell 1,2 and M.Papadaki 1 1 Centre for Information Security & Network Research, University of Plymouth,
Chapter 2: Frequency Distributions
 Chapter 2: Frequency Distributions Chapter Outline 2.1 Introduction to Frequency Distributions 2.2 Frequency Distribution Tables Obtaining ΣX from a Frequency Distribution Table Proportions and Percentages
CS 431/636 Advanced Rendering Techniques
 CS 431/636 Advanced Rendering Techniques Dr. David Breen Matheson 308 Thursday 6PM 8:50PM Presentation 7 5/23/06 Questions from Last Time? Hall Shading Model Shadows Reflections Refractions Slide Credits
CAD Tutorial 23: Exploded View
 CAD TUTORIAL 23: Exploded View CAD Tutorial 23: Exploded View Level of Difficulty Time Approximately 30 35 minutes Starter Activity It s a Race!!! Who can build a Cube the quickest: - Pupils out of Card?
Enhancing Blog Readability for Non-native English Readers in the Enterprise
 Enhancing Blog Readability for Non-native English Readers in the Enterprise Chen-Hsiang Yu MIT CSAIL 32 Vassar St Cambridge, MA 02139 chyu@mit.edu Jennifer Thom-Santelli IBM T.J. Watson Research 1 Rogers
MixT: Automatic Generation of Step-by-Step Mixed Media Tutorials
 MixT: Automatic Generation of Step-by-Step Mixed Media Tutorials figure 1. Partial view of the MixT interface, which shows step-by-step instructions, each with a screenshot and a video clip. Pei-Yu (Peggy)
Frequency Distributions
 Displaying Data Frequency Distributions After collecting data, the first task for a researcher is to organize and summarize the data so that it is possible to get a general overview of the results. Remember,
Usability Report. Author: Stephen Varnado Version: 1.0 Date: November 24, 2014
 Usability Report Author: Stephen Varnado Version: 1.0 Date: November 24, 2014 2 Table of Contents Executive summary... 3 Introduction... 3 Methodology... 3 Usability test results... 4 Effectiveness ratings
A Sketch Interpreter System with Shading and Cross Section Lines
 Journal for Geometry and Graphics Volume 9 (2005), No. 2, 177 189. A Sketch Interpreter System with Shading and Cross Section Lines Kunio Kondo 1, Haruki Shizuka 1, Weizhong Liu 1, Koichi Matsuda 2 1 Dept.
Averages and Variation
 Averages and Variation 3 Copyright Cengage Learning. All rights reserved. 3.1-1 Section 3.1 Measures of Central Tendency: Mode, Median, and Mean Copyright Cengage Learning. All rights reserved. 3.1-2 Focus
Comparing Google Message Security and Leading Messaging Security Solutions
 Comparing Google Security and Leading Messaging Security Solutions An Osterman Research White Paper Published February 2008 Osterman Research, Inc. P.O. Box 1058 Black Diamond, Washington 98010-1058 Phone:
STUDY ON DISTORTION CONSPICUITY IN STEREOSCOPICALLY VIEWED 3D IMAGES
 STUDY ON DISTORTION CONSPICUITY IN STEREOSCOPICALLY VIEWED 3D IMAGES Ming-Jun Chen, 1,3, Alan C. Bovik 1,3, Lawrence K. Cormack 2,3 Department of Electrical & Computer Engineering, The University of Texas
George Mason University Department of Civil, Environmental and Infrastructure Engineering. Dr. Celso Ferreira Prepared by Lora Baumgartner
 George Mason University Department of Civil, Environmental and Infrastructure Engineering Dr. Celso Ferreira Prepared by Lora Baumgartner Exercise Topic: Getting started with HEC RAS Objective: Create
v SMS 12.2 Tutorial Observation Prerequisites Requirements Time minutes
 v. 12.2 SMS 12.2 Tutorial Observation Objectives This tutorial will give an overview of using the observation coverage in SMS. Observation points will be created to measure the numerical analysis with
Enhancing Web Page Skimmability
 Enhancing Web Page Skimmability Chen-Hsiang Yu MIT CSAIL 32 Vassar St Cambridge, MA 02139 chyu@mit.edu Robert C. Miller MIT CSAIL 32 Vassar St Cambridge, MA 02139 rcm@mit.edu Abstract Information overload
3D Design with 123D Design
 3D Design with 123D Design Introduction: 3D Design involves thinking and creating in 3 dimensions. x, y and z axis Working with 123D Design 123D Design is a 3D design software package from Autodesk. A
Slide 1 / 96. Linear Relations and Functions
 Slide 1 / 96 Linear Relations and Functions Slide 2 / 96 Scatter Plots Table of Contents Step, Absolute Value, Piecewise, Identity, and Constant Functions Graphing Inequalities Slide 3 / 96 Scatter Plots
Replacing parts in an assembly
 Replacing parts in an assembly Publication Number spse01665 Replacing parts in an assembly Publication Number spse01665 Proprietary and restricted rights notice This software and related documentation
Autodesk Inventor 11 Certified User and Expert Exam Preparation Class [Part 2]
![Autodesk Inventor 11 Certified User and Expert Exam Preparation Class [Part 2]](/thumbs/73/68780725.jpg "Autodesk Inventor 11 Certified User and Expert Exam Preparation Class [Part 2]") 11/29/2006-5:00 pm - 6:30 pm Room:Marcello - 4404 (MSD Campus) Autodesk Inventor 11 Certified User and Expert Exam Preparation Class [Part 2] Daniel Banach - MasterGraphics MA25-3 See MA24-2: Autodesk
11/29/2006-5:00 pm - 6:30 pm Room:Marcello - 4404 (MSD Campus) Autodesk Inventor 11 Certified User and Expert Exam Preparation Class [Part 2] Daniel Banach - MasterGraphics MA25-3 See MA24-2: Autodesk
Supplementary Material for Synthesizing Normalized Faces from Facial Identity Features
 Supplementary Material for Synthesizing Normalized Faces from Facial Identity Features Forrester Cole 1 David Belanger 1,2 Dilip Krishnan 1 Aaron Sarna 1 Inbar Mosseri 1 William T. Freeman 1,3 1 Google,
Cybercity Walker - Layered Morphing Method -
 Cybercity Walker - Layered Morphing Method - Takaaki Endo 1), Akihiro Katayama 1), Hideyuki Tamura 1), Michitaka Hirose 2), and Tomohiro Tanikawa 2) 1) Mixed Reality Systems Laboratory Inc. 6-145 Hanasakicho,
Chapter 10. Creating 3D Objects Delmar, Cengage Learning
 Chapter 10 Creating 3D Objects 2011 Delmar, Cengage Learning Objectives Extrude objects Revolve objects Manipulate surface shading and lighting Map artwork to 3D objects Extrude Objects Extrude & Bevel
EVALUATING DIFFERENT TOUCH-BASED INTERACTION TECHNIQUES IN A PUBLIC INFORMATION KIOSK
 EVALUATING DIFFERENT TOUCH-BASED INTERACTION TECHNIQUES IN A PUBLIC INFORMATION KIOSK Roope Raisamo Department of Computer Science University of Tampere P.O. Box 607 (Pinninkatu 53B) FIN-33101 Tampere,
Safety Perception Survey s: Interviewing & Sampling Method Considerations
 Safety Perception Survey s: Interviewing & Sampling Interviewing Methods Each method has advantages and disadvantages. Personal Interviews An interview is called personal when the interviewer asks the
Face Cyclographs for Recognition
 Face Cyclographs for Recognition Guodong Guo Department of Computer Science North Carolina Central University E-mail: gdguo@nccu.edu Charles R. Dyer Computer Sciences Department University of Wisconsin-Madison
Problem Set 6 Solutions
 Introduction to Algorithms October 29, 2001 Massachusetts Institute of Technology 6.046J/18.410J Singapore-MIT Alliance SMA5503 Professors Erik Demaine, Lee Wee Sun, and Charles E. Leiserson Handout 24
Fundamentals of Operations Research. Prof. G. Srinivasan. Department of Management Studies. Indian Institute of Technology Madras.
 Fundamentals of Operations Research Prof. G. Srinivasan Department of Management Studies Indian Institute of Technology Madras Lecture No # 06 Simplex Algorithm Initialization and Iteration (Refer Slide
Data can be in the form of numbers, words, measurements, observations or even just descriptions of things.
 + What is Data? Data is a collection of facts. Data can be in the form of numbers, words, measurements, observations or even just descriptions of things. In most cases, data needs to be interpreted and
Day 4 Percentiles and Box and Whisker.notebook. April 20, 2018
 Day 4 Box & Whisker Plots and Percentiles In a previous lesson, we learned that the median divides a set a data into 2 equal parts. Sometimes it is necessary to divide the data into smaller more precise
Iteration vs Recursion in Introduction to Programming Classes: An Empirical Study
 BULGARIAN ACADEMY OF SCIENCES CYBERNETICS AND INFORMATION TECHNOLOGIES Volume 16, No 4 Sofia 2016 Print ISSN: 1311-9702; Online ISSN: 1314-4081 DOI: 10.1515/cait-2016-0068 Iteration vs Recursion in Introduction
Digitization of 3D Objects for Virtual Museum
 Digitization of 3D Objects for Virtual Museum Yi-Ping Hung 1, 2 and Chu-Song Chen 2 1 Department of Computer Science and Information Engineering National Taiwan University, Taipei, Taiwan 2 Institute of
The ebuilders Guide to selecting a Web Designer
 The ebuilders Guide to selecting a Web Designer With the following short guide we hope to give you and your business a better grasp of how to select a web designer. We also include a short explanation
In this exercise, you will convert labels into geodatabase annotation so you can edit the text features.
 Instructions: Use the provided data stored in a USB. For the report: 1. Start a new word document. 2. Follow an exercise step as given below. 3. Describe what you did in that step in the word document
Once you have entered your Google and password, you can click the Sign In button to continue.
 Slide 1 Welcome to the Creating and Uploading with Google Docs Tutorial. Google Docs allows you to create documents, spreadsheets, presentations, draw pictures, create forms, and much more directly within
The following learning resources are pre-requisites to help prepare you in supporting your students through this course.
 Introduction to CAD: From 2D to 3D Modeling Instructor Guide This instructor guide is a comprehensive tool for facilitating this course in the classroom. Prepare to teach this course by thoroughly reviewing
Intelligence Quotient (IQ) and Browser Usage
 and Browser Usage") 498 Richards Street Vancouver, BC V6B 2Z3 Phone: +1 778 242 9002 E- Mail: info@aptiquant.com Web: http://www.aptiquant.com Intelligence Quotient (IQ) and Browser Usage Measuring the Effects of Cognitive
498 Richards Street Vancouver, BC V6B 2Z3 Phone: +1 778 242 9002 E- Mail: info@aptiquant.com Web: http://www.aptiquant.com Intelligence Quotient (IQ) and Browser Usage Measuring the Effects of Cognitive
Exploring Performance Tradeoffs in a Sudoku SAT Solver CS242 Project Report
 Exploring Performance Tradeoffs in a Sudoku SAT Solver CS242 Project Report Hana Lee (leehana@stanford.edu) December 15, 2017 1 Summary I implemented a SAT solver capable of solving Sudoku puzzles using
Signature Recognition by Pixel Variance Analysis Using Multiple Morphological Dilations
 Signature Recognition by Pixel Variance Analysis Using Multiple Morphological Dilations H B Kekre 1, Department of Computer Engineering, V A Bharadi 2, Department of Electronics and Telecommunication**
Lesson for levels K-5 Time to complete: min
 Lesson Plan: Lesson for levels K-5 Time to complete: 45-90 min Lesson Plan: Level: Grades K-5 (ages 5-10) Time to complete: ~45-90 minutes Learn how to build basic geometry, apply materials, and import
Comparing Postini and Leading Messaging Security Solutions
 Comparing Postini and Leading Messaging Security Solutions An Osterman Research White Paper Published October 2007 Osterman Research, Inc. P.O. Box 1058 Black Diamond, Washington 98010-1058 Phone: +1 253
Center, Shape, & Spread Center, shape, and spread are all words that describe what a particular graph looks like.
 Center, Shape, & Spread Center, shape, and spread are all words that describe what a particular graph looks like. Center When we talk about center, shape, or spread, we are talking about the distribution
MIT COMPUTER SCIENCE AND ARTIFICIAL INTELLIGENCE LABORATORY GRAPHIC STANDARDS
 MIT COMPUTER SCIENCE AND ARTIFICIAL INTELLIGENCE LABORATORY GRAPHIC STANDARDS LOGO WITH THE FULL NAME LOGO STANDARDS LOGO MARK LOGO TYPE The logo consists of three elements, the logo mark, logo type, and
Component-based Face Recognition with 3D Morphable Models
 Component-based Face Recognition with 3D Morphable Models Jennifer Huang 1, Bernd Heisele 1,2, and Volker Blanz 3 1 Center for Biological and Computational Learning, M.I.T., Cambridge, MA, USA 2 Honda
2.5D Cartoon Models. Abstract. 1 Introduction. 2 Related Work. Takeo Igarashi The University of Tokyo. Frédo Durand MIT CSAIL. Alec Rivers MIT CSAIL
 Alec Rivers MIT CSAIL 2.5D Cartoon Models Takeo Igarashi The University of Tokyo Frédo Durand MIT CSAIL (a) (b) (c) Figure 1: A 2.5D Cartoon: We take vector art drawings of a cartoon from different views
Photocopiable/digital resources may only be copied by the purchasing institution on a single site and for their own use ZigZag Education, 2013
 SketchUp Level of Difficulty Time Approximately 15 20 minutes Photocopiable/digital resources may only be copied by the purchasing institution on a single site and for their own use ZigZag Education, 2013
Last Time. Reading for Today: Graphics Pipeline. Clipping. Rasterization
 Last Time Modeling Transformations Illumination (Shading) Real-Time Shadows Viewing Transformation (Perspective / Orthographic) Clipping Projection (to Screen Space) Scan Conversion (Rasterization) Visibility
Slide Copyright 2005 Pearson Education, Inc. SEVENTH EDITION and EXPANDED SEVENTH EDITION. Chapter 13. Statistics Sampling Techniques
 SEVENTH EDITION and EXPANDED SEVENTH EDITION Slide - Chapter Statistics. Sampling Techniques Statistics Statistics is the art and science of gathering, analyzing, and making inferences from numerical information
Critical Essentials. Overview. Objectives. Recommended Prior Skills. Upon completion of these topics, you should be able to:
 Critical Essentials Visualizing spaces in three dimensions is critical to the success of the design of architectural spaces. The interplay of light, color, and space are critical concepts to master. Traditional
SketchUp Tool Basics
 SketchUp Tool Basics Open SketchUp Click the Start Button Click All Programs Open SketchUp Scroll Down to the SketchUp 2013 folder Click on the folder to open. Click on SketchUp. Set Up SketchUp (look
Component-based Face Recognition with 3D Morphable Models
 Component-based Face Recognition with 3D Morphable Models B. Weyrauch J. Huang benjamin.weyrauch@vitronic.com jenniferhuang@alum.mit.edu Center for Biological and Center for Biological and Computational
MAT 110 WORKSHOP. Updated Fall 2018
 MAT 110 WORKSHOP Updated Fall 2018 UNIT 3: STATISTICS Introduction Choosing a Sample Simple Random Sample: a set of individuals from the population chosen in a way that every individual has an equal chance
(Refer Slide Time 03:00)
") Computer Graphics Prof. Sukhendu Das Dept. of Computer Science and Engineering Indian Institute of Technology, Madras Lecture #30 Visible Surface Detection (Contd ) We continue the discussion on Visible
Computer Graphics Prof. Sukhendu Das Dept. of Computer Science and Engineering Indian Institute of Technology, Madras Lecture #30 Visible Surface Detection (Contd ) We continue the discussion on Visible
Siggraph Full-Day Course #26. Real-Time Shadowing Techniques
 Siggraph 2004 Full-Day Course #26 Real-Time Shadowing Techniques Course Title Real-Time Shadowing Techniques Category Rendering Real-Time or for Games Presentation Venue Session Room Summary Statement
Bellevue Community College Summer 2009 Interior Design 194 SPECIAL TOPIC: SKETCHUP
 Class Session: TTh 6:00 pm 8:00 pm Credit Hours: Two (2) Location: A262 Door Code: 349499 (through A254) Instructor: Greg Wharton Office: by appointment Hours: by appointment or email email: gwharton@gmail.com
I R UNDERGRADUATE REPORT. Applying VR Technology to Training in Manufacturing Processes. by Kathryn Ledoux and Nikita Deshpande Advisor: UG
 UNDERGRADUATE REPORT Applying VR Technology to Training in Manufacturing Processes by Kathryn Ledoux and Nikita Deshpande Advisor: UG 2006-12 I R INSTITUTE FOR SYSTEMS RESEARCH ISR develops, applies and
MASSACHUSETTS INSTITUTE OF TECHNOLOGY ARTIFICIAL INTELLIGENCE LABORATORY. Working Paper 113 March 29, ON SOLVING THE FINDSPACE PROBLEM, or
 MASSACHUSETTS INSTITUTE OF TECHNOLOGY ARTIFICIAL INTELLIGENCE LABORATORY Working Paper 113 March 29, 1973 ON SOLVING THE FINDSPACE PROBLEM, or How to Find Out Where Things Aren't... Gregory F. Pfister
Kinematic Analysis dialog
 Dips version 6.0 has arrived, a major new upgrade to our popular stereonet analysis program. New features in Dips 6.0 include a comprehensive kinematic analysis toolkit for planar, wedge and toppling analysis;
Stenciling is a form of artistic expression in
 Editor: Mike Potel Holly: A Drawing Editor for Designing Stencils Yuki Igarashi University of Tsukuba Takeo Igarashi University of Tokyo Stenciling is a form of artistic expression in which you print images
Tiled Textures What if Miro Had Painted a Sphere
 Tiled Textures What if Miro Had Painted a Sphere ERGUN AKLEMAN, AVNEET KAUR and LORI GREEN Visualization Sciences Program, Department of Architecture Texas A&M University December 26, 2005 Abstract We
Multi-view stereo. Many slides adapted from S. Seitz
 Multi-view stereo Many slides adapted from S. Seitz Beyond two-view stereo The third eye can be used for verification Multiple-baseline stereo Pick a reference image, and slide the corresponding window
CS184 : Foundations of Computer Graphics Professor David Forsyth Final Examination
 CS184 : Foundations of Computer Graphics Professor David Forsyth Final Examination (Total: 100 marks) Figure 1: A perspective view of a polyhedron on an infinite plane. Cameras and Perspective Rendering
Structured Annotations for 2D-to-3D Modeling
 Structured Annotations for 2D-to-3D Modeling Yotam Gingold (New York University / JST ERATO) Takeo Igarashi (University of Tokyo / JST ERATO) Denis Zorin (New York University) Pencil and Paper Sketches
(Refer Slide Time 6:48)
") Digital Circuits and Systems Prof. S. Srinivasan Department of Electrical Engineering Indian Institute of Technology Madras Lecture - 8 Karnaugh Map Minimization using Maxterms We have been taking about
Digital Circuits and Systems Prof. S. Srinivasan Department of Electrical Engineering Indian Institute of Technology Madras Lecture - 8 Karnaugh Map Minimization using Maxterms We have been taking about
1.2. Pictorial and Tabular Methods in Descriptive Statistics
 1.2. Pictorial and Tabular Methods in Descriptive Statistics Section Objectives. 1. Stem-and-Leaf displays. 2. Dotplots. 3. Histogram. Types of histogram shapes. Common notation. Sample size n : the number
Google Organic Click Through Study: Comparison of Google's CTR by Position, Industry, and Query Type
 Google Organic Click Through Study: Comparison of Google's CTR by Position, Industry, and Query Type 21 Corporate Drive, Suite 200 Clifton Park, NY 12065 518-270-0854 www.internetmarketingninjas.com Table
Geometric Modeling Lecture Series. Prof. G. Wang Department of Mechanical and Industrial Engineering University of Manitoba
 Geometric Modeling 25.353 Lecture Series Prof. G. Wang Department of Mechanical and Industrial Engineering University of Manitoba Introduction Geometric modeling is as important to CAD as governing equilibrium
DeepSketch2Face: A Deep Learning Based Sketching System for 3D Face and Caricature Modeling. Part I: User Studies on the Interface
 DeepSketch2Face: A Deep Learning Based Sketching System for 3D Face and Caricature Modeling (Supplemental Materials) Xiaoguang Han, Chang Gao, Yizhou Yu The University of Hong Kong Stage I: User experience
ISSN: [Keswani* et al., 7(1): January, 2018] Impact Factor: 4.116
![ISSN: [Keswani* et al., 7(1): January, 2018] Impact Factor: 4.116](/thumbs/83/88606712.jpg "ISSN: [Keswani* et al., 7(1): January, 2018] Impact Factor: 4.116") IJESRT INTERNATIONAL JOURNAL OF ENGINEERING SCIENCES & RESEARCH TECHNOLOGY AUTOMATIC TEST CASE GENERATION FOR PERFORMANCE ENHANCEMENT OF SOFTWARE THROUGH GENETIC ALGORITHM AND RANDOM TESTING Bright Keswani,
IJESRT INTERNATIONAL JOURNAL OF ENGINEERING SCIENCES & RESEARCH TECHNOLOGY AUTOMATIC TEST CASE GENERATION FOR PERFORMANCE ENHANCEMENT OF SOFTWARE THROUGH GENETIC ALGORITHM AND RANDOM TESTING Bright Keswani,
I Shopping on mobile / RU
 I Shopping on mobile / RU Exploring how people use their smartphones for shopping activities Q3 2016 I About this study Background: Objective: Mobile apps and sites are a vital channel for advertisers
Working with large assemblies
 SIEMENS Working with large assemblies spse01650 Proprietary and restricted rights notice This software and related documentation are proprietary to Siemens Product Lifecycle Management Software Inc. 2015