FR 5131 SAP Assignment
|
|
|
- Albert Stewart
- 5 years ago
- Views:
Transcription
1 FR 5131 SAP Assignment What You ll Learn: Practice with various skills in ArcMap Data can be found on the class web site or S:\FR5131\Semester_Assignment\SAP. Background: Concurrent with the regular lab assignments, students enrolled in FR5131 must do one of several semester-long projects. This one has them construct and analyze historical data for the St. Anthony Park neighborhood of St. Paul. This work will be done in stages, as material is covered in lecture and lab sessions. Part 1 Create a workspace for this semester long project. (you may want to copy all the data on FR5131\SEMESTER_ASSIGNMENT\SAP to a jump drive or your home computer) Create an initial base Map (use ArcMap; refer to Lab 1 &/or Lab 2). Load the Historical Plat (\plat_1928) of the N. St. Anthony Park neighborhood and surrounding areas. Part 2 Save a map project file (.mxd) as you will build upon it in future assignments. Print a properly titled map, with a north arrow, scale bar, your name and simple description in a legend. Create four polyline layers in your historical GIS workspace; 1928 roads, 1928 alleys, Trolley line, and Railroad. (refer to Lab 4) Open each layer and digitize the 1928 roads, alleys (alleys look like unnamed roads), trolley line (down Como Avenue) and Railroad. Don t do too large an area; later you will clip these layers to the neighborhood boundary. N. St. Anthony Park is bounded by the city limits on the west and north, the city limits down Cleveland Ave. to Como Blvd. to Fifield St on the east, and the Railroad line in the South. You will not need any features beyond those limits. We provided a layer focusblocks.shp that identifies 4+contiguous blocks (surrounded by named streets or alleys). Load this layer, and digitize all 1928 parcels for those 4+ blocks. Digitize only the parcel boundaries into your new layer. Create another polygon layer, and digitize the 1928 houses and all other buildings on those blocks, adjusting building location as necessary so that all buildings are placed within focusblocks outer boundary (some may overlap slightly at the edge, pull them in). Add attributes for 1928 building type, 1
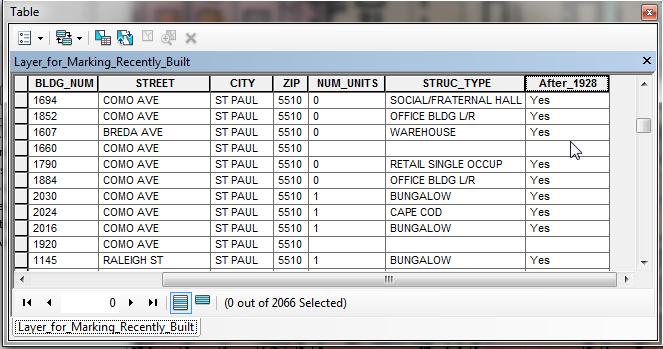
2 dwelling or garage, and building materials, interpreting the values to place in the attribute tables by interpreting the map. Note that red houses are brick, Gray houses are stone or stucco, yellow houses are wooden, garages are red, gray or yellow also but have faint X on the roof. (see illustration on page 6) For the same 4+ blocks as chosen above, digitize the all buildings for 2006, interpreting from the image 2006foc_blk.tif, identifying buildings as houses (or any other dwellings) or garage/other non-dwellings, and name this layer something like Current_houses. Select the current parcels for this set of blocks from the 2004 Parcel/Tax records, and save them to a new layer. Round out the parcels that don t appear in 2004, but are parcels in That is, there may be some missing parcels in the 2004 dataset, they are just empty space. Create fillers for these phantom parcels (likely, they ve reverted to the City or State, and so don t appear as parcels). Print a properly titled map that shows the 1928 Plat, roads, alleys, trolley and rail lines. Make sure you have a scale bar, north arrow, clear legend and your name. Try making the 1928 Plat somewhat transparent to make the digitized layers stand out. Print a second, properly titled with legend, scale bar and north arrow map showing two panels, one on the left with the 1928 buildings and parcels, and one on the right with the current/2004 buildings and parcels for the 4-block area. Part 3 In this assignment, you will use 2004 Parcel/Tax records and the 1928 plat map to identify and mark (select & assign) the parcels that did not have a house appearing on the 1928 Plat, but have been built on since. You are given a current parcel layer that shows all currently built on parcels (2004). Note: This layer in only polygons, it does not show the actual buildings. You don t need to do anything with this layer. This layer is called 2004_ Parcels. You are also given a exact copy of 2004_Parcels titled Layer_for_Marking_Recently_Built. This is the layer you will be using to indicate the parcels (property) that have been built on since How you can tell if something has been built since 1928? By noticing that the polygon is blank on the 1928 Plat does not have a house on the 1928 Map. (don t worry about garages). 2
3 For your information, I also included a current air photo. You do not need to do anything with this photo, titled Current_Air_Photo, it is provided for interest and information. STEPS Copy all shape file layers to your USB drive, and work from this (remember, relative paths) Add the shapefile \Layer_for_Marking_Recently_Built.shp Open Attibutes of the Layer_for_Marking_Recently_Built. Add a new field called After_1928 (Use Text, 10 character length) Change the Layer_for_Marking_Recently_Built to just show the outline of the polygons (so you can see through the layer). Add or open the 1928_Plat. Start Editing the Layer_for_Marking_Recently_Built. Your job is to select the parcels THAT DO NOT HAVE A HOUSE in

4 Parcel you select in the Marking layer Use Select Features (you can hold the shift key down to select several parcels) or use the Selection Interactive Selection to select a large number of adjacent parcels. Notice the layers don t quite line up due to registration errors and errors in the original hand drawn 1928 Plat. Make sure you mark unbuilt parcels correctly. Empty 1928 Parcel Note that red houses are brick, Gray houses are stone or stucco And yellow houses are wooden. Garages are red, gray or yellow also but have faint X on the roof. 4

 and assign the After_1928 field to")
5 Select many polygons with the Interactive Selection method Select Features Cursor Once you have selected a parcel (or a group of parcels) use the Calculate Values (see Lab 6) and assign the After_1928 field to Yes. 5
6 6

7 Do the marking in stages. Don t try and mark all the unbuilt at once. If you make a mistake you with lots of records selected you will end up repeating the selection process. Mark a few, assign a few, mark a few assign a few; Save frequently. After you are have set all the unbuilt in the After_1928 field, use Select by Attributes to find the After_1928 = Yes. Then use the Options SWITCH SELECTION. This will mark the remaining records. Assign these records to No in the After_1928 column. In the next assignment you will be clipping the areas outside the North Saint Anthony Park neighborhood so extend your selection well beyond the boundary streets. Wood House Stucco House Brick House Garage 7

8 Display the Yes / No field, called After_1928 on top of your 1928 Plat, Road, Alleys, Trolley, Rail lines. Use colors and/or make appropriate layers partially transparent to allow the Map to be self-evident. Here is a sample showing the lots built on between 1928 and 2004 in green. The color is just to help you understand the idea. Please choose better colors and or shading to show the increase in housing density over 76 years. 8
9 Print and submit via Moodle a properly titled map that shows the 1928 Plat, roads, alleys, trolley, rail lines, and property built on after 1928 (After_1928 = Yes ). Make sure you have a scale bar, north arrow, clear legend and your name. Part 4 1 st Map to Print as PDF: Create a new polygon layer named Boundary. Digitize the boundary of N. St. Anthony Park, using the plat map and images as your guide. The boundary is defined by the city limits on the west and north, the city limits down Cleveland Ave. to Como Blvd. to Fifield St on the east, and the Railroad line in the South. You will not need any features beyond those limits. Add the layer SAP\rams_rd.shp. This is 2004 Ramsey County Roads. Use the boundary layer to Clip all the other layers. (See concepts in Lab 9 & 10) ArcToolboxAnalysis Tools ExtractClip. For the Plat_1928 (raster) use ArcToolboxSpatial Analyst Tools Extraction Extract by Mask. The mask should be your boundary layer and the Plat is your input raster. Use the Environments button at the bottom to select Raster Analysis Settings and select the cell size to be same as plat_1928. The result may be in Black and White. Use Calculate Geometry to calculate the total length of the roads in N. St. Anthony Park in 1928 and (Use your clipped roads layers, total the length field for all the road segments with the sigma/statistics button). Subtract and note the difference. Print a properly titled map (build on your Part 3 Map), that shows clipped N. St. Anthony Park Plat, roads, alleys, trolley, rail lines, boundary and properties built on after Make sure you have a scale bar, north arrow, clear legend and your name. Add a text note to the Map explaining the difference in the overall length (not alleys) in the roads over 76 years, in kilometers. Add a text note about the change in housing density since nd Map to Print as PDF: Now add the data layers you created for the focus block parcels and houses for 1928 and Add attributes for the area for the buildings layers, and the parcels layers, for both periods (4 layers total). 9
10 Use calculate geometry to calculate the area for buildings, and parcels in the respective layers. Restrict all the parcel calculations only to the parcel area in the 4+ focus blocks, NOT the total area of the focusblocks layer (only calculate areas on parcels and buildings, omit the roads, alleys, and other non-parcel, non-building areas from calculations). Calculate the number parcels where a building was built between 1928 and 2004 for this 4-block area. Calculate the average parcel size in 1928 and 2004 for this 4+-block area. Calculate the average HOUSE size in 1928 and 2008 for this 4+-block area. Calculate the average number of buildings per parcel in this 4+-block area Create a two-panel layout that shows the buildings and parcels, the left for 1928, and the right for ca Place the parcels and buildings layers in each respective layout. For the 1928, place the plat image in the background, with something like 25 to 45% transparency, and for place the 2006 image (2006foc_blk.tif) as background, with similar transparency to the plat. Include the calculations for average parcel size, house size, and buildings per parcel on each panel. Include information on the number of parcels with new construction in an overall text label or comment. For Extra Credit (5 pts). Register the Plat_1916. Use the above roads layer as the control. Notice the differences in the number of buildings as well as changes on the St. Paul Campus between 1916 and Significant home construction took place between 1916 and 1928 mostly north & east of the Street Car (trolley) line down Como Avenue. 10
Creating a reference map
 Chapter 1 Creating a reference map Reference maps are basic, traditional maps. Their purpose is to illustrate geographic boundaries for cities, counties, and other areas. Reference maps have no underlying
GIS Fundamentals: Supplementary Lessons with ArcGIS Pro
 Station Analysis (parts 1 & 2) What You ll Learn: - Practice various skills using ArcMap. - Combining parcels, land use, impervious surface, and elevation data to calculate suitabilities for various uses
Name: Date: June 27th, 2011 GIS Boot Camps For Educators Lecture_3
 Name: Date: June 27th, 2011 GIS Boot Camps For Educators Lecture_3 Practical: Creating and Editing Shapefiles Using Straight, AutoComplete and Cut Polygon Tools Use ArcCatalog to copy data files from:
Lab 3: Digitizing in ArcGIS Pro
 Lab 3: Digitizing in ArcGIS Pro What You ll Learn: In this Lab you ll be introduced to basic digitizing techniques using ArcGIS Pro. You should read Chapter 4 in the GIS Fundamentals textbook before starting
GIS Virtual Workshop: Buffering
 This workshop will teach the different methods of buffering data. They will include: Basic buffering of data Merging buffering zones Clipping the buffer Concentric rings around the object You will find
Georeferencing and Digitizing
 INTRODUCTION There is a great deal of geographic data available in formats that cannot be immediately integrated with other GIS data. In order to use these types of data in GIS it is necessary to align
Geography 281 Map Making with GIS Project Six: Labeling Map Features
 Geography 281 Map Making with GIS Project Six: Labeling Map Features In this activity, you will explore techniques for adding text to maps. As discussed in lecture, there are two aspects to using text
Geography 281 Map Making with GIS Project Two: Map Design Issues in ArcMap
 Geography 281 Map Making with GIS Project Two: Map Design Issues in ArcMap This activity provides an introduction to the map design process. It takes you through a typical sequence from the initial decision
Microsoft Excel 2007 Lesson 7: Charts and Comments
 Microsoft Excel 2007 Lesson 7: Charts and Comments Open Example.xlsx if it is not already open. Click on the Example 3 tab to see the worksheet for this lesson. This is essentially the same worksheet that
_Tutorials. Arcmap. Linking additional files outside from Geodata
 _Tutorials Arcmap Linking additional files outside from Geodata 2017 Sourcing the Data (Option 1): Extracting Data from Auckland Council GIS P1 First you want to get onto the Auckland Council GIS website
GIS Basics for Urban Studies
 GIS Basics for Urban Studies Date: March 21, 2018 Contacts: Mehdi Aminipouri, Graduate Peer GIS Faciliator, SFU Library (maminipo@sfu.ca) Keshav Mukunda, GIS & Map Librarian Librarian for Geography (kmukunda@sfu.ca)
Lab 3: Digitizing in ArcMap
 Lab 3: Digitizing in ArcMap What You ll Learn: In this Lab you ll be introduced to basic digitizing techniques using ArcMap. You should read Chapter 4 in the GIS Fundamentals textbook before starting this
Exercise 1: An Overview of ArcMap and ArcCatalog
 Exercise 1: An Overview of ArcMap and ArcCatalog Introduction: ArcGIS is an integrated collection of GIS software products for building a complete GIS. ArcGIS enables users to deploy GIS functionality
City of Richmond Interactive Map (RIM) User Guide for the Public
 User Guide for the Public") Interactive Map (RIM) User Guide for the Public Date: March 26, 2013 Version: 1.0 3479477 3479477 Table of Contents Table of Contents Table of Contents... i About this
Interactive Map (RIM) User Guide for the Public Date: March 26, 2013 Version: 1.0 3479477 3479477 Table of Contents Table of Contents Table of Contents... i About this
Project 2 CIVL 3161 Advanced Editing
 Project 2 CIVL 3161 Advanced Editing Introduction This project will involve more advanced editing/manipulation of data within ArcGIS. You will use the map that you create in this project as a starting
Getting Started with GIS using ArcGIS 10.6 What is GIS? and - Module 1 Creating a map document
 Getting Started with GIS using ArcGIS 10.6 What is GIS? and - Module 1 Creating a map document Marcel Fortin Map & Data Library mdl@library.utoronto.ca 2018 http://mdl.library.utoronto.ca This workshop
An Introduction to Geographic Information Systems (GIS) using ArcGIS 9.2
 using ArcGIS 9.2") An Introduction to Geographic Information Systems (GIS) using ArcGIS 9.2 by Marcel Fortin, GIS and Map Librarian, University of Toronto Libraries, 2009 gis.maps@utoronto.ca http://www.library.utoronto.ca/maplib/
An Introduction to Geographic Information Systems (GIS) using ArcGIS 9.2 by Marcel Fortin, GIS and Map Librarian, University of Toronto Libraries, 2009 gis.maps@utoronto.ca http://www.library.utoronto.ca/maplib/
Lab 3. Introduction to GMT and Digitizing in ArcGIS
 Lab 3. Introduction to GMT and Digitizing in ArcGIS GEY 430/630 GIS Theory and Application Purpose: To learn how to use GMT to make basic maps and learn basic digitizing techniques when collecting data
MAPLOGIC CORPORATION. GIS Software Solutions. Getting Started. With MapLogic Layout Manager
 MAPLOGIC CORPORATION GIS Software Solutions Getting Started With MapLogic Layout Manager Getting Started with MapLogic Layout Manager 2011 MapLogic Corporation All Rights Reserved 330 West Canton Ave.,
GPS TO GIS EXERCISE (30 PTS)
") GPS TO GIS EXERCISE (30 PTS) This exercise will allow you to demonstrate your cumulative knowledge of using a GPS receiver to collect data with locational information, downloading this data to a desktop
GPS TO GIS EXERCISE (30 PTS) This exercise will allow you to demonstrate your cumulative knowledge of using a GPS receiver to collect data with locational information, downloading this data to a desktop
Lab 8: More Spatial Selection, Importing, Joining Tables
 Lab 8: More Spatial Selection, Importing, Joining Tables What You ll Learn: This lesson introduces spatial selection, importing text, combining rows, and joins. You should have read, and be ready to refer
Lab 12: Sampling and Interpolation
 Lab 12: Sampling and Interpolation What You ll Learn: -Systematic and random sampling -Majority filtering -Stratified sampling -A few basic interpolation methods Videos that show how to copy/paste data
Introduction to GIS A Journey Through Gale Crater
 Introduction to GIS A Journey Through Gale Crater In this lab you will be learning how to use ArcMap, one of the most common commercial software packages for GIS (Geographic Information System). Throughout
1. Preparing the base map. 2. Creating new shapefiles. Collecting Spatial Data by Digitizing
 Topics: 1. Preparing the base map 2. Creating new shapefiles 3. Digitizing Features 4. Modifying Existing Features 5. Adding Data Fields and editing Feature Attributes 6. Displaying and Labelling features
Lab 12: Sampling and Interpolation
 Lab 12: Sampling and Interpolation What You ll Learn: -Systematic and random sampling -Majority filtering -Stratified sampling -A few basic interpolation methods Data for the exercise are in the L12 subdirectory.
A Second Look at DEM s
 A Second Look at DEM s Overview Detailed topographic data is available for the U.S. from several sources and in several formats. Perhaps the most readily available and easy to use is the National Elevation
MAPLOGIC CORPORATION. GIS Software Solutions. Getting Started. With MapLogic Layout Manager
 MAPLOGIC CORPORATION GIS Software Solutions Getting Started With MapLogic Layout Manager Getting Started with MapLogic Layout Manager 2008 MapLogic Corporation All Rights Reserved 330 West Canton Ave.,
GIS LAB 1. Basic GIS Operations with ArcGIS. Calculating Stream Lengths and Watershed Areas.
 GIS LAB 1 Basic GIS Operations with ArcGIS. Calculating Stream Lengths and Watershed Areas. ArcGIS offers some advantages for novice users. The graphical user interface is similar to many Windows packages
Lab 11: Terrain Analyses
 Lab 11: Terrain Analyses What You ll Learn: Basic terrain analysis functions, including watershed, viewshed, and profile processing. There is a mix of old and new functions used in this lab. We ll explain
Using GIS To Estimate Changes in Runoff and Urban Surface Cover In Part of the Waller Creek Watershed Austin, Texas
 Using GIS To Estimate Changes in Runoff and Urban Surface Cover In Part of the Waller Creek Watershed Austin, Texas Jordan Thomas 12-6-2009 Introduction The goal of this project is to understand runoff
Basic Mapping: Livelihood Zones In Haiti
 Basic Mapping: Livelihood Zones In Haiti - 2009 Barbara Parmenter, revised by Carolyn Talmadge 9/10/2016 DATA SOURCES... 1 MAPPING NETWORK DRIVES OUTSIDE THE DATA LAB... 2 SETTING UP YOUR ARCMAP SESSION...
Full Search Map Tab. This map is the result of selecting the Map tab within Full Search.
 Full Search Map Tab This map is the result of selecting the Map tab within Full Search. This map can be used when defining your parameters starting from a Full Search. Once you have entered your desired
Property Search Tips and Tricks
 Property Search Tips and Tricks Search by Property Address can be used to search single or ranges of addresses 1. To search for a single address, start typing the address in the field. The system will
Creating a Smaller Data Set from a Larger Data Set Vector Data
 Creating a Smaller Data Set from a Larger Data Set Vector Data Written by Barbara Parmenter, revised by Carolyn Talmadge January 16, 2015 USING THE SELECTION METHOD QUICK METHOD BY CREATING A LAYER FILE...
Research Guide. Using Sanborn Maps
 Research Guide Using Sanborn Maps Prepared by: Ralph B. Taylor Date of last revision: 11/26/2007 Research Guide: Using Sanborn Maps 1 Background Sanborn Maps were used by planners, prior to the advent
Full Search Map Tab Overview
 FlexMLS Map Server Full Search Map Tab Overview The Full Search Map tab is a need to know module. It is accessible when you use Full Search under Search in the Main Menu tree of FlexMLS. This map can
Tricks and Tips of Creating a Layered, Geo-Enabled Adobe PDF Map
 Tricks and Tips of Creating a Layered, Geo-Enabled Adobe PDF Map John M. Bocan GIS Programmer/Analyst West Virginia Geological and Economic Survey (WVGES) Digital Mapping Techniques Williamsburg, VA. May
Step by Step How to Manual
 www.quintewestmaps.com Step by Step How to Manual Click on to accept the disclaimer and go to the web GIS Step by Step Web Based GIS Interface Layout of Web Based GIS Save your Favorite Map Views Link
Autodesk Tinkercad Badge Guide
 Autodesk Tinkercad Badge Guide Abstract: Gain basic understanding of creating objects in Tinkercad; personalize and prepare those objects for TinkerCrafting (Minecraft import) Authors: John Helfen & Lynn
Lab 11: Terrain Analyses
 Lab 11: Terrain Analyses What You ll Learn: Basic terrain analysis functions, including watershed, viewshed, and profile processing. There is a mix of old and new functions used in this lab. We ll explain
Minnesota Department of Natural Resources ArcView Utilities Extension User s Guide
 Introduction This document describes the functionality and use of the ArcView Utilities extension for the ArcView desktop GIS software. These tools were developed out of the need for additional geoprocessing
Lab 5: Georeferencing, Digitization, and Processing
 Lab 5: Georeferencing, Digitization, and Processing Purpose: An introduction to georeferencing images, practice digitizing, and combine lesson up to this point. To Do: Register a scanned image, digitize
Ex. 4: Locational Editing of The BARC
 Ex. 4: Locational Editing of The BARC Using the BARC for BAER Support Document Updated: April 2010 These exercises are written for ArcGIS 9.x. Some steps may vary slightly if you are working in ArcGIS
GIS LAB 8. Raster Data Applications Watershed Delineation
 GIS LAB 8 Raster Data Applications Watershed Delineation This lab will require you to further your familiarity with raster data structures and the Spatial Analyst. The data for this lab are drawn from
LAB 9: Buffering and Overlay in ArcGIS - ArcMAP
 LAB 9: Buffering and Overlay in ArcGIS - ArcMAP What You ll Learn: to apply the concepts of buffering and overlay, two common cartographic operations. You should read chapter 9 in the GIS Fundamentals
Excel Basics Fall 2016
 If you have never worked with Excel, it can be a little confusing at first. When you open Excel, you are faced with various toolbars and menus and a big, empty grid. So what do you do with it? The great
RAPIDMAP Geocortex HTML5 Viewer Manual
 RAPIDMAP Geocortex HTML5 Viewer Manual This site was developed using the evolving HTML5 web standard and should work in most modern browsers including IE, Safari, Chrome and Firefox. Even though it was
Lab 6: Transforming Spatial Data
 Lab 6: Transforming Spatial Data Objectives: The primary objectives of this lab are to georeference a raster dataset and to create GIS data by digitizing features from an image as a backdrop. Specifics:
Descriptive Statistics. Project 3 CIVL 3103
 Project 3 CIVL 3103 Descriptive Statistics Introduction In our course, we have discussed interpolation for a single set of point data. However, many datasets that are used by engineers are spatial in nature,
Basic Mapping: Livelihood Zones In Haiti
 Basic Mapping: Livelihood Zones In Haiti - 2009 Barbara Parmenter, revised by Carolyn Talmadge 9/10/2017 for ArcMap 10.5.1 DATA SOURCES... 1 MAPPING NETWORK DRIVES OUTSIDE THE DATA LAB... 2 SETTING UP
City of La Crosse Online Mapping Website Help Document
 City of La Crosse Online Mapping Website Help Document This document was created to assist in using the new City of La Crosse online mapping sites. When the website is first opened, a map showing the City
Geology & Geophysics REU GPS/GIS 1-day workshop handout #2: Importing Field Data to ArcGIS
 Geology & Geophysics REU GPS/GIS 1-day workshop handout #2: Importing Field Data to ArcGIS In this lab you ll start to use some basic ArcGIS routines. These include importing GPS field data and creating
1. Start ArcMap by going to the Start menu > All Programs > ArcGIS > ArcMap.
 Learning ArcGIS: Introduction to ArcMap 10.1 The Map Document Feature Manipulation Navigating ArcMap Map Documents, Layers, and Features Shapes, Location, and Attribute Data Symbology Zoom, Pan and Map
Georeferencing Imagery in ArcGIS 10.3.x
 Georeferencing Imagery in ArcGIS 10.3.x Georeferencing is the process of aligning imagery (maps, air photos, etc.) with spatial data such as point, lines or polygons (for example, roads and water bodies).
Explore some of the new functionality in ArcMap 10
 Explore some of the new functionality in ArcMap 10 Scenario In this exercise, imagine you are a GIS analyst working for Old Dominion University. Construction will begin shortly on renovation of the new
Geography 281 Mapmaking with GIS Project One: Exploring the ArcMap Environment
 Geography 281 Mapmaking with GIS Project One: Exploring the ArcMap Environment This activity is designed to introduce you to the Geography Lab and to the ArcMap software within the lab environment. Please
Citizens MapViewer User Manual
 Citizens MapViewer User Manual This guide has been designed with step-by-step instructions to help familiarize you with using the city s Citizens MapViewer. Each of the controls (menus and buttons) is
Session 3: Cartography in ArcGIS. Mapping population data
 Exercise 3: Cartography in ArcGIS Mapping population data Background GIS is well known for its ability to produce high quality maps. ArcGIS provides useful tools that allow you to do this. It is important
Introduction to LiDAR
 Introduction to LiDAR Our goals here are to introduce you to LiDAR data. LiDAR data is becoming common, provides ground, building, and vegetation heights at high accuracy and detail, and is available statewide.
-In windows explorer navigate to your Exercise_4 folder and right-click the DEC_10_SF1_P1.csv file and choose Open With > Notepad.
 BIOL 4460/5460 and GEOL 4460 Introduction to GIS LAB 4 MAKING A THEMATIC MAP This exercise is to show you how to create a map for printing. As you have seen in the lecture, maps can have different purposes
SAGIS Property Map Viewer Instruction Manual Instructions for using the SAGIS Property Map Viewer. Published December 21, 2018.
 SAGIS Property Map Viewer Instruction Manual www.sagis.org/map Instructions for using the SAGIS Property Map Viewer. Published December 21, 2018. 1 Instructional Videos Click on a link to watch a video
Table of Contents. Map Layout... 5 Layer List - Default... 6 Identify... 7 Search Method... 8
 Table of Contents Map Layout... 5 Layer List - Default... 6 Identify... 7 Search Method... 8 1. Targeted Search... 8 2. Query Tool... 11 A. Select Parcel by entering Parcel Number... 12 B. Select Parcel
Geography 281 Mapmaking with GIS Project One: Exploring the ArcMap Environment
 Geography 281 Mapmaking with GIS Project One: Exploring the ArcMap Environment This activity is designed to introduce you to the Geography Lab and to the ArcMap software within the lab environment. Before
Gaston County GIS. Interactive Mapping Website
 Gaston County GIS Interactive Mapping Website The Gaston County GIS mapping website optimizes the available window viewing area and has interactive tools, collapsible menus and movable windows. This map
LAB EXERCISE #1 (25pts)
") Grossmont College Introduction to Geographic Information Science Name: Instructors: Judd Curran & Mark Goodman 1 LAB EXERCISE #1 (25pts) ArcGIS Map Projection on the Fly: Working with: U.S. Map illustrating
Grossmont College Introduction to Geographic Information Science Name: Instructors: Judd Curran & Mark Goodman 1 LAB EXERCISE #1 (25pts) ArcGIS Map Projection on the Fly: Working with: U.S. Map illustrating
Exercise 4: Import Tabular GPS Data and Digitizing
 Exercise 4: Import Tabular GPS Data and Digitizing You can create NEW GIS data layers by digitizing on screen with an aerial photograph or other image as a back-drop. You can also digitize using imported
HBS Training - IT Solutions. PlanWeb. Intermediate
 HBS Training - IT Solutions PlanWeb Intermediate CONTENTS Logging on to the system...3 The PlanWeb Window...5 The Tool Bar...6 The Status Bar...6 The Map Window...6 The Information Window...7 Changing
The Data Journalist Chapter 7 tutorial Geocoding in ArcGIS Desktop
 The Data Journalist Chapter 7 tutorial Geocoding in ArcGIS Desktop Summary: In many cases, online geocoding services are all you will need to convert addresses and other location data into geographic data.
Ancient Cell Phone Tracing an Object and Drawing with Layers
 Ancient Cell Phone Tracing an Object and Drawing with Layers 1) Open Corel Draw. Create a blank 8.5 x 11 Document. 2) Go to the Import option and browse to the Graphics 1 > Lessons folder 3) Find the Cell
Introduction to using QGIS for Archaeology and History Workshop by the Empirical Reasoning Center
 Introduction to using QGIS for Archaeology and History Workshop by the Empirical Reasoning Center In this workshop, we will cover the basics of working with spatial data, as well as its main uses for archaeology.
STUDENT PAGES GIS Tutorial Treasure in the Treasure State
 STUDENT PAGES GIS Tutorial Treasure in the Treasure State Copyright 2015 Bear Trust International GIS Tutorial 1 Exercise 1: Make a Hand Drawn Map of the School Yard and Playground Your teacher will provide
To show toolbars, double-click in the banner at the top or click the tools icon
 8/15/2013 Welcome to Culver City s GIS Property Information Search 2.0. This instructional document provides an overview of most commonly used functionality in this streamlined, enhanced web map application.
Watershed Sciences 4930 & 6920 GEOGRAPHIC INFORMATION SYSTEMS
 Watershed Sciences 4930 & 6920 GEOGRAPHIC INFORMATION SYSTEMS WATS 4930/6920 WHERE WE RE GOING WATS 6915 welcome to tag along for any, all or none WEEK FIVE Lecture VECTOR ANALYSES Joe Wheaton HOUSEKEEPING
FACULTY AND STAFF COMPUTER FOOTHILL-DE ANZA. Office Graphics
 FACULTY AND STAFF COMPUTER TRAINING @ FOOTHILL-DE ANZA Office 2001 Graphics Microsoft Clip Art Introduction Office 2001 wants to be the application that does everything, including Windows! When it comes
layers in a raster model
 layers in a raster model Layer 1 Layer 2 layers in an vector-based model (1) Layer 2 Layer 1 layers in an vector-based model (2) raster versus vector data model Raster model Vector model Simple data structure
As a GIS technician, your job will be to take the available data and develop suitability maps for the site.
 Study Guide: Geographic Informations Systems Area: Land-use Analysis with ArcView 3.x Subject: Using Soil maps to Assess site suitability Objectives: Upon completing this study guide you should be able
UMATILLA COUNTY SURVEYOR RECORDS
 UMATILLA COUNTY SURVEYOR RECORDS DESCRIPTION OF RECORDS AND INSTRUCTIONS FOR USE General Records on this website include the following files: (1) A 1914 Standard Atlas of Umatilla County, compiled and
FlexMLS Maps Quick Reference Guide
 FlexMLS Maps Quick Reference Guide Full Search Map Tab Features Define Search Areas box Map tab in Full Search Radius Search tool from an address Show/Hide Property List, Locate Address, and Define Search
Community Health Maps Lab Series
 Community Health Maps Lab Series Lab 6 Data Visualization with Carto Objective Understand how to upload and style data with Carto to create an online visualization of your data Document Version: 2017-08-28(Final)
Step by Step GIS. Section 1
 Step by Step GIS Section 1 Contact the web page given below for the data required to do the exercises (http://www.pasda.psu.edu/default.asp) Before beginning the tutorials please visit the Preparation
GORE BUILDING. 238 N. Massachusetts Avenue, Lakeland, FL 33801
 GORE BUILDING 238 N. Massachusetts Avenue, Lakeland, FL 33801 CDB LOCATION REDEVELOPMENT PROJECT MUNN PARK HISTORIC DISTRICT INCENTIVES AVAILABLE ADJACENT PARKING INCLUDED BK698301 Phone: (863) 683-3425
Downloading 2010 Census Data
 Downloading 2010 Census Data These instructions cover downloading the Census Tract polygons and the separate attribute data. After that, the attribute data will need additional formatting in Excel before
GEO 465/565 - Lab 7 Working with GTOPO30 Data in ArcGIS 9
 GEO 465/565 - Lab 7 Working with GTOPO30 Data in ArcGIS 9 This lab explains how work with a Global 30-Arc-Second (GTOPO30) digital elevation model (DEM) from the U.S. Geological Survey. This dataset can
Advanced Map Labeling using Maplex. Wendy Harrison & Samuel Troth
 Advanced Map Labeling using Maplex Wendy Harrison & Samuel Troth Presentation Overview We ll be using ArcGIS Pro Introduction - Different types of text in ArcGIS - role of the Maplex Label Engine labeling
Exercise 5: Import Tabular GPS Data and Digitizing
 Exercise 5: Import Tabular GPS Data and Digitizing You can create NEW GIS data layers by digitizing on screen with an aerial photograph or other image as a back-drop. You can also digitize using imported
Geography 104 Instructors: Judd Curran & Mark Goodman. LAB EXERCISE #3 Data Analysis - Buffering (25pts)
") Instructors: Judd Curran & Mark Goodman Name: LAB EXERCISE #3 Data Analysis - Buffering (25pts) Transformations in GIS are methods that transform GIS objects and databases into more useful products using
Instructors: Judd Curran & Mark Goodman Name: LAB EXERCISE #3 Data Analysis - Buffering (25pts) Transformations in GIS are methods that transform GIS objects and databases into more useful products using
Manitowoc County, WI Advanced Access GIS Viewer User Documentation
 Manitowoc County, WI Advanced Access GIS Viewer User Documentation Introduction Extensive time was put into developing this website both from a display, and from a printing and scaling perspective. This
Welcome to the Lebanon County ArcGIS Online Property Viewer User Guide
 Welcome to the Lebanon County ArcGIS Online Property Viewer User Guide GIS stands for Geographic Information Systems. It is a computer system utilized for capturing, storing, and displaying data in relation
ArcGIS Basics: Somerville Creating a Map with ArcMap
 ArcGIS Basics: Somerville Creating a Map with ArcMap Written by Barbara M. Parmenter, revised by Carolyn Talmadge on 8/18/2017 for 10.5.1 Tufts Data Lab 1. INTRODUCTION... 1 DOWNLOAD THE TUTORIAL DATA...
Geocoding vs. Add XY Data using Reference USA data in ArcMap
 Geocoding vs. Add XY Data using Reference USA data in ArcMap 10.4.1 Written by Barbara Parmenter. Revised by Carolyn Talmadge 2/27/2017 GETTING BUSINESS DATA FROM REFERENCE USA BY NAICS AND CITY... 2 MODIFY
Geographical Information Systems Institute. Center for Geographic Analysis, Harvard University. LAB EXERCISE 1: Basic Mapping in ArcMap
 Harvard University Introduction to ArcMap Geographical Information Systems Institute Center for Geographic Analysis, Harvard University LAB EXERCISE 1: Basic Mapping in ArcMap Individual files (lab instructions,
FOR 240 Lab 8 Assignment Using GPS to Collect Spatial Data of Forest Management Introduction to Computing in Natural Resources
 FOR 240 Lab 8 Assignment Using GPS to Collect Spatial Data of Forest Management Introduction to Computing in Natural Resources In this lab, we are going to use the GPS to collect timber cruising data.
GIS Change Requests: Web Base change requests will replace MSAG Update paper form.
 GIS Change Requests: Web Base change requests will replace MSAG Update paper form. Types of edits that will need to be reported Individual address edits (move, delete, add or change) Road edits (add, delete,
Geography 281 Map Making with GIS Project Three: Viewing Data Spatially
 Geography 281 Map Making with GIS Project Three: Viewing Data Spatially This activity introduces three of the most common thematic maps: Choropleth maps Dot density maps Graduated symbol maps You will
Introduction to GIS & Mapping: ArcGIS Desktop
 Introduction to GIS & Mapping: ArcGIS Desktop Your task in this exercise is to determine the best place to build a mixed use facility in Hudson County, NJ. In order to revitalize the community and take
HBS Training - IT Solutions. PlanWeb. Introduction
 HBS Training - IT Solutions PlanWeb Introduction CONTENTS Logging on to the system...3 The PlanWeb Window...5 The Tool Bar...6 The Status Bar...6 The Map Window...6 The Information Window...7 Changing
ArcGIS Basics: Creating a Map with ArcMap (India Data)
") ArcGIS Basics: Creating a Map with ArcMap (India Data) Written by Barbara Parmenter and Irina Rasputnis, updated by Carolyn Talmadge on January 14, 2015 INTRODUCTION...1 MUGAR LAB NOTE: MAPPING A NETWORK
ArcGIS Basics: Creating a Map with ArcMap (India Data) Written by Barbara Parmenter and Irina Rasputnis, updated by Carolyn Talmadge on January 14, 2015 INTRODUCTION...1 MUGAR LAB NOTE: MAPPING A NETWORK
Assimilating GIS-Based Voter Districting Processes in Maricopa County, Arizona
 Assimilating GIS-Based Voter Districting Processes in Maricopa County, Arizona Tim Johnson Geographic Information Systems Manager Maricopa County Recorder/Elections Department Abstract Accurate district
HOW TO GET A SOIL MAP FROM THE WEB SOIL SURVEY. By Charlene Costaris Horticultural Consultant Rutgers Cooperative Extension of Ocean County
 Cooperative Extension of Ocean County Extension Center 1623 Whitesville Road Toms River, NJ 08755-1199 ocean.njaes.rutgers.edu njaes.rutgers.edu/extension 732-349-1227 4-H 732-349-1246 Agriculture 732-505-3671
Digitising a map in arcgis desktop 10.3
 Digitising a map in arcgis desktop 10.3 1 CONTENTS 2 Evaluating your map... 2 3 Setting up the base map... 3 4 Georeferencing your map/maps... 3 4.1 Georeferencing tips.... 4 5 Digitising your maps...