Math 2 Spring Unit 5 Bundle Transformational Graphing and Inverse Variation
|
|
|
- Morris Willis
- 5 years ago
- Views:
Transcription
1 Math 2 Spring 2017 Unit 5 Bundle Transformational Graphing and Inverse Variation 1
2 Contents Transformations of Functions Day Transformations with Functions Day 1 HW Transformations with Functions Day Transformations with Functions Day 2 HW Transformations with Functions Day Transformations with Functions Day 3 HW Transformations of Quadratic Functions Day Transformations of Quadratic Functions Day 4 HW Transformations of Radical Functions Day Transformations of Radical Functions Day 5 HW Direct and Inverse Variation Day Direct and Inverse Variation Day 5 HW Graphing Inverse Variation Day Graphing Inverse Variation Day 6 HW Unit 5 Review
3 Transformations of Functions Day 1 To the right is a graph of a function F(x). We can use F(x) functions to explore transformations in the coordinate plane. I. Let s review briefly. 1. a. Explain what a function is in your own words. b. Using the graph, how do we know that F(x) is a function? F(x) 2. a. Explain what we mean by the term domain. b. Using the graph, what is the domain of F(x)? 3. a. Explain what we mean by the term range. b. Using the graph, what is the range of F(x)? 4. Let s explore the points on F(x). a. How many points lie on F(x)? Can you list them all? b. What are the key points that would help us graph F(x)? We are going to call these key points characteristic points. It is important when graphing a function that you are able to identify these characteristic points. c. Use the graph of graph to evaluate the following. F(1) = F( 1) = F( ) = 2 F(5) = 3
4 II. Remember that F(x) is another name for the y-values. Therefore the equation of F(x) is y = F(x). x 1 F(x) Why did we choose those x-values to put in the table? Now let s try graphing G(x): y = F(x) + 4. Complete the table below for this new function and then graph G(x)on the coordinate plane above. y = F(x) + 4 x y What type of transformation maps F(x), to G(x), F(x) + 4? (Be specific.) 3. How did this transformation affect the x-values? (Hint: Compare the characteristic points of F(x) and G(x)) 4. How did this transformation affect the y-values? (Hint: Compare the characteristic points of F(x) and G(x)) 5. In y = F(x) + 4, how did the +4 affect the graph of F(x)? Did it affect the domain or the range? 4
5 III. Suppose G(x) s equation is: y = F(x) 3. Complete the table below for this new function and then graph G(x)on the coordinate plane above. y = F(x) 3 x y What type of transformation maps F(x), F(x), to G(x), F(x) 3? Be specific. 2. How did this transformation affect the x-values? (Hint: Compare the characteristic points of F(x) and G(x)) 3. How did this transformation affect the y-values? (Hint: Compare the characteristic points of F(x) and G(x)) 4. In y = F(x) 3, how did the 3 affect the graph of F(x)? Did it affect the domain or the range? IV. Checkpoint: Using the understanding you have gained so far, describe the affect to F(x) for the following functions. Equation Example: y=f(x) + 18 Effect to F(x) s graph Translate up 18 units 1. y = F(x) y = F(x) y = F(x) y = F(x) 521 5
6 V. Suppose G(x) s equation is: y = F(x + 4). 1. Complete the table. x x + 4 y (Hint: Since, x + 4 = 1, subtract 4 from both sides of the equation, and x = 5. Use a similar method to find the missing x values.) 2. On the coordinate plane above, graph the 4 ordered pairs (x, y). The first point is ( 5, 1). 3. What type of transformation maps F(x), F(x), to G(x), F(x + 4)? (Be specific.) 4. How did this transformation affect the x-values? (Hint: Compare the characteristic points of F(x) and G(x)) 5. How did this transformation affect the y-values? (Hint: Compare the characteristic points of F(x) and G(x)) 6. In y = F(x + 4), how did the +4 affect the graph of F(x)? Did it affect the domain or the range? 6
7 VI. Suppose G(x) s equation is: y = F(x 3). Complete the table below for this new function and then graph G(x)on the coordinate plane above. 1. Complete the table. y = F(x 3) x x 3 y On the coordinate plane above, graph the 4 ordered pairs (x, y). [Hint: The 1 st point should be (2, 1).] 3. What type of transformation maps F(x), F(x), to G(x), F(x 3)? (Be specific.) 4. How did this transformation affect the x-values? (Hint: Compare the characteristic points of F(x) and G(x)) 5. How did this transformation affect the y-values? (Hint: Compare the characteristic points of F(x) and G(x)) 6. In y = F(x 3), how did the 3 affect the graph of F(x)? Did it affect the domain or the range? 7
8 VII. Checkpoint: Using the understanding you have gained so far, describe the effect to F(x) for the following functions. Equation Example: y=f(x + 18) Effect to F(x) s graph Translate left 18 units 1. y = F(x 10) 2. y = F(x) y = F(x + 48) 4. y = F(x) y = F(x + 30) + 18 VIII. Checkpoint: Using the understanding you have gained so far, write the equation that would have the following effect on F(x) s graph. Equation Example: y=f(x + 8) 1. Effect to F(x) s graph Translate left 8 units Translate up 29 units 2. Translate right 7 3. Translate left Translate left 5 and up Translate down 2 and right 6 8
9 IX. Now let s look at a new function. Its notation is H(x). Use H(x) to demonstrate what you have learned so far about the transformations of functions. 1. What are H(x) s characteristic points? 2. Describe the effect on H(x) s graph for each of the following. a. H(x 2) b. H(x) + 7 c. H(x+2) 3 3. Use your answers to questions 1 and 2 to help you sketch each graph without using a table. a. y = H(x 2) b. y = H(x) + 7 c. y = H(x+2) 3 9
10 Transformations with Functions Day 1 HW I. On each grid, R(x) is graphed. Graph the given function. 1. Graph: y = R(x) Graph: y = R(x + 2) Graph: y = R(x + 6) 4. Graph: y = G(x 4) 5 10
11 II. Using the understanding you have gained so far, describe the effect to F(x) for the following functions. Equation Effect to F(x) graph 6. y = F(x) y = F(x 13) 8. y = F(x + 9) 9. y = F(x) y = F(x 25) + 11 III. Using the understanding you have gained so far, write the equation that would have the following effect on F(x) s graph. Equation Effect to F(x) s graph 6. Translate left 51 units 7. Translate down Translate right Translate right 8 and down Translate down 12 and left 100 IV. Determine the domain and range of each parent function. 1. H(x) 2. R(x) Domain: Domain: Range: Range: 11
12 V. Consider a new function, P(x). P(x) s Domain is {x 2 x 2}. Its range is {y 3 y 1}. Use your understanding of transformations of functions to determine the domain and range of each of the following functions. (Hint: You may want to write the effect to P(x) first.) 1. P(x) P(x + 5) Domain: Domain: Range: Range: 12
13 Transformations with Functions Day 2 Today we will revisit F(x), our parent function, and investigate transformations other than translations. Recall that the equation for F(x) is y = F(x). Complete the chart with F(x) s characteristic points. x F(x) F(x) I. Let s suppose that G(x) is y = F(x) 7. Complete the table. y = F(x) x F(x) y On the coordinate plane above, graph the 4 ordered pairs (x, y). [Hint: The 1 st point should be ( 1, 1).] 9. What type of transformation maps F(x) to G(x), F(x)? (Be specific.) 10. How did this transformation affect the x-values? (Hint: Compare the characteristic points of F(x) and G(x)) 11. How did this transformation affect the y-values? (Hint: Compare the characteristic points of F(x) and G(x)) 12. In y = F(x), how did the negative coefficient of F(x) affect the graph of F(x)? How does this relate to our study of transformations earlier this semester? 13
14 II. Now let s suppose that G(x) is y = F( x) 1. Complete the table. y = F( x) x x y 1 F(x) On the coordinate plane above, graph the 4 ordered pairs (x, y). [Hint: The 1 st point should be (1, 1).] 3. What type of transformation maps F(x) to G(x), F( x)? (Be specific.) 4. How did this transformation affect the x-values? (Hint: Compare the characteristic points of F(x) and G(x)) 5. How did this transformation affect the y-values? (Hint: Compare the characteristic points of F(x) and G(x)) 6. In y = F( x), how did the negative coefficient of x affect the graph of F(x)? How does this relate to our study of transformations earlier this semester? III. Checkpoint: H(x) is shown on each grid. Use H(x) s characteristic points to graph H(x) s children without making a table. 1. y = H( x) 2. y = H(x) 14
15 IV. Now let s return to F(x), whose equation is y = F(x). Complete the chart with F(x) s characteristic points. x F(x) F(x) Let s suppose that G(x) is y = 4 F(x) 1. Complete the table. y = 4 F(x) x F(x) y On the coordinate plane above, graph the 4 ordered pairs (x, y). [Hint: The 1 st one should be ( 1, 4).] 3. How did this transformation affect the x-values? (Hint: Compare the characteristic points of F(x) and G(x)) 4. How did this transformation affect the y-values? (Hint: Compare the characteristic points of F(x) and G(x)) 5. In y = 4 F(x), the coefficient of F(x) is 4. How did that affect the graph of F(x)? Is this one of the transformations we studied? If so, which one? If not, explain. 15
16 V. Now let s suppose that G(x) is y = ½ F(x). 1. Complete the table. y = ½ F(x) x F(x) y 1 F(x) On the coordinate plane above, graph the 4 ordered pairs (x, y). [Hint: The 1 st one should be ( 1, ½).] 3. How did this transformation affect the x-values? (Hint: Compare the characteristic points of F(x) and G(x)) 4. How did this transformation affect the y-values? (Hint: Compare the characteristic points of F(x) and G(x)) 5. In y = ½ F(x), the coefficient of F(x) is ½. How did that affect the graph of F(x)? How is this different from the graph of y = 4 F(x) on the previous page? VI. Checkpoint: 1. Complete each chart below. Each chart starts with the characteristic points of F(x). x F(x) 3 F(x) x F(x) ¼ F(x) Compare the 2 nd and 3 rd columns of each chart above. The 2 nd column is the y-value for F(x). Can you make a conjecture about how a coefficient changes the parent graph? 16
17 VII. Now let s suppose that G(x) is y = 3 F(x). 1. Complete the table. y = 3 F(x) x F(x) y 1 F(x) On the coordinate plane above, graph the 4 ordered pairs (x, y). [Hint: The 1 st one should be ( 1, 3).] 3. Reread the conjecture you made in #7 on the previous page. Does it hold true or do you need to refine it? If it does need some work, restate it more correctly here. VIII. Checkpoint: Let s revisit H(x). 4. Describe the effect on H(x) s graph for each of the following. Example: 5H(x) Each point is reflected in the x-axis and is 5 times as far from the x-axis. d. 3H(x) e. 2H(x) f. 1 2 H(x) 5. Use your answers to questions 1 and 2 to help you sketch each graph without using a table. b. y = 3H(x) b. y = 2H(x) c. y = 1 2 H(x) 17
18 Transformations with Functions Day 2 HW This is the function B(x). 1. List its characteristic points. 2. Are these the only points on the graph of B(x)? Explain. 3. What is the domain of B(x)? 4. What is the range of B(x)? For each of the following, list the effect on the graph of B(x) and then graph the new function. 5. y = B( x) 6. y = B(x) 7. y = 1 3 B(x) 8. y = 3 B(x) 9. y = B(x 3) 10. y = B(x + 2) 1 18
19 Transformations with Functions Day 3 The graph of D(x), is shown. List the characteristic points of D(x). What is different about D(x) from the functions we have used so far?. Since D(x) is our original function, we will refer to him as the parent function. Using our knowledge of transformational functions, let s practice finding children of this parent. Note: In transformational graphing where there are multiple steps, it is important to perform the translations last. I. Example: Let s explore the steps to graph D(x) Jr, 2D(x + 3) + 5, without using tables. Step 1. The transformations represented in this new function are listed below in the order they will be performed. (See note above.) Vertical stretch by 2 (Each point moves twice as far from the x-axis.) Translate left 3. Translate up 5. Step 2. On the graph, put your pencil on the left-most characteristic point, ( 5, 1). Vertical stretch by 2 takes it to ( 5, 2). (Note that the originally, the point was 1 unit away from the x-axis. Now, the new point is 2 units away from the x-axis.) Starting with your pencil at ( 5, 2), translate this point 3 units to the left. Your pencil should now be on ( 8, 2). Starting with your pencil at ( 8, 2), translate this point up 5 units. Your pencil should now be on ( 8, 3). Plot the point ( 8, 3). It is recommended that you do this using a different colored pencil. Step 3. Follow the process used in Step 2 above to perform all the transformations on the other 3 characteristic points. Step 4. After completing Step 3, you will have all four characteristic points for E(x) Use these to complete the graph of E(x) Be sure you use a curve in the appropriate place. D(x) is not made of segments only. 19
20 II. D(x) has another child named C(x), D(x) 4 Using the process in the previous example as a guide, graph C(x) (without using tables). 1. List the transformations needed to graph C(x). (Remember, to be careful with order.). 2. Apply the transformations listed above to each of the four characteristic points. 3. Complete the graph of C(x) using your new characteristic points from #2. III. D(x) has another child named A(x), 3 D( x) Using the process in the previous example as a guide, graph A(x) (without using tables). 1. List the transformations needed to graph A(x). (Remember, to be careful with order.). 2. Apply the transformations listed above to each of the four characteristic points. 3. Complete the graph of A(x) using your new characteristic points from #2. 20
21 IV. Now that we have practiced transformational graphing with D(x) and his children, you and your partner should use the process learned from the previous three problems to complete the following. 1. Given K(x), graph: y = 3K(x) Given J(x), graph: y = J(x 3) 6 3. Given H(x), graph y = 3H(x) 21
22 4. Given B(x), graph: y = B( x) Given M(x), graph: y = 1 3 M(x) 22
23 V. Finally, let s examine a reflection of H(x) in the line y = x. 1. Graph this line (y = x) on the grid. 2. Using H(x) s characteristic points and the MIRA, graph H(x) s reflection. 3. Complete the charts below with the characteristic points: y = H(x) H(x) s reflection in y = x: x y x y 4. Compare the points in the two charts. Describe what happens when we reflect in the line y = x. (This should match what we learned in our earlier study of reflections in the line y = x.) 5. A reflection in the line y = x, shows a graph s inverse. We will study this in more depth in a future unit. Look at the graph of H(x) s inverse. Is the inverse a function? Explain how you know. 23
24 Transformations with Functions Day 3 HW 1. List the transformations needed to graph the following. Remember that translations are done last. a. y = 2F(x) + 2 b. y = 1 F(x 6) 3 c. y = F(x) 12 d. y = 3F(-x) e. y = 5F(x) 2. Looking back at the examples of parent functions we have worked with, create your own original parent function on the graph. Make sure that you have graphed a function. a. How can you tell your graph is a function? b. Explain the name you picked. c. Write an equation for your function that will have the following effects. Stretch vertically by 2 and translate left 4. Reflect in the x-axis and compress vertically by 1 2 Translate up 6 and right 4 d. Graph each of the children from part c above using a separate graph for each. You will need to use your own graph paper. 24
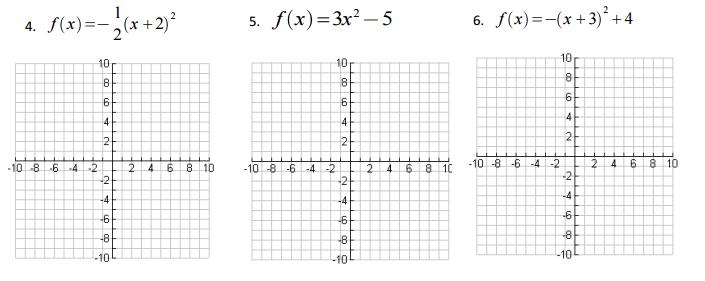
25 Transformations of Quadratic Functions Day 4 Quadratic Functions The parent function for a quadratic is The is NOT a transformation Example 1: Identify the transformations y = (x 3) You Try 1: Identify the transformations y = 3(x + 1) 2 3 You Try 2: Identify the transformations y = 2(x) For a quadratic function the critical points are: x y Domain: Range: Example 2: Find and graph the new critical points for the equation y = (x 3) a. Determine the transformations that affect the x-values x y b. Determine the transformations that affect the y-values a. Graph the new points New Domain: New Range: 25
26 Example 3: Find and graph the new critical points for the equation y = 3(x + 1) 2 3 a. Determine the transformations that affect the x-values x y b. Determine the transformations that affect the y-values a. Graph the new points New Domain: New Range: You Try 3: Find and graph the new critical points for the equation y = 2(x) a. Determine the transformations that affect the x-values x y b. Determine the transformations that affect the y-values b. Graph the new points New Domain: New Range: 26
27 Example 4: Write an equation for a quadratic function that is shifted right 6 and up 4 You Try 4: Write an equation for an quadratic function that is reflected over the x-axis, a vertical stretch of 2, and shifted up 6 27
28 Transformations of Quadratic Functions Day 4 HW 28
29 29
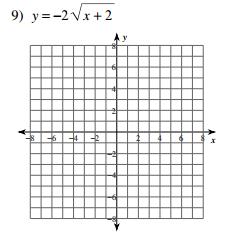
30 Transformations of Radical Functions Day 5 Radical Functions The parent function for a radical function is Example 5: Identify the transformations y = x You Try 5: Identify the transformations y = 2 x + 4 You Try 6: Identify the transformations y = x 3 For a radical function the critical points are: x y Domain: Range: 30
31 Example 6: Find and graph the new critical points for the equation y = x x y c. Determine the transformations that affect the x-values d. Determine the transformations that affect the y-values b. Graph the new points New Domain: New Range: 31
32 Example 7: Find and graph the new critical points for the equation y = 2 x + 4 c. Determine the transformations that affect the x-values x y d. Determine the transformations that affect the y-values c. Graph the new points New Domain: New Range: 32
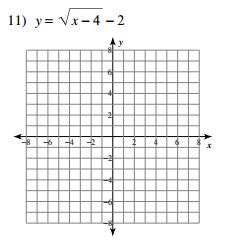
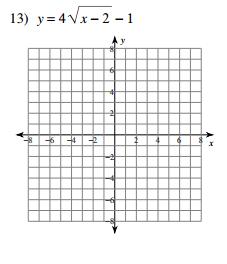
33 You Try 7: Find and graph the new critical points for the equation y = x 3 c. Determine the transformations that affect the x-values x y d. Determine the transformations that affect the y-values d. Graph the new points New Domain: New Range: Example 8: Write an equation for a radical function that is shifted down 6 and left 4 You Try 8: Write an equation for an radical function that is reflected over the x-axis, a vertical compression of 1/3, and shifted right 6 33
34 Transformations of Radical Functions Day 5 HW 34
35 35
36 Direct and Inverse Variation Day 5 36
37 Examples: 1. The graph of a direct variation equation contains the point (3, -18). Find the constant of variation, k, and write the equation of the direct variation. 2. If y varies directly with x and y = 15 when x = -3, find x when y = The graph of a inverse variation equation contains the point (7, 10). Find the constant of variation, k, and write the equation of the inverse variation. 4. The graph of a inverse variation equation contains the point (5, 12). Find the constant of variation, k, and write the equation of the inverse variation. 5. Y varies inversely with x. If y = 21 when x = 10, find y when x = Y varies inversely with x. If y = 7.2 when x = 2.1, find x when y = The price for favors at the Sanderson High School Prom varies inversely with the number of students attending the prom. If 180 students attend, the cost of the party favors will be $10 each. What would be the price for each party favor if 240 students attend the prom? 37
38 Direct and Inverse Variation Day 5 HW Solve for the constant of variation (k) and write the inverse variation equation for the given points. 1. (3, 9) 2. (-9, -3) 3. ( 2 ) 4. (4.6, -3.5) 3, For a CD, the distance that a point on the disk is from the center varies inversely with its speed. If a point 2 inches from the center is traveling at 10 feet per second, how fast is a point 5.4 inches from the center traveling? 6. y varies directly with x. If y = 15 when x = -18, find y when x = y varies directly with x. If y = 75 when x =25, find x when y = 25. For the given points, find the inverse variation equation and find the missing coordinates of the second point. 8. (3, -5) (4, y) 9. (1.2, 3.6) (x, 2) 10. ( 2 ) (x, 8) 11. (0.5, 3) (9.2, y), The electric current I, is amperes, in a circuit varies directly as the voltage V. When 12 volts are applied, the current is 4 amperes. What is the current when 18 volts are applied? 13. When you are bulk ordering an item, the cost per item varies inversely with the number of items you are buying. If you order 300 pairs of sunglasses, they will cost 49 cents each. How many would you have to order for each pair to cost 25 cents? 14. The cost per ticket for a concert varies inversely with your distance to the stage. For a ticket in the first section, it costs $250 each. How much will it cost for a ticket in the 5 th section? If you are not going to spend more than $16 per ticket, what section would you find your seats? 38
39 Graphing Inverse Variation Day 6 39
40 40
41 In your own words, define the following term. You may need to search for the terms online as a starting point. Asymptote: The inverse variation function has the standard form equation of y = 1. Fill in the table below using the pre-provided x- x values. x y Why do you think that zero is not used as an x value? Graph the order pairs on the provided graph Asymptotes are at and Because inverse variation is still a function, it can still be graphed using the transformations that we have done earlier in the unit. It is still possible to graph using translations up, down, left, and/or right, reflections over the x-axis and/or the y-axis, and vertical stretches or shrinks. 41
 y = 1 x + 6 b) y = 1 x+6 c) y = 6 x d) y = 1 x You Try 1: Complete the table below by filling in the appropriate transformations Functions: f(x) = 5 x 4 + 1 y = 3 x 6 8 f(x) = 2 x + 3 5")
42 Example 1: Identify the transformation(s) in each of the following inverse variation functions. a) y = 1 x + 6 b) y = 1 x+6 c) y = 6 x d) y = 1 x You Try 1: Complete the table below by filling in the appropriate transformations Functions: f(x) = 5 x y = 3 x 6 8 f(x) = 2 x Transformations: Example 2: Graph the function y = 1 x List the transformations: New Asymptotes: and. X Y 42
43 Example 3: Graph the function y = 2 x 4 List the transformations: New Asymptotes: and. X Y You Try 2: Graph the function y = 3 x List the transformations: 43
44 Graphing Inverse Variation Day 6 HW For each of the functions below, list the transformations, give the domain and range, and graph the given function. 1. y = 1 x Transformations: Asymptotes 2. y = 2 x 3 6 Transformations: Asymptotes 3. y = 1 x+5 3 Transformations: Asymptotes 44
45 Unit 5 Review Use the graph on the right for the following problems: 1. What is the domain of the function? 2. What is the range of the function? F(x) 3. F(1) = 4. F( ) = 4 5. F(9) = List the critical points that are used for each of the following parent functions: 6. y = x 2 8. y = x 7. y = 1 x 9. y = 2 x y = 2(x + 3) 2 Transformations: Transformations: Domain: Range: Domain: Range: 45
46 11. y = 2 x 3 4 Transformations: Asymptotes: Domain: Range: Write the equation of the function using the given transformations. 12. A quadratic function with a vertical stretch of 3, shifts down 3, and translate right An inverse variation function that shifts up 3, has a vertical stretch of 5, and shifts left A radical function that shifts down 13 and right Given that x and y vary inversely and x = 10 when y = 15, find the value of the constant of variation (k) and the inverse variation equation. 16. If x and y vary directly and x = 13 when y = 20, find x when y = If x and y vary inversely and x = 13 when y = 20, find x when y = The cost to rent a ballroom for a fundraiser varies inversely with the number of people who are going to attend. If 100 people attend it will cost $20 a person. How many people would need to attend in order to get the cost down to $15 a person? 46
Today we will revisit Fred, our parent function, and investigate transformations other than translations.
 Transformations with Fred Day 2 KEY/TEACHER NOTES Today we will revisit Fred, our parent function, and investigate transformations other than translations. Recall that the equation for Fred is y =. Complete
Transformations with Fred Functions- Packet 1
 Transformations with Fred Functions- Packet To the right is a graph of a Fred function. We can use Fred functions to explore transformations in the coordinate plane. I. Let s review briefly.. a. Explain
Transformations with Fred Functions Day 1
 Transformations with Fred Functions Day 1 KEY/TEACHER NOTES To the right is a graph of a Fred function. We can use Fred functions to explore transformations in the coordinate plane. Fred is any generic
September 18, B Math Test Chapter 1 Name: x can be expressed as: {y y 0, y R}.
 September 8, 208 62B Math Test Chapter Name: Part : Objective Questions [ mark each, total 2 marks]. State whether each of the following statements is TRUE or FALSE a) The mapping rule (x, y) (-x, y) represents
Assignment Assignment for Lesson 9.1
 Assignment Assignment for Lesson.1 Name Date Shifting Away Vertical and Horizontal Translations 1. Graph each cubic function on the grid. a. y x 3 b. y x 3 3 c. y x 3 3 2. Graph each square root function
UNIT 3 EXPRESSIONS AND EQUATIONS Lesson 3: Creating Quadratic Equations in Two or More Variables
 Guided Practice Example 1 Find the y-intercept and vertex of the function f(x) = 2x 2 + x + 3. Determine whether the vertex is a minimum or maximum point on the graph. 1. Determine the y-intercept. The
Start Fred Functions. Quadratic&Absolute Value Transformations. Graphing Piecewise Functions Intro. Graphing Piecewise Practice & Review
 Honors CCM2 Unit 6 Name: Graphing Advanced Functions This unit will get into the graphs of simple rational (inverse variation), radical (square and cube root), piecewise, step, and absolute value functions.
Sec 4.1 Coordinates and Scatter Plots. Coordinate Plane: Formed by two real number lines that intersect at a right angle.
 Algebra I Chapter 4 Notes Name Sec 4.1 Coordinates and Scatter Plots Coordinate Plane: Formed by two real number lines that intersect at a right angle. X-axis: The horizontal axis Y-axis: The vertical
Lesson 24 - Exploring Graphical Transformations and Composite Functions
 (A) Lesson Objectives a. Review composite functions and how it can be represented numerically, algebraically and graphically. b. Introduce graphical transformations c. Understand that graphical transformations
Do you need a worksheet or a copy of the teacher notes? Go to
 Name Period Day Date Assignment (Due the next class meeting) Wednesday Thursday Friday Monday Tuesday Wednesday Thursday Friday Monday Tuesday Wednesday Thursday Friday Monday Tuesday Wednesday Thursday
Name: Chapter 7 Review: Graphing Quadratic Functions
 Name: Chapter Review: Graphing Quadratic Functions A. Intro to Graphs of Quadratic Equations: = ax + bx+ c A is a function that can be written in the form = ax + bx+ c where a, b, and c are real numbers
Graphs of Exponential
 Graphs of Exponential Functions By: OpenStaxCollege As we discussed in the previous section, exponential functions are used for many realworld applications such as finance, forensics, computer science,
Mid Term Pre Calc Review
 Mid Term 2015-13 Pre Calc Review I. Quadratic Functions a. Solve by quadratic formula, completing the square, or factoring b. Find the vertex c. Find the axis of symmetry d. Graph the quadratic function
Section 2.2 Graphs of Linear Functions
 Section. Graphs of Linear Functions Section. Graphs of Linear Functions When we are working with a new function, it is useful to know as much as we can about the function: its graph, where the function
Algebra 2 Honors Lesson 10 Translating Functions
 Algebra 2 Honors Lesson 10 Translating Functions Objectives: The students will be able to translate a base function horizontally and vertically. Students will be able to describe the translation of f(x)
Sections Transformations
 MCR3U Sections 1.6 1.8 Transformations Transformations: A change made to a figure or a relation such that it is shifted or changed in shape. Translations, reflections and stretches/compressions are types
Transformation a shifting or change in shape of a graph
 1.1 Horizontal and Vertical Translations Frieze Patterns Transformation a shifting or change in shape of a graph Mapping the relating of one set of points to another set of points (ie. points on the original
GSE Algebra 1 Name Date Block. Unit 3b Remediation Ticket
 Unit 3b Remediation Ticket Question: Which function increases faster, f(x) or g(x)? f(x) = 5x + 8; two points from g(x): (-2, 4) and (3, 10) Answer: In order to compare the rate of change (roc), you must
y 1 ) 2 Mathematically, we write {(x, y)/! y = 1 } is the graph of a parabola with 4c x2 focus F(0, C) and directrix with equation y = c.
 2 Mathematically, we write {(x, y)/! y = 1 } is the graph of a parabola with 4c x2 focus F(0, C) and directrix with equation y = c.") Ch. 10 Graphing Parabola Parabolas A parabola is a set of points P whose distance from a fixed point, called the focus, is equal to the perpendicular distance from P to a line, called the directrix. Since
Ch. 10 Graphing Parabola Parabolas A parabola is a set of points P whose distance from a fixed point, called the focus, is equal to the perpendicular distance from P to a line, called the directrix. Since
Section a) f(x-3)+4 = (x 3) the (-3) in the parenthesis moves right 3, the +4 moves up 4
 f(x-3)+4 = (x 3) the (-3) in the parenthesis moves right 3, the +4 moves up 4") Section 4.3 1a) f(x-3)+4 = (x 3) 2 + 4 the (-3) in the parenthesis moves right 3, the +4 moves up 4 Answer 1a: f(x-3)+4 = (x 3) 2 + 4 The graph has the same shape as f(x) = x 2, except it is shifted right
Section 4.3 1a) f(x-3)+4 = (x 3) 2 + 4 the (-3) in the parenthesis moves right 3, the +4 moves up 4 Answer 1a: f(x-3)+4 = (x 3) 2 + 4 The graph has the same shape as f(x) = x 2, except it is shifted right
Core Mathematics 1 Transformations of Graphs
 Regent College Maths Department Core Mathematics 1 Transformations of Graphs Transformations of Graphs September 2011 C1 Note Knowledge of the effect of simple transformations on the graph of y f( x)
Common Core Algebra 2. Chapter 1: Linear Functions
 Common Core Algebra 2 Chapter 1: Linear Functions 1 1.1 Parent Functions and Transformations Essential Question: What are the characteristics of some of the basic parent functions? What You Will Learn
Algebra. Chapter 4: FUNCTIONS. Name: Teacher: Pd:
 Algebra Chapter 4: FUNCTIONS Name: Teacher: Pd: Table of Contents Day1: Chapter 4-1: Relations SWBAT: (1) Identify the domain and range of relations and functions (2) Match simple graphs with situations
Final Exam Review Algebra Semester 1
 Final Exam Review Algebra 015-016 Semester 1 Name: Module 1 Find the inverse of each function. 1. f x 10 4x. g x 15x 10 Use compositions to check if the two functions are inverses. 3. s x 7 x and t(x)
Module 3: Graphing Quadratic Functions
 Haberman MTH 95 Section V Quadratic Equations and Functions Module 3 Graphing Quadratic Functions In this module, we'll review the graphing quadratic functions (you should have studied the graphs of quadratic
) 2 + (y 2. x 1. y c x2 = y
 2 + (y 2. x 1. y c x2 = y") Graphing Parabola Parabolas A parabola is a set of points P whose distance from a fixed point, called the focus, is equal to the perpendicular distance from P to a line, called the directrix. Since this
Graphing Parabola Parabolas A parabola is a set of points P whose distance from a fixed point, called the focus, is equal to the perpendicular distance from P to a line, called the directrix. Since this
Transformations with Quadratic Functions KEY
 Algebra Unit: 05 Lesson: 0 TRY THIS! Use a calculator to generate a table of values for the function y = ( x 3) + 4 y = ( x 3) x + y 4 Next, simplify the function by squaring, distributing, and collecting
Warm - Up. Sunday, February 1, HINT: plot points first then connect the dots. Draw a graph with the following characteristics:
 Warm - Up Sunday, February 1, 2015 Draw a graph with the following characteristics: Maximums at (-3,4) and (2,2) Minimum at (-1,-3) X intercepts at (-4,0), (-2,0), (1,0), and (3,0) Y intercept at (0,-2)
Y. Butterworth Lehmann & 9.2 Page 1 of 11
 Pre Chapter 9 Coverage Quadratic (2 nd Degree) Form a type of graph called a parabola Form of equation we'll be dealing with in this chapter: y = ax 2 + c Sign of a determines opens up or down "+" opens
h(x) and r(x). What does this tell you about whether the order of the translations matters? Explain your reasoning.
 and r(x). What does this tell you about whether the order of the translations matters? Explain your reasoning.") .6 Combinations of Transformations An anamorphosis is an image that can onl be seen correctl when viewed from a certain perspective. For example, the face in the photo can onl be seen correctl in the side
.6 Combinations of Transformations An anamorphosis is an image that can onl be seen correctl when viewed from a certain perspective. For example, the face in the photo can onl be seen correctl in the side
Unit 2: Functions and Graphs
 AMHS Precalculus - Unit 16 Unit : Functions and Graphs Functions A function is a rule that assigns each element in the domain to exactly one element in the range. The domain is the set of all possible
1.1: Basic Functions and Translations
 .: Basic Functions and Translations Here are the Basic Functions (and their coordinates!) you need to get familiar with.. Quadratic functions (a.k.a. parabolas) y x Ex. y ( x ). Radical functions (a.k.a.
This lesson is designed to improve students
 NATIONAL MATH + SCIENCE INITIATIVE Mathematics g x 8 6 4 2 0 8 6 4 2 y h x k x f x r x 8 6 4 2 0 8 6 4 2 2 2 4 6 8 0 2 4 6 8 4 6 8 0 2 4 6 8 LEVEL Algebra or Math in a unit on function transformations
3.1 Start Thinking. 3.1 Warm Up. 3.1 Cumulative Review Warm Up. Consider the equation y x.
 3.1 Start Thinking Consider the equation y x. Are there any values of x that you cannot substitute into the equation? If so, what are they? Are there any values of y that you cannot obtain as an answer?
Test 3 review SHORT ANSWER. Write the word or phrase that best completes each statement or answers the question.
 Test 3 review SHORT ANSWER. Write the word or phrase that best completes each statement or answers the question. Approximate the coordinates of each turning point by graphing f(x) in the standard viewing
MAFS Algebra 1. Quadratic Functions. Day 17 - Student Packet
 MAFS Algebra 1 Quadratic Functions Day 17 - Student Packet Day 17: Quadratic Functions MAFS.912.F-IF.3.7a, MAFS.912.F-IF.3.8a I CAN graph a quadratic function using key features identify and interpret
Let s review some things we learned earlier about the information we can gather from the graph of a quadratic.
 Section 6: Quadratic Equations and Functions Part 2 Section 6 Topic 1 Observations from a Graph of a Quadratic Function Let s review some things we learned earlier about the information we can gather from
Standard Form v. Vertex Form
 Standard Form v. Vertex Form The Standard Form of a quadratic equation is:. The Vertex Form of a quadratic equation is where represents the vertex of an equation and is the same a value used in the Standard
Graphing Techniques and Transformations. Learning Objectives. Remarks
 Graphing Techniques and Transformations Learning Objectives 1. Graph functions using vertical and horizontal shifts 2. Graph functions using compressions and stretches. Graph functions using reflections
a translation by c units a translation by c units
 1.6 Graphical Transformations Introducing... Translations 1.) Set your viewing window to [-5,5] by [-5,15]. 2.) Graph the following functions: y 1 = x 2 y 2 = x 2 + 3 y 3 = x 2 + 1 y 4 = x 2-2 y 5 = x
Section 1.5 Transformation of Functions
 6 Chapter 1 Section 1.5 Transformation of Functions Often when given a problem, we try to model the scenario using mathematics in the form of words, tables, graphs and equations in order to explain or
Algebra 2 Chapter Relations and Functions
 Algebra 2 Chapter 2 2.1 Relations and Functions 2.1 Relations and Functions / 2.2 Direct Variation A: Relations What is a relation? A of items from two sets: A set of values and a set of values. What does
1.1 Pearson Modeling and Equation Solving
 Date:. Pearson Modeling and Equation Solving Syllabus Objective:. The student will solve problems using the algebra of functions. Modeling a Function: Numerical (data table) Algebraic (equation) Graphical
Translation of graphs (2) The exponential function and trigonometric function
 The exponential function and trigonometric function") Lesson 35 Translation of graphs (2) The exponential function and trigonometric function Learning Outcomes and Assessment Standards Learning Outcome 2: Functions and Algebra Assessment Standard Generate
Lesson 35 Translation of graphs (2) The exponential function and trigonometric function Learning Outcomes and Assessment Standards Learning Outcome 2: Functions and Algebra Assessment Standard Generate
Lesson #1: Exponential Functions and Their Inverses Day 2
 Unit 5: Logarithmic Functions Lesson #1: Exponential Functions and Their Inverses Day 2 Exponential Functions & Their Inverses Exponential Functions are in the form. The inverse of an exponential is a
Radical Functions. Attendance Problems. Identify the domain and range of each function.
 Page 1 of 12 Radical Functions Attendance Problems. Identify the domain and range of each function. 1. f ( x) = x 2 + 2 2. f ( x) = 3x 3 Use the description to write the quadratic function g based on the
Lesson #6: Basic Transformations with the Absolute Value Function
 Lesson #6: Basic Transformations with the Absolute Value Function Recall: Piecewise Functions Graph:,, What parent function did this piecewise function create? The Absolute Value Function Algebra II with
Quadratic Functions CHAPTER. 1.1 Lots and Projectiles Introduction to Quadratic Functions p. 31
 CHAPTER Quadratic Functions Arches are used to support the weight of walls and ceilings in buildings. Arches were first used in architecture by the Mesopotamians over 4000 years ago. Later, the Romans
Sect Graphing Techniques: Transformations
 Sect. - Graphing Techniques: Transformations Recall the general shapes of each of the following basic functions and their properties: Identity Function Square Function f(x) = x f(x) = x - - - - - - - -
1.2 Reflections and Stretches
 Chapter Part : Reflections.2 Reflections and Stretches Pages 6 3 Investigating a reflection in the x axis:. a) Complete the following table for and sketch on the axis provided. x 2 0 2 y b) Now sketch
Investigating Transformations With DESMOS
 MPM D0 Date: Investigating Transformations With DESMOS INVESTIGATION Part A: What if we add a constant to the x in y = x? 1. Use DESMOS to graph the following quadratic functions on the same grid. Graph
Assignments for Algebra 1 Unit 9 Quadratics, Part 1
 Name: Assignments for Algebra 1 Unit 9 Quadratics, Part 1 Day 1, Quadratic Transformations: p.1-2 Day 2, Vertex Form of Quadratics: p. 3 Day 3, Solving Quadratics: p. 4-5 Day 4, No Homework (be sure you
transformation: alters the equation and any combination of the location, shape, and orientation of the graph
 Chapter 1: Function Transformations Section 1.1: Horizontal and Vertical Translations transformation: alters the equation and any combination of the location, shape, and orientation of the graph mapping:
Chapter 3 Transformations of Graphs and Data
 Chapter 3 Transformations of Graphs and Data 3.1 Graphs of Parent Functions Parent Function the simplest equation of a particular type of function o Ex: Quadratic Function: y = x 2 There are EIGHT important
6.4 Vertex Form of a Quadratic Function
 6.4 Vertex Form of a Quadratic Function Recall from 6.1 and 6.2: Standard Form The standard form of a quadratic is: f(x) = ax 2 + bx + c or y = ax 2 + bx + c where a, b, and c are real numbers and a 0.
Unit Essential Questions: Does it matter which form of a linear equation that you use?
 Unit Essential Questions: Does it matter which form of a linear equation that you use? How do you use transformations to help graph absolute value functions? How can you model data with linear equations?
Unit 1 Quadratic Functions
 Unit 1 Quadratic Functions This unit extends the study of quadratic functions to include in-depth analysis of general quadratic functions in both the standard form f ( x) = ax + bx + c and in the vertex
Section 1.5 Transformation of Functions
 Section 1.5 Transformation of Functions 61 Section 1.5 Transformation of Functions Often when given a problem, we try to model the scenario using mathematics in the form of words, tables, graphs and equations
Graphs and transformations, Mixed Exercise 4
 Graphs and transformations, Mixed Exercise 4 a y = x (x ) 0 = x (x ) So x = 0 or x = The curve crosses the x-axis at (, 0) and touches it at (0, 0). y = x x = x( x) As a = is negative, the graph has a
More Ways to Solve & Graph Quadratics The Square Root Property If x 2 = a and a R, then x = ± a
 More Ways to Solve & Graph Quadratics The Square Root Property If x 2 = a and a R, then x = ± a Example: Solve using the square root property. a) x 2 144 = 0 b) x 2 + 144 = 0 c) (x + 1) 2 = 12 Completing
Math Analysis Chapter 1 Notes: Functions and Graphs
 Math Analysis Chapter 1 Notes: Functions and Graphs Day 6: Section 1-1 Graphs Points and Ordered Pairs The Rectangular Coordinate System (aka: The Cartesian coordinate system) Practice: Label each on the
1.1 Functions. Cartesian Coordinate System
 1.1 Functions This section deals with the topic of functions, one of the most important topics in all of mathematics. Let s discuss the idea of the Cartesian coordinate system first. Cartesian Coordinate
Chapter 1 Polynomials and Modeling
 Chapter 1 Polynomials and Modeling 1.1 Linear Functions Recall that a line is a function of the form y = mx+ b, where m is the slope of the line (how steep the line is) and b gives the y-intercept (where
Quadratic Functions In Standard Form In Factored Form In Vertex Form Transforming Graphs. Math Background
 Graphing In Standard Form In Factored Form In Vertex Form Transforming Graphs Math Background Previousl, ou Identified and graphed linear functions Applied transformations to parent functions Graphed quadratic
Unit 2: Function Transformation Chapter 1. Basic Transformations Reflections Inverses
 Unit 2: Function Transformation Chapter 1 Basic Transformations Reflections Inverses Section 1.1: Horizontal and Vertical Transformations A transformation of a function alters the equation and any combination
Rational functions, like rational numbers, will involve a fraction. We will discuss rational functions in the form:
 Name: Date: Period: Chapter 2: Polynomial and Rational Functions Topic 6: Rational Functions & Their Graphs Rational functions, like rational numbers, will involve a fraction. We will discuss rational
1-8 Exploring Transformations
 1-8 Exploring Transformations Warm Up Lesson Presentation Lesson Quiz 2 Warm Up Plot each point. D 1. A(0,0) 2. B(5,0) 3. C( 5,0) 4. D(0,5) 5. E(0, 5) 6. F( 5, 5) C A F E B Objectives Apply transformations
Advanced Math Quadratics Review Name: Dec. 2016
 Advanced Math Quadratics Review Name: Dec. 2016 Graph the given quadratic by finding the vertex and building a table around it. Identify the axis of symmetry, maximum or minimum value, domain and range
Math Analysis Chapter 1 Notes: Functions and Graphs
 Math Analysis Chapter 1 Notes: Functions and Graphs Day 6: Section 1-1 Graphs; Section 1- Basics of Functions and Their Graphs Points and Ordered Pairs The Rectangular Coordinate System (aka: The Cartesian
MEI Desmos Tasks for AS Pure
 Task 1: Coordinate Geometry Intersection of a line and a curve 1. Add a quadratic curve, e.g. y = x² 4x + 1 2. Add a line, e.g. y = x 3 3. Select the points of intersection of the line and the curve. What
x 2 + 8x - 12 = 0 Aim: To review for Quadratic Function Exam #1 Homework: Study Review Materials
 Aim: To review for Quadratic Function Exam #1 Homework: Study Review Materials Do Now - Solve using any strategy. If irrational, express in simplest radical form x 2 + 8x - 12 = 0 Review Topic Index 1.
But a vertex has two coordinates, an x and a y coordinate. So how would you find the corresponding y-value?
 We will work with the vertex, orientation, and x- and y-intercepts of these functions. Intermediate algebra Class notes More Graphs of Quadratic Functions (section 11.6) In the previous section, we investigated
Transformations. What are the roles of a, k, d, and c in polynomial functions of the form y a[k(x d)] n c, where n?
![Transformations. What are the roles of a, k, d, and c in polynomial functions of the form y a[k(x d)] n c, where n?](/thumbs/95/125766084.jpg "Transformations. What are the roles of a, k, d, and c in polynomial functions of the form y a[k(x d)] n c, where n?") 1. Transformations In the architectural design of a new hotel, a pattern is to be carved in the exterior crown moulding. What power function forms the basis of the pattern? What transformations are applied
1. Transformations In the architectural design of a new hotel, a pattern is to be carved in the exterior crown moulding. What power function forms the basis of the pattern? What transformations are applied
Standard Form of Quadratic Functions
 Math Objectives Students will be able to predict how a specific change in the value of a will affect the shape of the graph of the quadratic ax bx c. Students will be able to predict how a specific change
3. parallel: (b) and (c); perpendicular (a) and (b), (a) and (c)
 and (c); perpendicular (a) and (b), (a) and (c)") SECTION 1.1 1. Plot the points (0, 4), ( 2, 3), (1.5, 1), and ( 3, 0.5) in the Cartesian plane. 2. Simplify the expression 13 7 2. 3. Use the 3 lines whose equations are given. Which are parallel? Which
SECTION 1.1 1. Plot the points (0, 4), ( 2, 3), (1.5, 1), and ( 3, 0.5) in the Cartesian plane. 2. Simplify the expression 13 7 2. 3. Use the 3 lines whose equations are given. Which are parallel? Which
Exploring Quadratic Graphs
 Exploring Quadratic Graphs The general quadratic function is y=ax 2 +bx+c It has one of two basic graphs shapes, as shown below: It is a symmetrical "U"-shape or "hump"-shape, depending on the sign of
Warm-Up Exercises. Find the x-intercept and y-intercept 1. 3x 5y = 15 ANSWER 5; y = 2x + 7 ANSWER ; 7
 Warm-Up Exercises Find the x-intercept and y-intercept 1. 3x 5y = 15 ANSWER 5; 3 2. y = 2x + 7 7 2 ANSWER ; 7 Chapter 1.1 Graph Quadratic Functions in Standard Form A quadratic function is a function that
Objectives. Vocabulary. 1-1 Exploring Transformations
 Warm Up Plot each point. D Warm Up Lesson Presentation Lesson Quiz 1. A(0,0) 2. B(5,0) 3. C( 5,0) 4. D(0,5) C A B 5. E(0, 5) 6. F( 5, 5) F E Algebra 2 Objectives Apply transformations to points and sets
Graphing Absolute Value Functions
 Graphing Absolute Value Functions To graph an absolute value equation, make an x/y table and plot the points. Graph y = x (Parent graph) x y -2 2-1 1 0 0 1 1 2 2 Do we see a pattern? Desmos activity: 1.
Unit 2 Day 5. Characteristics of Quadratic Functions
 Unit 2 Day 5 Characteristics of Quadratic Functions 1 Warm Up 1.) Jason and Jim jumped off a cliff into the ocean in Acapulco while vacationing. Jason s height as a function of time could be modeled by
1-5 Parent Functions and Transformations
 Describe the following characteristics of the graph of each parent function: domain, range, intercepts, symmetry, continuity, end behavior, and intervals on which the graph is increasing/decreasing. 1.
Chapter 1: Function Sense Activity 1.2 & 3
 Name Chapter 1: Function Sense Activity 1.2 & 3 Learning Objectives 1. Determine the equation (symbolic representation) that defines a function. 2. Determine the domain and range of a function. 3. Identify
Polynomial and Rational Functions
 Chapter 3 Polynomial and Rational Functions Review sections as needed from Chapter 0, Basic Techniques, page 8. Refer to page 187 for an example of the work required on paper for all graded homework unless
Vertical Line Test a relationship is a function, if NO vertical line intersects the graph more than once
 Algebra 2 Chapter 2 Domain input values, X (x, y) Range output values, Y (x, y) Function For each input, there is exactly one output Example: Vertical Line Test a relationship is a function, if NO vertical
Honors Algebra 2 Function Transformations Discovery
 Honors Algebra Function Transformations Discovery Name: Date: Parent Polynomial Graphs Using an input-output table, make a rough sketch and compare the graphs of the following functions. f x x. f x x.
NO CALCULATOR ON ANYTHING EXCEPT WHERE NOTED
 Algebra II (Wilsen) Midterm Review NO CALCULATOR ON ANYTHING EXCEPT WHERE NOTED Remember: Though the problems in this packet are a good representation of many of the topics that will be on the exam, this
Math 101 Exam 1 Review
 Math 101 Exam 1 Review Reminder: Exam 1 will be on Friday, October 14, 011 at 8am. It will cover sections 1.1, 1. and 10.1 10.3 Room Assignments: Room Sections Nesbitt 111 9, 14, 3, 4, 8 Nesbitt 15 0,
Slammin Sammy. Name Date. Finger. Shoulder. Back. Toe. Heel
 Name Date Slammin Sammy Finger Shoulder Back Toe Heel (0, 0) Fist 1. Give the coordinates of Sammy s six body parts: Finger (, ) Shoulder (, ) Back (, ) Toe (, ) Heel (, ) Fist (, ) Classroom Strategies
Name Class Date. Using Graphs to Relate Two Quantities
 4-1 Reteaching Using Graphs to Relate Two Quantities An important life skill is to be able to a read graph. When looking at a graph, you should check the title, the labels on the axes, and the general
Graphing Transformations Techniques -- Partner Pairs Project Packet A
 Name Course Days/Times Graphing Transformations Techniques -- Partner Pairs Project Packet A This packet is to be completed by Student A working alone. It should be completed before Students A and B work
Sect 3.1 Quadratic Functions and Models
 Objective 1: Sect.1 Quadratic Functions and Models Polynomial Function In modeling, the most common function used is a polynomial function. A polynomial function has the property that the powers of the
Section 4.1 Review of Quadratic Functions and Graphs (3 Days)
") Integrated Math 3 Name What can you remember before Chapter 4? Section 4.1 Review of Quadratic Functions and Graphs (3 Days) I can determine the vertex of a parabola and generate its graph given a quadratic
Integrated Math 3 Name What can you remember before Chapter 4? Section 4.1 Review of Quadratic Functions and Graphs (3 Days) I can determine the vertex of a parabola and generate its graph given a quadratic
Quadratic Functions. *These are all examples of polynomial functions.
 Look at: f(x) = 4x-7 f(x) = 3 f(x) = x 2 + 4 Quadratic Functions *These are all examples of polynomial functions. Definition: Let n be a nonnegative integer and let a n, a n 1,..., a 2, a 1, a 0 be real
Algebra II: Strand 3. Quadratic Functions; Topic 2. Digging Deeper; Task 3.2.1
 1 TASK 3..1: PUTTING IT TOGETHER Solutions 1. Each of the following quadratic functions is given in standard form ( y = ax + bx + c ). For each function: Transform the function to the form y = a(x h) +
Algebra 1 Semester 2 Final Review
 Team Awesome 011 Name: Date: Period: Algebra 1 Semester Final Review 1. Given y mx b what does m represent? What does b represent?. What axis is generally used for x?. What axis is generally used for y?
3.1 Generating Inverses of Functions 263
 3.1 Generating Inverses of Functions FOCUSING QUESTION What is the inverse of a function? LEARNING OUTCOMES I can compare and contrast the key attributes of a function and its inverse when I have the function
F.BF.B.3: Graphing Polynomial Functions
 F.BF.B.3: Graphing Polynomial Functions 1 Given the graph of the line represented by the equation f(x) = 2x + b, if b is increased by 4 units, the graph of the new line would be shifted 4 units 1) right
STANDARDS OF LEARNING CONTENT REVIEW NOTES ALGEBRA I. 2 nd Nine Weeks,
 STANDARDS OF LEARNING CONTENT REVIEW NOTES ALGEBRA I 2 nd Nine Weeks, 2016-2017 1 OVERVIEW Algebra I Content Review Notes are designed by the High School Mathematics Steering Committee as a resource for
Transformations: Translating Functions
 Math Objectives Students will vertically translate a function by adding a constant and write the appropriate symbolic representation for the translated function. Students will horizontally translate a
Part I. Fill in the blank. 2 points each. No calculators. No partial credit
 Math 108 (105) Final Exam Page 1 Spring 2015 Part I. Fill in the blank. 2 points each. No calculators. No partial credit 1) Fill in the blank a) 2 8 h) 5 0 21 4 b) 5 7 i) 8 3 c) 2 3 = j) 2 7 d) The additive