UNITED STATES SECURITIES AND EXCHANGE COMMISSION WASHINGTON, DC FORM 8-K CURRENT REPORT
|
|
|
- Jocelyn Doyle
- 5 years ago
- Views:
Transcription
: April 28, 2015 T-MOBILE US, INC.")
1 TMUS 8-K 4/28/2015 Section 1: 8-K (TMUS FORM 8-K) UNITED STATES SECURITIES AND EXCHANGE COMMISSION WASHINGTON, DC FORM 8-K CURRENT REPORT Pursuant to Section 13 or 15(d) of the Securities Exchange Act of 1934 Date of report (Date of earliest event reported): April 28, 2015 T-MOBILE US, INC. (Exact Name of Registrant as Specified in Charter) DELAWARE (State or other jurisdiction (Commission File Number) (I.R.S. Employer of incorporation or organization) Identification No.) SE 38th Street Bellevue, Washington (Address of principal executive offices) (Zip Code) Registrant s telephone number, including area code: (425) (Former Name or Former Address, if Changed Since Last Report):
2 Check the appropriate box below if the Form 8-K filing is intended to simultaneously satisfy the filing obligation of the registrant under any of the following provisions: Written communications pursuant to Rule 425 under the Securities Act (17 CFR ) Soliciting material pursuant to Rule 14a-12 under the Exchange Act (17 CFR a-12) Pre-commencement communications pursuant to Rule 14d-2(b) under the Exchange Act (17 CFR d-2(b)) Pre-commencement communications pursuant to Rule 13e-4(c) under the Exchange Act (17 CFR e-4(c))
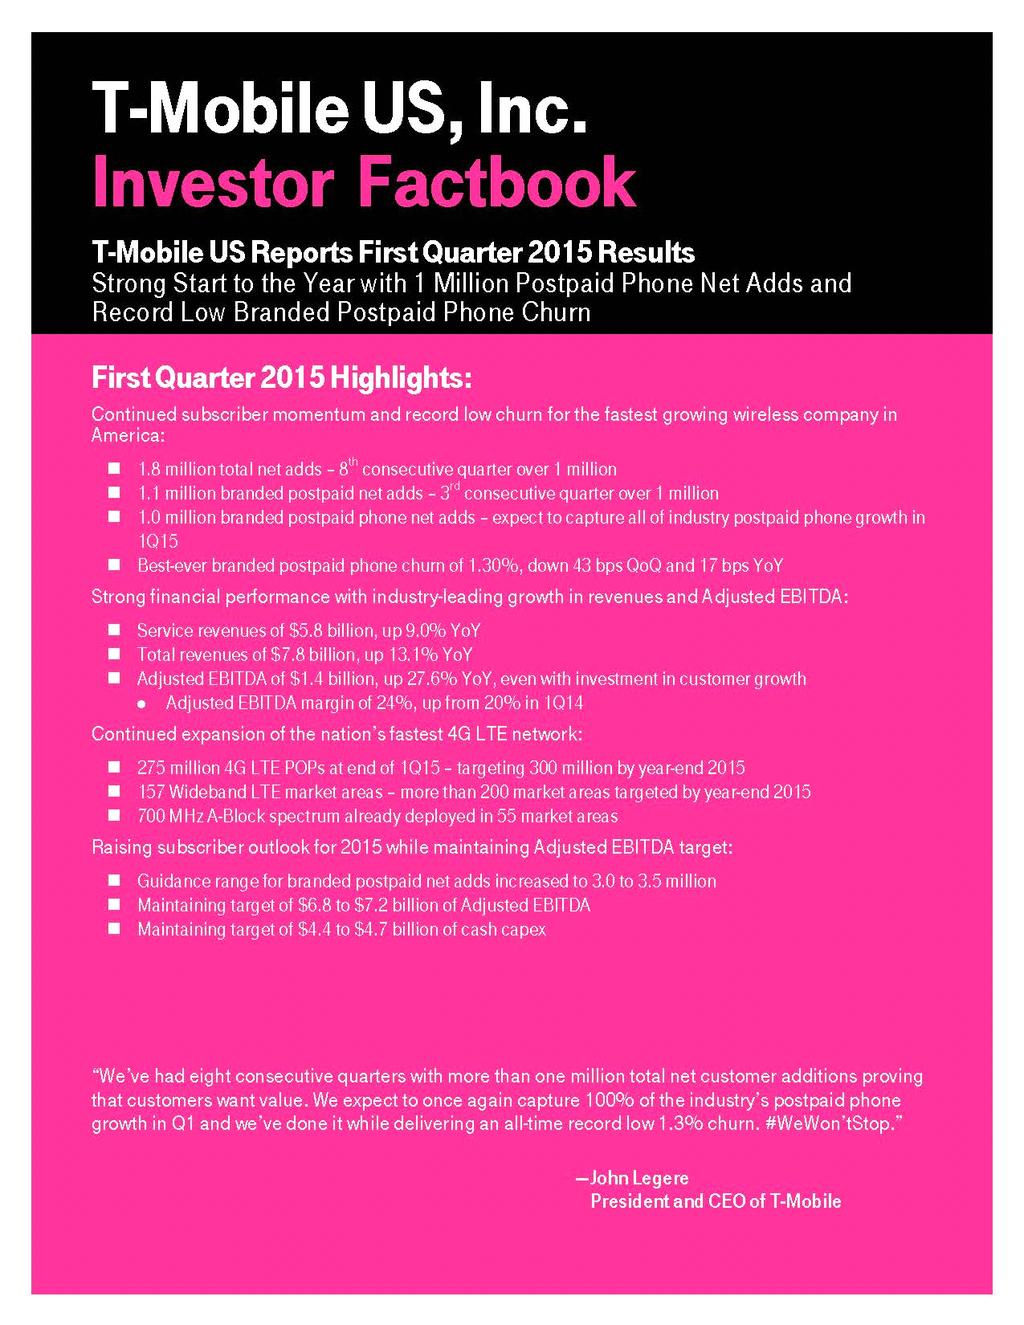
3 Item 2.02 Results of Operations and Financial Condition On April 28, 2015, T-Mobile US, Inc. issued a press release announcing the financial and operating results for T-Mobile US, Inc. for the quarter ended March 31, The text of the press release and accompanying financial information are attached as exhibits and incorporated herein by reference. Item 9.01 Financial Statements and Exhibits The following exhibits are furnished as part of this report: (d) Exhibits: Exhibit Description 99.1 Press release, dated April 28, 2015, entitled "T-Mobile US Reports First Quarter 2015 Results Strong Start to the Year with 1 Million Postpaid Phone Net Adds and Record Low Churn" 99.2 Investor Factbook of T-Mobile US, Inc. First Quarter 2015 Results SIGNATURE Pursuant to the requirements of the Securities Exchange Act of 1934, the registrant has duly caused this report to be signed on its behalf by the undersigned hereunto duly authorized. T-MOBILE US, INC. April 28, 2015 /s/ J. Braxton Carter J. Braxton Carter Executive Vice President and Chief Financial Officer (Back To Top) Section 2: EX-99.1 (TMUS EXHIBIT 99.1) EXHIBIT 99.1 T-Mobile US Reports First Quarter 2015 Results Strong Start to the Year with 1 Million Postpaid Phone Net Adds and Record Low Churn First Quarter 2015 Highlights: Continued subscriber momentum and record low churn for the fastest growing wireless company in America: 1.8 million total net adds - 8 th consecutive quarter over 1 million 1.1 million branded postpaid net adds - 3 rd consecutive quarter over 1 million 1.0 million branded postpaid phone net adds - expect to capture all of industry postpaid phone growth in 1Q15 Best-ever branded postpaid phone churn of 1.30%, down 43 bps QoQ and 17 bps YoY Strong financial performance with expected industry-leading growth in revenues and Adjusted EBITDA: Service revenues of $5.8 billion, up 9.0% YoY Total revenues of $7.8 billion, up 13.1% YoY Adjusted EBITDA of $1.4 billion, up 27.6% YoY, even with investment in customer growth Adjusted EBITDA margin of 24%, up from 20% in 1Q14 Continued expansion of the nation s fastest 4G LTE network: 275 million 4G LTE POPs at end of 1Q15 - targeting 300 million by year-end Wideband LTE market areas - more than 200 market areas targeted by year-end 2015
4 700 MHz A-Block spectrum already deployed in 55 market areas Raising subscriber outlook for 2015 while maintaining Adjusted EBITDA target: Guidance range for branded postpaid net adds increased to 3.0 to 3.5 million Maintaining target of $6.8 to $7.2 billion of Adjusted EBITDA Maintaining target of $4.4 to $4.7 billion of cash capex BELLEVUE, Wash. - April 28, T-Mobile US, Inc. (NYSE: TMUS) today reported first quarter 2015 results reflecting strong momentum and industry-leading growth. The Company again outperformed the competition in both subscriber and financial growth metrics. We ve had eight consecutive quarters with more than one million total net customer additions proving that customers want value, said John Legere, President and CEO of T-Mobile. We expect to once again capture all of the industry s postpaid phone growth in Q1 and we ve done it while delivering an all-time record low 1.3% churn. #WeWon tstop. Un-Carrier Delivering Results Since launching Un-carrier in 2013, T-Mobile has disrupted the wireless industry with innovations such as No Annual Service Contracts, equipment installment plans, the JUMP! device upgrade program, free international data roaming, Contract Freedom, T-Mobile Test Drive, Music Freedom, Wi-Fi Un-leashed, and Data Stash. In the first quarter of 2015, the Company again expanded the Un-carrier lineup with: Un-carrier 9.0: Business Un-leashed: T-Mobile introduced a set of simple, transparent, and affordable rate plans that provide all business customers with unlimited talk and text, and 1GB of 4G LTE data. Additional data can either be purchased on a per line or pooled basis. T-Mobile is also partnering with GoDaddy and Microsoft Office 365 to provide a valuable array of mobile business tools free of charge, as well as extending a benefit to families with Business Family Discounts by counting a company-paid line as the first line on a family s Simple Choice account. The Un-contract : The Un-contract initiative is a guarantee to all Simple Choice customers that their rates will never increase as long as they remain a customer, even for those on promotional plans. Unlimited 4G LTE rate plans are guaranteed for a minimum of two years. Carrier Freedom : The Company will pay off outstanding device payments of up to $650 per line for up to 10 lines when customers switch to T-Mobile. T-Mobile US, Inc SE 38th Street Bellevue, Washington Phone Internet 1
5 Operational and Financial Highlights for the First Quarter 2015 T-Mobile continues to deliver strong customer growth and ended the first quarter of 2015 with 56.8 million total customers. In the first quarter of 2015, T-Mobile added 1.8 million net new customers, marking the eighth consecutive quarter that the Company has generated more than one million net customer additions. In the first quarter of 2015, branded postpaid net customer additions were 1.1 million, including 991,000 phone net customer additions - expected to be the highest in the U.S. wireless industry once again - and 134,000 mobile broadband net customer additions. Branded postpaid phone churn was 1.30% in the first quarter of 2015, down 17 basis points year-over-year and 43 basis points sequentially. The year-over-year improvement in churn reflects ongoing improvements in the Company s network, customer service, and the overall value of its offerings in the marketplace, resulting in increased customer satisfaction and loyalty. The sequential improvement was due to seasonal factors as well as a reduction in competitive activity compared to the fourth quarter of T-Mobile s branded prepaid net customer additions were 73,000 in the first quarter of The lower level of branded prepaid net additions in the quarter was driven by increased migrations from prepaid to postpaid, increased competitive activity in the marketplace, and an atypical tax refund season. Branded prepaid to branded postpaid migrations were 195,000 in the first quarter of Branded prepaid churn was 4.62% in the first quarter of 2015, down 77 basis points sequentially and up 28 basis points year-over-year. Total device sales, including both branded postpaid and prepaid customers, were 8.8 million units in the first quarter of 2015, of which total smartphone sales were 8.0 million units. In addition to strong customer growth, T-Mobile delivered outstanding financial results. In the first quarter of 2015, the Company is expected to again report the fastest year-over-year revenue growth in the industry for both service and total revenues. Service revenues for the first quarter of 2015 grew by 9.0% year-over-year, primarily due to rapid growth in the Company s customer base, partially offset by lower branded postpaid phone Average Revenue per User (ARPU) and the non-cash net revenue deferral for Data Stash. On a sequential basis, service revenues declined by 0.9% primarily due to the impact of Data Stash. Excluding the impact of Data Stash, service revenues in the first quarter of 2015 increased 0.9% sequentially and 11.0% year-over-year. T-Mobile s total revenues for the first quarter of 2015 grew by 13.1% year-over-year due to continued growth in equipment sales revenues and service revenues. On a sequential basis, total revenues decreased by 4.6% due to lower equipment sales revenues compared to strong holiday season sales in the fourth quarter of Branded postpaid Average Billings per User (ABPU) was $60.94 in the first quarter of 2015, down 1.4% sequentially and up 2.4% year-overyear. Excluding the impact of Data Stash, branded postpaid ABPU in the first quarter of 2015 increased 0.6% sequentially and 4.5% yearover-year. Branded postpaid phone ARPU decreased sequentially by 3.8% to $46.43, driven primarily by the net revenue deferral for Data Stash and dilution resulting from promotional activities targeting families, including the 4 for $100 offer. Excluding the impact of Data Stash, branded postpaid phone ARPU in the first quarter of 2015 declined by 1.2% sequentially and 5.5% year-over-year. Branded prepaid ARPU increased by 4.8% year-over-year and 0.8% sequentially to $ Branded postpaid Average Revenue per Account (ARPA) was $ in the first quarter of 2015, down 0.9% year-over-year and 1.7% sequentially. Excluding the impact from Data Stash, branded postpaid ARPA in the first quarter of 2015 increased 1.1% sequentially and 1.9% year-over-year. Branded postpaid Average Billings per Account (ABPA) amounted to a record $ in the first quarter of 2015, an increase of 11.8% year-over-year and 0.9% sequentially. The increase in ABPA was primarily due to growth in EIP billings as well as an increase in the number of branded postpaid customers per account. T-Mobile US, Inc SE 38th Street Bellevue, Washington Phone Internet 2
6 Adjusted EBITDA for the first quarter of 2015 was $1.388 billion, up 27.6% year-over-year and down 20.7% sequentially. Year-over-year, the increase was primarily due to higher branded postpaid and prepaid revenues from growth in the customer base. Sequentially, the decline in Adjusted EBITDA was primarily due to the impact from Data Stash as well as strategic investments in growth in the early part of 2015, consistent with the Company s previously announced intentions. The non-cash revenue deferral for Data Stash reduced Adjusted EBITDA by $112 million in the first quarter of The revenue deferral for the initial 10GB allotment per qualifying customer from Data Stash is expected to fully reverse itself during The Adjusted EBITDA margin was 24% for the first quarter of 2015, up from 20% in the first quarter of T-Mobile made strategic investments in growth in the first quarter of 2015 resulting in a loss per share of $(0.09) in the first quarter of 2015 compared to a loss per share of $(0.19) in the first quarter of T-Mobile expects earnings per share to be positive in all the remaining quarters and full-year Network Expansion and Capital Expenditures T-Mobile s 4G LTE network - America s Fastest - covered 275 million people at the end of the first quarter of 2015 and the Company is targeting coverage of 300 million people by year-end T-Mobile is rapidly deploying Wideband LTE, while at the same time rolling out 4G LTE on its 700 MHz A-Block and 1900 MHz PCS spectrum. Wideband LTE is currently available in 157 market areas and is now expected to be available in more than 200 market areas by year-end The Company continues to deploy its 700 MHz A-Block spectrum with major market launches in Houston, Dallas, Philadelphia, Tampa, San Antonio, and Detroit so far in 2015, bringing the total to 55 market areas. Cash capital expenditures reflect T-Mobile s continued investment in the expansion of its 4G LTE network. In the first quarter of 2015, cash capital expenditures were $982 million, down from $1.3 billion in the fourth quarter of 2014 and up from $947 million in the first quarter of In January 2015, the FCC announced that T-Mobile was the winning bidder for AWS-3 spectrum licenses covering approximately 97 million people for an aggregate bid price of $1.8 billion. T-Mobile paid the FCC $1.4 billion for the AWS-3 spectrum licenses in February 2015, which was net of the $0.4 billion deposit paid to the FCC in October T-Mobile received the AWS-3 spectrum licenses early in the second quarter of MetroPCS Combination The MetroPCS customer base continues to rapidly migrate off the legacy CDMA network. Currently, less than 500,000 customers remain on the MetroPCS CDMA network. Approximately 80% of the MetroPCS spectrum had been re-farmed and integrated into the T-Mobile network at the end of the first quarter of In the first quarter of 2015, T-Mobile decommissioned the CDMA portion of the MetroPCS networks in Atlanta and the Detroit metro area, bringing the overall total to 8 market shutdowns so far, with only 3 major markets left. Total decommissioning costs for CDMA network shutdowns amounted to $128 million in the first quarter of The Company expects to decommission all the remaining CDMA markets in 2015, and expects to incur additional network decommissioning costs in the range of $375 to $475 million with substantially all the costs to be recognized in Outlook Guidance T-Mobile expects to drive further customer momentum while delivering strong growth in Adjusted EBITDA. With the success of its Simple Choice plan and the continued evolution of the Un-carrier strategy, branded postpaid net customer additions for 2015 are now expected to be between 3.0 and 3.5 million, an increase from the previous guidance of 2.2 and 3.2 million. For the full-year of 2015, T-Mobile expects Adjusted EBITDA to be in the range of $6.8 to $7.2 billion, unchanged from previous guidance despite the increase in branded postpaid net customer additions guidance. Cash capital expenditures for 2015 are expected to be in the range of $4.4 to $4.7 billion, also unchanged from previous guidance. T-Mobile US, Inc SE 38th Street Bellevue, Washington Phone Internet 3
7 Quarterly Financial Results For more details on T-Mobile s first quarter 2015 financial results, including the Investor Factbook with detailed financial tables and reconciliations of certain non-gaap measures disclosed in this release to the most comparable measures under GAAP, please visit T- Mobile US, Inc.'s Investor Relations website at T-Mobile Social Media Investors and others should note that the Company announces material financial and operational information to its investors using its investor relations website, press releases, SEC filings and public conference calls and webcasts. The Company also intends to use the Twitter which Mr. Legere also uses as a means for personal communications and observations, as means of disclosing information about the Company and its services and for complying with its disclosure obligations under Regulation FD. The information we post through these social media channels may be deemed material. Accordingly, investors should monitor these social media channels in addition to following the Company s press releases, SEC filings and public conference calls and webcasts. The social media channels that the Company intends to use as a means of disclosing the information described above may be updated from time to time as listed on the Company s investor relations website. About T-Mobile US, Inc.: As America's Un-carrier, T-Mobile US, Inc. (NYSE: TMUS) is redefining the way consumers and businesses buy wireless services through leading product and service innovation. The Company's advanced nationwide 4G LTE network delivers outstanding wireless experiences to approximately 57 million customers who are unwilling to compromise on quality and value. Based in Bellevue, Washington, T-Mobile US provides services through its subsidiaries and operates its flagship brands, T-Mobile and MetroPCS. For more information, please visit First Quarter 2015 Earnings Conference Call T-Mobile US, Inc. will host a conference call to discuss its financial and operational results for the first quarter 2015: T-Mobile Conference Call Information: Date: Tuesday, April 28, 2015 Time: 10:00 a.m. (EST) Call-in Numbers: International: Participant Passcode: Please plan on accessing the conference call ten minutes prior to the scheduled start time. The earnings call will be broadcast via the Company's Investor Relations website at and an embedded livestream video on Twitter T-Mobile will also take questions via text using using the keyword TMUS followed by a space or directed at the Twitter using #TMUSearnings. A replay of the conference call will be available for two weeks starting shortly after the call concludes and can be accessed by dialing (toll free) or (international). The passcode required to listen to the replay is T-Mobile US, Inc SE 38th Street Bellevue, Washington Phone Internet 4
8 Forward-Looking Statements This news release includes "forward-looking statements" within the meaning of the U.S. federal securities laws. Any statements made herein that are not statements of historical fact, including statements about T-Mobile US, Inc.'s plans, outlook, beliefs, opinion, projections, guidance, strategy, integration of MetroPCS, expected network modernization and other advancements, are forward-looking statements. Generally, forward-looking statements may be identified by words such as "anticipate," "expect," "suggests," "plan," project, "believe," "intend," "estimates," "targets," "views," "may," "will," "forecast," and other similar expressions. The forward-looking statements speak only as of the date made, are based on current assumptions and expectations, and involve a number of risks and uncertainties. Important factors that could affect future results and cause those results to differ materially from those expressed in the forward-looking statements include, among others, the following: our ability to compete in the highly competitive U.S. wireless telecommunications industry; adverse conditions in the U.S. and international economies and markets; significant capital commitments and the capital expenditures required to effect our business plan; our ability to adapt to future changes in technology, enhance existing offerings, and introduce new offerings to address customers' changing demands; changes in legal and regulatory requirements, including any change or increase in restrictions on our ability to operate our network; our ability to successfully maintain and improve our network, and the possibility of incurring additional costs in doing so; major equipment failures; severe weather conditions or other force majeure events; and other risks described in our filings with the Securities and Exchange Commission, including those described in our Annual Report on Form 10-K filed with the Securities and Exchange Commission on February 19, You should not place undue reliance on these forward-looking statements. We do not undertake to update forward-looking statements, whether as a result of new information, future events or otherwise, except as required by law. Press Contact: Investor Relations Contact: Media Relations Nils Paellmann T-Mobile US, Inc. T-Mobile US, Inc. mediarelations@t-mobile.com TMUS or investor.relations@t-mobile.com T-Mobile US, Inc SE 38th Street Bellevue, Washington Phone Internet 5
9 T-MOBILE US, Inc. Reconciliation of Non-GAAP Financial Measures to GAAP Financial Measures (Unaudited) This Press Release includes non-gaap financial measures. The non-gaap financial measures should be considered in addition to, but not as a substitute for, the information provided in accordance with GAAP. T-Mobile believes the non-gaap financial measures facilitate key operating performance comparisons with other companies in the wireless industry to provide management, investors, and analysts with useful information to assess and evaluate past performance and assist in forecasting future performance. Reconciliations for the non-gaap financial measures to the most directly comparable GAAP financial measures are provided below. Adjusted EBITDA is reconciled to net income (loss) as follows: (in millions) Q Q Q Q Q Net income (loss) $ (151) $ 391 $ (94) $ 101 $ (63) Adjustments: Interest expense to affiliates Interest expense Interest income (75) (83) (97) (104) (112) Other expense (income), net (21) 8 Income tax expense (benefit) (102) 286 (117) 99 (41) Operating income (loss) (28) Depreciation and amortization 1,055 1,129 1,138 1,090 1,087 Cost of MetroPCS business combination Stock-based compensation (1) Gains on disposal of spectrum licenses (1) (731) 11 Other, net (1) Adjusted EBITDA $ 1,088 $ 1,451 $ 1,346 $ 1,751 $ 1,388 (1) Stock-based compensation includes tax impacts and may not agree to stock based compensation expense in the consolidated financial statements. Gains on disposal of spectrum licenses and Other, net transactions may not agree in total to the Gains on disposal of spectrum licenses and Other, net in the Condensed Consolidated Statements of Comprehensive Income (Loss) primarily due to certain routine operating activities, such as insignificant or routine spectrum license exchanges that would be expected to reoccur, and are therefore included in Adjusted EBITDA. Adjusted EBITDA - Earnings before interest expense (net of interest income), tax, depreciation, amortization, stock-based compensation and expenses not reflective of T-Mobile's ongoing operating performance. Adjusted EBITDA margin is Adjusted EBITDA divided by service revenues. Adjusted EBITDA is a non-gaap financial measure utilized by T-Mobile's management to monitor the financial performance of its operations. T-Mobile uses Adjusted EBITDA internally as a metric to evaluate and compensate its personnel and management for their performance, and as a benchmark to evaluate T-Mobile's operating performance in comparison to its competitors. Management also uses Adjusted EBITDA to measure its ability to provide cash flows to meet future debt service, capital expenditures and working capital requirements, and to fund future growth. T-Mobile believes analysts and investors use Adjusted EBITDA as a supplemental measure to evaluate overall operating performance and facilitate comparisons with other wireless communications companies. Adjusted EBITDA has limitations as an analytical tool and should not be considered in isolation or as a substitute for income from operations, net income, or any other measure of financial performance reported in accordance with GAAP. The reconciliation of Adjusted EBITDA to net income (loss) is detailed in the Reconciliation of Non-GAAP Financial Measures to GAAP Financial Measures schedule. T-Mobile US, Inc SE 38th Street Bellevue, Washington Phone Internet 6
10 T-Mobile US, Inc. Reconciliation of Non-GAAP Financial Measures to GAAP Financial Measures (continued) (Unaudited) The following tables illustrate the calculation of ARPA and ABPA and reconcile these measures to the related service revenues, which we consider to be the most directly comparable GAAP financial measure to ARPA and ABPA: (in millions, except average number of accounts, ARPA and ABPA) Q Q Q Q Q Calculation of Branded Postpaid ARPA Branded postpaid service revenues $ 3,447 $ 3,511 $ 3,670 $ 3,764 $ 3,774 Divided by: Average number of branded postpaid accounts (in thousands) and number of months in period 10,543 10,928 11,141 11,421 11,645 Branded postpaid ARPA $ $ $ $ $ Calculation of Branded Postpaid ABPA Branded postpaid service revenues $ 3,447 $ 3,511 $ 3,670 $ 3,764 $ 3,774 Add: EIP billings ,162 1,292 Total billings for branded postpaid customers $ 4,104 $ 4,321 $ 4,637 $ 4,926 $ 5,066 Divided by: Average number of branded postpaid accounts (in thousands) and number of months in period 10,543 10,928 11,141 11,421 11,645 Branded postpaid ABPA $ $ $ $ $ Average Revenue Per Account (ARPA) - Average monthly branded postpaid service revenue earned per account. Branded postpaid service revenues for the specified period divided by the average number of branded postpaid accounts during the period, further divided by the number of months in the period. T-Mobile considers branded postpaid ARPA to be indicative of its revenue growth potential given the increase in the average number of branded postpaid phone customers per account and increased penetration of mobile broadband devices. Average Billings Per Account (ABPA) - Average monthly branded postpaid service revenue earned from customers plus equipment installment plan (EIP) billings divided by the average number of branded postpaid accounts during the period, further divided by the number of months in the period. T-Mobile believes average branded postpaid customer billings per account is indicative of estimated cash collections, including equipment installments, from T-Mobile's customers each month on a per account basis. T-Mobile US, Inc SE 38th Street Bellevue, Washington Phone Internet 7
11 T-Mobile US, Inc. Reconciliation of Non-GAAP Financial Measures to GAAP Financial Measures (continued) (Unaudited) The following tables illustrate the calculation of ARPU and ABPU and reconcile these measures to the related service revenues, which we consider to be the most directly comparable GAAP financial measure to ARPU and ABPU: (in millions, except average number of customers, ARPU and ABPU) Q Q Q Q Q Calculation of Branded Postpaid Phone ARPU Branded postpaid service revenues $ 3,447 $ 3,511 $ 3,670 $ 3,764 $ 3,774 Less: Branded postpaid mobile broadband revenues (47) (54) (68) (92) (109) Branded postpaid phone service revenues $ 3,400 $ 3,457 $ 3,602 $ 3,672 $ 3,665 Divided by: Average number of branded postpaid phone customers (in thousands) and number of months in period 22,447 23,368 24,091 25,359 26,313 Branded postpaid phone ARPU $ $ $ $ $ Calculation of Branded Postpaid ABPU Branded postpaid service revenues $ 3,447 $ 3,511 $ 3,670 $ 3,764 $ 3,774 Add: EIP billings ,162 1,292 Total billings for branded postpaid customers $ 4,104 $ 4,321 $ 4,637 $ 4,926 $ 5,066 Divided by: Average number of branded postpaid customers (in thousands) and number of months in period 22,975 24,092 25,095 26,572 27,717 Branded postpaid ABPU $ $ $ $ $ Calculation of Branded Prepaid ARPU Branded Prepaid Service Revenues $ 1,648 $ 1,736 $ 1,790 $ 1,812 $ 1,842 Divided by: Average number of branded prepaid customers (in thousands) and number of months in period 15,221 15,569 15,875 16,097 16,238 Branded prepaid ARPU $ $ $ $ $ Average Revenue Per User (ARPU) - Average monthly service revenue earned from customers. Service revenues for the specified period divided by the average customers during the period, further divided by the number of months in the period. Branded postpaid phone ARPU excludes mobile broadband customers and related revenues. Branded Postpaid Average Billings per User (ABPU) - Average monthly branded postpaid service revenue earned from customers plus EIP billings divided by the average branded postpaid customers during the period, further divided by the number of months in the period. T-Mobile believes branded postpaid ABPU is indicative of estimated cash collections, including equipment installments, from T-Mobile's customers each month. T-Mobile US, Inc SE 38th Street Bellevue, Washington Phone Internet 8
12 T-Mobile US, Inc. Reconciliation of Non-GAAP Financial Measures to GAAP Financial Measures (continued) (Unaudited) Net debt (excluding Tower Obligations) to last twelve months adjusted EBITDA ratio is calculated as follows: (in millions, except net debt ratio) Net Debt (excluding Tower Obligations) to Last Twelve Months Adjusted EBITDA Ratio (1) March 31, 2014 Adjusted EBITDA for the last twelve months includes Pro Forma combined results from Q to reflect the results of MetroPCS prior to the business combination. Net debt - Short-term debt, long-term debt to affiliates, and long-term debt (excluding tower obligations), less cash and cash equivalents. Simple free cash flow is calculated as follows: Three Months Ended Short-term debt $ 151 $ 272 $ 1,168 $ 87 $ 467 Long-term debt to affiliates 5,600 5,600 5,600 5,600 5,600 Long-term debt 14,331 14,369 16,284 16,273 16,261 Less: Cash and cash equivalents (5,471) (3,080) (5,787) (5,315) (3,032) Net Debt (excluding Tower Obligations) $ 14,611 $ 17,161 $ 17,265 $ 16,645 $ 19,296 Last twelve months Adjusted EBITDA (1) 4,936 5,122 5,124 5,636 5,936 Net Debt (excluding Tower Obligations) to Last Twelve Months Adjusted EBITDA Ratio Mar 31, 2014 Jun 30, 2014 Sep 30, 2014 Dec 31, 2014 Mar 31, 2015 (in millions) Q Q Q Q Q Simple Free Cash Flow Adjusted EBITDA $ 1,088 $ 1,451 $ 1,346 $ 1,751 $ 1,388 Total Cash Capex - Property & Equipment ,131 1, Simple Free Cash Flow $ 141 $ 511 $ 215 $ 452 $ 406 Simple Free Cash Flow - Adjusted EBITDA less cash capital expenditures. Simple Free Cash Flow is utilized by management as a measure of liquidity and an indicator of how much cash is generated from the ordinary course of business operations. Simple free cash flow should not be construed as an alternative to cash flows from operating activities as determined in accordance with GAAP. T-Mobile US, Inc SE 38th Street Bellevue, Washington Phone Internet (Back To Top) 9 Section 3: EX-99.2 (TMUS EXHIBIT 99.2) EXHIBIT 99.2

13 1
14 2

15 CUSTOMER METRICS Branded Postpaid Customers Branded postpaid net customer additions were 1,125,000 in the first quarter of 2015 compared to 1,276,000 in the fourth quarter of 2014 and 1,323,000 in the first quarter of This marked the third consecutive quarter in which branded postpaid net customer additions were greater than one million, a clear indicator of the continued success of the Un-carrier initiatives and strong uptake of promotions for services and devices. T-Mobile is expected to again lead the industry in branded postpaid phone net customer additions with 991,000 in the first quarter of 2015, compared to 1,037,000 in the fourth quarter of 2014 and 1,256,000 in the first quarter of Branded postpaid phone gross additions in the first quarter of 2015 declined by 18% on a sequential basis due to heightened seasonal and competitive activity in the fourth quarter of 2014, and were down 14% year-over-year primarily due to the introduction of Un-carrier 4.0, T-Mobile s Early Termination Fee (ETF) offer, in the first quarter of T-Mobile is expected to have captured all of the industry s postpaid phone growth in the first quarter of Branded postpaid mobile broadband net customer additions were 134,000 in the first quarter of 2015, compared to 239,000 in the fourth quarter of 2014 and 67,000 in the first quarter of Branded postpaid phone churn was 1.30% in the first quarter of 2015, down 43 basis points compared to 1.73% in the fourth quarter of 2014 and down 17 basis points compared to 1.47% in the first quarter of This quarter marked the best ever branded postpaid phone churn performance in the Company s history. The sequential improvement was due to seasonal factors as well as a reduction in competitive activity compared to the fourth quarter of Additionally, the sequential and year-over-year decline in churn reflects ongoing improvements in the Company s network, customer service, and the overall value of its offerings in the marketplace, resulting in increased customer satisfaction and loyalty. 3


16 Branded Prepaid Customers Branded prepaid net customer additions were 73,000 in the first quarter of 2015, compared to 266,000 in the fourth quarter of 2014 and 465,000 in the first quarter of The lower level of branded prepaid net additions in the first quarter of 2015 was driven by increased competitive activity in the marketplace, increased customer migrations from branded prepaid to branded postpaid, and an atypical tax refund season. Migrations to branded postpaid plans reduced branded prepaid net customer additions in the first quarter of 2015 by approximately 195,000, up from 120,000 in the fourth quarter of 2014 and up from 110,000 in the first quarter of Branded prepaid churn was 4.62% in the first quarter of 2015, down 77 basis points from 5.39% in the fourth quarter of 2014 and up 28 basis points from 4.34% in the first quarter of Sequentially, the decrease in churn was principally due to seasonal factors. Year-over-year, the increase in churn was primarily due to increased competition including promotions in the marketplace. Total Branded Customers Total branded net customer additions were 1,198,000 in the first quarter of 2015 compared to 1,542,000 in the fourth quarter of 2014 and 1,788,000 in the first quarter of This was the fifth consecutive quarter in which branded net customer additions surpassed the one million milestone. 4
17 Wholesale Customers Total wholesale net customer additions were 620,000 in the first quarter of 2015 compared to 586,000 in the fourth quarter of 2014 and 603,000 in the first quarter of MVNO net customer additions were 479,000 in the first quarter of 2015 compared to 434,000 in the fourth quarter of 2014 and 383,000 in the first quarter of M2M net customer additions were 141,000 in the first quarter of 2015 compared to 152,000 in the fourth quarter of 2014 and 220,000 in the first quarter of Total Customers Total net customer additions were 1,818,000 in the first quarter of 2015 compared to 2,128,000 in the fourth quarter of 2014 and 2,391,000 in the first quarter of This was the eighth consecutive quarter in which total net customer additions exceeded one million. Since the launch of its Un-carrier initiative eight quarters ago, T-Mobile has added nearly 14 million total customers. T-Mobile ended the first quarter of 2015 with more than 56.8 million total customers. 5


18 NETWORK Network Modernization Update At the end of the first quarter of 2015, T-Mobile s 4G LTE network covered 275 million people. T-Mobile is upgrading its remaining 2G only footprint by adding 4G LTE, and expects that this network modernization will result in 4G LTE network coverage of more than 280 million people by mid The Company is targeting a total 4G LTE population coverage of 300 million people by year-end Wideband LTE, which refers to markets that have bandwidth of at least MHz dedicated to 4G LTE, is currently available in 157 market areas and is now expected to be available in more than 200 market areas by year-end Customers in Wideband LTE markets are regularly observing peak speeds in the 70 Mbps range, with maximum real-world speeds in excess of 145 Mbps. Network Speed T-Mobile has the fastest nationwide 4G LTE network in the U.S. based on download speeds from millions of user-generated tests. This is the fifth consecutive quarter that T-Mobile has led the industry in average download speeds. In the first quarter of 2015, T-Mobile s average 4G LTE download speed was 18.6 Mbps compared to Verizon at 18.1 Mbps, AT&T at 14.6 Mbps, and Sprint at 10.2 Mbps. 6

19 Spectrum At the end of the first quarter of 2015, T-Mobile owned an average of 84 MHz of spectrum across the top 25 markets in the U.S, after including the spectrum licenses acquired in the recently concluded AWS-3 spectrum auction. The spectrum is comprised of an average of 10 MHz in the 700 MHz band, 30 MHz in the 1900 MHz PCS band, and 44 MHz in the AWS band. In January 2015, the FCC announced that T-Mobile was the winning bidder for AWS-3 spectrum licenses covering approximately 97 million people for an aggregate bid price of $1.8 billion. T-Mobile paid the FCC $1.4 billion for the AWS-3 spectrum licenses in February 2015, which was net of the $0.4 billion deposit paid to the FCC in October T-Mobile received the AWS-3 spectrum licenses early in the second quarter of The Company expects to participate in future FCC spectrum auctions including the broadcast incentive auction. A-Block Update T-Mobile owns or has agreements to own 700 MHz A-Block spectrum covering 190 million people or approximately 60% of the U.S. population and more than 70% of the Company s existing customer base. The spectrum covers 9 of the top 10 market areas and 24 of the top 30 market areas in the U.S. As of the end of the first quarter of 2015, T-Mobile had deployed its 700 MHz A-Block spectrum in 55 market areas. New launches in the first quarter of 2015 included the cities of Houston, Dallas, Philadelphia, Tampa, San Antonio, and Detroit. The Company expects to continue to aggressively roll-out new 700 MHz sites in Several Band 12 capable handsets, including the Samsung Galaxy S6, are currently available in the market. More Band 12 capable handsets are expected to become available in the remainder of Approximately 81% of the population covered by the Company s A-Block spectrum is free and clear and ready to be deployed or will be ready for deployment in The remainder is encumbered by Channel 51 broadcasts, generally limiting T-Mobile s ability to use the spectrum until after the broadcast incumbencies are resolved. The Company has already entered into agreements to relocate broadcasters to new frequencies or operate concurrently in 13 markets covering more than 52 million people, making those markets available for launch in


20 METROPCS Integration and Expansion The MetroPCS customer base continues to rapidly migrate off the legacy CDMA network. Currently, less than 500,000 customers remain on the MetroPCS CDMA network. Approximately 80% of the MetroPCS spectrum on a MHz/POP basis has already been re-farmed and integrated into the T-Mobile network at the end of the first quarter of 2015 compared to 73% at the end of the fourth quarter of


21 Synergies and Integration Costs In the first quarter of 2015, T-Mobile decommissioned the CDMA portion of the MetroPCS networks in Atlanta and the Detroit metro area, bringing the overall total to 8 market shutdowns since the close of the business combination, with only 3 major markets left. These network shutdowns will provide the CDMA customers of MetroPCS with access to a faster 4G LTE network, free up spectrum that can be re-used to further improve the speed and quality of the T-Mobile network, and enable the Company to realize the synergies from running a single network structure. Total decommissioning costs for CDMA network shutdowns amounted to $128 million in the first quarter of The Company expects to decommission all the remaining CDMA markets in 2015, and expects to incur additional network decommissioning costs in the range of $375 to $475 million with substantially all the costs to be recognized in Network decommissioning costs primarily relate to the acceleration of lease costs for decommissioned cell sites, and are excluded from Adjusted EBITDA. UN-CARRIER INITIATIVES At the end of the first quarter of 2015, 92% of the branded postpaid customer base was on a Simple Choice plan, up from 89% at the end of the fourth quarter of 2014 and 75% at the end of the first quarter of At the end of the first quarter of 2015, 10.3 million customers were enrolled in the JUMP! program, up from 9.3 million at the end of the fourth quarter of 2014 and 5.3 million at the end of the first quarter of

22 Un-carrier Updates Un-carrier 9.0: Business Un-leashed: T-Mobile introduced a set of simple, transparent, and affordable rate plans that provide all business customers with unlimited talk and text, and 1GB of 4G LTE data. Additional data can either be purchased on a per line or pooled basis. T-Mobile is also partnering with GoDaddy and Microsoft Office 365 to provide a valuable array of mobile business tools free of charge, as well as extending a benefit to families by counting a company-paid line as the first line on a Simple Choice family account. The Un-contract: The Un-contract initiative is a guarantee to all postpaid Simple Choice customers that their rates will never increase as long as they remain a customer, even for those on promotional plans. Unlimited 4G LTE rate plans are guaranteed for a minimum of two years. Carrier Freedom: T-Mobile will pay off outstanding device payments of up to $650 per line for up to 10 lines when customers switch to T-Mobile. DEVICES Total device sales were 8.8 million units in the first quarter of 2015 compared to 9.0 million units in the fourth quarter of 2014 and 7.5 million units in the first quarter of Total smartphone sales were 8.0 million units in the first quarter of 2015 compared to 8.0 million units in the fourth quarter of 2014 and 6.9 million units in the first quarter of The upgrade rate for branded postpaid customers was approximately 8% in the first quarter of 2015 compared to approximately 11% in the fourth quarter of 2014 and approximately 7% in the first quarter of

23 EQUIPMENT INSTALLMENT PLANS (EIP) T-Mobile financed $1.483 billion of equipment sales on EIP in the first quarter of 2015, down 22.0% from $1.902 billion in the fourth quarter of 2014 and up 18.7% from $1.249 billion in the first quarter of The sequential decline was primarily due to lower device sales on EIP compared to heightened seasonal activity in the fourth quarter of The year-over-year increase was primarily due to growth in devices financed through EIP, including customers choosing to JUMP!. Customers on Simple Choice plans had associated EIP billings of $1.292 billion in the first quarter of 2015, up 11.2% from $1.162 billion in the fourth quarter of 2014 and up 96.7% from $657 million in the first quarter of Total EIP receivables, net of imputed discount and allowances for credit losses, were $4.842 billion at the end of the first quarter of 2015 compared to $4.690 billion at the end of the fourth quarter of 2014 and $3.086 billion at the end of the first quarter of The $152 million sequential increase in total EIP receivables, net in the first quarter of 2015 was lower than the sequential increase of $727 million in the fourth quarter of 2014, and reflects a return to the overall trend of declining growth in the total EIP receivables, net that was witnessed in the first three quarters of The Company continues to expect that the growth in Total EIP Receivables, net will moderate in


24 CUSTOMER QUALITY EIP receivables classified as Prime were 52% of total EIP receivables at the end of the first quarter of 2015, down two percentage points from the prior quarter and down one percentage point compared to the end of the first quarter of Total bad debt expense and losses from the factoring arrangement was $169 million in the first quarter of 2015 compared to $150 million in the fourth quarter of 2014 and $157 million in the first quarter of Year-over-year, total bad debt expense and losses from the factoring arrangement as a percentage of total revenues decreased by 11 basis points. Sequentially, total bad debt expense and losses from the factoring arrangement as a percentage of total revenues increased by 33 basis points primarily due to a nonrecurring impact from a change to the factoring arrangement. REVENUE METRICS Branded Postpaid Phone ARPU Branded postpaid phone ARPU was $46.43 in the first quarter of 2015, down 3.8% from $48.26 in the fourth quarter of 2014 and down 8.0% from $50.48 in the first quarter of As noted in connection with the fourth quarter of 2014 earnings, branded postpaid phone ARPU was impacted by the non-cash net revenue deferral for Data Stash and dilution resulting from promotional activities targeting families, including the 4 for $100 offer. Excluding the impact of Data Stash, branded postpaid phone ARPU in the first quarter of 2015 declined 1.2% sequentially and 5.5% year-over-year. 12

25 Branded Postpaid ABPU Branded postpaid ABPU was $60.94 in the first quarter of 2015, down 1.4% from $61.80 in the fourth quarter of 2014 and up 2.4% from $59.54 in the first quarter of Sequentially, the decrease in branded postpaid ABPU was primarily due to lower branded postpaid phone ARPU, partially offset by an increase in EIP billings on a per user basis. Year-over-year, the increase was primarily due to growth in EIP billings on a per user basis, offset in part by lower branded postpaid phone ARPU. Excluding the impact of Data Stash, branded postpaid ABPU in the first quarter of 2015 increased 0.6% sequentially and 4.5% year-over-year. Branded Postpaid Customers per Account Branded postpaid customers per account was 2.39 at the end of the first quarter of 2015, compared to 2.36 at the end of the fourth quarter of 2014 and 2.18 at the end of the first quarter of The sequential and year-over-year increase was primarily due to two factors: an increase in the number of branded postpaid phone customers per account as a result of service promotions targeting multiple phone lines, including the 4 for $100 offer, and increased penetration of mobile broadband devices. 13


26 Branded Postpaid ARPA Branded postpaid ARPA was $ in the first quarter of 2015, down 1.7% from $ in the fourth quarter of 2014 and down 0.9% from $ in the first quarter of The sequential and year-over-year decline in branded postpaid ARPA was primarily due to lower branded postpaid phone ARPU resulting from promotional activities targeting families, partially offset by an increase in the number of branded postpaid customers per account. Excluding the impact of Data Stash, branded postpaid ARPA in the first quarter of 2015 increased 1.1% sequentially and 1.9% year-over-year. Branded Postpaid ABPA Branded postpaid ABPA grew to a record $ in the first quarter of 2015, up 0.9% from $ in the fourth quarter of 2014 and up 11.8% from $ in the first quarter of The sequential and year-over-year increase was primarily due to growth in EIP billings and an increase in the number of branded postpaid customers per account. Excluding the impact of Data Stash, branded postpaid ABPA in the first quarter of 2015 increased 3.0% sequentially and 14.1% year-over-year. 14
27 Branded Prepaid ARPU Branded prepaid ARPU was $37.81 in the first quarter of 2015, up 0.8% from $37.51 in the fourth quarter of 2014 and up 4.8% from $36.09 in the first quarter of Sequentially and year-over-year, the increase in branded prepaid ARPU was primarily due to an increase in data attach rates. REVENUES Service Revenues T-Mobile is expected to again lead the industry in year-over-year service revenue growth in the first quarter of Service revenues were $5.819 billion in the first quarter of 2015, down 0.9% from $5.870 billion in the fourth quarter of 2014 and up 9.0% from $5.337 billion in the first quarter of Sequentially, the decrease in service revenues was primarily due to the non-cash net revenue deferral from Data Stash, partially offset by growth in the customer base. Year-over-year, the increase in service revenues was primarily due to growth in the Company s customer base from the continued success of T-Mobile s Un-carrier initiatives and strong customer response to promotional activities targeting families as well as the success of the MetroPCS brand, partially offset by lower branded postpaid phone ARPU and the impact of Data Stash. Excluding the impact of Data Stash, service revenues in the first quarter of 2015 increased 0.9% sequentially and 11.0% year-over-year. 15
28 Equipment Sales Revenues Equipment sales revenues were $1.851 billion in the first quarter of 2015, down 15.1% from $2.180 billion in the fourth quarter of 2014 and up 27.8% from $1.448 billion in the first quarter of Sequentially, the decrease in equipment sales revenues was primarily due to lower device upgrade volumes and a lower average revenue per device sold. Year-over-year, the increase in equipment sales revenues was primarily due to an increase in the number of devices sold, including higher device upgrade volumes, and a higher average revenue per device sold. Total Revenues T-Mobile is expected to again lead the industry in year-over-year total revenue growth in the first quarter of Total revenues were $7.778 billion in the first quarter of 2015, down 4.6% from $8.154 billion in the fourth quarter of 2014 and up 13.1% from $6.875 billion in the first quarter of Excluding the impact of Data Stash, total revenues in the first quarter of 2015 decreased 3.2% sequentially and increased 14.8% year-over-year. 16


29 OPERATING EXPENSES Cost of Services Cost of services was $1.395 billion in the first quarter of 2015, up 0.9% from $1.383 billion in the fourth quarter of 2014 and down 4.7% from $1.464 billion in the first quarter of The sequential increase was primarily due to the network expansion and 700 MHz A-Block build out and an increase in certain regulatory surcharges, partially offset by lower lease expense. The year-over-year decrease was primarily due to a reduction to certain regulatory surcharges, lower roaming expense driven by the migration of customers from the legacy MetroPCS CDMA network to the T-Mobile network, and network synergies from the shutdown of the initial MetroPCS CDMA markets. Cost of Equipment Sales Cost of equipment sales was $2.679 billion in the first quarter of 2015, down 4.7% from $2.812 billion in the fourth quarter of 2014 and up 17.2% from $2.286 billion in the first quarter of The sequential decrease was primarily due to lower device upgrade volumes and a lower average cost per device sold. The year-over-year increase was primarily due to an increase in the number of devices sold, including higher device upgrade volumes. 17

30 Selling, General and Admin. ( SG&A ) Expenses SG&A expenses were $2.372 billion in the first quarter of 2015, up 1.7% from $2.333 billion in the fourth quarter of 2014 and up 13.2% from $2.096 billion in the first quarter of The year-over-year increase was primarily due to higher promotional costs and higher employee-related expenses associated with an increase in the number of retail and customer support employees, to support the growing customer base. ADJUSTED EBITDA T-Mobile is expected to again lead the industry in year-over-year Adjusted EBITDA growth in the first quarter of Adjusted EBITDA was $1.388 billion in the first quarter of 2015, down 20.7% from $1.751 billion in the fourth quarter of 2014 and up 27.6% from $1.088 billion in the first quarter of Adjusted EBITDA in the first quarter of 2015 was impacted by a non-cash net revenue deferral for Data Stash that reduced Adjusted EBITDA by $112 million. The net revenue deferral for the initial 10GB allotment per qualifying customer from Data Stash is expected to fully reverse itself during Sequentially, the decrease in Adjusted EBITDA was primarily due to the non-cash net revenue deferral for Data Stash and higher losses on equipment sales which were strategic investments in growth in the early part of 2015, consistent with the Company s previously announced intentions. Excluding the impact from Data Stash, Adjusted EBITDA in the first quarter of 2015 decreased 14.3% sequentially. Year-over-year, the increase in Adjusted EBITDA was primarily due to higher branded postpaid and prepaid revenues from growth in the customer base, offset in part by higher SG&A expenses associated with customer growth and a reduction of Adjusted EBITDA from the net revenue deferral for Data Stash. Excluding the impact from Data Stash, Adjusted EBITDA in the first quarter of 2015 increased 37.9% year-over-year. Adjusted EBITDA margin was 24% in the first quarter of 2015 compared to 30% in the fourth quarter of 2014 and 20% in the first quarter of
 in the first quarter of 2014. The sequential decrease in diluted earnings per share was primarily due to strategic investments in growth in the first quarter of 2015.")
31 EARNINGS PER SHARE Diluted loss per share was $(0.09) in the first quarter of 2015 compared to diluted earnings per share of $0.12 in the fourth quarter of 2014 and diluted loss per share of $(0.19) in the first quarter of The sequential decrease in diluted earnings per share was primarily due to strategic investments in growth in the first quarter of T-Mobile expects to report positive earnings per share in all the remaining quarters and full-year CAPITAL EXPENDITURES Cash capital expenditures for property and equipment were $982 million in the first quarter of 2015 compared to $1.299 billion in the fourth quarter of 2014 and $947 million in the first quarter of The sequential decrease as well as the year-over-year increase were primarily due to the timing of network spend in connection with T-Mobile s modernization program and the build out of 4G LTE on the 700 MHz A-Block and 1900 MHz PCS spectrum. 19


32 SIMPLE FREE CASH FLOW Simple free cash flow was $406 million in the first quarter of 2015, compared to $452 million in the fourth quarter of 2014 and $141 million in the first quarter of Sequentially, the decrease was due to lower Adjusted EBITDA, partially offset by lower cash capital expenditures. Year-over-year, the increase was primarily due to higher Adjusted EBITDA, partially offset by higher cash capital expenditures. CAPITAL STRUCTURE Net debt, excluding tower obligations, at the end of the first quarter of 2015 was $19.3 billion. Total debt, excluding tower obligations, at the end of the first quarter of 2015 was $22.3 billion and was comprised of short-term debt of $0.5 billion, long-term debt to affiliates of $5.6 billion, and long-term debt of $16.2 billion. The ratio of net debt, excluding tower obligations, to Adjusted EBITDA for the trailing last twelve month ( LTM ) period was 3.3x at the end of the first quarter of 2015 compared to 3.0x at the end of the fourth quarter of 2014 and 3.0x at the end of the first quarter of The Company s cash position remains strong with $3.0 billion in cash at the end of the first quarter of The cash balance declined in the first quarter of 2015 due primarily to the AWS-3 spectrum payment. The cash balance at the end of the first quarter of 2015 also reflects a decline in accounts payable and accrued liabilities. 20

33 GUIDANCE T-Mobile expects to drive further customer momentum while delivering strong growth in Adjusted EBITDA. With the success of T-Mobile's Simple Choice plan and the continued evolution of the Un-carrier strategy, branded postpaid net customer additions for full-year 2015 are expected to be between 3.0 and 3.5 million, an increase from the previous guidance of 2.2 to 3.2 million. For full-year 2015, T-Mobile expects Adjusted EBITDA to be in the range of $6.8 to $7.2 billion, which is unchanged from previous guidance despite the increase in branded postpaid net customer additions guidance. Cash capital expenditures for full-year 2015 are expected to be in the range of $4.4 to $4.7 billion, which is unchanged from previous guidance. UPCOMING EVENTS (All dates and attendance tentative) MoffettNathanson Telecom and Media Conference, May 13-14, 2015, New York, NY JP Morgan Technology, Media and Telecom Conference, May 18-20, 2015, Boston, MA Credit Suisse 2nd Annual Telecom One-on-One Day, June 17, 2015, New York, NY T-Mobile US, Inc. Q Earnings Report, July 29,
T-Mobile US Q4 and Full Year 2013
 T-Mobile US Q4 and Full Year 2013 Disclaimer This presentation contains forward-looking statements within the meaning of the U.S. federal securities laws. For those statements, we claim the protection
UNITED STATES SECURITIES AND EXCHANGE COMMISSION WASHINGTON, DC FORM 8-K CURRENT REPORT
 TMUS 8-K 2/17/2016 Section 1: 8-K (TMUS FORM 8-K) UNITED STATES SECURITIES AND EXCHANGE COMMISSION WASHINGTON, DC 20549 FORM 8-K CURRENT REPORT Pursuant to Section 13 or 15(d) of the Securities Exchange
UNITED STATES SECURITIES AND EXCHANGE COMMISSION WASHINGTON, DC FORM 8-K CURRENT REPORT
 TMUS 8-K 7/30/2015 Section 1: 8-K (TMUS FORM 8-K) UNITED STATES SECURITIES AND EXCHANGE COMMISSION WASHINGTON, DC 20549 FORM 8-K CURRENT REPORT Pursuant to Section 13 or 15(d) of the Securities Exchange
UNITED STATES SECURITIES AND EXCHANGE COMMISSION WASHINGTON, DC FORM 8-K CURRENT REPORT
 Section 1: 8-K (TMUS FORM 8-K) UNITED STATES SECURITIES AND EXCHANGE COMMISSION WASHINGTON, DC 20549 FORM 8-K CURRENT REPORT Pursuant to Section 13 or 15(d) of the Securities Exchange Act of 1934 Date
UNITED STATES SECURITIES AND EXCHANGE COMMISSION WASHINGTON, DC FORM 8-K CURRENT REPORT
 Section 1: 8-K (TMUS FORM 8-K) UNITED STATES SECURITIES AND EXCHANGE COMMISSION WASHINGTON, DC 20549 FORM 8-K CURRENT REPORT Pursuant to Section 13 or 15(d) of the Securities Exchange Act of 1934 Date
UNITED STATES SECURITIES AND EXCHANGE COMMISSION WASHINGTON, DC FORM 8-K
 UNITED STATES SECURITIES AND EXCHANGE COMMISSION WASHINGTON, DC 20549 FORM 8-K CURRENT REPORT Pursuant to Section 13 or 15(d) of the Securities Exchange Act of 1934 Date of report (Date of earliest event
Investor Factbook Q2 2015
 1 Investor Factbook Q2 2015 T-Mobile US, Inc. Investor Factbook T-Mobile US Reports Second Quarter 2015 Results 14% Revenue Growth and 25% Adjusted EBITDA Growth Year-over-Year in Q2 2015 as Customers
T-Mobile US, Inc. Investor Factbook
 1 T-Mobile US, Inc. Investor Factbook T-Mobile US Reports Second Quarter 2016 Results 1.9 Million Customer Nets, Record-Low Churn of 1.27%, Net Income of $225 Million, 12% Service Revenue Growth and 36%
T-Mobile US, Inc. Investor Factbook T-Mobile US Reports First Quarter 2017 Results
 EXHIBIT 99.2 T-Mobile US, Inc. Investor Factbook T-Mobile US Reports First Quarter 2017 Results T-Mobile Celebrates 4 Years as a Public Company with Industry Leading Customer & Financial Growth and Game-Changing
Cincinnati Bell Inc. March 4, 2013
 Cincinnati Bell Inc. March 4, 2013 Safe Harbor This presentation and the documents incorporated by reference herein contain forwardlooking statements regarding future events and our future results that
Q Earnings Conference Call. November 6, 2018
 Q3 2018 Earnings Conference Call November 6, 2018 Safe Harbor Statement This presentation includes forward-looking statements within the meaning of Section 27A of the Securities Act and Section 21E of
4Q 2015 Earnings Conference Call. February 26, 2016
 4Q 2015 Earnings Conference Call February 26, 2016 Safe Harbor Statement This presentation includes forward-looking statements within the meaning of Section 27A of the Securities Act and Section 21E of
Verizon closes 2017 with strong wireless customer growth and retention, well-positioned in new markets
 News Release FOR IMMEDIATE RELEASE January 23, 2018 Media contact: Bob Varettoni 908.559.6388 robert.a.varettoni@verizon.com Verizon closes 2017 with strong wireless customer growth and retention, well-positioned
2017 Q4 Earnings Conference Call
 2017 Q4 Earnings Conference Call Forward Looking Statements This presentation includes certain forward-looking statements that are made as of the date hereof and are based upon current expectations, which
1Q 2016 Earnings Conference Call. April 29, 2016
 1Q 2016 Earnings Conference Call April 29, 2016 Safe Harbor Statement This presentation includes forward-looking statements within the meaning of Section 27A of the Securities Act and Section 21E of the
Q Earnings Conference Call. August 7, 2018
 Q2 2018 Earnings Conference Call August 7, 2018 Safe Harbor Statement This presentation includes forward-looking statements within the meaning of Section 27A of the Securities Act and Section 21E of the
Cincinnati Bell Third Quarter 2011 Results. November 3, 2011
 Cincinnati Bell Third Quarter 2011 Results November 3, 2011 Today s Agenda Performance Highlights Jack Cassidy, President & Chief Executive Officer Review of Wireline, Wireless, IT Services & Hardware
3Q 2016 Earnings Conference Call. November 7, 2016
 3Q 2016 Earnings Conference Call November 7, 2016 Safe Harbor Statement This presentation includes forward-looking statements within the meaning of Section 27A of the Securities Act and Section 21E of
1Q 2017 Earnings Conference Call. May 4, 2017
 1Q 2017 Earnings Conference Call May 4, 2017 Safe Harbor Statement This presentation includes forward-looking statements within the meaning of Section 27A of the Securities Act and Section 21E of the Securities
4 TH. 4Q13 Earnings Conference Call January 28, AT&T Investor Update
 4Q13 Earnings Conference Call January 28, 2014 AT&T Investor Update 4 TH 2014 AT&T Intellectual Property. All rights reserved. AT&T, the AT&T logo and all other marks contained herein are trademarks of
Cincinnati Bell Second Quarter 2012 Results. August 8, 2012
 Cincinnati Bell Second Quarter 2012 Results August 8, 2012 Today s Agenda Performance Highlights Jack Cassidy, President & Chief Executive Officer Review of Cincinnati Bell Communications Ted Torbeck,
Verizon builds on 2Q momentum with strong 3Q results
 News Release FOR IMMEDIATE RELEASE October 19, 2017 Media contact: Bob Varettoni 908.559.6388 robert.a.varettoni@verizon.com Verizon builds on 2Q momentum with strong 3Q results 3Q 2017 highlights 89 cents
1Q 2015 Earnings Conference Call. May 4, 2015
 1Q 2015 Earnings Conference Call May 4, 2015 Safe Harbor Statement This presentation includes forward-looking statements within the meaning of Section 27A of the Securities Act and Section 21E of the Securities
2Q 2015 Earnings Conference Call. July 31, 2015
 2Q 2015 Earnings Conference Call July 31, 2015 Safe Harbor Statement This presentation includes forward-looking statements within the meaning of Section 27A of the Securities Act and Section 21E of the
T-MOBILE USA REPORTS THIRD QUARTER 2008 RESULTS
 T-MOBILE USA REPORTS THIRD QUARTER RESULTS $1.53 billion Operating Income Before Depreciation and Amortization ( OIBDA ) in the third quarter of, up 8% from the third quarter of 670,000 net new customers
Fourth Quarter 2012 Financial Summary. Quarter Ended
 Reports Fourth Quarter Financial Results Successful Execution of Challenger Strategy Leads to Improved Customer Development and Reduced Churn BELLEVUE, Wash. February 28, 2013, Inc. ( T-Mobile ) today
UBS 42 nd Annual Global Media and Communications Conference December 8, Leigh Fox, CFO
 UBS 42 nd Annual Global Media and Communications Conference December 8, 2014 Leigh Fox, CFO Safe Harbor This presentation and the documents incorporated by reference herein contain forward-looking statements
T-MOBILE USA REPORTS SECOND QUARTER 2009 RESULTS
 T-MOBILE USA REPORTS SECOND QUARTER RESULTS $1.6 billion Operating Income Before Depreciation and Amortization ( OIBDA ) in the second quarter of, up 16% from the first quarter of and up 1% from the second
TeraGo Reports Fourth Quarter and Year End 2018 Results
 TeraGo Reports Fourth Quarter and Year End Results Toronto February 21, 2019 TeraGo Inc. ( TeraGo or the Company ) (TSX: TGO, www.terago.ca), today announced financial and operating results for the fourth
CFO Commentary on Second Quarter 2016 Financial Results
 CFO Commentary on Second Quarter 2016 Financial Results August 2, 2016 Related Information The commentary in this document can be referenced in the financial information found in the earnings release issued
Comcast Full Year and Fourth Quarter Results Meet or Exceed All Operating and Financial Targets Setting Stage For Continued Growth in 2004
 Comcast Full Year and Fourth Quarter Results Meet or Exceed All Operating and Financial Targets Setting Stage For Continued Growth in 2004 Comcast Cable Delivers $6.35 Billion of Operating Cash Flow in
T-MOBILE USA CONTINUES TO INVEST IN NETWORK QUALITY AND REPORTS SECOND QUARTER 2008 RESULTS
 T-MOBILE USA CONTINUES TO INVEST IN NETWORK QUALITY AND REPORTS SECOND QUARTER RESULTS $1.58 billion Operating Income Before Depreciation and Amortization ( OIBDA ) in the second quarter of, up 14% from
T-MOBILE USA REPORTS FIRST QUARTER 2011 RESULTS
 T-MOBILE USA REPORTS FIRST QUARTER 2011 RESULTS Service revenues in the first quarter of 2011 at $4.63 billion, consistent with the first quarter of Contract ARPU $52 in the first quarter of 2011, up from
DNA Plc January-March 2018 Interim Report
 DNA Plc January-March 2018 Interim Report 19 April, 2018 Jukka Leinonen, CEO Timo Karppinen, CFO Forward looking statement This presentation contains, or may be deemed to contain, statements that are not
92% Industry-leading 4G LTE population coverage with consistent 4G download speeds
 Solid financial performance in a challenging environment; with key differentiating factors of delivering unmatched customer experience and superior network quality fuelling growth. Financial Review We
RESULTS FY Message from Management. October 25, 2017
 RESULTS Q2 FY 2017 Message from Management October 25, 2017 Marcelo Claure President, Chief Executive Officer 2Q Highlights Our thoughts and prayers are with those impacted by the recent hurricanes. While
T-MOBILE INTERNATIONAL REPORTS DETAILED FULL YEAR 2001 AND FOURTH QUARTER 2001 RESULTS OF VOICESTREAM
 Bonn/Bellevue, March 4, 2002 T-MOBILE INTERNATIONAL REPORTS DETAILED FULL YEAR 2001 AND FOURTH QUARTER 2001 RESULTS OF VOICESTREAM Subscriber base of U.S. operations reaches nearly 7 million 583,000 net
Verizon Reports Revenue Growth and Continued Improvement in Cash Flow in 2Q
 Verizon Reports Revenue Growth and Continued Improvement in Cash Flow in 2Q Consumer Sales Remain Strong as Verizon Adds High Volumes of New FiOS TV and Internet Customers, and More Than 1.1 Million Wireless
The Reed Report. Company Spotlight T-Mobile 3/1/2017
 The Reed Report Company Spotlight T-Mobile 3/1/2017 Business Overview T-Mobile (Ticker: TMUS) T-Mobile provides wireless communications services, including voice, messaging and data, to more than 71 million
MANAGEMENT DISCUSSION AND ANALYSIS THIRD QUARTER 2013 MD&A. Total active subscribers (in thousand) Q212 Q312 Q412 Q113 Q213 Q313
 Q212 Q312 Q412 Q113 Q213 Q313") MD&A Q313 Highlights On 23 July 2013, we successfully launched the new 3G 2.1GHz network, together with our existing 2G and 3G 850MHz networks, enabling us to serve our customers with better customer experience
MD&A Q313 Highlights On 23 July 2013, we successfully launched the new 3G 2.1GHz network, together with our existing 2G and 3G 850MHz networks, enabling us to serve our customers with better customer experience
MD&A. Operational Summary MANAGEMENT DISCUSSION AND ANALYSIS FIRST QUARTER 2016
 MD&A Executive Summary The competition level in Q116 heightened after the auctions in Q415 with expiration of 900 MHz concession and changes in spectrum holdings among operators. Handset subsidies on prepaid
MANAGEMENT S DISCUSSION AND ANALYSIS OF FINANCIAL CONDITION AND RESULTS OF OPERATIONS
 MANAGEMENT S DISCUSSION AND ANALYSIS OF FINANCIAL CONDITION AND RESULTS OF OPERATIONS TELEFONICA CELULAR DEL PARAGUAY S.A. As at and for the three month period ended 31 March 2018 1. Overview We are a
1st Quarter Earnings. AT&T Investor Update. April 25, 2018
 1st Quarter Earnings AT&T Investor Update April 25, 2018 Cautionary Language Concerning Forward-Looking Statements Information set forth in this presentation contains financial estimates and other forward-looking
T-Mobile USA Reports Second Quarter 2012 Operating Results Continued Solid Adjusted OIBDA in Q2; Churn Improvements
 Reports Second Quarter Operating Results Continued Solid Adjusted OIBDA in Q2; Churn Improvements Adjusted OIBDA increased 4.8% year-on-year to $1.3 billion in the second quarter of Adjusted OIBDA margin
DNA Plc January-June 2018 Half Year Financial Report
 DNA Plc January-June 2018 Half Year Financial Report 19 July, 2018 Jukka Leinonen, CEO Timo Karppinen, CFO Forward looking statement This presentation contains, or may be deemed to contain, statements
2nd Quarter 2017 Earnings Results
 2nd Quarter 2017 Earnings Results August 2, 2017 Forward-Looking Statements Except for historical and factual information, the matters set forth in this presentation and other of our oral or written statements
dtac FY January 2018 Investor Relations E: T:
 dtac FY2017 30 January 2018 Investor Relations E: ir@dtac.co.th T: +662 202 8882 FY17 highlights 22.7m total subscribers 97.7% of sub base registered under DTN 72.8% smartphone penetration 50.5% penetration
This presentation and the documents incorporated by reference herein contain forward-looking statements regarding future events and our future
 This presentation and the documents incorporated by reference herein contain forward-looking statements regarding future events and our future results that are subject to the safe harbor provisions of
TeraGo Reports 2018 Third Quarter Financial Results
 TeraGo Reports Third Quarter Financial Results Toronto November 7, TeraGo Inc. ( TeraGo or the Company ) (TSX: TGO, www.terago.ca), today announced financial and operating results for the quarter ended,.
Vonage Digital Phone Service 2010 Annual Report
 Vonage Digital Phone Service 2010 Annual Report 1 Our Mission Contents 2010 was a year of accomplishment. The dramatic improvement in our performance is a direct result of the focused efforts of our dedicated
Q Results. Emirates Integrated Telecommunications Company PJSC May 2014
 Q1 214 Results Emirates Integrated Telecommunications Company PJSC May 214 Disclaimer Emirates Integrated Telecommunications Company PJSC (hereafter du ) is a telecommunication services provider in the
Financial Results for the Fiscal Year Ended March 2015
 Financial Results for the Fiscal Year Ended March 2015 May 12, 2015 KDDI Corporation President Takashi Tanaka Today s Presentation 1 1. Financial Results for FY2015.3 2. Targeting the Next Growth Stage
AT&T Investor Update. 4Q08 Earnings Conference Call January 28, 2009
 AT&T Investor Update 4Q08 Earnings Conference Call January 28, 2009 2009 AT&T Intellectual Property. All rights reserved. AT&T, the AT&T logo and all other marks contained herein are trademarks of AT&T
VERIZON COMMUNICATIONS INC. (Exact name of registrant as specified in its charter)
") Page 1 of 9 UNITED STATES SECURITIES AND EXCHANGE COMMISSION Washington, D.C. 20549 FORM 8-K CURRENT REPORT Pursuant to Section 13 or 15(d) of the Securities Exchange Act of 1934 Date of Report: October
Page 1 of 9 UNITED STATES SECURITIES AND EXCHANGE COMMISSION Washington, D.C. 20549 FORM 8-K CURRENT REPORT Pursuant to Section 13 or 15(d) of the Securities Exchange Act of 1934 Date of Report: October
T-MOBILE USA REPORTS SECOND QUARTER 2010 RESULTS
 T-MOBILE USA REPORTS SECOND QUARTER RESULTS $4.70 billion service revenues in the second quarter of, an increase from $4.63 billion in the first quarter of, but down from $4.77 billion in the second quarter
DNA Plc January-September 2018 Interim Report
 DNA Plc January-September 2018 Interim Report 19 October, 2018 Jukka Leinonen, CEO Timo Karppinen, CFO Forward looking statement This presentation contains, or may be deemed to contain, statements that
DEUTSCHE TELEKOM CAPITAL MARKETS DAY Bonn, February 26 27, 2015
 DEUTSCHE TELEKOM CAPITAL MARKETS DAY 2015 Bonn, February 26 27, 2015 SAFE HARBOR STATEMENT This presentation contains forward-looking statements within the meaning of the U.S. federal securities laws.
QUALCOMM Reports First Quarter Results Revenues $941 Million, $.65 EPS
 Contact: Julie Cunningham Vice President, Investor Relations Ph 619-658-4224 Fax 619-651-9303 E-mail: juliec@qualcomm.com QUALCOMM Reports First Quarter Results Revenues $941 Million, $.65 EPS SAN DIEGO
Cincinnati Bell. Morgan Stanley Technology, Media, and Telecommunications Conference February 28, 2012
 Cincinnati Bell Morgan Stanley Technology, Media, and Telecommunications Conference February 28, 2012 Safe Harbor This presentation and the documents incorporated by reference herein contain forwardlooking
CenturyLink. 1 st Quarter 2012 Earnings Conference Call May 9, 2012
 CenturyLink 1 st Quarter 2012 Earnings Conference Call May 9, 2012 Forward-Looking Statements / Non-GAAP Financial Measures Certain non-historical statements made in this presentation and future oral or
MANAGEMENT DISCUSSION AND ANALYSIS FY 2012 MD&A
 MD&A Executive Summary Solid Results with Strong Net Additional Subscribers dtac 2012 results were strong both financially and operationally. Our total revenues grew healthily to THB 89.5 billion, increasing
T-MOBILE USA REPORTS THIRD QUARTER OF 2011 RESULTS
 T-MOBILE USA REPORTS THIRD QUARTER OF RESULTS Adjusted OIBDA of $1.45 billion in the third quarter of, an increase of 13% from the second quarter of and 9% from the third quarter of, largely due to the
MD&A. Executive Summary. Operational Summary MANAGEMENT DISCUSSION AND ANALYSIS SECOND QUARTER 2016
 MD&A Executive Summary In Q216, postpaid segment continued to do well amid intense competition, adding another 191k subs during the quarter on the back of improving network, popular digital services, and
Financial Results for the 1 st Half of the Fiscal Year Ending March 2015 (from April to September, 2014) President Takashi Tanaka KDDI Corporation
 President Takashi Tanaka KDDI Corporation") Financial Results for the 1 st Half of the Fiscal Year Ending March 2015 (from April to September, 2014) October 31, 2014 President Takashi Tanaka KDDI Corporation 1 Today s Presentation 1. Financial Results
Financial Results for the 1 st Half of the Fiscal Year Ending March 2015 (from April to September, 2014) October 31, 2014 President Takashi Tanaka KDDI Corporation 1 Today s Presentation 1. Financial Results
Financial Results for the Fiscal Year Ended March 2014
 Financial Results for the Fiscal Year Ended March 2014 April 30, 2014 KDDI Corporation President Takashi Tanaka Today s Presentation 1 1. Financial Results for FY2014.3 2. Forecasts for FY2015.3 3. Targeting
Fourth Quarter and Full Year 2018 Earnings Presentation. February 21, 2019
 Fourth Quarter and Full Year 2018 Earnings Presentation February 21, 2019 1 Safe Harbor Caution Concerning Forward-Looking Statements Various remarks that the Company makes contain forward-looking statements
Vodafone K.K. FY04 interim results Period ended 30 September 2004
 Vodafone K.K. FY04 interim results Period ended 30 September 2004 16 Nov 2004 Presented by: J. Brian Clark Representative Executive Officer, President & CEO John Durkin Representative Executive Officer,
MANAGEMENT DISCUSSION AND ANALYSIS FIRST QUARTER 2013 MD&A
 MD&A Q113 Highlights In Q113, dtac achieved another great quarter with service revenues growing healthily 9.1% YoY and 2.6% QoQ, mainly contributed by strong data revenue growth partly offset by voice
MANAGEMENT DISCUSSION AND ANALYSIS SECOND QUARTER 2013 MD&A
 MD&A Q213 Highlights In Q213, total revenues developed healthily at 13.5% YoY and 2.7% QoQ on the back of strong service revenues and handset sales. Service revenues, rising 10.7% YoY and 1.2% QoQ, was
First Quarter 2018 Earnings Presentation. May 8, 2018
 First Quarter 2018 Earnings Presentation May 8, 2018 1 Safe Harbor Caution Concerning Forward-Looking Statements Various remarks that the Company makes contain forward-looking statements regarding acquisitions,
dtac third quarter 2015
 dtac third quarter 2015 19 Oct 2015 Investor Relations E: ir@dtac.co.th T: +662 202 8882 key highlights 21.9m DTN subs 88% of sub base THB7.8b data revenues 47% of service revenues ex. IC THB7.1b EBITDA
Conference call October 26, :00 / Helsinki 08:00 / New York 1 Nokia 2016 Q3 2017
 Conference call October 26, 2017 15:00 / Helsinki 08:00 / New York 1 Nokia 2016 Q3 2017 Disclaimer It should be noted that Nokia and its business are exposed to various risks and uncertainties, and certain
in the operating segments.
 9 Development of business in the operating segments. Germany. Customer development. G 27 Mobile customers. G 29 Fixed-network lines. 4, 36,568 37,5 37,492 37,936 38,625 24, 22,384 22,113 21,88 21,625 21,417
THE SPRINT QUARTERLY INVESTOR UPDATE 1Q13 1
 THE SPRINT QUARTERLY INVESTOR UPDATE 1Q13 1 SPRINT REPORTS FIRST QUARTER 2013 RESULTS Operating Income of $29 million, includes accelerated depreciation of approximately $360 million; Adjusted OIBDA* of
Verizon Caps Strong Record of Success in 2013 With Fourth Consecutive Quarter of Double-Digit Earnings Growth 4Q 2013 HIGHLIGHTS
 Verizon Caps Strong Record of Success in 2013 With Fourth Consecutive Quarter of Double-Digit Earnings Growth 4Q 2013 HIGHLIGHTS Consolidated $1.76 in earnings per share (EPS), compared with a loss of
Opportunity Day 2Q13 INTOUCH Performance
 Opportunity Day 2Q13 INTOUCH Performance 19 Aug 2013 Stock Exchange of Thailand (SET) 1 EIGHT BREAKTHROUGH MISSIONS - Digital TV: To update regulatory, prepare bidding strategy and budget - Venture Capital:
Sunrise Communications Holdings S.A.
 November 24, 2011 Sunrise Communications Holdings S.A. Financial Results January September 2011 Key Messages Sunrise continues its good financial performance driven by strong postpaid and LLU customer
INVESTOR PRESENTATION October 2013
 Shenandoah Telecommunications Company INVESTOR PRESENTATION October 2013 NASDAQ: SHEN Safe Harbor Statement This presentation includes forward-looking statements within the meaning of Section 27A of the
SBC Investor Update. Merrill Lynch Global Communications Investor Conference March 16, 2004
 SBC Investor Update Merrill Lynch Global Communications Investor Conference March 16, 2004 Randall Stephenson Senior Executive Vice President and Chief Financial Officer Cautionary Language Concerning
UNITED STATES SECURITIES AND EXCHANGE COMMISSION FORM 8-K
 UNITED STATES SECURITIES AND EXCHANGE COMMISSION Washington, D.C. 20549 FORM 8-K CURRENT REPORT Pursuant to Section 13 or 15(d) of the Securities Exchange Act of 1934 Date of Report (Date of earliest event
MD&A. Growing Subscribers with Slightly Decreasing ARPU CONTENTS
 MANAGEMENT DISCUSSION AND ANALYSIS F Y 2011 MD&A CONTENTS I EXECUTIVE SUMMARY 2011 was a significant year for dtac as we began our entire network upgrade and our 3G HSPA on 850 MHz launch which was our
Vodafone Analyst & Investor Day Monday 27 September 2004
 Vodafone Analyst & Investor Day Monday 27 September 2004 Verizon Wireless Andy Halford Chief Financial Officer 1 Safe Harbor Statement NOTE: This presentation contains statements about expected future
FOURTH QUARTER January 26, 2017 Tele2 AB
 FOURTH QUARTER 2016 January 26, 2017 Tele2 AB Group highlights Q4 2016 Q4 2016 % Change Reported % Change LFL Mobile end-user service revenue (SEK billion) 3.71 +14% +6% Net sales 8.22 +18% +2% (SEK billion)
O2 Czech Republic. Quarterly Results January September th November 2014
 O2 Czech Republic Quarterly Results January September 2014 12 th November 2014 CAUTIONARY STATEMENT Any forward-looking statements concerning future economic and financial performance of O2 Czech Republic
Cincinnati Bell 3rd Quarter 2010 Review. November 3, 2010
 Cincinnati Bell 3rd Quarter 2010 Review November 3, 2010 Agenda 1. Performance Highlights Jack Cassidy, President & CEO 2. Operational Review of Wireline and Wireless Ted Torbeck, President of Cincinnati
Cincinnati Bell 1st Quarter 2010 Review. May 6, 2010
 Cincinnati Bell 1st Quarter 2010 Review May 6, 2010 Agenda 1. Performance Highlights Jack Cassidy, President & CEO 2. Operational Overview Brian Ross, Chief Operating Officer 3. Financial Overview Gary
Financial Results for the Nine Months Ended December 31, 2012
 Financial Results for the Nine Months Ended December 31, 2012 February 6, 2013 The forward-looking statements and projected figures concerning the future performance of NTT and its subsidiaries and affiliates
Second Quarter Earnings Call Investor Presentation. August 5, 2010
 Second Quarter 2010 - Earnings Call Investor Presentation August 5, 2010 0 0 Safe Harbor Language This press release contains certain statements that are forward-looking statements within the meaning of
second quarter July 2014 Investor Relations E: T:
 second quarter 2014 18 July 2014 key highlights 28m total subscribers 68% ported to DTN 37% smartphone penetration 39% data revenue growth >80% 2.1GHz pop coverage 36.4% EBITDA margin THB 1.58 per share
DNA Plc Half year 2017 report
 DNA Plc Half year 2017 report 18 July, 2017 Jukka Leinonen, CEO Timo Karppinen, CFO Forward looking statement This presentation contains, or may be deemed to contain, statements that are not historical
SECURITIES AND EXCHANGE COMMISSION Washington, D.C FORM 8-K COMPAQ COMPUTER CORPORATION
 SECURITIES AND EXCHANGE COMMISSION Washington, D.C. 20549 FORM 8-K CURRENT REPORT PURSUANT TO SECTION 13 OR 15(d) OF THE SECURITIES EXCHANGE ACT OF 1934 Date of Report: July 20, 1994 COMPAQ COMPUTER CORPORATION
Earnings Results for the Three-month Period Ended June 30, 2012
 Earnings Results for the Three-month Period Ended June 30, 2012 July 31, 2012 SOFTBANK CORP. Disclaimer This material was prepared based on information available and views held at the time it was made.
MAGYAR TELEKOM GROUP Q RESULTS PRESENTATION MAY 8, 2018
 MAGYAR TELEKOM GROUP Q1 218 RESULTS PRESENTATION MAY 8, 218 Q1 218 GROUP SEGMENTAL REVENUE AND EBITDA Group segmental revenues* Group segmental EBITDA* 152 15 148 146 144 3. 3.8 3.6 +6.5% -1.6.4 -.1. 149.6
The Q results conference call 26 October 2017 at 14:00 CET
 The Q3 2017 results conference call 26 October 2017 at 14:00 CET Presenters Davor Tomašković Hrvatski Telekom President of the Management Board and CEO Josef Thürriegl Hrvatski Telekom - Member of the
3Q17 Results Presentation. 16 October 2017
 3Q17 Results Presentation 16 October 2017 Forward looking statements Important note This presentation and the following discussion may contain forward looking statements by M1 Limited ( M1 ) relating to
THIRD QUARTER October 20, 2016 Tele2 AB
 THIRD QUARTER 216 October 2, 216 Tele2 AB Delivering on our long term strategy Value Champion Focused Technology Choices Step-Change Productivity Winning People & Culture Group mobile end-user service
CYRUSONE TO ACQUIRE ZENIUM DATA CENTERS
 CYRUSONE TO ACQUIRE ZENIUM DATA CENTERS THIRD QUARTER 2017 EARNINGS October 31, 2017 DECEMBER 21, 2017 SAFE HARBOR S A F E H A R B O R This presentation contains forward-looking statements regarding future
AT&T TO OFFER NEXT-GENERATION iphone ON ITS HIGH-PERFORMANCE 3G NETWORK. Broadband Speed and New Capabilities Enhance Iconic Mobile Device
 For more information, contact: Wes Warnock Phone: 404-236-6419 E-mail: wes.warnock@att.com Mark Siegel Phone: 404-236-6312 E-mail: mark.a.siegel@att.com AT&T TO OFFER NEXT-GENERATION iphone ON ITS HIGH-PERFORMANCE
O2 Czech Republic. Quarterly Results January June st August 2014
 O2 Czech Republic Quarterly Results January June 2014 1 st August 2014 CAUTIONARY STATEMENT Any forward-looking statements concerning future economic and financial performance of O2 Czech Republic a.s.
Quarterly Bulletin - 1Q17 True Corporation PLC. Executive Summary:
 Executive Summary: True Group delivered another solid performance in the first quarter of 2017 with EBITDA growth of nearly 30% YoY and EBITDA margin increasing to 32% due to strong revenue growth and