UNITED STATES SECURITIES AND EXCHANGE COMMISSION WASHINGTON, DC FORM 8-K CURRENT REPORT
|
|
|
- Bernadette Bryant
- 5 years ago
- Views:
Transcription
: April 26, 2016 T-MOBILE US, INC.")
1 Section 1: 8-K (TMUS FORM 8-K) UNITED STATES SECURITIES AND EXCHANGE COMMISSION WASHINGTON, DC FORM 8-K CURRENT REPORT Pursuant to Section 13 or 15(d) of the Securities Exchange Act of 1934 Date of report (Date of earliest event reported): April 26, 2016 T-MOBILE US, INC. (Exact Name of Registrant as Specified in Charter) DELAWARE (State or other jurisdiction (Commission File Number) (I.R.S. Employer of incorporation or organization) Identification No.) SE 38th Street Bellevue, Washington (Address of principal executive offices) (Zip Code) Registrant s telephone number, including area code: (425) (Former Name or Former Address, if Changed Since Last Report): Check the appropriate box below if the Form 8-K filing is intended to simultaneously satisfy the filing obligation of the registrant under any of the following provisions:
2 Written communications pursuant to Rule 425 under the Securities Act (17 CFR ) Soliciting material pursuant to Rule 14a-12 under the Exchange Act (17 CFR a-12) Pre-commencement communications pursuant to Rule 14d-2(b) under the Exchange Act (17 CFR d-2(b)) Pre-commencement communications pursuant to Rule 13e-4(c) under the Exchange Act (17 CFR e-4(c))
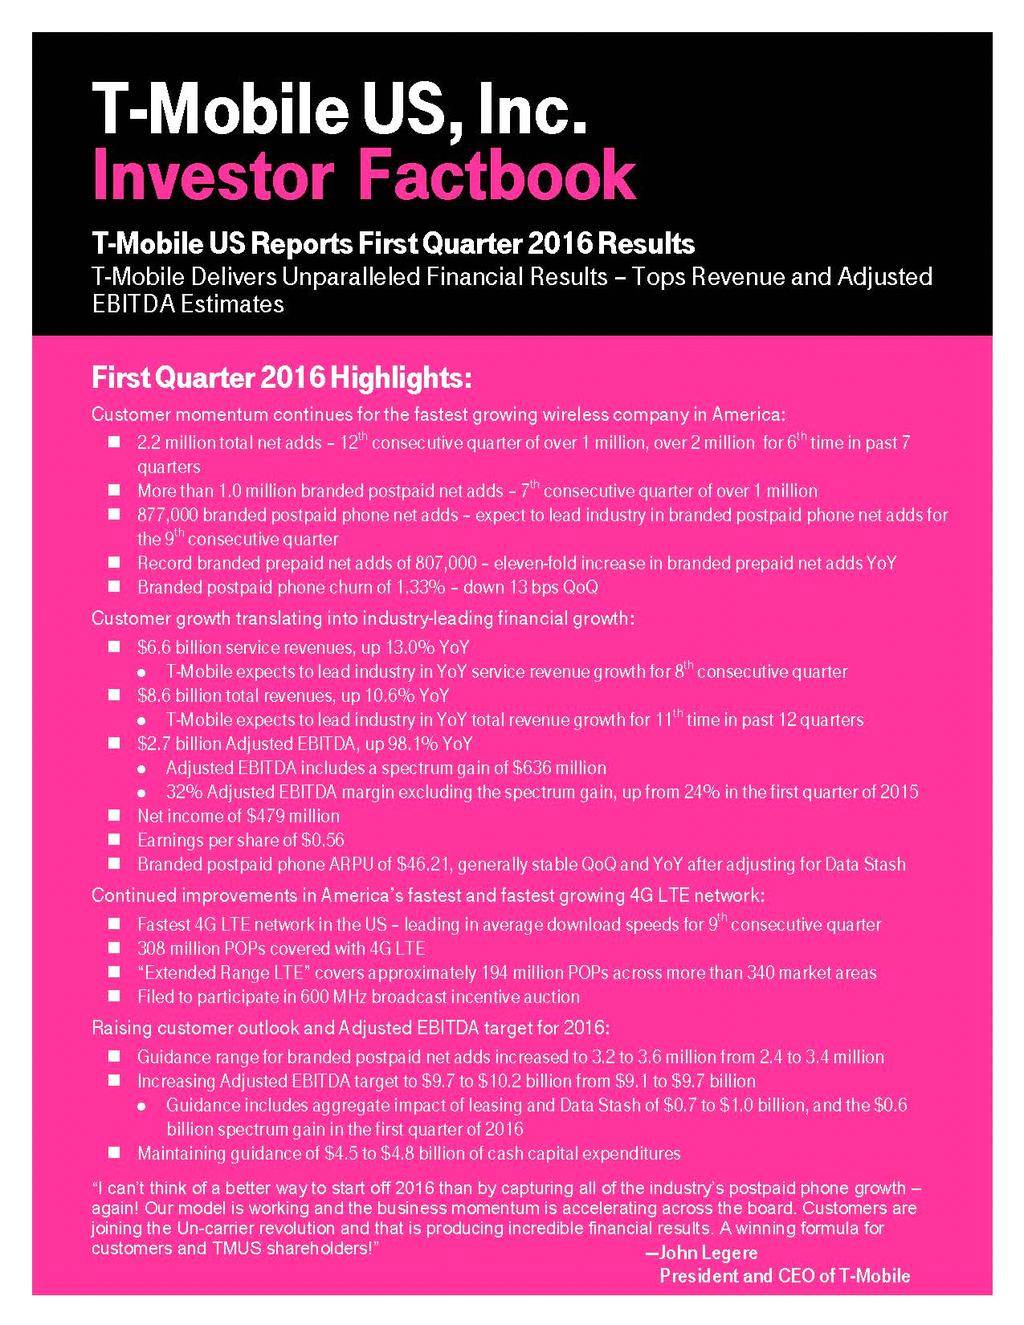
3 Item 2.02 Results of Operations and Financial Condition On April 26, 2016, T-Mobile US, Inc. issued a press release announcing the financial and operating results for T-Mobile US, Inc. for the quarter ended March 31, The text of the press release and accompanying financial information are attached as exhibits and incorporated herein by reference. Item 9.01 Financial Statements and Exhibits The following exhibits are furnished as part of this report: (d) Exhibits: Exhibit Description 99.1 Press release, dated April 26, 2016, entitled "T-Mobile Delivers Unparalleled Financial Results - Tops Revenue and Adjusted EBITDA Estimates" 99.2 Investor Factbook of T-Mobile US, Inc. First Quarter 2016 Results SIGNATURE Pursuant to the requirements of the Securities Exchange Act of 1934, the registrant has duly caused this report to be signed on its behalf by the undersigned hereunto duly authorized. T-MOBILE US, INC. April 26, 2016 /s/ J. Braxton Carter J. Braxton Carter Executive Vice President and Chief Financial Officer (Back To Top) Section 2: EX-99.1 (TMUS EXHIBIT 99.1) EXHIBIT 99.1 T-Mobile Delivers Unparalleled Financial Results - Tops Revenue and Adjusted EBITDA Estimates 2.2 Million Customer Nets, 13% Service Revenue Growth and $2.7 billion Adjusted EBITDA Despite Competition s Best Attacks First Quarter 2016 Highlights: Customer momentum continues for the fastest growing wireless company in America: 2.2 million total net adds - 12 th consecutive quarter of over 1 million, over 2 million for 6 th time in past 7 quarters More than 1.0 million branded postpaid net adds - 7 th consecutive quarter of over 1 million 877,000 branded postpaid phone net adds - expect to lead industry in branded postpaid phone net adds for the 9 th consecutive quarter Record branded prepaid net adds of 807,000 - eleven-fold increase in branded prepaid net adds YoY Branded postpaid phone churn of 1.33% - down 13 bps QoQ Customer growth translating into industry-leading financial growth: $6.6 billion service revenues, up 13.0% YoY T-Mobile expects to lead industry in YoY service revenue growth for 8 th consecutive quarter
4 $8.6 billion total revenues, up 10.6% YoY T-Mobile expects to lead industry in YoY total revenue growth for 11th time in past 12 quarters $2.7 billion Adjusted EBITDA, up 98.1% YoY Adjusted EBITDA includes a spectrum gain of $636 million 32% Adjusted EBITDA margin excluding the spectrum gain, up from 24% in the first quarter of 2015 Net income of $479 million Earnings per share of $0.56 Branded postpaid phone ARPU of $46.21, generally stable QoQ and YoY after adjusting for Data Stash Continued improvements in America s fastest and fastest growing 4G LTE network: Fastest 4G LTE network in the US - leading in average download speeds for 9th consecutive quarter 308 million POPs covered with 4G LTE Extended Range LTE covers approximately 194 million POPs across more than 340 market areas Filed to participate in 600 MHz broadcast incentive auction Raising customer outlook and Adjusted EBITDA target for 2016: Guidance range for branded postpaid net adds increased to 3.2 to 3.6 million from 2.4 to 3.4 million Increasing Adjusted EBITDA target to $9.7 to $10.2 billion from $9.1 to $9.7 billion Guidance includes aggregate impact of leasing and Data Stash of $0.7 to $1.0 billion, and the $0.6 billion spectrum gain in the first quarter of 2016 Maintaining guidance of $4.5 to $4.8 billion of cash capital expenditures BELLEVUE, Wash. - April 26, T-Mobile US, Inc. (NASDAQ: TMUS) today reported first quarter 2016 results which again showed that continued customer momentum is translating into strong financial growth. In the first quarter of 2016, T-Mobile added 2.2 million total net customers and outperformed the industry once again by delivering 13% growth in service revenue and 98% growth in Adjusted EBITDA year-over-year. I can t think of a better way to start off 2016 than by capturing all of the industry s postpaid phone growth - again! said John Legere, President and CEO of T-Mobile. Our model is working and the business momentum is accelerating across the board. Customers are joining the Un-carrier revolution and that is producing incredible financial results. A winning formula for customers and TMUS shareholders! T-Mobile US, Inc SE 38th Street Bellevue, Washington Phone Internet 1
5 Industry-Leading Customer Growth In the first quarter of 2016, T-Mobile added 2.2 million net customers, bringing its total customer count to more than 65.5 million. This was the twelfth consecutive quarter in which the Company has generated more than 1 million net customer additions and the sixth time in the past 7 quarters with more than 2 million net customer additions. T-Mobile also saw ongoing strength in branded postpaid customers with net additions of more than 1.0 million in the first quarter of This was the seventh consecutive quarter in which the Company has reported more than 1 million branded postpaid net customer additions. Branded postpaid phone net customer additions were 877,000 in the first quarter of T-Mobile is expected to once again capture all of the industry s postpaid phone net customer addition growth in the first quarter of Branded prepaid net customer additions in the first quarter of 2016 were a record 807,000, up eleven-fold year-over-year and 72% sequentially driven by a thriving MetroPCS business. Wholesale net customer additions were 373,000 in the first quarter of Branded postpaid phone churn was 1.33% in the first quarter of 2016, down 13 basis points compared to 1.46% in the fourth quarter of 2015 and generally stable compared to 1.30% in the first quarter of Branded prepaid churn was 3.84% in the first quarter of 2016, compared to 4.20% in the fourth quarter of 2015 and 4.62% in the first quarter of Total devices sold or leased were 9.4 million units in the first quarter of 2016, including 8.8 million smartphones. Industry-Leading Financial Growth In addition to strong customer growth, T-Mobile delivered outstanding financial results and it expects to once again lead the industry in year-over-year growth in service revenue, total revenue, and Adjusted EBITDA growth in the first quarter of Service revenues for the first quarter of 2016 grew by 13.0% year-over-year, primarily due to rapid growth in the Company s customer base. This is expected to mark the eighth consecutive quarter that T-Mobile has led the industry in year-over-year service revenue growth. T- Mobile s total revenues for the first quarter of 2016 grew by 10.6% year-over-year, which is also expected to lead the industry for the eleventh time in the past twelve quarters. Sequentially, growth in total revenues was positively impacted by the previously announced shift back toward EIP from JUMP! On Demand in the first quarter of Branded postpaid phone Average Revenue per User (ARPU) of $46.21 in the first quarter of 2016 was down 3.8% sequentially, primarily due to the non-cash net revenue deferral related to Data Stash, and down 0.5% year-over-year. Excluding the impact of Data Stash, ARPU was generally stable both sequentially and year-over-year as continued strategic focus on family plan penetration and promotional activity was offset by higher data attach rates. Branded postpaid Average Billings per User (ABPU) was $61.90 in the first quarter of 2016, up 1.6% year-over-year primarily due to growth in total lease revenues and EIP billings on a per user basis, partially offset by the net impact of Data Stash. Branded postpaid customers per account grew to 2.59 in the first quarter of 2016, up from 2.39 in the first quarter of In the first quarter of 2016, Adjusted EBITDA increased by 98.1% year-over-year to $2.749 billion. Adjusted EBITDA in the first quarter of 2016 included a spectrum gain of $636 million. Excluding the spectrum gain, Adjusted EBITDA grew by 52.2% year-over-year due to higher service revenues from growth in the customer base, lower losses on equipment, focused cost control and MetroPCS synergies, partially offset by higher selling, general and administrative expenses due to customer growth and promotional spending. Excluding the spectrum gain, the Adjusted EBITDA margin was 32% for the first quarter of 2016, compared to 24% in the first quarter of The aggregate impact from leasing and Data Stash on Adjusted EBITDA in the first quarter of 2016 was $204 million, including lease revenues of $342 million and the non-cash impact from Data Stash of $138 million. Net income amounted to $479 million, up from $297 million in the fourth quarter of 2015 and a net loss of $63 million in the first quarter of Earnings per share (EPS) in the first quarter of 2016 was $0.56, compared to EPS of $0.34 in the fourth quarter of 2015 and a loss per share of $0.09 in the first quarter of The after-tax impact of the spectrum gain on EPS in the first quarter of 2016 was $0.46. T-Mobile US, Inc SE 38th Street Bellevue, Washington Phone Internet 2
6 Net cash provided by operating activities was $1.025 billion in the first quarter of 2016, up from $489 million in the first quarter of Free cash flow was an outflow of $310 million in the first quarter of 2016, improving from an outflow of $493 million in the first quarter of Adjusted free cash flow, which excludes decommissioning payments, improved to an outflow of $247 million in the first quarter of 2016 from an outflow of $422 million in the first quarter of Continued Improvements in Fastest 4G LTE Network T-Mobile continued to make improvements to its 4G LTE network to support customer growth in the first quarter of 2016 and beyond. These improvements enabled T-Mobile to once again be the fastest 4G LTE network in the country based on download speeds from millions of user-generated tests. This is the ninth consecutive quarter that the Company has held that title. Currently, T-Mobile covers 308 million POPs with 4G LTE, which now includes partner LTE coverage. The Company has deployed Wideband LTE nationwide to add capacity to America s Fastest LTE Network and is expanding Extended Range LTE to enhance coverage and in-building performance. Extended Range LTE, which operates on the Company s low-band 700 MHz A-Block spectrum, currently covers approximately 194 million people in more than 340 market areas. In the first quarter of 2016, T-Mobile entered into agreements with multiple parties to acquire additional 700 MHz A-Block spectrum licenses. These acquisitions will increase T-Mobile s total low-band spectrum holdings from 210 million POPs to 258 million POPs upon closing. The Company has filed to participate in the 600 MHz broadcast incentive auction. Cash capital expenditures reflect T-Mobile s continued investment in the expansion of its 4G LTE network. In the first quarter of 2016, cash capital expenditures were $1.3 billion, down from $1.4 billion in the fourth quarter of 2015 and up from $1.0 billion in the first quarter of Raising Customer Outlook and Adjusted EBITDA Target for 2016 T-Mobile expects to drive further customer momentum while delivering strong growth in Adjusted EBITDA and free cash flow in Branded postpaid net customer additions for full-year 2016 are now expected to be between 3.2 and 3.6 million, an increase from the previous guidance range of 2.4 to 3.4 million. For the full-year 2016, T-Mobile expects Adjusted EBITDA to be in the range of $9.7 to $10.2 billion, up from the previous guidance of $9.1 to $9.7 billion. This guidance includes the aggregate impact from leasing and Data Stash of approximately $0.7 to $1.0 billion, and the spectrum gain of $0.6 billion recognized in the first quarter of Cash capital expenditures for full-year 2016 are expected to be in the range of $4.5 to $4.8 billion, unchanged from previous guidance. Quarterly Financial Results For more details on T-Mobile s first quarter 2016 financial results, including the Investor Factbook with detailed financial tables and reconciliations of certain historical non-gaap measures disclosed in this release to the most comparable measures under GAAP, please visit T-Mobile US, Inc.'s Investor Relations website at T-Mobile Social Media Investors and others should note that the Company announces material financial and operational information to its investors using its investor relations website, press releases, SEC filings and public conference calls and webcasts. The Company also intends to use Twitter account ( and Twitter ( and Periscope accounts, which Mr. Legere also uses as a means for personal communications and observations, as means of disclosing information about the Company and its services and for complying with its disclosure obligations under Regulation FD. The information we post through these social media channels may be deemed material. Accordingly, investors should monitor these social media channels in addition to following the Company s press releases, SEC filings and public conference calls and webcasts. The social media channels T-Mobile US, Inc SE 38th Street Bellevue, Washington Phone Internet 3
7 that the Company intends to use as a means of disclosing the information described above may be updated from time to time as listed on the Company s investor relations website. About T-Mobile US, Inc.: As America's Un-carrier, T-Mobile US, Inc. (NASDAQ: TMUS) is redefining the way consumers and businesses buy wireless services through leading product and service innovation. The Company's advanced nationwide 4G LTE network delivers outstanding wireless experiences to more than 65.5 million customers who are unwilling to compromise on quality and value. Based in Bellevue, Washington, T- Mobile US provides services through its subsidiaries and operates its flagship brands, T-Mobile and MetroPCS. For more information, please visit or join the conversation on Twitter using $TMUS. Q Earnings Call, Livestream and Webcast Access Information Access via Phone (audio only): Date: Tuesday, April 26, 2016 Time: 8:00 a.m. (EDT) Call-in Numbers: International: Participant Passcode: Please plan on accessing the earnings call ten minutes prior to the scheduled start time. Access via Social Media: Embedded livestream on Twitter Submit Questions via Text or Twitter: Text: Send a text message to , enter the keyword TMUS followed by a space Twitter: Send a tweet using $TMUS Access via Webcast: The earnings call will be broadcast live via the Company's Investor Relations website at A replay of the earnings call will be available for two weeks starting shortly after the call concludes and can be accessed by dialing (toll free) or (international). The passcode required to listen to the replay is To automatically receive T-Mobile financial news by , please visit the T-Mobile Investor Relations website, and subscribe to Alerts. Forward-Looking Statements This news release includes "forward-looking statements" within the meaning of the U.S. federal securities laws. Any statements made herein that are not statements of historical fact, including statements about T-Mobile US, Inc.'s plans, outlook, beliefs, opinions, projections, guidance, strategy, expected network modernization and other advancements, are forward-looking statements. Generally, forward-looking statements may be identified by words such as "anticipate," "expect," "suggests," "plan," project, "believe," "intend," "estimates," "targets," "views," "may," "will," "forecast," and other similar expressions. The forward-looking statements speak only as of the date made, are based on current assumptions and expectations, and involve a number of risks and uncertainties. Important factors that could affect future results and cause those results to differ materially from those expressed in the forward-looking statements include, among others, the following: our ability to compete in the highly competitive U.S. wireless telecommunications industry; adverse conditions in the U.S. and international economies and markets; significant capital commitments and the capital expenditures required to effect our business plan; our ability to adapt to future changes in technology, enhance existing offerings, and introduce new offerings to address customers' changing demands; changes in legal and regulatory requirements, including any change or increase in restrictions on our ability to operate our network; our ability to successfully maintain and improve our network, and the possibility of incurring additional costs in doing so; major equipment failures; severe weather conditions or other force majeure events; and other risks described in our filings with the Securities and Exchange Commission, including those described in our most recently filed Annual Report on Form 10-K. You should not place undue reliance on these forward-looking statements. We do not undertake to update forward-looking statements, whether as a result of new information, future events or otherwise, except as required by law. T-Mobile US, Inc SE 38th Street Bellevue, Washington Phone Internet 4
8 Press Contact: Investor Relations Contact: Media Relations Nils Paellmann T-Mobile US, Inc. T-Mobile US, Inc TMUS or T-Mobile US, Inc SE 38th Street Bellevue, Washington Phone Internet 5
9 T-Mobile US, Inc. Reconciliation of Non-GAAP Financial Measures to GAAP Financial Measures (Unaudited) This Press Release includes non-gaap financial measures. The non-gaap financial measures should be considered in addition to, but not as a substitute for, the information provided in accordance with GAAP. Reconciliations for the non-gaap financial measures to the most directly comparable GAAP financial measures are provided below. As T-Mobile does not or cannot predict or forecast certain of the expenses which are excluded from Adjusted EBITDA, but which would be required for the presentation of projected net income, T-Mobile does not provide projected net income or reconciliations to GAAP in the forward-looking financial measures. Adjusted EBITDA is reconciled to net income (loss) as follows: (in millions) Q Q Q Q Q Net income (loss) $ (63) $ 361 $ 138 $ 297 $ 479 Adjustments: Interest expense Interest expense to affiliates Interest income (112) (114) (109) (85) (68) Other expense (income), net 8 (1) Income tax expense (benefit) (41) Operating income ,103 Depreciation and amortization 1,087 1,075 1,157 1,369 1,552 Cost of MetroPCS business combination Stock-based compensation (1) Other, net Adjusted EBITDA $ 1,388 $ 1,817 $ 1,908 $ 2,280 $ 2,749 (1) Stock-based compensation includes payroll tax impacts and may not agree to stock based compensation expense in the condensed consolidated financial statements. Adjusted EBITDA - Earnings before interest expense (net of interest income), tax, depreciation, amortization, stock-based compensation and expenses not reflective of T-Mobile's ongoing operating performance. Adjusted EBITDA margin represents Adjusted EBITDA divided by service revenues. Adjusted EBITDA is a non-gaap financial measure utilized by T-Mobile's management to monitor the financial performance of its operations. T-Mobile uses Adjusted EBITDA internally as a metric to evaluate and compensate its personnel and management for their performance, and as a benchmark to evaluate T-Mobile's operating performance in comparison to its competitors. Management believes analysts and investors use Adjusted EBITDA as a supplemental measure to evaluate overall operating performance and facilitate comparisons with other wireless communications companies because it is more indicative of T-Mobile's ongoing performance and trends by excluding certain expenses which are either nonrecurring or may not be indicative of T-Mobile's directly controllable operating results. Adjusted EBITDA has limitations as an analytical tool and should not be considered in isolation or as a substitute for income from operations, net income, or any other measure of financial performance reported in accordance with GAAP. T-Mobile US, Inc SE 38th Street Bellevue, Washington Phone Internet 6
10 T-Mobile US, Inc. Reconciliation of Non-GAAP Financial Measures to GAAP Financial Measures (continued) (Unaudited) The following tables illustrate the calculation of ARPU and ABPU and reconcile these measures to the related service revenues, which we consider to be the most directly comparable GAAP financial measure to ARPU and ABPU: (in millions, except average number of customers, ARPU and ABPU) Q Q Q Q Q Calculation of Branded Postpaid Phone ARPU Branded postpaid service revenues $ 3,774 $ 4,075 $ 4,197 $ 4,337 $ 4,302 Less: Branded postpaid mobile broadband revenues (109) (135) (165) (179) (182) Branded postpaid phone service revenues $ 3,665 $ 3,940 $ 4,032 $ 4,158 $ 4,120 Divided by: Average number of branded postpaid phone customers (in thousands) and number of months in period 26,313 27,250 28,003 28,849 29,720 Branded postpaid phone ARPU $ $ $ $ $ Calculation of Branded Postpaid ABPU Branded postpaid service revenues $ 3,774 $ 4,075 $ 4,197 $ 4,337 $ 4,302 EIP billings 1,292 1,393 1,409 1,400 1,324 Lease revenues Total billings for branded postpaid customers $ 5,066 $ 5,468 $ 5,636 $ 5,931 $ 5,968 Divided by: Average number of branded postpaid customers (in thousands) and number of months in period 27,717 28,797 29,838 31,013 32,140 Branded postpaid ABPU $ $ $ $ $ Calculation of Branded Prepaid ARPU Branded prepaid service revenues $ 1,842 $ 1,861 $ 1,894 $ 1,956 $ 2,025 Divided by: Average number of branded prepaid customers (in thousands) and number of months in period 16,238 16,396 16,853 17,330 17,962 Branded prepaid ARPU $ $ $ $ $ Average Revenue Per User (ARPU) - Average monthly service revenue earned from customers. Service revenues for the specified period divided by the average customers during the period, further divided by the number of months in the period. Branded postpaid phone ARPU excludes mobile broadband customers and related revenues. Average Billings per User (ABPU) - Average monthly branded postpaid service revenue earned from customers plus monthly EIP billings and lease revenues divided by the average branded postpaid customers during the period, further divided by the number of months in the period. T-Mobile believes branded postpaid ABPU is indicative of estimated cash collections, including device financing payments, from T-Mobile's customers each month. T-Mobile US, Inc SE 38th Street Bellevue, Washington Phone Internet 7
11 T-Mobile US, Inc. Reconciliation of Non-GAAP Financial Measures to GAAP Financial Measures (continued) (Unaudited) Net debt (excluding Tower Obligations) to last twelve months adjusted EBITDA ratio is calculated as follows: (in millions, except net debt ratio) Short-term debt $ 467 $ 386 $ 114 $ 182 $ 365 Long-term debt to affiliates 5,600 5,600 5,600 5,600 5,600 Long-term debt (1) 16,248 16,373 16,430 20,461 20,505 Less: Cash and cash equivalents (3,032) (2,642) (2,633) (4,582) (3,647) Less: Short-term investments (2,998) (2,925) Net debt - Short-term debt, long-term debt to affiliates, and long-term debt (excluding tower obligations), less cash and cash equivalents and short-term investments. Free cash flow and adjusted free cash flow are calculated as follows: Mar 31, 2015 Free Cash Flow - Net cash provided by operating activities less cash capital expenditures for property and equipment. Free Cash Flow is utilized by T-Mobile's management, investors, and analysts to evaluate cash available to pay debt and provide further investment in the business. Jun 30, 2015 Sep 30, 2015 Dec 31, 2015 Mar 31, 2016 Net Debt (excluding Tower Obligations) $ 19,283 $ 19,717 $ 19,511 $ 18,663 $ 19,898 Divided by: Last twelve months Adjusted EBITDA $ 5,936 $ 6,302 $ 6,864 $ 7,393 $ 8,754 Net Debt (excluding Tower Obligations) to Last Twelve Months Adjusted EBITDA Ratio (1) Long-term debt as of March 31, 2015 through December 31, 2015 has been restated for the adoption of Accounting Standards Update , Simplifying the Presentation of Debt Issuance Costs in the first quarter of The impact to the Net Debt (excluding Tower Obligations) to Last Twelve Months Adjusted EBITDA Ratio was not significant. (in millions) Q Q Q Q Q Net cash provided by operating activities $ 489 $ 1,161 $ 1,531 $ 2,233 $ 1,025 Cash purchases of property and equipment (982) (1,191) (1,120) (1,431) (1,335) Free Cash Flow (493) (30) (310) MetroPCS CDMA network decommissioning payments Adjusted Free Cash Flow $ (422) $ 73 $ 487 $ 897 $ (247) Adjusted Free Cash Flow - Free Cash Flow excluding decommissioning payments related to the shutdown of the CDMA portion of the MetroPCS network. T-Mobile US, Inc SE 38th Street Bellevue, Washington Phone Internet (Back To Top) 8 Section 3: EX-99.2 (TMUS EXHIBIT 99.2) EXHIBIT 99.2

12 1
13 2


14 CUSTOMER METRICS Branded Postpaid Customers Branded postpaid net customer additions were 1,041,000 in the first quarter of 2016 compared to 1,292,000 in the fourth quarter of 2015 and 1,125,000 in the first quarter of This marked the seventh consecutive quarter in which branded postpaid net customer additions were greater than one million, a clear indicator of the continued success of the Un-carrier initiatives and strong uptake of promotions for services and devices. For the 9th consecutive quarter, T-Mobile expects to lead the industry in branded postpaid phone net customer additions with 877,000 in the first quarter of 2016, compared to 917,000 in the fourth quarter of 2015 and 991,000 in the first quarter of Furthermore, T-Mobile expects to capture all of the industry s postpaid phone growth in the first quarter of Branded postpaid phone gross additions in the first quarter of 2016 decreased by 6% on a sequential basis, but were up 2% year-over-year. Branded postpaid mobile broadband net customer additions were 164,000 in the first quarter of 2016, compared to 375,000 in the fourth quarter of 2015 and 134,000 in the first quarter of Branded postpaid phone churn was 1.33% in the first quarter of 2016, down 13 basis points from 1.46% in the fourth quarter of 2015 and up 3 basis points from 1.30% in the first quarter of The sequential decline in churn was primarily due to seasonal factors. The slight increase in year-over-year churn was primarily due to ongoing competitive activity. Branded Prepaid Customers Branded prepaid net customer additions were a record 807,000 in the first quarter of 2016, compared to 469,000 in the fourth quarter of 2015 and 73,000 in the first quarter of This was the best quarterly performance in branded prepaid net customer additions since combining with MetroPCS in the second quarter of The strong performance in the first quarter of 2016 was primarily driven by successful MetroPCS promotional activities during the tax refund season and continued growth in expansion markets. Migrations to branded postpaid plans reduced branded prepaid net customer additions in the first quarter of 2016 by approximately 200,000, down from 210,000 in the fourth quarter of 2015 and up from 195,000 in the first quarter of Branded prepaid churn was 3.84% in the first quarter of 2016, compared to 4.20% in the fourth quarter of 2015 and 4.62% in the first quarter of


15 Total Branded Customers Total branded net customer additions were 1,848,000 in the first quarter of 2016 compared to 1,761,000 in the fourth quarter of 2015 and 1,198,000 in the first quarter of This was the ninth consecutive quarter in which branded net customer additions surpassed the one million milestone. Driven by record prepaid growth, total branded gross additions in the first quarter of 2016 increased by 14% year-over-year and were down 1% sequentially. Wholesale Customers Wholesale net customer additions were 373,000 in the first quarter of 2016 compared to 301,000 in the fourth quarter of 2015 and 620,000 in the first quarter of

16 Total Customers Total net customer additions were 2,221,000 in the first quarter of 2016 compared to 2,062,000 in the fourth quarter of 2015 and 1,818,000 in the first quarter of This was the twelfth consecutive quarter in which total net customer additions exceeded one million. It was also the sixth time in the past seven quarters in which total net customer additions exceeded two million. T-Mobile ended the first quarter of 2016 with more than 65.5 million total customers, up 52% on a pro forma combined basis from the end of the first quarter of 2013, when T-Mobile launched the first Un-carrier initiative. NETWORK Network Modernization Update T-Mobile s 4G LTE network now covers 308 million people, which includes partner LTE coverage of 2 million people. This is up from 305 million at the fourth quarter of 2015 earnings and 275 million at the end of the first quarter of Wideband LTE, which refers to markets that have bandwidth of at least MHz dedicated to 4G LTE, is now available nationwide, covering 214 million people. Voice over LTE ( VoLTE ) comprised 51% of total voice call minutes in the first quarter of 2016 compared to 9% in the first quarter of Moving voice traffic to VoLTE frees up capacity and allows for an accelerated re-farming of spectrum currently used for 2G and 3G. T-Mobile is leading the US wireless industry in terms of VoLTE migration. Network Speed T-Mobile continues to have the fastest nationwide 4G LTE network in the U.S. based on download speeds from millions of usergenerated tests. This is the ninth consecutive quarter that T-Mobile has led the industry in average download speeds. In the first quarter of 2016, T-Mobile s average 4G LTE download speed was 22.0 Mbps compared to Verizon at 20.9 Mbps, AT&T at 19.4 Mbps, and Sprint at 15.4 Mbps. 5


17 Spectrum At the end of the first quarter of 2016, T-Mobile owned an average of 85 MHz of spectrum across the top 25 markets in the U.S. The spectrum is comprised of an average of 11 MHz in the 700 MHz band, 30 MHz in the 1900 MHz PCS band, and 44 MHz in the AWS band. During the first quarter of 2016, T-Mobile acquired 700 MHz A-Block spectrum licenses covering 20 million POPs for $0.6 billion in cash. These acquisitions increased T-Mobile s low-band spectrum holdings from 190 million POPs to 210 million POPs and included the cities of San Diego, Phoenix, Las Vegas, and New Orleans. During the first quarter of 2016, T-Mobile entered into agreements with multiple parties to acquire 700 MHz A-Block spectrum licenses covering approximately 48 million POPs for $0.7 billion. These agreements will increase T-Mobile s low-band spectrum holdings from 210 million POPs to 258 million POPs upon closing and include the cities of Nashville, Salt Lake City, Columbus, and Jacksonville. In September 2015, T-Mobile entered into a spectrum license swap agreement with AT&T Inc. Upon closing of the transaction in March 2016, T-Mobile recorded the spectrum licenses received at their estimated fair value of $1.2 billion and recognized a gain of $636 million. The Company has filed to participate in the broadcast incentive auction. 6
18 A-Block Update T-Mobile owns or has agreements to acquire 700 MHz A-Block spectrum covering 258 million people or approximately 80% of the U.S. population. The spectrum covers 9 of the top 10 market areas and 28 of the top 30 market areas in the U.S. T-Mobile has deployed its 700 MHz A-Block spectrum in over 340 market areas covering 194 million people under the brand name Extended Range LTE. Extended Range LTE travels up to twice as far as mid-band spectrum and works up to four times better in buildings. New market launches in the first quarter of 2016 included the cities of Boston and Reno. The Company expects to continue to aggressively roll-out new 700 MHz sites in 2016 including the cities of San Francisco, Phoenix, San Diego, and Las Vegas. METROPCS On July 1, 2015, T-Mobile officially completed the shutdown of the MetroPCS CDMA network. Total decommissioning costs for CDMA network shutdowns were $36 million in the first quarter of 2016, compared to $21 million in the fourth quarter of 2015 and $128 million in the first quarter of Network decommissioning costs primarily relate to the acceleration of lease costs for decommissioned cell sites and are excluded from Adjusted EBITDA. The Company does not expect to incur significant additional network decommissioning costs in 2016 as cell site assets are removed. UN-CARRIER INITIATIVES At the end of the first quarter of 2016, 94% of the branded postpaid customer base was on a Simple Choice plan, flat compared to the fourth quarter of 2015 and up from 92% at the end of the first quarter of At the end of the first quarter of 2016, 13.7 million customers were enrolled in T-Mobile's JUMP! programs, up from 13.3 million at the end of the fourth quarter of 2015 and 10.3 million at the end of the first quarter of


19 Un-carrier Updates Binge On Expanded: On March 17, 2016, T-Mobile expanded its popular video initiative to include even more services that can stream without using up customers high-speed data allotment on qualifying Simple Choice plans. More than 60 video services now qualify including YouTube, Google Play Movies, and Discovery GO, in addition to initial program participants like Netflix, Hulu and HBO GO. This is up from 24 video services at the launch of Binge On in November DEVICES Total devices sold or leased were 9.4 million units in the first quarter of 2016 compared to 10.8 million units in the fourth quarter of 2015 and 8.8 million units in the first quarter of Total smartphones sold or leased were 8.8 million units in the first quarter of 2016 compared to 10.0 million units in the fourth quarter of 2015 and 8.0 million units in the first quarter of The upgrade rate for branded postpaid customers was approximately 7% in the first quarter of 2016 compared to approximately 10% in the fourth quarter of 2015 and approximately 8% in the first quarter of

20 DEVICE FINANCING Equipment Installment Plans (EIP) T-Mobile financed $1.246 billion of equipment sales on EIP in the first quarter of 2016, up 34.6% from $926 million in the fourth quarter of 2015 and down 16.0% from $1.483 billion in the first quarter of The sequential increase was primarily due to the previously announced mix shift back to the EIP program in the first quarter of The year-over-year decrease was primarily due to a higher level of leased devices since the launch of the JUMP! On Demand program at the end of the second quarter of 2015 and a lower upgrade rate for branded postpaid customers, partially offset by the mix shift back to the EIP program in the first quarter of Customers on Simple Choice plans had associated EIP billings of $1.324 billion in the first quarter of 2016, down 5.4% compared to $1.400 billion in the fourth quarter of 2015 and up 2.5% from $1.292 billion in the first quarter of The sequential decrease was primarily due to a lower level of devices financed using EIP plans since the launch of the JUMP! On Demand program at the end of the second quarter of 2015 and a lower upgrade rate for branded postpaid customers in the first quarter of Total EIP receivables, net of imputed discount and allowances for credit losses, were $3.053 billion at the end of the first quarter of 2016 compared to $3.225 billion at the end of the fourth quarter of 2015 and $4.842 billion at the end of the first quarter of The sequential decline in the total EIP receivables, net was due to the amount of EIP billings more than offsetting the equipment sales financed on EIP in the first quarter of The year-over-year decline in the total EIP receivables, net was primarily due to sales of certain EIP receivables and a higher level of leased devices since the launch of the JUMP! On Demand program at the end of the second quarter of
21 Leasing Plans Leased devices transferred from inventory to property and equipment, net was $653 million in the first quarter of 2016 compared to $1.463 billion in the fourth quarter of The sequential decline was primarily due to the mix shift back to the EIP program in the first quarter of Depreciation expense associated with leased devices was $403 million in the first quarter of 2016 compared to $254 million in the fourth quarter of Leased devices included in property and equipment, net were $2.223 billion at the end of the first quarter of 2016 compared to $1.973 billion at the end of the fourth quarter of Lease revenues were $342 million in the first quarter of 2016 compared to $194 million in the fourth quarter of Original consideration received and lease revenues, net were $377 million in the first quarter of 2016, up from $293 million in the fourth quarter of Original consideration represents cash down payments received from customers at operating lease inception, which is amortized over the term of the lease. Lease revenues, net exclude amortization of the original consideration. The difference between the original consideration received and lease revenues, net, and the amount of leased devices transferred from inventory to property and equipment, net of returns approximates the working capital impact of leasing. Future minimum lease payments expected to be received over the applicable lease terms were $1.425 billion at the end of the first quarter of 2016, up from $1.260 billion at the end of the fourth quarter of Future minimum lease payments exclude optional residual buy-out amounts at the end of the applicable lease terms. 10


22 CUSTOMER QUALITY Total bad debt expense and losses from sales of receivables was $173 million in the first quarter of 2016 compared to $228 million in the fourth quarter of 2015 and $169 million in the first quarter of The sequential decrease was principally due to lower bad debt expense from seasonality, a reduced impact from lower credit quality customers added during the 2015 tax season which caused an increase in bad debt expense during the third and fourth quarter of 2015 and the implementation of credit policies during the first quarter of 2016 to limit exposure to sub-prime receivables. Year-over-year, the modest increase was primarily due to higher bad debt expense resulting from growth in the customer base. As a percentage of total revenues, total bad debt expense and losses from sales of receivables declined to 2.01% in the first quarter of 2016 from 2.76% in the fourth quarter of 2015 and 2.17% in the first quarter of EIP receivables classified as Prime were 47% of total EIP receivables at the end of the first quarter of 2016, down from 48% at the end of the fourth quarter of 2015 and 52% at the end of the first quarter of The year-over-year decline in EIP receivables classified as Prime was primarily due to the sale of certain EIP receivables pursuant to a securitization agreement, which commenced in the fourth quarter of Including the EIP receivables sold, the total EIP receivables classified as Prime remained at 52% at the end of the first quarter of 2016 and the fourth quarter of
23 REVENUE METRICS Branded Postpaid Phone ARPU Branded postpaid phone ARPU was $46.21 in the first quarter of 2016, down 3.8% from $48.05 in the fourth quarter of 2015 and down 0.5% from $46.43 in the first quarter of As noted in connection with the fourth quarter of 2015 earnings, branded postpaid phone ARPU was impacted by the non-cash net revenue deferral for Data Stash. Excluding the impact of Data Stash, branded postpaid phone ARPU in the first quarter of 2016 increased by 0.3% sequentially and declined by 0.2% year-over-year. Branded postpaid phone ARPU was generally stable as continued strategic focus on family plan penetration and promotional activity was offset by higher data attach rates, the impact of price increases implemented in November 2015 and higher regulatory program revenues. Branded Postpaid ABPU Branded postpaid ABPU was $61.90 in the first quarter of 2016, down 2.9% from $63.74 in the fourth quarter of 2015 and up 1.6% from $60.94 in the first quarter of Branded postpaid ABPU was impacted by the non-cash net revenue deferral for Data Stash. Excluding the impact of Data Stash, branded postpaid ABPU in the first quarter of 2016 increased by 0.2% sequentially and by 1.7% year-over-year. Sequentially and year-over-year, the slight increase in branded postpaid ABPU was primarily due to stability in branded postpaid phone ARPU and growth in total lease revenues and EIP billings on a per user basis. 12

24 Branded Postpaid Customers per Account Branded postpaid customers per account was 2.59 at the end of the first quarter of 2016, compared to 2.54 at the end of the fourth quarter of 2015 and 2.39 at the end of the first quarter of The sequential and year-over-year increase was primarily due to service promotions targeting families and increased penetration of mobile broadband devices. Branded Prepaid ARPU Branded prepaid ARPU was $37.58 in the first quarter of 2016, essentially flat compared to $37.63 in the fourth quarter of 2015 and $37.81 in the first quarter of Sequentially and year-over-year, the slight declines were primarily due to dilution from growth of customers on rate plan promotions. REVENUES Service Revenues T-Mobile expects to once again lead the industry in year-over-year service revenue growth in the first quarter of This marks the eighth consecutive quarter that T-Mobile has led the industry in year-over-year service revenue growth. Service revenues were $6.578 billion in the first quarter of 2016, up 0.3% from $6.556 billion in the fourth quarter of 2015 and up 13.0% from $5.819 billion in the first quarter of Sequentially, the slight increase in service revenues was primarily due to growth in the Company s customer base from the continued success of T-Mobile s Un-carrier initiatives and the Company s prepaid brands as well as strong customer response to promotional activities targeting families, partially offset by the non-cash net revenue deferral from Data Stash which totaled $138 million in the first quarter of

25 Year-over-year, the increase in service revenues was primarily due to growth in the Company s customer base from the continued success of T-Mobile s Un-carrier initiatives and the Company's prepaid brands as well as strong customer response to promotional activities. Equipment Revenues Equipment revenues were $1.851 billion in the first quarter of 2016, up 20.5% from $1.536 billion in the fourth quarter of 2015 and flat compared to $1.851 billion in the first quarter of Sequentially, the increase in equipment revenues was primarily due to the previously announced mix shift back to the EIP program during the first quarter of 2016, which resulted in an increase in average revenue per device sold, and an increase in lease revenues. Under the EIP program, equipment revenues associated with device sales are recognized when the device is delivered to the customer rather than over the term of a lease, resulting in higher equipment revenues for the quarter. Year-over-year, stable equipment revenues was primarily due to an increase in lease revenues offset by a lower average revenue per device sold and a decline in the number of devices sold as customers continue to finance devices utilizing the JUMP! On Demand program introduced at the end of second quarter of
26 Total Revenues T-Mobile expects to once again lead the industry in year-over-year total revenue growth in the first quarter of This marks the eleventh time in the past twelve quarters that T-Mobile has led the industry in year-over-year total revenue growth. Total revenues were $8.599 billion in the first quarter of 2016, up 4.3% from $8.247 billion in the fourth quarter of 2015 and up 10.6% from $7.778 billion in the first quarter of Sequentially, the increase in total revenues was primarily due to higher equipment revenues from the mix shift back to the EIP program and an increase in lease revenues. Year-over-year, the increase in total revenues was primarily due to higher service revenues from growth in the customer base. OPERATING EXPENSES Cost of Services Cost of services was $1.421 billion in the first quarter of 2016, up 2.7% from $1.384 billion in the fourth quarter of 2015 and up 1.9% from $1.395 billion in the first quarter of Sequentially, the increase in cost of services was primarily due to expenses associated with network expansion and 700 MHz A-Block build-out as well as an increase in regulatory program costs. Year-over-year, the increase in cost of services was primarily due to expenses associated with network expansion and 700 MHz A- Block build-out, and higher lease expense, partially offset by network synergies realized from the decommissioning of the MetroPCS CDMA network. 15
27 Cost of Equipment Sales Cost of equipment sales was $2.374 billion in the first quarter of 2016, up 17.6% from $2.019 billion in the fourth quarter of 2015 and down 11.4% from $2.679 billion in the first quarter of Sequentially, the increase in cost of equipment sales was primarily due to the mix shift back to the EIP program during the first quarter of 2016, which resulted in an increase in the average cost per device sold. Under the EIP program, the cost of a device is recognized as cost of equipment sales at the time the device is delivered to the customer rather recognized as depreciation expense over the term of the lease, resulting in higher cost of equipment sales for the quarter. Year-over-year, the decrease was primarily due to lower average cost per device sold and a decline in the number of devices sold as customers continue to finance devices utilizing the JUMP! On Demand program introduced at the end of the second quarter of Selling, General and Admin. (SG&A) Expenses SG&A expenses were $2.749 billion in the first quarter of 2016, flat compared to $2.755 billion in the fourth quarter of 2015 and up 15.9% from $2.372 billion in the first quarter of Sequentially, stable SG&A expenses were primarily due to the continued high volume in total branded gross customer additions and strategic investments to support growing the customer base, partially offset by lower bad debt expense and losses from sales of receivables. Year-over-year, the increase was primarily due to higher total branded gross customer additions in the first quarter of 2016 and strategic investments to support the growing customer base, including increases in employee-related expenses and promotional costs. 16
28 Depreciation and Amortization (D&A) D&A was $1.552 billion in the first quarter of 2016, up 13.4% from $1.369 billion in the fourth quarter of 2015 and up 42.8% from $1.087 billion in the first quarter of The sequential and year-over-year increase was primarily due to the impact of leasing. Under leasing, the cost of the leased device is recognized as depreciation expense over the term of the lease rather than recognized as cost of equipment sales when the device is delivered to the customer. The total number of leased devices was higher both sequentially and year-over-year, resulting in higher depreciation expense. ADJUSTED EBITDA T-Mobile expects to lead the industry in year-over-year Adjusted EBITDA growth in the first quarter of Adjusted EBITDA was $2.749 billion in the first quarter of 2016, up 20.6% from $2.280 billion in the fourth quarter of 2015 and up 98.1% from $1.388 billion in the first quarter of Adjusted EBITDA in the first quarter of 2016 included a pre-tax gain of $636 million from a spectrum license transaction. Excluding the spectrum gains, Adjusted EBITDA declined slightly by 1.3% sequentially and increased by 52.2% year-over-year. Sequentially, the increase in Adjusted EBITDA was primarily due to the spectrum gain. Excluding the spectrum gain, Adjusted EBITDA declined primarily due to the non-cash net impact of Data Stash. Year-over-year, the increase in Adjusted EBITDA was primarily due to the spectrum gain. Excluding the spectrum gain, Adjusted EBITDA increased due to higher service revenues from growth in the customer base, lower losses on equipment, focused cost control and MetroPCS synergies partially offset by higher SG&A expenses due to customer growth and promotional spending. Excluding spectrum gains, the Adjusted EBITDA margin was 32% in the first quarter of 2016 compared to 33% in the fourth quarter of 2015 and 24% in the first quarter of The aggregate impact from leasing and Data Stash on Adjusted EBITDA in the first quarter of 2016 was approximately $204 million. Lease revenues were $342 million and the net impact from Data Stash was $138 million in the first quarter of

29 NET INCOME AND EARNINGS PER SHARE Net income was $479 million in the first quarter of 2016 compared to net income of $297 million in the fourth quarter of 2015 and a net loss of $63 million in the first quarter of Earnings per share was $0.56 in the first quarter of 2016 compared to earnings per share of $0.34 in the fourth quarter of 2015 and a loss per share of $0.09 in the first quarter of The after-tax impact of the spectrum gain on EPS for the first quarter was $0.46. CAPITAL EXPENDITURES Cash capital expenditures for property and equipment were $1.335 billion in the first quarter of 2016 compared to $1.431 billion in the fourth quarter of 2015 and $982 million in the first quarter of The sequential decrease and year-over-year increase was primarily due to the timing of network spend in connection with T-Mobile s build out of its 4G LTE network. 18
30 FREE CASH FLOW Net cash provided by operating activities was $1.025 billion in the first quarter of 2016, compared to $2.233 billion in the fourth quarter of 2015 and $489 million in the first quarter of Free Cash Flow was an outflow of $310 million in the first quarter of 2016, compared to an inflow of $802 million in the fourth quarter of 2015 and an outflow of $493 million in the first quarter of Sequentially, the decrease in free cash flow was primarily due to a decrease in sales of certain EIP receivables and changes in working capital, partially offset by a decrease in cash capital expenditures. Year-over-year, the increase in free cash flow was primarily due to an increase in net cash provided by operating activities, partially offset by an increase in cash capital expenditures. Adjusted Free Cash Flow was an outflow of $247 million in the first quarter of 2016, compared to an inflow $897 million in the fourth quarter of 2015 and an outflow of $422 million in the first quarter of Adjusted Free Cash Flow excludes decommissioning payments related to the one-time shutdown of the CDMA portion of the MetroPCS network. Decommissioning payments in the first quarter of 2016 were $63 million, compared to $95 million in the fourth quarter of 2015 and $71 million in the first quarter of CAPITAL STRUCTURE Net debt, excluding tower obligations, at the end of the first quarter of 2016 was $ billion. Total debt, excluding tower obligations, at the end of the first quarter of 2016 was $ billion and was comprised of shortterm debt of $365 million, long-term debt to affiliates of $5.600 billion, and long-term debt of $ billion. The ratio of net debt, excluding tower obligations, to Adjusted EBITDA for the trailing last twelve month ( LTM ) period was 2.3x at the end of the first quarter of 2016 compared to 2.5x at the end of the fourth quarter of 2015 and 3.2x at the end of the first quarter of The Company s cash position remains strong with $3.647 billion in cash and $2.925 billion in short-term investments, principally U.S. Treasury bills, for a total of $6.572 billion at the end of the first quarter of The cash and short-term investments balance decreased in the first quarter of 2016 compared to the fourth quarter of 2015 primarily due to payments made for the purchase of 700 MHz A-Block spectrum and the outflow in free cash flow. 19

31 In March 2016, T-Mobile and Deutsche Telekom AG ("Deutsche Telekom") entered into a financing arrangement in the form of a note purchase agreement. The arrangement provides a commitment from Deutsche Telekom to purchase $2 billion in high-yield notes from T-Mobile. T-Mobile can request a draw on the purchase commitment at any time on or prior to November 30, The issuance will be $2 billion principal amount of T-Mobile's 5.3% Senior Notes due 2021 at an aggregate price of $2 billion. On April 1, 2016, T-Mobile issued $1.0 billion of public 6% Senior Notes due 2024 in a registered public offering. T-Mobile expects to use the net proceeds from this offering for the purchase of 700 MHz A-Block spectrum and other spectrum purchases. On April 25, 2016, T-Mobile entered into a purchase agreement with Deutsche Telekom, in which T-Mobile has agreed to issue and sell to Deutsche Telekom up to $1.35 billion of 6.000% Senior Notes due 2024 (the % Senior Notes ). Subject to certain limited and customary closing conditions, the issuance and sale of the % Senior Notes is scheduled to occur on a date determined by T-Mobile that may not be later than November 30, The purchase price for the Notes will be determined on the issuance date to reflect the effective yield of 5.14% on T-Mobile s 6.000% Senior Notes due 2024, issued on April 1, 2016, using their average trading price of % as of April 22, The minimum purchase price payable for the % Senior Notes would be % if the % Senior Notes were issued on the latest permissible issue date of November 30, T-Mobile may elect not to issue the % Senior Notes and can terminate the commitment under the purchase agreement at any time on or prior to November 5, 2016, subject to reimbursing Deutsche Telekom for the cost (if any) of its hedging arrangements related to the transaction. T-Mobile may elect to issue less than $1.35 billion aggregate principal balance of the % Senior Notes subject to (i) termination of the purchase commitment for the unused portion and (ii) reimbursing Deutsche Telekom for the cost (if any) of its hedging arrangements on such unused portion. T-Mobile expects to use the net proceeds from this and the $2.0 billion commitment for spectrum acquisitions, or if not used for spectrum purchases, refinancing of existing debt, or general corporate purposes. GUIDANCE T-Mobile expects to drive further customer momentum while delivering strong growth in Adjusted EBITDA and free cash flow in Branded postpaid net customer additions for full-year 2016 are now expected to be between 3.2 and 3.6 million, an increase from the previous guidance range of 2.4 to 3.4 million. For full-year 2016, T-Mobile now expects Adjusted EBITDA to be in the range of $9.7 to $10.2 billion, up from previous guidance of $9.1 to $9.7 billion. This guidance includes the aggregate impact from leasing and Data Stash of approximately $0.7 to $1.0 billion, and the spectrum gain of $0.6 billion recognized in the first quarter of Cash capital expenditures for full-year 2016 are expected to be in the range of $4.5 to $4.8 billion, unchanged from previous guidance.

32 UPCOMING EVENTS (All dates and attendance tentative) 3 rd Annual MoffettNathanson Media and Communications Conference, May 18-19, 2016, New York, NY J.P. Morgan 44th Annual Global Technology, Media and Telecom Conference, May 23-25, 2016, Boston, MA 20
UNITED STATES SECURITIES AND EXCHANGE COMMISSION WASHINGTON, DC FORM 8-K CURRENT REPORT
 TMUS 8-K 2/17/2016 Section 1: 8-K (TMUS FORM 8-K) UNITED STATES SECURITIES AND EXCHANGE COMMISSION WASHINGTON, DC 20549 FORM 8-K CURRENT REPORT Pursuant to Section 13 or 15(d) of the Securities Exchange
T-Mobile US Q4 and Full Year 2013
 T-Mobile US Q4 and Full Year 2013 Disclaimer This presentation contains forward-looking statements within the meaning of the U.S. federal securities laws. For those statements, we claim the protection
UNITED STATES SECURITIES AND EXCHANGE COMMISSION WASHINGTON, DC FORM 8-K CURRENT REPORT
 Section 1: 8-K (TMUS FORM 8-K) UNITED STATES SECURITIES AND EXCHANGE COMMISSION WASHINGTON, DC 20549 FORM 8-K CURRENT REPORT Pursuant to Section 13 or 15(d) of the Securities Exchange Act of 1934 Date
UNITED STATES SECURITIES AND EXCHANGE COMMISSION WASHINGTON, DC FORM 8-K CURRENT REPORT
 TMUS 8-K 4/28/2015 Section 1: 8-K (TMUS FORM 8-K) UNITED STATES SECURITIES AND EXCHANGE COMMISSION WASHINGTON, DC 20549 FORM 8-K CURRENT REPORT Pursuant to Section 13 or 15(d) of the Securities Exchange
UNITED STATES SECURITIES AND EXCHANGE COMMISSION WASHINGTON, DC FORM 8-K CURRENT REPORT
 TMUS 8-K 7/30/2015 Section 1: 8-K (TMUS FORM 8-K) UNITED STATES SECURITIES AND EXCHANGE COMMISSION WASHINGTON, DC 20549 FORM 8-K CURRENT REPORT Pursuant to Section 13 or 15(d) of the Securities Exchange
T-Mobile US, Inc. Investor Factbook
 1 T-Mobile US, Inc. Investor Factbook T-Mobile US Reports Second Quarter 2016 Results 1.9 Million Customer Nets, Record-Low Churn of 1.27%, Net Income of $225 Million, 12% Service Revenue Growth and 36%
UNITED STATES SECURITIES AND EXCHANGE COMMISSION WASHINGTON, DC FORM 8-K
 UNITED STATES SECURITIES AND EXCHANGE COMMISSION WASHINGTON, DC 20549 FORM 8-K CURRENT REPORT Pursuant to Section 13 or 15(d) of the Securities Exchange Act of 1934 Date of report (Date of earliest event
T-Mobile US, Inc. Investor Factbook T-Mobile US Reports First Quarter 2017 Results
 EXHIBIT 99.2 T-Mobile US, Inc. Investor Factbook T-Mobile US Reports First Quarter 2017 Results T-Mobile Celebrates 4 Years as a Public Company with Industry Leading Customer & Financial Growth and Game-Changing
Investor Factbook Q2 2015
 1 Investor Factbook Q2 2015 T-Mobile US, Inc. Investor Factbook T-Mobile US Reports Second Quarter 2015 Results 14% Revenue Growth and 25% Adjusted EBITDA Growth Year-over-Year in Q2 2015 as Customers
Q Earnings Conference Call. November 6, 2018
 Q3 2018 Earnings Conference Call November 6, 2018 Safe Harbor Statement This presentation includes forward-looking statements within the meaning of Section 27A of the Securities Act and Section 21E of
Verizon closes 2017 with strong wireless customer growth and retention, well-positioned in new markets
 News Release FOR IMMEDIATE RELEASE January 23, 2018 Media contact: Bob Varettoni 908.559.6388 robert.a.varettoni@verizon.com Verizon closes 2017 with strong wireless customer growth and retention, well-positioned
Cincinnati Bell Inc. March 4, 2013
 Cincinnati Bell Inc. March 4, 2013 Safe Harbor This presentation and the documents incorporated by reference herein contain forwardlooking statements regarding future events and our future results that
UBS 42 nd Annual Global Media and Communications Conference December 8, Leigh Fox, CFO
 UBS 42 nd Annual Global Media and Communications Conference December 8, 2014 Leigh Fox, CFO Safe Harbor This presentation and the documents incorporated by reference herein contain forward-looking statements
Cincinnati Bell Third Quarter 2011 Results. November 3, 2011
 Cincinnati Bell Third Quarter 2011 Results November 3, 2011 Today s Agenda Performance Highlights Jack Cassidy, President & Chief Executive Officer Review of Wireline, Wireless, IT Services & Hardware
2017 Q4 Earnings Conference Call
 2017 Q4 Earnings Conference Call Forward Looking Statements This presentation includes certain forward-looking statements that are made as of the date hereof and are based upon current expectations, which
Q Earnings Conference Call. August 7, 2018
 Q2 2018 Earnings Conference Call August 7, 2018 Safe Harbor Statement This presentation includes forward-looking statements within the meaning of Section 27A of the Securities Act and Section 21E of the
1Q 2016 Earnings Conference Call. April 29, 2016
 1Q 2016 Earnings Conference Call April 29, 2016 Safe Harbor Statement This presentation includes forward-looking statements within the meaning of Section 27A of the Securities Act and Section 21E of the
4Q 2015 Earnings Conference Call. February 26, 2016
 4Q 2015 Earnings Conference Call February 26, 2016 Safe Harbor Statement This presentation includes forward-looking statements within the meaning of Section 27A of the Securities Act and Section 21E of
4 TH. 4Q13 Earnings Conference Call January 28, AT&T Investor Update
 4Q13 Earnings Conference Call January 28, 2014 AT&T Investor Update 4 TH 2014 AT&T Intellectual Property. All rights reserved. AT&T, the AT&T logo and all other marks contained herein are trademarks of
1Q 2017 Earnings Conference Call. May 4, 2017
 1Q 2017 Earnings Conference Call May 4, 2017 Safe Harbor Statement This presentation includes forward-looking statements within the meaning of Section 27A of the Securities Act and Section 21E of the Securities
Verizon builds on 2Q momentum with strong 3Q results
 News Release FOR IMMEDIATE RELEASE October 19, 2017 Media contact: Bob Varettoni 908.559.6388 robert.a.varettoni@verizon.com Verizon builds on 2Q momentum with strong 3Q results 3Q 2017 highlights 89 cents
3Q 2016 Earnings Conference Call. November 7, 2016
 3Q 2016 Earnings Conference Call November 7, 2016 Safe Harbor Statement This presentation includes forward-looking statements within the meaning of Section 27A of the Securities Act and Section 21E of
MANAGEMENT DISCUSSION AND ANALYSIS THIRD QUARTER 2013 MD&A. Total active subscribers (in thousand) Q212 Q312 Q412 Q113 Q213 Q313
 Q212 Q312 Q412 Q113 Q213 Q313") MD&A Q313 Highlights On 23 July 2013, we successfully launched the new 3G 2.1GHz network, together with our existing 2G and 3G 850MHz networks, enabling us to serve our customers with better customer experience
MD&A Q313 Highlights On 23 July 2013, we successfully launched the new 3G 2.1GHz network, together with our existing 2G and 3G 850MHz networks, enabling us to serve our customers with better customer experience
CFO Commentary on Second Quarter 2016 Financial Results
 CFO Commentary on Second Quarter 2016 Financial Results August 2, 2016 Related Information The commentary in this document can be referenced in the financial information found in the earnings release issued
Cincinnati Bell Second Quarter 2012 Results. August 8, 2012
 Cincinnati Bell Second Quarter 2012 Results August 8, 2012 Today s Agenda Performance Highlights Jack Cassidy, President & Chief Executive Officer Review of Cincinnati Bell Communications Ted Torbeck,
T-MOBILE USA REPORTS THIRD QUARTER 2008 RESULTS
 T-MOBILE USA REPORTS THIRD QUARTER RESULTS $1.53 billion Operating Income Before Depreciation and Amortization ( OIBDA ) in the third quarter of, up 8% from the third quarter of 670,000 net new customers
2Q 2015 Earnings Conference Call. July 31, 2015
 2Q 2015 Earnings Conference Call July 31, 2015 Safe Harbor Statement This presentation includes forward-looking statements within the meaning of Section 27A of the Securities Act and Section 21E of the
MD&A. Operational Summary MANAGEMENT DISCUSSION AND ANALYSIS FIRST QUARTER 2016
 MD&A Executive Summary The competition level in Q116 heightened after the auctions in Q415 with expiration of 900 MHz concession and changes in spectrum holdings among operators. Handset subsidies on prepaid
TeraGo Reports Fourth Quarter and Year End 2018 Results
 TeraGo Reports Fourth Quarter and Year End Results Toronto February 21, 2019 TeraGo Inc. ( TeraGo or the Company ) (TSX: TGO, www.terago.ca), today announced financial and operating results for the fourth
T-MOBILE INTERNATIONAL REPORTS DETAILED FULL YEAR 2001 AND FOURTH QUARTER 2001 RESULTS OF VOICESTREAM
 Bonn/Bellevue, March 4, 2002 T-MOBILE INTERNATIONAL REPORTS DETAILED FULL YEAR 2001 AND FOURTH QUARTER 2001 RESULTS OF VOICESTREAM Subscriber base of U.S. operations reaches nearly 7 million 583,000 net
1Q 2015 Earnings Conference Call. May 4, 2015
 1Q 2015 Earnings Conference Call May 4, 2015 Safe Harbor Statement This presentation includes forward-looking statements within the meaning of Section 27A of the Securities Act and Section 21E of the Securities
2nd Quarter 2017 Earnings Results
 2nd Quarter 2017 Earnings Results August 2, 2017 Forward-Looking Statements Except for historical and factual information, the matters set forth in this presentation and other of our oral or written statements
Fourth Quarter 2012 Financial Summary. Quarter Ended
 Reports Fourth Quarter Financial Results Successful Execution of Challenger Strategy Leads to Improved Customer Development and Reduced Churn BELLEVUE, Wash. February 28, 2013, Inc. ( T-Mobile ) today
Comcast Full Year and Fourth Quarter Results Meet or Exceed All Operating and Financial Targets Setting Stage For Continued Growth in 2004
 Comcast Full Year and Fourth Quarter Results Meet or Exceed All Operating and Financial Targets Setting Stage For Continued Growth in 2004 Comcast Cable Delivers $6.35 Billion of Operating Cash Flow in
MANAGEMENT DISCUSSION AND ANALYSIS SECOND QUARTER 2013 MD&A
 MD&A Q213 Highlights In Q213, total revenues developed healthily at 13.5% YoY and 2.7% QoQ on the back of strong service revenues and handset sales. Service revenues, rising 10.7% YoY and 1.2% QoQ, was
QUALCOMM Reports First Quarter Results Revenues $941 Million, $.65 EPS
 Contact: Julie Cunningham Vice President, Investor Relations Ph 619-658-4224 Fax 619-651-9303 E-mail: juliec@qualcomm.com QUALCOMM Reports First Quarter Results Revenues $941 Million, $.65 EPS SAN DIEGO
dtac third quarter 2015
 dtac third quarter 2015 19 Oct 2015 Investor Relations E: ir@dtac.co.th T: +662 202 8882 key highlights 21.9m DTN subs 88% of sub base THB7.8b data revenues 47% of service revenues ex. IC THB7.1b EBITDA
The Reed Report. Company Spotlight T-Mobile 3/1/2017
 The Reed Report Company Spotlight T-Mobile 3/1/2017 Business Overview T-Mobile (Ticker: TMUS) T-Mobile provides wireless communications services, including voice, messaging and data, to more than 71 million
MD&A. Executive Summary. Operational Summary MANAGEMENT DISCUSSION AND ANALYSIS SECOND QUARTER 2016
 MD&A Executive Summary In Q216, postpaid segment continued to do well amid intense competition, adding another 191k subs during the quarter on the back of improving network, popular digital services, and
MANAGEMENT DISCUSSION AND ANALYSIS FY 2012 MD&A
 MD&A Executive Summary Solid Results with Strong Net Additional Subscribers dtac 2012 results were strong both financially and operationally. Our total revenues grew healthily to THB 89.5 billion, increasing
SBC Investor Update. Merrill Lynch Global Communications Investor Conference March 16, 2004
 SBC Investor Update Merrill Lynch Global Communications Investor Conference March 16, 2004 Randall Stephenson Senior Executive Vice President and Chief Financial Officer Cautionary Language Concerning
First Quarter 2018 Earnings Presentation. May 8, 2018
 First Quarter 2018 Earnings Presentation May 8, 2018 1 Safe Harbor Caution Concerning Forward-Looking Statements Various remarks that the Company makes contain forward-looking statements regarding acquisitions,
Cincinnati Bell. Morgan Stanley Technology, Media, and Telecommunications Conference February 28, 2012
 Cincinnati Bell Morgan Stanley Technology, Media, and Telecommunications Conference February 28, 2012 Safe Harbor This presentation and the documents incorporated by reference herein contain forwardlooking
92% Industry-leading 4G LTE population coverage with consistent 4G download speeds
 Solid financial performance in a challenging environment; with key differentiating factors of delivering unmatched customer experience and superior network quality fuelling growth. Financial Review We
Vodafone K.K. FY04 interim results Period ended 30 September 2004
 Vodafone K.K. FY04 interim results Period ended 30 September 2004 16 Nov 2004 Presented by: J. Brian Clark Representative Executive Officer, President & CEO John Durkin Representative Executive Officer,
MANAGEMENT DISCUSSION AND ANALYSIS FIRST QUARTER 2013 MD&A
 MD&A Q113 Highlights In Q113, dtac achieved another great quarter with service revenues growing healthily 9.1% YoY and 2.6% QoQ, mainly contributed by strong data revenue growth partly offset by voice
Fourth Quarter and Full Year 2018 Earnings Presentation. February 21, 2019
 Fourth Quarter and Full Year 2018 Earnings Presentation February 21, 2019 1 Safe Harbor Caution Concerning Forward-Looking Statements Various remarks that the Company makes contain forward-looking statements
This presentation and the documents incorporated by reference herein contain forward-looking statements regarding future events and our future
 This presentation and the documents incorporated by reference herein contain forward-looking statements regarding future events and our future results that are subject to the safe harbor provisions of
DNA Plc January-March 2018 Interim Report
 DNA Plc January-March 2018 Interim Report 19 April, 2018 Jukka Leinonen, CEO Timo Karppinen, CFO Forward looking statement This presentation contains, or may be deemed to contain, statements that are not
dtac second quarter July 2016 Investor Relations E: T:
 dtac second quarter 2016 12 July 2016 Investor Relations E: ir@dtac.co.th T: +662 202 8882 Q216 highlights 25.0m total subscribers 92.3% of sub base registered under DTN THB8.7b data revenues 54.2% of
T-MOBILE USA REPORTS SECOND QUARTER 2009 RESULTS
 T-MOBILE USA REPORTS SECOND QUARTER RESULTS $1.6 billion Operating Income Before Depreciation and Amortization ( OIBDA ) in the second quarter of, up 16% from the first quarter of and up 1% from the second
TeraGo Reports 2018 Third Quarter Financial Results
 TeraGo Reports Third Quarter Financial Results Toronto November 7, TeraGo Inc. ( TeraGo or the Company ) (TSX: TGO, www.terago.ca), today announced financial and operating results for the quarter ended,.
CenturyLink. 1 st Quarter 2012 Earnings Conference Call May 9, 2012
 CenturyLink 1 st Quarter 2012 Earnings Conference Call May 9, 2012 Forward-Looking Statements / Non-GAAP Financial Measures Certain non-historical statements made in this presentation and future oral or
Vonage Digital Phone Service 2010 Annual Report
 Vonage Digital Phone Service 2010 Annual Report 1 Our Mission Contents 2010 was a year of accomplishment. The dramatic improvement in our performance is a direct result of the focused efforts of our dedicated
RESULTS FY Message from Management. October 25, 2017
 RESULTS Q2 FY 2017 Message from Management October 25, 2017 Marcelo Claure President, Chief Executive Officer 2Q Highlights Our thoughts and prayers are with those impacted by the recent hurricanes. While
Conference call October 26, :00 / Helsinki 08:00 / New York 1 Nokia 2016 Q3 2017
 Conference call October 26, 2017 15:00 / Helsinki 08:00 / New York 1 Nokia 2016 Q3 2017 Disclaimer It should be noted that Nokia and its business are exposed to various risks and uncertainties, and certain
second quarter July 2014 Investor Relations E: T:
 second quarter 2014 18 July 2014 key highlights 28m total subscribers 68% ported to DTN 37% smartphone penetration 39% data revenue growth >80% 2.1GHz pop coverage 36.4% EBITDA margin THB 1.58 per share
MD&A. Growing Subscribers with Slightly Decreasing ARPU CONTENTS
 MANAGEMENT DISCUSSION AND ANALYSIS F Y 2011 MD&A CONTENTS I EXECUTIVE SUMMARY 2011 was a significant year for dtac as we began our entire network upgrade and our 3G HSPA on 850 MHz launch which was our
Verizon Reports Revenue Growth and Continued Improvement in Cash Flow in 2Q
 Verizon Reports Revenue Growth and Continued Improvement in Cash Flow in 2Q Consumer Sales Remain Strong as Verizon Adds High Volumes of New FiOS TV and Internet Customers, and More Than 1.1 Million Wireless
T-MOBILE USA CONTINUES TO INVEST IN NETWORK QUALITY AND REPORTS SECOND QUARTER 2008 RESULTS
 T-MOBILE USA CONTINUES TO INVEST IN NETWORK QUALITY AND REPORTS SECOND QUARTER RESULTS $1.58 billion Operating Income Before Depreciation and Amortization ( OIBDA ) in the second quarter of, up 14% from
1st Quarter Earnings. AT&T Investor Update. April 25, 2018
 1st Quarter Earnings AT&T Investor Update April 25, 2018 Cautionary Language Concerning Forward-Looking Statements Information set forth in this presentation contains financial estimates and other forward-looking
SECURITIES AND EXCHANGE COMMISSION Washington, D.C FORM 8-K COMPAQ COMPUTER CORPORATION
 SECURITIES AND EXCHANGE COMMISSION Washington, D.C. 20549 FORM 8-K CURRENT REPORT PURSUANT TO SECTION 13 OR 15(d) OF THE SECURITIES EXCHANGE ACT OF 1934 Date of Report: July 20, 1994 COMPAQ COMPUTER CORPORATION
T-MOBILE USA REPORTS FIRST QUARTER 2011 RESULTS
 T-MOBILE USA REPORTS FIRST QUARTER 2011 RESULTS Service revenues in the first quarter of 2011 at $4.63 billion, consistent with the first quarter of Contract ARPU $52 in the first quarter of 2011, up from
dtac FY January 2018 Investor Relations E: T:
 dtac FY2017 30 January 2018 Investor Relations E: ir@dtac.co.th T: +662 202 8882 FY17 highlights 22.7m total subscribers 97.7% of sub base registered under DTN 72.8% smartphone penetration 50.5% penetration
QUALCOMM Reports Third Fiscal Quarter Revenues of $1 Billion - Operating Earnings Per Share of $.75, Excluding Non-Recurring Charges -
 FOR IMMEDIATE RELEASE QUALCOMM Contact: Julie Cunningham Vice President, Investor Relations 1-(858) 658-4224 (ph) 1-(858) 651-9303 (fax) e-mail: juliec@qualcomm.com QUALCOMM Reports Third Fiscal Quarter
UNITED STATES SECURITIES AND EXCHANGE COMMISSION FORM 8-K
 UNITED STATES SECURITIES AND EXCHANGE COMMISSION Washington, D.C. 20549 FORM 8-K CURRENT REPORT Pursuant to Section 13 or 15(d) of the Securities Exchange Act of 1934 Date of Report (Date of earliest event
O2 Czech Republic. Quarterly Results January September th November 2014
 O2 Czech Republic Quarterly Results January September 2014 12 th November 2014 CAUTIONARY STATEMENT Any forward-looking statements concerning future economic and financial performance of O2 Czech Republic
MANAGEMENT S DISCUSSION AND ANALYSIS OF FINANCIAL CONDITION AND RESULTS OF OPERATIONS
 MANAGEMENT S DISCUSSION AND ANALYSIS OF FINANCIAL CONDITION AND RESULTS OF OPERATIONS TELEFONICA CELULAR DEL PARAGUAY S.A. As at and for the three month period ended 31 March 2018 1. Overview We are a
DNA Plc January-June 2018 Half Year Financial Report
 DNA Plc January-June 2018 Half Year Financial Report 19 July, 2018 Jukka Leinonen, CEO Timo Karppinen, CFO Forward looking statement This presentation contains, or may be deemed to contain, statements
in the operating segments.
 9 Development of business in the operating segments. Germany. Customer development. G 27 Mobile customers. G 29 Fixed-network lines. 4, 36,568 37,5 37,492 37,936 38,625 24, 22,384 22,113 21,88 21,625 21,417
HIGHLIGHTS OF QUARTER S PERFORMANCE (STANDALONE)
") Mumbai, 19 th January 2018 POSITIVE NET PROFIT IN THE SECOND QUARTER OF COMMERCIAL OPERATIONS RAPID GROWTH IN SUBSCRIBER BASE TO 160.1 MILLION GROSS ADDS OF 27.8 MILLION DURING THE QUARTER WORLD S FASTEST
Mumbai, 19 th January 2018 POSITIVE NET PROFIT IN THE SECOND QUARTER OF COMMERCIAL OPERATIONS RAPID GROWTH IN SUBSCRIBER BASE TO 160.1 MILLION GROSS ADDS OF 27.8 MILLION DURING THE QUARTER WORLD S FASTEST
T-MOBILE USA REPORTS SECOND QUARTER 2010 RESULTS
 T-MOBILE USA REPORTS SECOND QUARTER RESULTS $4.70 billion service revenues in the second quarter of, an increase from $4.63 billion in the first quarter of, but down from $4.77 billion in the second quarter
True Corporation Public Company Limited
 True Corporation Public Company Limited Disclaimer The contents of this document are based, in part, on certain assumptions and information obtained from True and their respective directors, officers,
VERIZON COMMUNICATIONS INC. (Exact name of registrant as specified in its charter)
") Page 1 of 9 UNITED STATES SECURITIES AND EXCHANGE COMMISSION Washington, D.C. 20549 FORM 8-K CURRENT REPORT Pursuant to Section 13 or 15(d) of the Securities Exchange Act of 1934 Date of Report: October
Page 1 of 9 UNITED STATES SECURITIES AND EXCHANGE COMMISSION Washington, D.C. 20549 FORM 8-K CURRENT REPORT Pursuant to Section 13 or 15(d) of the Securities Exchange Act of 1934 Date of Report: October
Cincinnati Bell 3rd Quarter 2010 Review. November 3, 2010
 Cincinnati Bell 3rd Quarter 2010 Review November 3, 2010 Agenda 1. Performance Highlights Jack Cassidy, President & CEO 2. Operational Review of Wireline and Wireless Ted Torbeck, President of Cincinnati
INVESTOR PRESENTATION October 2013
 Shenandoah Telecommunications Company INVESTOR PRESENTATION October 2013 NASDAQ: SHEN Safe Harbor Statement This presentation includes forward-looking statements within the meaning of Section 27A of the
Quarterly Bulletin - 1Q17 True Corporation PLC. Executive Summary:
 Executive Summary: True Group delivered another solid performance in the first quarter of 2017 with EBITDA growth of nearly 30% YoY and EBITDA margin increasing to 32% due to strong revenue growth and
Financial Results for the Fiscal Year Ended March 2014
 Financial Results for the Fiscal Year Ended March 2014 April 30, 2014 KDDI Corporation President Takashi Tanaka Today s Presentation 1 1. Financial Results for FY2014.3 2. Forecasts for FY2015.3 3. Targeting
3Q17 Results Presentation. 16 October 2017
 3Q17 Results Presentation 16 October 2017 Forward looking statements Important note This presentation and the following discussion may contain forward looking statements by M1 Limited ( M1 ) relating to
T-MOBILE USA REPORTS THIRD QUARTER OF 2011 RESULTS
 T-MOBILE USA REPORTS THIRD QUARTER OF RESULTS Adjusted OIBDA of $1.45 billion in the third quarter of, an increase of 13% from the second quarter of and 9% from the third quarter of, largely due to the
CYRUSONE TO ACQUIRE ZENIUM DATA CENTERS
 CYRUSONE TO ACQUIRE ZENIUM DATA CENTERS THIRD QUARTER 2017 EARNINGS October 31, 2017 DECEMBER 21, 2017 SAFE HARBOR S A F E H A R B O R This presentation contains forward-looking statements regarding future
MAGYAR TELEKOM GROUP Q RESULTS PRESENTATION MAY 8, 2018
 MAGYAR TELEKOM GROUP Q1 218 RESULTS PRESENTATION MAY 8, 218 Q1 218 GROUP SEGMENTAL REVENUE AND EBITDA Group segmental revenues* Group segmental EBITDA* 152 15 148 146 144 3. 3.8 3.6 +6.5% -1.6.4 -.1. 149.6
Annual Meeting of Shareholders. May 26, 2010
 Annual Meeting of Shareholders May 26, 2010 1 LeRoy T. Carlson, Jr. President and CEO 2 TDS Safe Harbor Statement Safe Harbor Statement Under the Private Securities Litigation Reform Act of 1995: All information
Vodacom Group Limited trading statement for the quarter ended 30 June Customers up 21.5% to 17.7 million, adding in the quarter
 News release 21 July Vodacom Group Limited trading statement for the quarter ended 30 Highlights Brand refresh underpins solid Group performance o Group revenue up 8.1% (9.6%*) o Group service revenue
DNA Plc January-September 2018 Interim Report
 DNA Plc January-September 2018 Interim Report 19 October, 2018 Jukka Leinonen, CEO Timo Karppinen, CFO Forward looking statement This presentation contains, or may be deemed to contain, statements that
Results 3Q October 2015
 Results 3Q 2015 28 October 2015 1 Strong 3Q15 Service revenue growth underpinned by solid prepaid performance and stable core postpaid Growth driven by higher data usage and supported by attractive customer
DIGI.COM MANAGEMENT DISCUSSION AND ANALYSIS Q2 2013
 REGAINING MOMENTUM ON SERVICE REVENUE GROWTH DiGi delivered 4.6% higher revenue y-o-y driven by continued growth momentum on mobile internet ( MI ) revenue supported by stronger mobile internet adoption
VODAFONE K.K. ANNOUNCES FISCAL 2005 RESULTS
 30 May 2006 VODAFONE K.K. ANNOUNCES FISCAL 2005 RESULTS TOKYO: VODAFONE K.K. today announces its results for fiscal 2005 (the year ended at 31 March 2006). Positive net customer additions of 169,200 were
Cincinnati Bell 1st Quarter 2010 Review. May 6, 2010
 Cincinnati Bell 1st Quarter 2010 Review May 6, 2010 Agenda 1. Performance Highlights Jack Cassidy, President & CEO 2. Operational Overview Brian Ross, Chief Operating Officer 3. Financial Overview Gary
EXPEDIA, INC. FORM 8-K. (Current report filing) Filed 01/23/15 for the Period Ending 01/23/15
 Filed 01/23/15 for the Period Ending 01/23/15") EXPEDIA, INC. FORM 8-K (Current report filing) Filed 01/23/15 for the Period Ending 01/23/15 Address 333 108TH AVENUE NE BELLEVUE, WA 98004 Telephone (425) 679-7200 CIK 0001324424 Symbol EXPE SIC Code
EXPEDIA, INC. FORM 8-K (Current report filing) Filed 01/23/15 for the Period Ending 01/23/15 Address 333 108TH AVENUE NE BELLEVUE, WA 98004 Telephone (425) 679-7200 CIK 0001324424 Symbol EXPE SIC Code
DNA Plc Half year 2017 report
 DNA Plc Half year 2017 report 18 July, 2017 Jukka Leinonen, CEO Timo Karppinen, CFO Forward looking statement This presentation contains, or may be deemed to contain, statements that are not historical
Sunrise Communications Holdings S.A.
 November 24, 2011 Sunrise Communications Holdings S.A. Financial Results January September 2011 Key Messages Sunrise continues its good financial performance driven by strong postpaid and LLU customer
FIRST QUARTER April 24, 2017 Tele2 AB
 FIRST QUARTER 2017 April 24, 2017 Tele2 AB Group highlights Q1 2017 SEK billion Q1 2017 % Change Reported % Change LFL Mobile end-user service revenue 3.7 +19% +10% Net sales 7.9 +22% +3% EBITDA 1.7 +41%
Financial Results for the Three Months Ended June 30, August 7, 2018
 Financial Results for the Three Months Ended June 30, 2018 August 7, 2018 Copyright 2018 NIPPON TELEGRAPH AND TELEPHONE CORPORATION 1 This document is a translation of the Japanese original. The Japanese
GLOBE ANNOUNCES FULL YEAR 2018 RESULTS GLOBE INVESTED P43.3 BILLION IN CAPEX IN 2018, REPRESENTING NEARLY 33% OF GROSS SERVICE REVENUES
 GLOBE ANNOUNCES FULL YEAR 2018 RESULTS GLOBE INVESTED P43.3 BILLION IN CAPEX IN 2018, REPRESENTING NEARLY 33% OF GROSS SERVICE REVENUES GLOBE TO SPEND P63.0 BILLION CAPEX IN 2019 FOR CONTINUED NETWORK
T-Mobile USA Reports Second Quarter 2012 Operating Results Continued Solid Adjusted OIBDA in Q2; Churn Improvements
 Reports Second Quarter Operating Results Continued Solid Adjusted OIBDA in Q2; Churn Improvements Adjusted OIBDA increased 4.8% year-on-year to $1.3 billion in the second quarter of Adjusted OIBDA margin
INVESTOR RELATIONS 28 January Zayo Reporting Update Call
 INVESTOR RELATIONS 28 January 2016 Zayo Reporting Update Call ZAYO GROUP SAFE HARBOR Information contained in this presentation that is not historical by nature constitutes forward-looking statements which
Financial Results for the Nine Months Ended December 31, 2012
 Financial Results for the Nine Months Ended December 31, 2012 February 6, 2013 The forward-looking statements and projected figures concerning the future performance of NTT and its subsidiaries and affiliates
Verizon Caps Strong Record of Success in 2013 With Fourth Consecutive Quarter of Double-Digit Earnings Growth 4Q 2013 HIGHLIGHTS
 Verizon Caps Strong Record of Success in 2013 With Fourth Consecutive Quarter of Double-Digit Earnings Growth 4Q 2013 HIGHLIGHTS Consolidated $1.76 in earnings per share (EPS), compared with a loss of
T-MOBILE US. GROUP STRATEGY Germany Systems Solutions Technology & Innovation T-Mobile US Europe
 T-MOBILE US GROUP STRATEGY Germany Systems Solutions Technology & Innovation T-Mobile US Europe Group Development 1 LEGAL DISCLAIMER Important Additional Information In connection with the proposed transaction,