On Command Performance Manager 7.0 Lab on Demand Guide
|
|
|
- Ellen Bryant
- 6 years ago
- Views:
Transcription
1 On Command Performance Manager 7.0 Lab on Demand Guide On Command Performance Manager 7.0 Lab on Demand Guide... 1 Lab Activity: Adding Clusters... 1 Lab Activity: Performance Manager Dashboard... 2 Lab Activity: Cluster Landing Page... 5 Lab Activity: Object Inventory... 8 Lab Activity: Object Landing Page and Performance Explorer Lab Activity Performance Capacity and Available IOPS Charts Lab Activity View and Compare Performance Capacity on nodes in cluster Lab Activity Failover Planning Lab Activity Performance Management Policy Thresholds Lab Activity: Adding Clusters Clustered Data ONTAP is NetApp s flagship software product and the engine that drives the Data Fabric technology vision. Thus, it is paramount to know how the clusters in the environment are performing at any time. Since this is a demonstration database you will not be able to add a cluster. Go through the steps in the Performance Manager instance. Aceess OPM from the Chrome web browser (it will default to the OPM instance at and login with username admin and password Netapp1! This section guides you through the steps required to add an actively running cluster in the lab. Select the Administration page on the right side top panel of Performance Manager Select Data Sources on the lower left panel Select +Add button on the center panel labeled Manage Data Sources Follow the prompts from the add data sources wizard

2 Lab Activity: Performance Manager Dashboard Ideally, storage environments manage themselves without any human intervention. The next best option is a tool indicating what demands attention now. Performance Manager does this by composing a cluster dashboard that first lists clusters that are of the most interest. The order of precedence is first, clusters that can t be reached; second, cluster has one or more new critical events; third, cluster has one or more new warning events last, if the cluster has no new events; the clusters are sorted by highest IOPS.

3 The dashboard also presents other high-level information such as key performance metrics, utilization of the most consumed resources, and color-coded alert status indicators. This section discusses the elements of the Performance Manager dashboard. Select the Dashboard page on the top navigation panel of Performance Manager There is an open issue with the demo database due to which dashboard metrics are not displayed. Information on performance manager dashboard is updated automatically after each five-minute collection interval. The dashboard displays key metrics for each cluster: o The first metric to appear is the latency, the icon area indicates whether any SVMs, volumes, or LUNs have received a new event based on the latency value crossing a threshold setting. o The next metric to appear is the total IOPS, or inputs/outputs per second, showing the processing rate of file or block operations. The bottom area displays the total cluster IOPS for the last five-minute collection period. o The next metric is MBps, or megabytes per second, that is the amount of data read and written in the payload of the operations. The bottom area displays the total cluster throughput for the last five-minute collection period. o Next to appear is Performance Capacity Used metric, this shows whether any nodes or aggregates are overusing their available performance capacity. The bottom area displays the highest performance capacity used value from the busiest node and busiest aggregate. o Performance capacity data is available only when the nodes in a cluster are installed with ONTAP 9.0 or later software. o Next to appear is Utilization which shows whether the resources on any nodes or aggregates are being overused. The bottom area displays the highest utilization value from the busiest node and busiest aggregate.


4 Below each metric appear color-coded status icons associated with each object and metric. When the icon is green with a check icon there are no active alerts for the metric-object pair. When the icon status is yellow with a! icon there are active warning alerts and when the icon status is red with an X icon there are active critical alerts for the metric-object pair. Below each metric appears links to the cluster objects the take you to metric charts showing the metric over time. The links take you to object inventory pages, which are essentially lists, of those cluster objects. Click on the SVMs link to enter the cluster SVM object inventory page. Note that each SVM has a link to that objects landing page. The object landing page will be covered later in this guide. Select the Dashboard Tab at the top of the page to return to the dashboard.


5 Lab Activity: Cluster Landing Page Clustered Data ONTAP is NetApp s flagship software product and the engine that drives the Data Fabric technology vision. Thus, it is paramount to know how the clusters in the environment are performing at any time. The Cluster landing page shows a summary of events and performance. Directly below the summary is an inventory of the managed cluster objects. Following this information is a customizable listing of the most active objects instances in this cluster. From the dashboard, select the View Cluster Details button in the top right corner of the cluster panel. In first panel labeled All Events on this Cluster you see a summary of events broken out by type of event, any new events, and obsolete events, over last 3 days. In the next 2 panels appear key cluster performance metrics labeled IOPS and MBps also over the last 3 days.


6 Below the summary panels is an overview of the cluster where you see the object inventory panel labeled Managed Objects. Note the number of nodes, aggregates, volumes and storage virtual machines defined for this lab. The links below the objects can be followed to their appropriate inventory pages. Explore these links and return to the cluster landing page.

7 The next panel, labeled Top Performers, displays highest or lowest performing storage objects based on the selected performance metric. You can select a time range for viewing the top performers; the selected time range applies to all storage objects. The object order is sorted by the most active object first where the metric shown is the maximum value over the selected time range. Cycle through the available time ranges and metrics using the appropriate pull-down. For example, change the Top 10 Nodes metric from Latency to IOPS. Continue to explore the other metrics and objects. The bar graphs are color-coded. If the counter is not breaching a performance threshold, the counter bar is displayed in blue. If a threshold breach is active (a new event), the bar is displayed in the color for the event: warning events are displayed in yellow and critical events are displayed in red. Performance capacity used metric is available for nodes and aggregates storage objects only when the nodes in a cluster are installed with ONTAP 9.0 or later software. In the screenshot below, the maximum value of Performance capacity used on node opmcapacity-02 as monitored by Performance Manager is 240 in the last 72 hours.

8 Lab Activity: Object Inventory It is useful at times to list and view objects across data centers or an enterprise. The object inventories contain a comprehensive list of all the objects discovered and analyzed by Performance Manager. Columns with object metrics and links to related container objects are also included in the inventory page line items. Managing large numbers of objects is made easier through powerful filters and sorting. Near the top of the page, just above the table heading, note the description of the metrics that appear on this page. Latency, IOPS, MBps, Utilization are based on hourly samples averaged over the previous 72 hours. Select the Storage pull-down menu and cycle through the objects available. Note that the objects inventory lists dynamically update. Select Volumes from the list. Select the Filters pull-down menu. Select the first pull-down in the Filters sub-menu and note the extensive filtering functionality (do not apply any filters though if you do they are simple to remove). Alternate clicks on the IOPS and Latency column heading and note how inventory list is sorted. This is one method to find the most active or most latent volume across many clusters. The demo database can sometimes display Latency, IOPS, MBps as N/A. This is an known issue. Also note the links provided to contain objects for the volumes such as SVMs, aggregates and clusters.
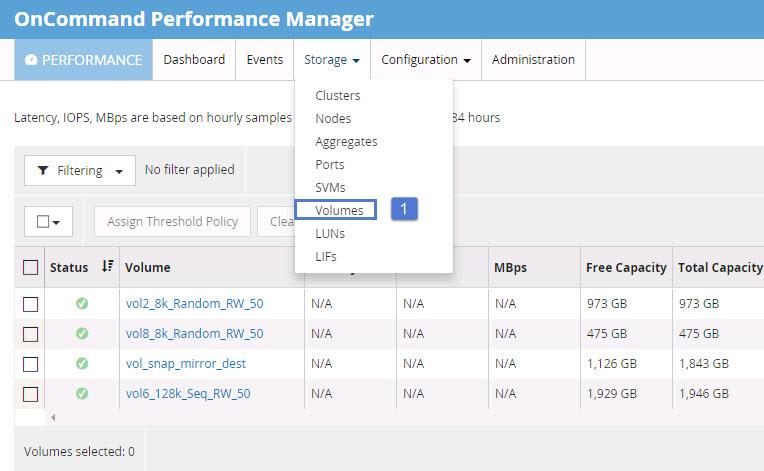
9


10 Click on (X) to remove filter applied. Click on Free Capacity column to sort by highest or lowest free capacity. Also note the links provided to related objects for the volumes such as SVMs, aggregates and clusters.

11 Lab Activity: Object Landing Page and Performance Explorer The Performance Manager object landing page focuses on a specific storage object in which summary and detailed performance information is presented. All storage objects have a landing page and have a similar look and feel. Obviously not all objects are the same, so a cluster landing page has slightly different metrics and views than a volume landing page. However, all landing pages summarize key highlevel metrics for a given storage object over the prior three days. In the example below we navigate to opm-capacity-02 node landing page from Cluster opm-capacity Summary page.


12 opm-capacity-02 node landing page summarize key high-level metrics for this node over the prior three days. The Performance Manager Performance Explorer is a modular component common to all object landing pages where it guides you through exploration and navigation of related objects. You can choose to build charts where you select from a menu of metrics and from time ranges spanning over the retained data for up to 13 months. Performance Manager retains data for the most recent 30 days at 5-minute granularity and the following 12 months at 1-hour granularity Select the Explorer tab on opm-capacity-02 node to access the node performance explorer. The default view and compare value is nodes on same cluster The Node Performance Explorer page provides tracking and comparison of node performance during a specific time period, which helps in troubleshooting and fine-tuning your node performance. You can compare the performance of peer nodes, and aggregates and ports of this node. Using the Node Performance Explorer page, you can: o View threshold-related issues and their details o Investigate and troubleshoot threshold-related issues
13 o Investigate and troubleshoot performance issues Select the Time Range pull-down menu and set the time range as Last 72 hours. Click Apply range. Click on Choose charts: Performance capacity used, Performance capacity used(advanced) and Available IOPS are the new charts available for node storage object with ONTAP 9 and OPM 7.0

14 View the 8 metrics chart. Select the Time Range pull-down menu and select Last 7 days and Last 30 days to view the metrics chart. Observe the node utilization, latency, IOPS and other metrics to help you understand the node resource utilization over the selected time range. Select the pull-down choose charts menu and observe the menu of metrics available for the charts. Note how easily metrics charts can be added and removed. Experiment with selecting different options from the pull down and observe the object list dynamically updating. Events chart will co-relate events on the node to utilization metrics on the same timeline to help in performance troubleshooting and analysis. Select IOPS Advanced chart and hover over the charts to understand the breakdown by read and writes, similarly select MBps Advanced to understand Disk reads, writes over the selected time range.
15

16 Lab Activity Performance Capacity and Available IOPS Charts In today s environment, how does one know if there is or is not enough resource to meet a service? Knowing just the available storage capacity is not enough, but there is a need to know if enough performance capacity is available. This is where Perf. Capacity Used comes to play. Perf. Capacity Used provides visibility into available performance capacity across nodes & aggregates starting with ONTAP 9. It does so by automatically computing an Optimal Point for utilization an indication that going beyond this point would result in undesirable latencies. ONTAP 9 computes this dynamic value automatically and takes into account the workload type. Getting to know how much additional performance capacity is available before getting into latencyrelated problems is critical for priority and latency-sensitive workloads. Perf. Capacity Used enables provisioning as well as cluster-wide load-balancing. Select the Time Range pull-down menu and select Last 72 hours to view the metrics chart. Select the pull-down choose charts menu and select Events, Latency, Utilization, Performance capacity used, Performance capacity used(advanced) and Available IOPS charts.

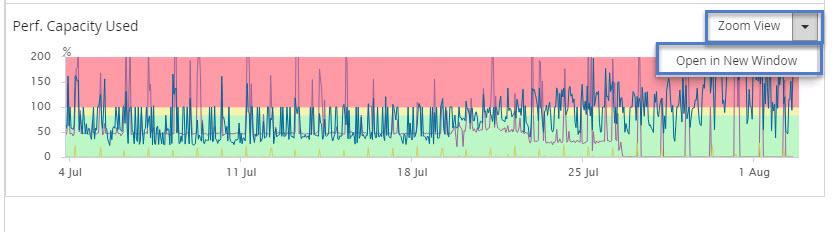
17 Observe the performance capacity used metrics over the selected time period. Notice the color banding in performance capacity used chart. Click on drop down option in Zoom view to open performance capacity used chart in a new window If the performance capacity used metrics are pre-dominantly in the green zone, this indicates that node resources are under- utilized and there is an opportunity to add additional workloads. (0-80 percent) If the performance capacity used metrics are in yellow zone, this indicates that the node resources are optimally utilized. ( percent) and any additional workload will result in latencies. If the performance capacity used metrics are in red zone, this indicates that the node resources are over utilized ( percent and above) where in the current workloads are experiencing significant increase in latencies.


18 performance capacity used in node opm-capacity-02 in the last 48 hours is predominantly in the green zone indicating the node is under-utilized. Change the time range to reflect last 7 days and Observe the performance capacity used metrics. Other than Sat 12 am to Monday 12 am, the node is in green zone. Use the mouse left click to select the duration between Sat 12 am to Monday 12 am to look into performance capacity used during this time duration. Performance capacity used is between optimal and over utilized between Saturday 12 am and 6 pm.
 chart Advanced chart provides a")

19 To analyze this further, go back to node performance explorer page open in another tab to look at performance capacity used (Advanced) chart Advanced chart provides a breakdown of performance capacity used on node opm-capacity-02 by user protocol workload and background system processes and performance capacity free on a node to provision new workloads.

 chart in a new window In the performance capacity used Advanced zoom chart, Change the time range to reflect last 7")
20 RAID reconstruct, SnapMirror transfers, storage efficiency processes, disk scrubbing are examples of background system processes. The breakdown by user protocol workload and background system processes will help us understand if performance capacity on node opmcapacity-02 is a result of caused by user protocol workload or background system processes. Click on drop down option in Zoom view to open performance capacity used(advanced) chart in a new window In the performance capacity used Advanced zoom chart, Change the time range to reflect last 7 days and observe that background processes have used almost 15% of performance capacity used during mid nights on a regular basis. Use the mouse left click to select the duration between Sat 12 am to Monday 12 am to look into performance capacity used (Advanced) during this time duration. On node opm-capacity-02 performance capacity used is a result of user protocol workload and background system processes. Performance capacity used reaches an optimum and sometime over-utilized when both user protocol workload and background system processes are running at the same time.

21 Let s go back to node performance explorer page open in another tab to look at Available IOPS chart While performance capacity used chart lets a user know how much performance capacity is free on a node based on the current workloads. Another chart which will help a user when considering whether a node has resources available to take on new workloads is the Available IOPS at a node chart. When the node has performance capacity free or in other words when a node has available performance capacity, the available IOPS chart informs a user how many additional IOPS can the node provide to add new workloads. A key point to remember is for Available IOPS chart to display metrics, a user protocol workload should be running for OPM to compute Available IOPS in node or aggregate. If there is no user workload on a node, Available IOPS chart will not display metrics. Available IOPS takes the FAS system, hardware resources on the node and current workloads into consideration to compute IOPS available on the node. In this example, Available IOPS at 7:50 pm on July 31 st is approximately IOPS with 50% performance capacity free.

22 Lab Activity View and Compare Performance Capacity on nodes in cluster When you have to provision a new workload on the cluster or understand if the workloads are balanced across the nodes in a cluster, you have to understand performance capacity used and available on all the nodes in a cluster. In this section let s view and compare performance capacity on nodes in a cluster to decide on which node to provision a new workload and if workloads are balanced across the nodes in a cluster. From node opm-capacity-02 explorer page, select nodes on same cluster option from view and compare drop down. Other nodes on cluster opm-capacity are displayed. This is a 2 node cluster, opm-capacity-01 being the other node. Average latency, IOPS, MBps and Performance capacity used over the selected time range for the node opm-capacity-01 are displayed. Click on Add to add node opm-capacity-01 performance metrics to the chart, view and compare performance metrics with node opm-capacity-02. Select the Time Range pull-down menu and select Last 30 days to view the metrics chart. Select the pull-down choose charts menu and select Events, Latency, Utilization, Performance capacity used charts. Notice that the chart now displays performance metrics charts for both the nodes in the cluster.


23 Click on drop down option in Zoom view to open performance capacity chart in a new window

24 Use the mouse left click to select the duration between 07/4 to 07/20 to look into performance capacity used during this time duration. In an actual scenario, you have to compare performance capacity used on all nodes in a cluster for the last 72 hours, last 7 days and 30 days before deciding on which node is appropriate to provision a new volume or workload. For this lab, we are considering a particular time range. Performance capacity used for both the nodes is in the green or safe zone for both the nodes for the selected time period, with opm-capacity-01 node displaying higher performance capacity utilization compared to opm-capacity-02 node for the selected time range. Thresholds assigned to nodes will also be displayed in the charts. We will cover thresholds in a later section.

 added to the chart and select Aggregates on this Node from")
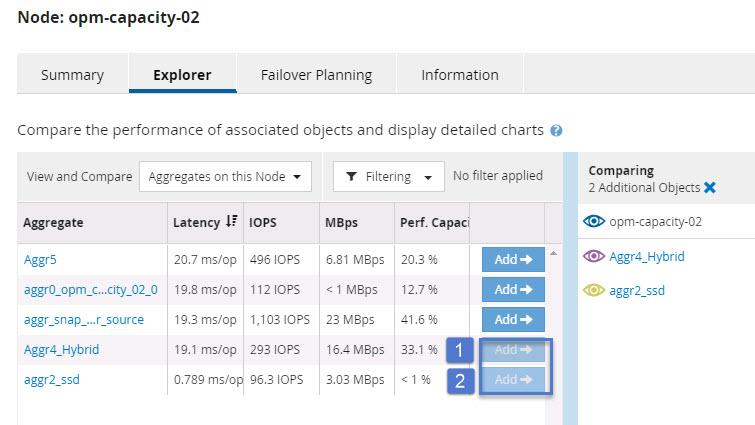
25 Based on this metrics for the selected time range a new workload can be provisioned in opmcapacity-02. We can select aggregates on opm-capacity-02 to view and compare performance metrics charts. This will help us understand which aggregate can be used to provision a new workload. Remove additional object(opm-capacity-01) added to the chart and select Aggregates on this Node from view and compare drop down list.

26 Aggregate hourly averages for the selected time range (last 30 days in this example) are displayed in the table. If the workload is latency sensitive and has ultra-low latency requirements, aggr2_ssd is a better option available based on latency, IOPS currently delivered and performance capacity used metrics. Let s add Aggr4_hybris and aggr2_ssd aggregates and compare aggregate performance characteristics with node opm-capacity-02 Click on drop down option in Zoom view to open performance capacity chart in a new window For the duration between 07/4 to 07/18, performance capacity on aggr2_ssd is hardly used.
27

28 Next, let s navigate to aggregate inventory page to check on free capacity and ascertain disk type information for aggregate From node 02 explorer page, click on Storage Aggregates to navigate to aggregate inventory page.


29 Check if aggr2_ssd has enough capacity to provision a new workload. Click on aggr2_ssd to launch aggr2_ssd object landing page and navigate to information page. aggr2_ssd information page provides you aggr2_ssd aggregate disk type. This is a SSD aggregate.
30 In case, the performance capacity used on nodes 01 and 02 display big differences where one node is over utilized (100% and above) and another node is under-utilized (60% and below) there is an opportunity to view and compare aggregates on over utilized nodes to find out which aggregate is contributing towards over utilization. This will help you understand which volumes can be moved non-disruptively to balance workloads across the nodes in a cluster are balanced. Lab Activity Failover Planning Lab Activity Performance Management Policy Thresholds
OnCommand Unified Manager 7.2 Workflow Guide for Managing Cluster Performance
 OnCommand Unified Manager 7.2 Workflow Guide for Managing Cluster Performance April 2018 215-12016_C0 doccomments@netapp.com Table of Contents 3 Contents Introduction to OnCommand Unified Manager performance
Pure Storage FlashArray Management Pack for VMware vrealize Operations Manager User Guide. (Version with Purity 4.9.
 Pure Storage FlashArray Management Pack for VMware vrealize Operations Manager User Guide (Version 1.0.139 with Purity 4.9.x or higher) Sunday, November 27, 2016 16:13 Pure Storage FlashArray Management
VMWARE VREALIZE OPERATIONS MANAGEMENT PACK FOR. NetApp Storage. User Guide
 VMWARE VREALIZE OPERATIONS MANAGEMENT PACK FOR User Guide TABLE OF CONTENTS 1. Purpose... 3 2. Introduction to the Management Pack... 3 2.1 Understanding NetApp Integration... 3 2.2 How the Management
1 P age NEXTIVA CALL CENTER. Supervisor User Guide. nextiva.com/support 2015 NEXTIVA, ALL RIGHTS RESERVED
 1 P age NEXTIVA CALL CENTER Supervisor User Guide nextiva.com/support 2015 NEXTIVA, ALL RIGHTS RESERVED 2 P age Creating Employees... 3 Creating an Employee... 3 Assigning Licenses to Employees... 7 Schedules...
Migrating to NetApp ONTAP Using the 7-Mode Transition Tool Copy-Based Transition. September 2016 SL10284 Version 3.0
 Migrating to NetApp ONTAP Using the 7-Mode Transition Tool Copy-Based Transition September 2016 SL10284 Version 3.0 TABLE OF CONTENTS 1 Migrating to NetApp ONTAP Using 7-Mode Transition Tool Copy-Based
Virtual Storage Console, VASA Provider, and Storage Replication Adapter for VMware vsphere
 Virtual Storage Console, VASA Provider, and Storage Replication Adapter for VMware vsphere Administration Guide for 7.1 release January 2018 215-12648_B0 doccomments@netapp.com Table of Contents 3 Contents
Virtual Storage Console, VASA Provider, and Storage Replication Adapter for VMware vsphere
 Virtual Storage Console, VASA Provider, and Storage Replication Adapter for VMware vsphere Administration Guide for 7.2 release June 2018 215-13169_A0 doccomments@netapp.com Table of Contents 3 Contents
Virtual Storage Console, VASA Provider, and Storage Replication Adapter for VMware vsphere
 Virtual Storage Console, VASA Provider, and Storage Replication Adapter for VMware vsphere Workflow Guide for 7.2 release July 2018 215-13170_B0 doccomments@netapp.com Table of Contents 3 Contents Deciding
NEXTIVA ANALYTICS USER GUIDE. nextiva.com/support
 NEXTIVA ANALYTICS USER GUIDE nextiva.com/support Contents Logging In... 2 Landing Page... 2 Reporting... 3 Total Count Chart... 4 Count by Day Chart... 4 Hourly Average Chart... 4 Counts by State Chart...
Introduction to Dell SC Series: Part 1
 Introduction to Dell SC Series: Part 1 Dell Storage Hands-on Lab Estimated completion time: 30 minutes Audience The audience for this document is technical professionals who wish to learn more about administrative
DELL EMC VMAX UNISPHERE 360
 DELL EMC VMAX UNISPHERE 360 ABSTRACT Using Unisphere 360 to consolidate the management of VMAX storage system offers many benefits. This management interface offers a single interface where all enrolled
CLOUDIQ OVERVIEW. The Quick and Smart Method for Monitoring Unity Systems ABSTRACT
 CLOUDIQ OVERVIEW The Quick and Smart Method for Monitoring Unity Systems ABSTRACT This white paper introduces EMC CloudIQ, a cloud-based Software-as-a-Service platform that enables administrators to remotely
MarkLogic Server. Monitoring MarkLogic Guide. MarkLogic 9 May, Copyright 2017 MarkLogic Corporation. All rights reserved.
 Monitoring MarkLogic Guide 1 MarkLogic 9 May, 2017 Last Revised: 9.0-2, July, 2017 Copyright 2017 MarkLogic Corporation. All rights reserved. Table of Contents Table of Contents Monitoring MarkLogic Guide
SteelCentral Insights for SteelConnect Users Guide
 SteelCentral Insights for SteelConnect Users Guide Version 1.1.x November 2017 2017 Riverbed Technology, Inc. All rights reserved. Riverbed and any Riverbed product or service name or logo used herein
UW Profiles User Guide
 UNIVERSITY OF WASHINGTON UW Profiles User Guide Note: This user guide covers information about working with the Tableau browser interface. Tableau Desktop information is not included. UW Profiles is accessible
EMC ViPR SRM. User Guide for Storage Administrators. Version
 EMC ViPR SRM Version 4.0.2 User Guide for Storage Administrators 302-003-447 01 Copyright 2016-2017 Dell Inc. or its subsidiaries All rights reserved. Published January 2017 Dell believes the information
Introduction to the New User Interface. ScienceLogic Beta Version 8.7.0
 Introduction to the New User Interface ScienceLogic Beta Version 8.7.0 Table of Contents Introduction to the New User Interface 4 Logging In and Out of the New User Interface 5 Using the Tabs in the New
OnCommand Cloud Manager 3.2 Deploying and Managing ONTAP Cloud Systems
 OnCommand Cloud Manager 3.2 Deploying and Managing ONTAP Cloud Systems April 2017 215-12035_C0 doccomments@netapp.com Table of Contents 3 Contents Before you create ONTAP Cloud systems... 5 Logging in
Table of Contents. Manual for Principal Investigators + Lab Financial Administrators - Core Facilities Management System
 Table of Contents 1. Overview 2. My Homepage 3. How do I Manage My Lab Settings? a. How do I Set Projected Cost Amounts that Require My Approval? b. How do I Create Budgets and Monitor Spending? 4. Can
Table of Contents HOL-1701-CHG-5
 Table of Contents Lab Overview: vrealize Operations Application Monitoring: Challenge Lab... 2 Lab Overview... 3 Lab Guidance... 5 Module 1 - Configuring a Custom Application (15 minutes)... 10 Introduction...
Agent Console. The Agent Console. The topics in this section provide information about the Agent Console.
 Agent Console The topics in this section provide information about the Agent Console. The Agent Console The agent logs into the workstation The agent is automatically logged in to Intradiem; the Agent
BIG-IP Analytics: Implementations. Version 13.1
 BIG-IP Analytics: Implementations Version 13.1 Table of Contents Table of Contents Setting Up Application Statistics Collection...5 What is Analytics?...5 About HTTP Analytics profiles... 5 Overview:
EMC VMAX UNISPHERE 360
 EMC VMAX UNISPHERE 360 ABSTRACT Unisphere 360 is a new application designed to consolidate and simplify data center management of VMAX Storage systems. WHITE PAPER To learn more about how EMC products,
Benefits of Multi-Node Scale-out Clusters running NetApp Clustered Data ONTAP. Silverton Consulting, Inc. StorInt Briefing
 Benefits of Multi-Node Scale-out Clusters running NetApp Clustered Data ONTAP Silverton Consulting, Inc. StorInt Briefing BENEFITS OF MULTI- NODE SCALE- OUT CLUSTERS RUNNING NETAPP CDOT PAGE 2 OF 7 Introduction
vcenter Operations Management Pack for NSX-vSphere
 vcenter Operations Management Pack for NSX-vSphere vcenter Operations Manager 5.8 This document supports the version of each product listed and supports all subsequent versions until the document is replaced
Overview of Cisco UCS Manager GUI
 Overview of Cisco UCS Manager GUI This chapter includes the following sections: Overview of Cisco UCS Manager GUI, page 1 Logging in to Cisco UCS Manager GUI through HTTPS, page 6 Logging in to Cisco UCS
SnapCenter Software 4.1. Administration Guide. December _C0 Updated for 4.1.1
 SnapCenter Software 4.1 Administration Guide December 2018 215-13391_C0 doccomments@netapp.com Updated for 4.1.1 Table of Contents 3 Contents Deciding whether to read the SnapCenter Administration information...
BIG-IP Analytics: Implementations. Version 12.1
 BIG-IP Analytics: Implementations Version 12.1 Table of Contents Table of Contents Setting Up Application Statistics Collection...5 What is Analytics?...5 About HTTP Analytics profiles...5 Overview: Collecting
Database Performance Analyzer (DPA) Quick Demo
 Quick Demo") Database Performance Analyzer (DPA) Quick Demo http://database.demo.solarwinds.com/ Log in with the username demo and password demo1. NOTE: You may encounter the following recommended video, while demoing
Database Performance Analyzer (DPA) Quick Demo http://database.demo.solarwinds.com/ Log in with the username demo and password demo1. NOTE: You may encounter the following recommended video, while demoing
MicroStrategy Academic Program
 MicroStrategy Academic Program Creating a center of excellence for enterprise analytics and mobility. HOW TO DEPLOY ENTERPRISE ANALYTICS AND MOBILITY ON AWS APPROXIMATE TIME NEEDED: 1 HOUR In this workshop,
Monitoring and Troubleshooting
 CHAPTER 22 The Monitor tab on the Cisco Identity Services Engine (ISE) home page, also known as the dashboard, provides integrated monitoring, reporting, alerting, and troubleshooting, all from one centralized
Amazon Elastic File System
 Amazon Elastic File System Choosing Between the Different Throughput & Performance Modes July 2018 2018, Amazon Web Services, Inc. or its affiliates. All rights reserved. Notices This document is provided
XO Stats: User Guide. Monitor your circuit performance, troubleshoot, and plan future network capacity requirements
 XO Stats: User Guide Monitor your circuit performance, troubleshoot, and plan future network capacity requirements XO Stats is a web-based portal that allows you, an XO Communications data and Internet
VMware vsphere 5.5: Install, Configure, Manage Lab Addendum. Lab 21: VMware vsphere Distributed Resource Scheduler
 VMware vsphere 5.5: Install, Configure, Manage Lab Addendum Lab 21: VMware vsphere Distributed Resource Scheduler Document Version: 2014-06-02 Copyright Network Development Group, Inc. www.netdevgroup.com
CLOUDIQ: INTELLIGENT, PROACTIVE MONITORING AND ANALYTICS
 CLOUDIQ: INTELLIGENT, PROACTIVE MONITORING AND ANALYTICS A cloud-native Software-as-a-Service for Dell EMC Midrange Storage ABSTRACT This white paper introduces Dell EMC CloudIQ, a cloud-native Software-as-a-Service
Secure Web Appliance. Basic Usage Guide
 Secure Web Appliance Basic Usage Guide Table of Contents 1. Introduction... 1 1.1. About CYAN Secure Web Appliance... 1 1.2. About this Manual... 1 1.2.1. Document Conventions... 1 2. Description of the
Hands-on Lab Session 9909 Introduction to Application Performance Management: Monitoring. Timothy Burris, Cloud Adoption & Technical Enablement
 Hands-on Lab Session 9909 Introduction to Application Performance Management: Monitoring Timothy Burris, Cloud Adoption & Technical Enablement Copyright IBM Corporation 2017 IBM, the IBM logo and ibm.com
1. Initial Setting and Installation of ActiveVisor... 1
 ActiveVisor Startup Guide 1 st Edition August, 2018 Contents 1. Initial Setting and Installation of ActiveVisor... 1 1.1 System Requirements... 1 1.2 Installation of ActiveVisor... 2 1.3 Initial Settings
VMware vcenter Operations Manager Getting Started Guide
 VMware vcenter Operations Manager Getting Started Guide Custom User Interface vcenter Operations Manager 5.7 This document supports the version of each product listed and supports all subsequent versions
Wired Network Summary Data Overview
 Wired Network Summary Data Overview Cisco Prime Infrastructure 3.1 Job Aid Copyright Page THE SPECIFICATIONS AND INFORMATION REGARDING THE PRODUCTS IN THIS MANUAL ARE SUBJECT TO CHANGE WITHOUT NOTICE.
Contact Center Advisor. Genesys Performance Management Advisor TM. User Manual Release 3.3
 Genesys Performance Management Advisor TM User Manual Release 3.3 Informiam Browser, Contact Center Advisor, Workforce Advisor, Frontline Advisor, Agent Advisor, and Genesys Performance Management Suite
Data Protection Guide
 SnapCenter Software 4.1 Data Protection Guide For VMs and Datastores using the SnapCenter Plug-in for VMware vsphere September 2018 215-13399_B0 doccomments@netapp.com Table of Contents 3 Contents Deciding
Tableau Server on Microsoft Azure:
 Tableau Server on Microsoft Azure: Deployment Guidelines and Best Practices April 2017 Table of Contents Abstract...3 Introduction to Tableau With Microsoft Azure...3 Option 1 Self Deployment via Azure
OpenManage Power Center Demo Guide for https://demos.dell.com
 OpenManage Power Center Demo Guide for https://demos.dell.com Contents Introduction... 3 Lab 1 Demo Environment... 6 Lab 2 Change the default settings... 7 Lab 3 Discover the devices... 8 Lab 4 Group Creation
Implementing Consistent Storage Service Levels with OnCommand Workflow Automation. October 2016 SL10296 Version 1.0.1
 Implementing Consistent Storage Service Levels with OnCommand Workflow Automation October 2016 SL10296 Version 1.0.1 1 Introduction OnCommand Workflow Automation brings automated Service Level Objective
Overview of Cisco UCS Manager GUI
 Overview of Cisco UCS Manager GUI This chapter includes the following sections: Overview of Cisco UCS Manager GUI, page 1 Logging in to Cisco UCS Manager GUI through HTTPS, page 6 Logging in to Cisco UCS
OnCommand Insight for Enterprise and Cloud Monitoring. June 2017 SL10357 Version 1.3.0
 OnCommand Insight for Enterprise and Cloud Monitoring June 2017 SL10357 Version 1.3.0 1 Introduction This lab features NetApp OnCommand Insight (OCI) 7.3. The lab employs key use cases to illustrate the
Oracle Enterprise Manager 11g Ops Center 2.5 Hands-on Lab
 Oracle Enterprise Manager 11g Ops Center 2.5 Hands-on Lab Introduction to Enterprise Manager 11g Oracle Enterprise Manager 11g is the centerpiece of Oracle's integrated IT management strategy, which rejects
EMC ViPR SRM. User Guide for Storage Administrators. Version
 EMC ViPR SRM Version 4.1 User Guide for Storage Administrators 302-003-737 01 Copyright 2016-2017 Dell Inc. or its subsidiaries All rights reserved. Published July 2017 Dell believes the information in
MarkLogic Server. Monitoring MarkLogic Guide. MarkLogic 8 February, Copyright 2015 MarkLogic Corporation. All rights reserved.
 Monitoring MarkLogic Guide 1 MarkLogic 8 February, 2015 Last Revised: 8.0-1, February, 2015 Copyright 2015 MarkLogic Corporation. All rights reserved. Table of Contents Table of Contents Monitoring MarkLogic
WhatsUp Gold v16.0 Wireless User Guide
 WhatsUp Gold v16.0 Wireless User Guide Contents Welcome to WhatsUp Gold Wireless Wireless Overview... 1 Wireless licensing and accessibility... 3 Using WhatsUp Gold Wireless Discovering wireless devices...
Windows Download & Installation
 BrokerMetrics / AgentMetrics Instructions for a New Installation Windows Download & Installation... 1 Macintosh Download & Installation... 6 Troubleshooting... 10 How to verify your installation... 11
Load Watch SM Distributed Resources System Operations Center
 DTE Energy Generator and Energy Monitoring Services Load Watch SM Distributed Resources System Operations Center Users Guide V.8 March 00 For Technical Support or Questions Call --5-5590 Log-in Screen
Aeries Analytics - Advanced Analysis of Student Data Conference 2017
 Conference 2017 Session Description: This session will delve deeper into how to set up and configure advanced Analytics Items and Dashboards. If you've been using Aeries Analytics and want to learn how
Product Documentation SAP Business ByDesign August Analytics
 Product Documentation PUBLIC Analytics Table Of Contents 1 Analytics.... 5 2 Business Background... 6 2.1 Overview of Analytics... 6 2.2 Overview of Reports in SAP Business ByDesign... 12 2.3 Reports
Using the Prime Performance Manager Web Interface
 3 CHAPTER Using the Prime Performance Manager Web Interface The following topics provide information about using the Cisco Prime Performance Manager web interface: Accessing the Prime Performance Manager
My Sysco Reporting Job Aid for CMU Customers. My Sysco Reporting. For CMU Customers (Serviced by Program Sales)
") My Sysco Reporting For CMU Customers (Serviced by Program Sales) 1 Accessing My Sysco Reporting... 2 Logging In... 2 The Reporting Dashboard... 3 My Sysco Reporting Process... 6 Generating a Report...
My Sysco Reporting For CMU Customers (Serviced by Program Sales) 1 Accessing My Sysco Reporting... 2 Logging In... 2 The Reporting Dashboard... 3 My Sysco Reporting Process... 6 Generating a Report...
Case Status Alerts User Guide
 Case Status Alerts User Guide Keeping You Informed with Proactive Notifications Issue: 1.1 Date: July 20, 2017 2017 Avaya Inc. All Rights Reserved. Avaya and the Avaya logo are trademarks of Avaya Inc.
MAX Data 1.1 Installation and Setup Guide. November _A0
 MAX Data 1.1 Installation and Setup Guide November 2018 215-13646_A0 doccomments@netapp.com 2 Contents Deciding whether to use this guide... 4 Understanding the MAX Data components... 5 Setup overview...
Quick Start Guide Infusient
 Alchemy Enterprise Portal for CA AutoSys Quick Start Guide Infusient Infusient CA Elite ESP Partner 578 Washington Blvd. Suite 233 Marina del Rey, CA 90292 Tel: (310) 694-5046 Fax: (310) 820-0969 Sales:
Bill Analyser User Guide
 Bill Analyser User Guide emobile.ie/business Contents 1.0 Basic Concepts... 3 1.1 Users and Roles... 3 Standard Users... 3 Global Users... 3 eircom User Roles... 3 Available user roles... 3 1.2 Data Structure...
Data Protection Guide
 SnapCenter Software 4.0 Data Protection Guide For Microsoft Exchange Server March 2018 215-12936_C0 doccomments@netapp.com Table of Contents 3 Contents Deciding whether to read the SnapCenter Data Protection
This section contains context-sensitive Online Help content for the Web Client > Dashboard tab.
 This section contains context-sensitive Online Help content for the Web Client > tab. Summary, page 1 Network, page 6 Storage, page 9 Compute, page 15 Summary The intent of the Summary dashboard is to
DNS Server Status Dashboard
 The Cisco Prime IP Express server status dashboard in the web user interface (web UI) presents a graphical view of the system status, using graphs, charts, and tables, to help in tracking and diagnosis.
ONTAP 9 Cluster Administration. Course outline. Authorised Vendor e-learning. Guaranteed To Run. DR Digital Learning. Module 1: ONTAP Overview
 ONTAP 9 Cluster Administration Course Code: Duration: 3 Days Product Page: https://digitalrevolver.com/product/ontap-9-cluster-administration-2/ This 3-day, instructor led course uses lecture and hands-on
Heart and Stroke Foundation CIRCUlink
 Heart and Stroke Foundation CIRCUlink APPLICANT USER GUIDE How to submit a Grant-in-Aid application online Page 1 Contents Heart and Stroke Foundation CIRCUlink... 1 APPLICANT USER GUIDE... 1 How to submit
SM L04 Veritas Operations Manager Advanced 4.0 RU1: Optimize Your Heterogeneous Storage Environment Hands-On Lab Description
 SM L04 Veritas Operations Manager Advanced 4.0 RU1: Optimize Your Heterogeneous Storage Environment Hands-On Lab Description Veritas Operations Manager Advanced (VOM Advanced) is a comprehensive discovery
Data Protection Guide
 SnapCenter Software 2.0 Data Protection Guide For Windows File Systems January 2017 215-11356_A0 doccomments@netapp.com Table of Contents 3 Contents Deciding whether to read this information... 5 SnapCenter
F5 Analytics and Visibility Solutions
 Agility 2017 Hands-on Lab Guide F5 Analytics and Visibility Solutions F5 Networks, Inc. 2 Contents: 1 Class 1: Introduction to F5 Analytics 5 1.1 Lab Environment Setup.......................................
IBM Security QRadar Deployment Intelligence app IBM
 IBM Security QRadar Deployment Intelligence app IBM ii IBM Security QRadar Deployment Intelligence app Contents QRadar Deployment Intelligence app.. 1 Installing the QRadar Deployment Intelligence app.
WhatsUp Gold Wireless v16.4
 WhatsUp Gold Wireless v16.4 Contents Welcome to WhatsUp Gold Wireless Wireless Overview... 1 Wireless accessibility... 3 Using WhatsUp Gold Wireless Discovering wireless devices... 4 Modifying wireless
IBM Infrastructure Suite for z/vm and Linux: Introduction IBM Tivoli OMEGAMON XE on z/vm and Linux
 IBM Infrastructure Suite for z/vm and Linux: Introduction IBM Tivoli OMEGAMON XE on z/vm and Linux August/September 2015 Please Note IBM s statements regarding its plans, directions, and intent are subject
Data Protection Guide
 SnapCenter Software 4.0 Data Protection Guide For VMs and Datastores using the SnapCenter Plug-in for VMware vsphere March 2018 215-12931_C0 doccomments@netapp.com Table of Contents 3 Contents Deciding
SPHOL3220: Overview of IT Professional Features in SharePoint Server 2013
 2013 SPHOL3220: Overview of IT Professional Features in SharePoint Server 2013 Hands-On Lab Lab Manual This document is provided as-is. Information and views expressed in this document, including URL and
VMware vsphere 5.5: Install, Configure, Manage Lab Addendum. Lab 3: Configuring VMware ESXi
 VMware vsphere 5.5: Install, Configure, Manage Lab Addendum Lab 3: Configuring VMware ESXi Document Version: 2014-07-08 Copyright Network Development Group, Inc. www.netdevgroup.com NETLAB Academy Edition,
Release Notes Savision Live Maps for Microsoft System Center Operations Manager
 Release Notes Savision Live Maps 10.0.1 for Microsoft System Center Operations Manager Contents 1. Introduction... 3 1.1 About this document... 3 2. Release Information... 3 3. New Features... 4 4. Fixed
DOWNLOAD PDF SQL SERVER 2012 STEP BY STEP
 Chapter 1 : Microsoft SQL Server Step by Step - PDF Free Download - Fox ebook Your hands-on, step-by-step guide to building applications with Microsoft SQL Server Teach yourself the programming fundamentals
Luxor CRM 2.0. Getting Started Guide
 Luxor CRM 2.0 Getting Started Guide This Guide is Copyright 2009 Luxor Corporation. All Rights Reserved. Luxor CRM 2.0 is a registered trademark of the Luxor Corporation. Microsoft Outlook and Microsoft
Level 3 SM Enhanced Management - FAQs. Frequently Asked Questions for Level 3 Enhanced Management
 Level 3 SM Enhanced Management - FAQs Frequently Asked Questions for Level 3 Enhanced Management 2015 Level 3 Communications, LLC. All rights reserved. 1 LAYER 3: CONVERGED SERVICES 5 Where can I find
HTTP Errors User Guide
 Version 3.8 Published: 2016-03-28 Copyright 2016, Cisco Systems, Inc. Americas Headquarters Cisco Systems, Inc. 170 West Tasman Drive San Jose, CA 95134-1706 USA http://www.cisco.com Tel: 408 526-4000
ABA Advantage Web Portal User Guide
 ABA Advantage Web Portal User Guide Table of Contents 1.0 Signing in... 1 2.0 Clients... 2 2.1 Clients Status... 4 2.2 Viewing a Client... 5 Client Status... 6 Case Info... 8 3.0 Creating a Treatment
Cluster Management Workflows for OnCommand System Manager
 Clustered Data ONTAP 8.3 Cluster Management Workflows for OnCommand System Manager February 2016 215-10887_A0 doccomments@netapp.com Updated for 8.3.2 Table of Contents 3 Contents Contents of the Workflow
Center For Emergency Response and Public Safety
 Student Login Instructions Welcome to CERPS (the Center for Emergency Response ), your online learning portal for the Ontario Fire Service. These instructions will help you to log into your online course
SAFe Reports Last Update: Thursday, July 23, 2015
 SAFe Reports Last Update: Thursday, July 23, 2015 This document describes the set of reports provided by Jazz Reporting Service (JRS) aligned with SAFe (Scaled Agile Framework) metrics. Some of these reports
Precise for BW. User Guide. Version x
 Precise for BW User Guide Version 9.8.0.x 2 Precise for BW User Guide Copyright 2018 Precise Software Solutions, Inc. All rights reserved. Precise for BW User Guide version 9.8.0.x Document release version
Comodo One Software Version 3.3
 rat Comodo One Software Version 3.3 Patch Management Module Administrator Guide Guide Version 2.2.101316 Comodo Security Solutions 1255 Broad Street STE 100 Clifton, NJ 07013 Table of Contents 1 Introduction
Deposit Wizard TellerScan Installation Guide
 Guide Table of Contents System Requirements... 2 WebScan Overview... 2 Hardware Requirements... 2 Supported Browsers... 2 Driver Installation... 2 Step 1 - Determining Windows Edition & Bit Count... 3
Lightpath Hosted Voice
 Lightpath Hosted Voice CONTENTS 1 Call Queuing User Guide for Business Group Administrators...1 1.1 How Call Queuing works...1 1.1.1 Multi Line Hunt Group... 1 1.1.2 Call Queuing... 2 1.1.3 Getting Started
Getting Started with Outlook Web App (OWA)
") Getting Started with Outlook Web App (OWA) Office 365 User Guide When first accessing your new Office 365 account, or if you are having any issues with your regular email client, use the below directions
Getting Started with Outlook Web App (OWA) Office 365 User Guide When first accessing your new Office 365 account, or if you are having any issues with your regular email client, use the below directions
OnCommand Insight 7.1 Planning Guide
 OnCommand Insight 7.1 Planning Guide NetApp, Inc. 495 East Java Drive Sunnyvale, CA 94089 U.S. Telephone: +1 (408) 822-6000 Fax: +1 (408) 822-4501 Support telephone: +1 (888) 463-8277 Web: www.netapp.com
vrealize Hyperic Monitoring and Management Guide vrealize Hyperic 5.8.4
 vrealize Hyperic Monitoring and Management Guide vrealize Hyperic 5.8.4 You can find the most up-to-date technical documentation on the VMware website at: https://docs.vmware.com/ If you have comments
What s Inside: MemberView Report User Guide: Page MemberXP (Permission to reprint for internal training only.) Rev.8.17
 Rev.8.17") What s Inside: Logging In... 2 Updating your Profile... 3 Dashboard... 4 Question types... 6 Generating Reports... 7 Entire Team Summary... 10 Entire Team Detail... 12 Surveys and Comments... 14 Scorecard...
What s Inside: Logging In... 2 Updating your Profile... 3 Dashboard... 4 Question types... 6 Generating Reports... 7 Entire Team Summary... 10 Entire Team Detail... 12 Surveys and Comments... 14 Scorecard...
Managing the Web Interface
 3 CHAPTER The Cisco Prime Performance Manager web interface is the primary method for displaying network reports and managing network devices and information. The following topics tell you how to launch
Concierge OneSource eprocurement
 Concierge OneSource eprocurement GENERAL INSTRUCTIONS Instructional Guide: Member Support Login Logout Dashboard Member Support Monday - Friday 7:00 A.M. 7:00 P.M. EST Need Help? Click Submit Case Link
Emergency flow improvement tool: user guide
 Emergency flow improvement tool: user guide September 2017 Contents What is the emergency flow improvement tool?... 1 Accessing and navigating the flow tool... 2 Emergency flow improvement tool tab...
OnCommand Insight 7.2
 OnCommand Insight 7.2 Planning Guide for the Java UI March 2016 215-10395_A0 doccomments@netapp.com Table of Contents 3 Contents OnCommand Insight Plan features... 5 OnCommand Insight product portfolio...
Quantum 3.2 Software. User Manual
 Quantum 3.2 Software User Manual Contents Quantum Vue 1 Main Dashboard 2 How much energy am I saving system-wide? Do I have any system alerts? How can I view/edit scheduled events? Energy 4 How do I view
TapRooT VI Software Quick Start Guide
 TapRooT VI Software Quick Start Guide TapRooT Technical Support: Monday Friday: 7am 6pm EST Phone: 011 (865) 357-0080 Email: support@taproot.com Copyright 2016 by System Improvements, Inc., Knoxville,
Red Hat CloudForms 4.0 Monitoring, Alerts, and Reporting
 Red Hat CloudForms 4.0 Monitoring, Alerts, and Reporting Creating and managing reports, feeds, and widgets in CloudForms Management Engine Red Hat CloudForms Documentation Team Red Hat CloudForms 4.0
vrealize Automation Management Pack 2.0 Guide
 vrealize Automation Management Pack 2.0 Guide This document supports the version of each product listed and supports all subsequent versions until the document is replaced by a new edition. To check for