SIMULATION AND ANALYSIS OF ARTERIAL TRAFFIC OPERATIONS ALONG THE US 61 CORRIDOR IN BURLINGTON, IOWA FINAL REPORT
|
|
|
- Ruby Barber
- 6 years ago
- Views:
Transcription
1 SIMULATION AND ANALYSIS OF ARTERIAL TRAFFIC OPERATIONS ALONG THE US 61 CORRIDOR IN BURLINGTON, IOWA FINAL REPORT Principal Investigator Tom Maze Principal Contributor Ali Kamyab Sponsored by the Engineering Division of the Iowa Department of Transportation Preparation of this report was financed in part through funds provided by the Iowa Department of Transportation through its research management agreement with the Center for Transportation Research and Education. CTRE Management Project Center for Transportation Research and Education Iowa State University Iowa State University Research Park 2625 North Loop Drive, Suite 2100 Ames, IA Telephone: Fax: October 1998
2 TABLE OF CONTENTS LIST OF TABLES... v LIST OF FIGURES... vii ABSTRACT... ix INTRODUCTION... 3 PROBLEM STATEMENT... 3 SIMULATION MODELING PROCESS Data Collection Network Description Input File Development Input File Generation CORSIM Alternative Models Development CONCLUDING REMARKS INTRODUCTION BASE MODEL Traffic Data Collection ALTERNATIVE MODELS Network Optimization Signal Coordination Right Turn Bay Additions Access Control Modification Combined Improvements RESULTS CONCLUDING REMARKS iii
3 LIST OF TABLES Table 1. Controller Types Along the Burlington US 61 Corridor Table 2. Collected Traffic Volumes Throughout the Network Table 3. Access Modifications on the Burlington US 61 Corridor v
4 LIST OF FIGURES Figure 1. A Segment of the Case Study Network in Synchro... 6 Figure 2. Synchro Lane Data Input Window... 7 Figure 3. Synchro Traffic Volumes Input Window... 8 Figure 4. Synchro Traffic Volumes Input Window... 9 Figure 5. Synchro Actuated Signal Input Window Figure 6. CORSIM s Input File Generation Dialog Box in Synchro Figure 7. CORSIM Project Window Figure 8. Animated Case Study Network in TRAFVU Figure 9. Network Level of Service Comparison Figure 10. Network Total Signal Delay and Average Speed Comparison Figure 11. Corridor Level of Service Comparison Figure 12. Corridor Total Signal Delay and Average Speed Comparison vii
5 ABSTRACT Advancement in computer technology has made traffic simulation models more user-friendly. These models have become an integral part of traffic engineering allowing for the analysis of concepts prior to field implementation. The Center for Transportation Research and Education (CTRE) used the traffic simulation model CORSIM to access proposed capacity and safety improvement strategies for the US 61 corridor through Burlington, Iowa. The comparison between the base and alternative models allow us to evaluate the traffic flow performance under the existing conditions as well as other design scenarios. The models also provide visualization of performance for interpretation by technical staff, public policy makers, and the public. The objectives of this project are to evaluate the use of traffic simulation models for future use by the Iowa Department of Transportation (DOT) and to develop procedures for employing simulation modeling to conduct the analysis of alternative designs. This report presents both the findings of the US 61 evaluation and an overview of model development procedures. The first part of the report includes the simulation modeling development procedures. The simulation analysis is illustrated through the Burlington US 61 corridor case study application. Part I is not intended to be a user manual but simply introductory guidelines for traffic simulation modeling. Part II of the report evaluates the proposed improvement concepts in a side by side comparison of the base and alternative models. ix
6 PART I Traffic Simulation Modeling Development Procedures 1
7 INTRODUCTION Computer simulation is a powerful technique for testing the impact of changes in system parameters where the effect of such changes cannot be determined analytically. It is also an appropriate tool for traffic experiments where similar field experiments are impractical. Simulation models are designed to duplicate the operation of an actual system over time. By simulating the functional characteristics of a system, these models are used to predict system performance for a variety of input scenarios. Simulation models can be classified into generic tools and application-specific models. Traffic simulation models, which are tailored to only vehicular traffic on surface street and freeway networks, fall into the latter category. They provide information about the network that otherwise could not be determined without significant infrastructure or disruption of traffic flow. There are a number of traffic simulation models, but none as widely validated and used as NETSIM. NETSIM represents traffic movements on local street networks. Its companion model, FRESIM, follows the same concept in modeling traffic operation on freeways. These models are available in an integrated simulation tool known as CORSIM. CORSIM was developed under FHWA sponsorship. It predicts operational performance of an integrated system consisting of local streets and freeways. The integration of the two models enables CORSIM to capture, for example, effects of a freeway ramp spill-over onto a local street and to measure delay on adjacent streets as a result of traffic re-routing due to a freeway incident. The first part of the report describes the procedures for employing CORSIM to conduct the analysis of alternative designs along the case study US 61 corridor. It introduces the traffic simulation modeling to traffic engineers as an improved process for examining the changes in traffic operational performance as a result of improvements in traffic control or facility geometry. PROBLEM STATEMENT The US 61 corridor through Burlington, Iowa, is a four-lane divided roadway with nine signalized intersections (four fully actuated and five semi actuated), good access control, and a frontage road system. During the peak hours, the corridor operates under moderate traffic flow with no serious congestion. However, vehicles experience excessive delay at intersections due to lack of signal coordination. Permissive left turns during the high school s afternoon dismissal also create an unsafe situation on the corridor. Moreover, the proximity of frontage road intersections to the corridor s signalized intersections results in an overlap queues. The Iowa Department of Transportation s (Iowa DOT) Engineering Division has requested an examination of strategies for improving the capacity and safety of the facility. Specifically, the Iowa DOT has asked that the following improvement strategies be considered as part of this examination: 3
8 Signal optimization Signal coordination Right lanes additions at all intersections Restricted access control SIMULATION MODELING PROCESS The evaluation begins with the development of a base model. The model simulates traffic operations throughout the facility under current traffic conditions. It is recommended that the base model output be compared to the collected field traffic data to make sure that the model represents the existing conditions of the simulated traffic facility. An alternative model can then be built by modifying the base model and incorporating the desired improvement strategy. The following steps describe the general procedures to model traffic operations at the case study corridor: 1. Data Collection The required data to generate the basic CORSIM input files are organized into three categories: supply, demand, and control. Supply data include geometric and traffic characteristics of the network. Number of lanes, lengths of turn bays of approaches to signalized intersections, and distances between intersections can be obtained from aerial photos. Additional field inspection may be required to determine lane widths, grade for each approach, and area type. Demand data primarily include traffic counts at local streets and major arterials and turning movement counts at major intersections throughout the network within the study zone. These data can be obtained through automated traffic recorders and tube counts and/or can be collected manually using counter boards. Recent traffic and turning movement counts collected by local agencies are also useful. These data can be updated by factoring in the current traffic growth. The control data consist of signal timing specifications at intersections. The control data can be obtained from local agencies and field observation. Information needed for signal controls include signal type (pre-timed, semi-actuated, fully actuated), phase plan, detector types and locations, and other applicable information. 2. Network Description The next step in defining input data files for CORSIM is describing the geometry of the network. CORSIM uses the concept of links and nodes to define a traffic network. Links are streets or freeways, and nodes are usually the intersection of two or more links. The network should be laid out using the distances between intersections, number of lanes, and other data obtained from the field and local agencies. 4
9 3. Input File Development CORSIM s input file consists of a sequence of record types. Each record, also called a card, carries a specific set of data. These cards enable CORSIM to model the traffic operations of the case study network. The input file is a text file which can be edited with most available word processors. The manual development of CORSIM s input file is a cumbersome job. ITRAF is an interactive computer program with a graphical interface developed to simplify and speed up the task of creating the input files. Because of its graphical interface, ITRAF eliminates the need to remember and understand record types, thus greatly reducing the chances of making errors during manual input data entry process. Although, ITRAF carries a few internal bugs and it is no longer supported by the CORSIM s developer, it is a preferred method to manual development of text input files. ITRAF generates the CORSIM s input files. When identified, input errors can be corrected using text file format. ITRAF was included in the earlier version of CORSIM. The latest version of Synchro (Synchro Professional 3.2) is the recommended software package for generating the CORSIM input file. Synchro is also a preprocessor for PASSER, TRANSYT 7F, and HCS software packages. Developed by Trafficware, Synchro is a complete software package for modeling and optimizing traffic signal timings. 5

10 3.1. Links and Nodes A traffic network can easily be created in Synchro by adding street links. Intersections are created by crossing two links. Figure 1 shows a segment of the case study network which includes the main arterial and the adjacent frontage roads. The white circle indicates a signalized intersection whereas the black dots represent unsignalized intersections. Lane data, traffic volumes, and signal timings can be entered by clicking on an intersection. Figure 1. A Segment of the Case Study Network in Synchro 6

11 3.2. Lane Data The lane data input window, shown in Figure 2, allows for input of lane group definitions, lane width, grade, area type, storage length, detector locations, and other applicable information. Lane group definitions affect how traffic is assigned between lane groups. Storage length data are used to determine potential blockage problems. Figure 2. Synchro Lane Data Input Window 7

12 3.3. Traffic Volumes The volumes input window, shown in Figure 3, requires traffic volumes for each movement at an intersection, peak hour factor, growth factor, percent of heavy vehicles, and other related information. Synchro calculates the lane utilization factors and uses that along with the volumes, peak hour factor, and growth factor to calculate the adjusted flow for each movement. Figure 3. Synchro Traffic Volumes Input Window 8
.")
13 .3.4 Signal Timings The timings window, shown in Figure 4, allows data input for signalized intersections. The input parameters include, left turn type, phase number, lead/lag assignment, minimum and maximum splits, and lost times (clearance and start-up). The assigned phase plan and splits are shown graphically by green and yellow bars at the bottom of the window. Splits can also be adjusted by holding down the computer mouse s left button and move it right or left. Synchro calculates the volume to capacity ratios for each lane group. Delays can be calculated according to either Webster or percentile delay methods. Level of service (LOS) for each lane group is then determined by the calculated stopped delay. For unsignalized intersections, the only required input data are the movements allowed for each approach (stop, yield, or no control). Figure 4. Synchro Traffic Volumes Input Window 9
, vehicle extension, recall mode, and other related information.")
14 3.5. Actuated Settings The actuated settings window, shown in Figure 5, indicates the input data needed for all actuated intersections. These data include minimum green time (same as maximum split minus yellow time), vehicle extension, recall mode, and other related information. Synchro models actuated signals under different traffic scenarios using percentile delay method. In this method, traffic volumes for each approach are adjusted up or down to model each scenario. Figure 5. Synchro Actuated Signal Input Window 10

15 4. Input File Generation The data entry for generating the CORSIM input file of the base simulation model is completed at this point. Choose Transfer from the Synchro s toolbar. The selection of CORSIM Analysis on the pull down menu opens up the Perform CORSIM Analysis dialog box shown in Figure 6. Enter the location of the CORSIM program (normally c:\tsis4\tsis.exe) in the TSIS Program Location box. Enter the path of the CORSIM input file in the Data Filename box. By default, Synchro generates an input file for CORSIM in the current path and under the same file name. Click on the Make TRF File button and a CORSIM input file is generated in the designated directory. Figure 6. CORSIM s Input File Generation Dialog Box in Synchro 11
 and click on the CORSIM icon (the one with FHWA logo).")
16 5. CORSIM Start CORSIM by executing the tsis.exe file. Create a project in the directory with the generated CORSIM input file. Figure 7 shows the screen after the project is opened. Click on the generated input file (the file with a trf extension) and click on the CORSIM icon (the one with FHWA logo). This process generates a lengthy output file (the file with an out extension) which can be viewed by double clicking on the file. It also creates an animation file which can be viewed in TRAFVU. Highlight the input file and click on the TRAFVU icon located on the toolbar to view the animation file. Figure 7. CORSIM Project Window 12

17 TRAFVU is an interactive graphics processor designed to display and animate the results of CORSIM models. TRAFVU allows for a side by side visual comparison. TRAFVU is suitable for traffic operations analysis as well as the presentation of before-and-after studies to convince the audience of the utility of simulation results. Figure 8 presents a TRAFVU display of a section of the simulated case study network. Figure 8. Animated Case Study Network in TRAFVU 6. Alternative Models Development Once a base model is developed, it can be modified to model the proposed improvement strategies. The proposed improvement strategies such as optimizing signal timings or adding right lanes can be implemented in the base model by optimizing the case study network or adding exclusive right lanes at designated intersections in the Synchro environment. Follow the procedures described in steps 4 and 5 to create the alternative models. The effectiveness of the implemented strategies in reducing traffic delay and other applicable measures of effectiveness (MOE) can be evaluated by comparing results of the base and alternative models. Both Synchro and CORSIM provide several MOEs, including delay, emission, and fuel consumption. Synchro is a macroscopic model whereas CORSIM is a microscopic model. Traffic flow modeling in macroscopic models are based on fundamental flow-density-speed relationships. Microscopic models, on the other hand, consider individual vehicle interactions to model traffic flows. The car-following and lane-changing algorithms have made microscopic models more reliable in calculating delay in traffic spill-over and blocking conditions. However, both models would be appropriate for comparing different alternatives in relative terms. 13
18 CONCLUDING REMARKS The simulation model may provide results which are not identical to the observed system. The purpose of model validation is to determine if the model replicates the actual system at an acceptable level of confidence. It is a good practice to compare simulation results to the real system to validate the obtained results. The comparison of the field data with the model's outputs establishes a level of confidence that the model is capable of simulating the existing conditions at the case study traffic facility. The purpose of this document is to introduce traffic engineers to an improved process for examining the changes in traffic operational performance. Both Synchro and CORSIM provide comprehensive users manuals which explain traffic network modeling procedures in detail. 14
19 PART II Improvement Strategies Evaluation of US 61 Corridor 15
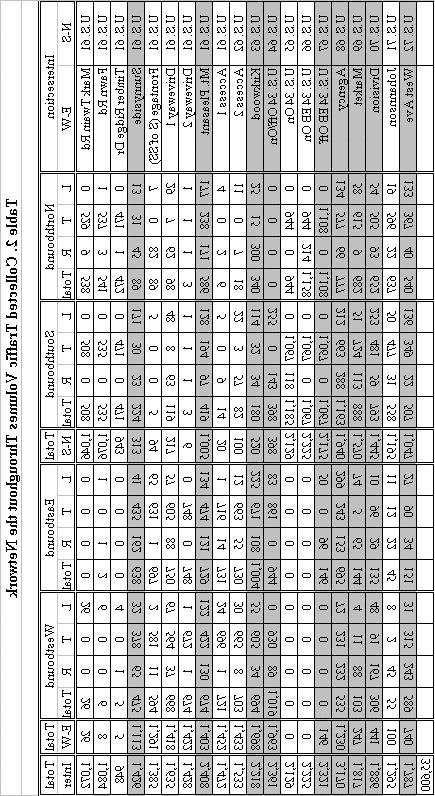
20 INTRODUCTION The Iowa DOT s Engineering Division has requested that CTRE use the US 61 corridor in Burlington, Iowa, as an example of the use of traffic simulation methods. Using the corridor as a case study, concepts believed to increase capacity and improve safety were examined through the use of simulation. CTRE developed several simulation models of the traffic network using CORSIM. These models represent traffic operations at the facility under the existing conditions as well as proposed improvement strategies. This part of the report describes each model and presents the obtained results. BASE MODEL The base model represents the current traffic operations for the US 61 corridor in Burlington. It was developed by following the procedures described in the first part of this report. US 61 is a north-south corridor through the City of Burlington, Iowa, which connects nine signalized intersections. There are a number of unsignalized intersections throughout the case study network which have been included in the model. Table 1 includes the traffic control type for each intersection along the corridor. Table 1. Controller Types Along the Burlington US 61 Corridor Intersecting Street Sunnyside Avenue Mt. Pleasant Avenue Kirkwood Avenue U.S. 34 Westbound On/Off Ramp U.S. 34 Eastbound Off Ramp Agency Street Market Street Division West Avenue Control Type Actuated Actuated Semi-Actuated Semi-Actuated Semi-Actuated Actuated Semi-Actuated Semi-Actuated Actuated Traffic Data Collection Traffic volumes were collected manually and using a video imaging system. In this study, traffic volumes were collected over a period of three days during the morning peak (7-9 AM), noon peak (12-2 PM), and the afternoon peak (4-6 PM). Traffic volumes and turning movements were recorded at each intersection along the network during at least one peak period. Because data were not collected at all locations at the same time, the data collected may not exactly represent the actual volumes at any single time for the entire network. For example, data collected at 8:00 AM Friday for the intersection of US 61 and West Avenue showed 637 vehicles per hour travelling north from the intersection of West Avenue to the intersection of Johannsen Avenue. 17
21 Data for the US 61 and Johannsen Avenue intersection, however, were collected at 8:00 AM the preceding Thursday and only showed 401 vehicles travelling into the intersection from West Avenue. To balance volumes throughout the network, the US 61 and Agency Avenue intersection was selected as the reference intersection. Data recorded at this intersection on Thursday, July 16, 1998 from 4:00 to 5:00 PM indicates the highest observed traffic volumes along the corridor. Traffic volumes at all other intersections were adjusted accordingly using the available turning movement percentages throughout the network. Table 2 presents the adjusted volumes for all intersections throughout the network on the Thursday afternoon peak period. The highlighted records in Table 2 are the signalized intersections. 18
22 19
23 Because the number of intersections that could be observed at one time with the video detection equipment was limited by the number of systems available, data were collected at inconsistent periods of the day resulting in the potential for errors. Simulation modeling of a network requires area wide data collection conducted simultaneously. Tube counts would have been a better choice for data collection to support traffic simulation modeling at the network level. In this study, all traffic volumes were increased by 15 percent to emulate the observed queue backup and congestion. ALTERNATIVE MODELS Once the base model was built, five other models representing alternative solutions were built by modifying the base model. The last three alternative models were optimized and coordinated in addition to other implemented improvements. Network Optimization The splits and cycle lengths of all signalized intersections throughout the case study network were optimized under the existing conditions using Synchro. Synchro minimizes stops and delays which is similar to the TRANSYT 7F s signal timing technique. Signal Coordination The five semi-actuated controllers were changed to full-actuated controllers along the case study corridor. All nine full-actuated intersections were coordinated by optimizing the corridor cycle lengths and offsets using Synchro. Right Turn Bay Additions Right turn bays were added at designated intersections. These bays were added at intersections with high volumes of right turning traffic to alleviate congestion in the through lanes. The bays were assumed to be 150 feet long and 12 feet wide. The signals along the corridor were optimized and coordinated. Access Control Modification This alternative model includes the proposed modification to the existing access control along the corridor. The signals along the corridor were also optimized and coordinated. There were eight areas of modification which are presented in Table 3. 20
24 Table 3. Access Modifications on the Burlington US 61 Corridor Intersecting Street Frontage road access south of Sunnyside Second driveway access north of Mt. Pleasant First frontage road access south of Mt. Pleasant Second frontage road access south of Mt. Pleasant Modification No left turns from eastbound or westbound approaches Extend frontage road east of US 61 north to Sunnyside No left turns from westbound approach No left turns from southbound approach Extend west frontage road north to Mt. Pleasant past Days Inn No left turns from eastbound or westbound approaches No left turns from eastbound or westbound approaches Kirkwood Avenue Frontage road west of US 61 pushed back 90 feet to a distance of 185 feet from intersection of US 61 and Kirkwood Market Street Frontage road west of US 61 pushed back 80 feet to a distance of 171 feet from intersection of US 61 and Market Division Frontage road west of US 61 pushed back 80 feet to a distance of 171 feet from intersection of US 61 and Division Johannsen No left turns from eastbound or westbound approaches 21
25 Combined Improvements The last alternative model includes all proposed improvement strategies (i.e., right and left lane additions, access control modification, signal coordination). The signals along the corridor were optimized and coordinated. RESULTS The effectiveness of the proposed improvement strategies is evaluated by comparing the five alternative models to the base model. The models are compared in terms of intersection levels of service (LOS), signal delays, and average traveling speeds. Figure 9 compares the resulting intersection levels of service of the six models. LOS 1 is equivalent to LOS A, which represents unimpeded traffic movement or free flow. LOS 5 is equivalent to LOS F, which represents heavy congestion and/or gridlock. The levels of service at West, Division, Ramps, and Sunnyside intersections do not indicate any changes when comparing each alternative to the base model because they currently operate under normal conditions (LOS B). There are, however, improvements in levels of service at the Market, Agency, Kirkwood, and Mt. Pleasant intersections. The base model indicates the levels of service F at Agency and Kirkwood intersections. These intersections will benefit the most by right lane additions throughout the network. As shown in Figure 9, the access modifications improve the levels of service but not as significantly as adding the right turn lanes. Adding right lanes at the intersections has direct impact on reducing signal delays which are the key factors for the LOS determinations. Accesses, on the other hand, were modified mainly at driveways and unsignalized intersections along the corridor which would have impact on improving safety and delay at these access points. Moreover, combining all improvement strategies does not improve the levels of service as much as adding right turn lanes. Adding right lanes provides better overall levels of service than combining all improvement strategies. This is an indication that perhaps the selected accesses are not the best locations in need of treatments. Other access control strategies could prove to be more effective in improving levels of service at the intersections. 22
26 LOS West Division Market LOS Agency EB Off Ramp WB on/off LOS Kirkwood Mt. Pleasant Sunnyside Existing Network Coordinate Right Access All Figure 9. Network Level of Service Comparison 23
27 Figure 10 compares the network total signal delay and average speed resulting from the base and alternative models. As signal delay decreases, the average speed increases. It is again apparent that adding the right turn bays decreases the signal delay and increases average speed more significantly than the other alternatives Hour Signal Delay Mile per Hour Speed Existing Network Coordinate Right Access All Figure 10. Network Total Signal Delay and Average Speed Comparison In order to evaluate the effectiveness of signal coordination in reducing delay and improving speed along the corridor, the frontage road system and adjacent intersections on minor streets were eliminated from the base model. Figure 11 compares the levels of service along the corridor between the corridor s base and coordinated models. This Figure shows that signal coordination improves levels of service at the Agency and Kirkwood intersections. The Agency intersection carries the highest traffic volume among the intersections on the corridor. Figure 12 compares the corridor total signal delay and average speed. It is apparent that coordinating signals decreases total signal delay and increases average speed. 24
28 LOS Existing Coordinate 1 0 West Division Market Agency EB Off Ramp WB on/off Kirkwood Mt. Pleasant Sunnyside Figure 11. Corridor Level of Service Comparison Signal Delay (hour) Existing Coordinate Speed (mph) Figure 12. Corridor Total Signal Delay and Average Speed Comparison CONCLUDING REMARKS Among the proposed improvement strategies, the right lane additions model indicates the most significant improvement in reducing delay throughout the network. Network signal optimization and coordination models both prove to be beneficial at enhancing traffic flow operations throughout the network. Because of the cost and time involved with adding right lanes and modifying access control, optimizing and coordinating the signals could serve as an interim solution before conducting other improvement strategies. The alternative models included in this report indicate only a sample of feasible improvement strategies. There are many other improvement strategies which could be examined in different 25
29 models. For example, new models can be built for different access control, signal control, and signal coordination strategies. Coordinatability factors (CF), provided by Synchro, is helpful in the modeling of different signal coordination strategies. Intersections with high CFs are recommended for signal coordination. It may be more cost effective to coordinate only the best candidate intersections. The Coordinatability factors measure the desirability of coordinating the intersections in Synchro. Travel time between intersections is the most important element in determination of the CFs. TRAFVU, the animation component of CORSIM, is another excellent source for detecting problem locations throughout the network. Left lane blockage by through lanes, malfunctioning signals, queue spill-over conditions, and other problems can easily be detected by watching traffic movements throughout the network in TRAFVU. Solutions for these type of problems include the modification of signal timings and/or the extension of left turn lanes. 26
ENHANCED PARKWAY STUDY: PHASE 3 REFINED MLT INTERSECTION ANALYSIS
 ENHANCED PARKWAY STUDY: PHASE 3 REFINED MLT INTERSECTION ANALYSIS Final Report Prepared for Maricopa County Department of Transportation Prepared by TABLE OF CONTENTS Page EXECUTIVE SUMMARY ES-1 STUDY
Microscopic Traffic Simulation Model Calibration & Validation
 Tutorial: Microscopic Traffic Simulation Model Calibration & Validation June 27, 2006 Instructors: Byungkyu (Brian) Park, Ph.D. Jongsun Won AGENDA Time 9:30 ~ 10:00 10:10 ~ 11:45 11:45 ~ 1:00 1:00 ~ 2:20
CORSIM User's Guide. Version 6.0
 CORSIM User's Guide Version 6.0 Prepared by: ITT Industries, Inc., Systems Division ATMS R&D and Systems Engineering Program Team P O Box 15012 Colorado Springs, CO 80935-5012 Prepared for: FHWA Office
An Analysis of TDM Impacts on a Corridor Segment Research Findings
 An Analysis of TDM Impacts on a Corridor Segment Research Findings Phil Winters, CUTR TDM Program Director Liren Zhou, Graduate Research Assistant Sachin Rai, ITS Research Associate Nevine Georggi, TDM
Traffic Impact Analysis Shotwell Road Residential Clayton, NC
 Shotwell Road Residential Clayton, NC TABLE O CONTENTS 1. INTROUCTION...1 1.1. Site Location and Study Area...1 1.2. Proposed Land Use and Site Access...2 1.3. Adjacent Land Uses...2 1.4. Existing Roadways...2
APPENDIX E TRANSPORTATION
 APPENDIX E TRANSPORTATION 2011 PATRON SURVEYS VISSIM MODEL CALIBRATION AND VALIDATION Environmental and Planning Consultants 440 Park Avenue South 7th Floor New York, NY 10016 tel: 212 696-0670 fax:
CITY OF KIRKLAND TRAFFIC IMPACT ANALYSIS GUIDELINES
 CITY OF KIRKLAND TRAFFIC IMPACT ANALYSIS GUIDELINES SEPA TRANSPORTATION CONCURRENCY - ROAD IMPACT FEES Introduction Revised February 2004 These guidelines describe how to prepare a traffic study, or Traffic
TRAFFIC FLOW SIMULATION USING CORSIM
 Proceedings of the 2000 Winter Simulation Conference J. A. Joines, R. R. Barton, K. Kang, and P. A. Fishwick, eds. TRAFFIC FLOW SIMULATION USING CORSIM Larry E. Owen Yunlong Zhang Lei Rao Intelligent Transportation
National Roundabout Conference 2005 DRAFT High-Capacity Roundabout Intersection Analysis: Going Around in Circles David Stanek, PE & Ronald T. Milam,
 High-Capacity Roundabout Intersection Analysis: Going Around in Circles David Stanek, PE & Ronald T. Milam, AICP TRB National Roundabout Conference May 24, 2005 Vail, CO Presentation Overview What is a
Synchro Studio 9. with Warrants and TripGen 2014 Getting Started and What s New in Version 9
 Synchro Studio 9 with Warrants and TripGen 2014 Getting Started and What s New in Version 9 Table of Contents CHAPTER 1 INTRODUCTION...1-1 LICENSE OPTIONS... 1-1 DEMO VERSIONS... 1-1 Synchro... 1-1 SimTraffic...
ESTIMATING PARAMETERS FOR MODIFIED GREENSHIELD S MODEL AT FREEWAY SECTIONS FROM FIELD OBSERVATIONS
 0 ESTIMATING PARAMETERS FOR MODIFIED GREENSHIELD S MODEL AT FREEWAY SECTIONS FROM FIELD OBSERVATIONS Omor Sharif University of South Carolina Department of Civil and Environmental Engineering 00 Main Street
Cedar Rapids ITS Deployment Project
 Cedar Rapids ITS Deployment Project Concept of Operations July 29, 2011 Table of Contents Section 1 Introduction Purpose Goal of ITS Deployments Section 2 Needs Assessment General Background Stakeholders
FINAL REPORT THE FLORIDA DEPARTMENT OF TRANSPORTATION SYSTEMS PLANNING OFFICE. on Project. Improvements and Enhancements to LOSPLAN 2007
 FINAL REPORT to THE FLORIDA DEPARTMENT OF TRANSPORTATION SYSTEMS PLANNING OFFICE on Project Improvements and Enhancements to LOSPLAN 2007 FDOT Contract BD-545-84, (UF Project 00067828) Part A: Software
Calipatria Solar Farm TIA
 Calipatria Solar Farm TIA Prepared for: 7SM 8ME, LLC 71SM 8ME, LLC c/o 8minutenergy Renewables LLC Prepared by: Fehr & Peers March 25, 211 IE1-37 TABLE OF CONTENTS Executive Summary... i Project Trip Estimates...
VARIATIONS IN CAPACITY AND DELAY ESTIMATES FROM MICROSCOPIC TRAFFIC SIMULATION MODELS
 VARIATIONS IN CAPACITY AND DELAY ESTIMATES FROM MICROSCOPIC TRAFFIC SIMULATION MODELS (Transportation Research Record 1802, pp. 23-31, 2002) Zong Z. Tian Associate Transportation Researcher Texas Transportation
McTrans. McByte FLORIDA UNIVERSITY OF. TSIS-CORSIM 6.0 Release is Imminent. Analyzing Congested Signalized Intersections. McTrans
 McTrans M o v i n g T e c h n o l o g y Volume 34 January 2006 Newsletter Analyzing Congested Signalized Intersections TSIS-CORSIM 6.0 Release is Imminent In the typical signalized intersection capacity
APPENDIX D. Traffic Impact Analysis
 APPENDIX D Traffic Impact Analysis TRAFFIC IMPACT ANALYSIS CALEXICO SOLAR FARM I County of Imperial, California July 8, 2011 LLG Ref. 3-11-2034 Prepared by: Cara Leone Transportation Planner II Under the
STUDY REPORT #1 ADDENDUM
 STUDY REPORT #1 ADDENDUM 1.0 PURPOSE OF ADDENDUM This document is an addendum to Study Report #1: Sub-System Planning Alternatives. The purpose of this addendum is to bridge the gap between the initial
Performance Evaluation of Non-Intrusive Methods for Traffic Data Collection. Kamal Banger, Ministry of Transportation of Ontario
 Abstract Performance Evaluation of Non-Intrusive Methods for Traffic Data Collection Kamal Banger, Ministry of Transportation of Ontario Nancy Adriano, P.Eng., Ministry of Transportation of Ontario For
Microscopic Simulation Model Calibration and Validation: A Case Study of VISSIM for a Coordinated Actuated Signal System
 Park and Schneeberger 1 Microscopic Simulation Model Calibration and Validation: A Case Study of VISSIM for a Coordinated Actuated Signal System by Byungkyu "Brian" Park, Ph.D.* Research Assistant Professor
Traffic Impact Study for the TAVA Homes Project at 1584 East Santa Clara Avenue in the City of Santa Ana
 Traffic Impact Study for the TAVA Homes Project at 1584 East Santa Clara Avenue in the City of Santa Ana March 2011 Prepared for: URS Corporation 2020 E. First Street, Suite #400 Santa Ana, CA 92705 Tel:
UDOT Freeway and Traffic Signal Performance Metrics
 UDOT Freeway and Traffic Signal Performance Metrics September 26, 2016 Grant Farnsworth, PE, PTOE UDOT Traffic Mobility Engineer Kelly Burns Eric Rasband Utah Demographics Speed Report Benefit of Past
Traffic Impact Study for the Girard Winery Project
 October 16, 2014 Ms. Heather McCollister 1512 D Street Napa, CA 94559 Traffic Impact Study for the Girard Winery Project Dear Ms. McCollister; Whitlock & Weinberger Transportation, Inc. (W-Trans) has completed
Real-time Adaptive Control System. Technical White Paper. September 2012 Trafficware SynchroGreen Technical White Paper
 SynchroGreen SynchroGreen Real-time Adaptive Control System Technical White Paper Trafficware 522 Gillingham Sugar Land, Texas 77478 (281) 240-7233 sales@trafficware.com www.trafficware.com www.synchrogreen.com
OR 217,I-5 Experience Portland, OR
 OR 217,I-5 Experience Portland, OR By: Abby Caringula Parsons Brinckerhoff July 8th, 2011 Presentation Outline Background VISUM Network Adjustment Model Origin-Destination(O-D) Demand Development ANM Export
Concept Definition Report Adaptive Urban Signal Control Integration (AUSCI) Project. Executive Summary -- August 1995
 Project. Executive Summary -- August 1995") Executive Summary -- August 1995 This summary highlights the work performed as part of the AUSCI Concept Definition Report. Additional supporting and background material is presented in a separate document
Executive Summary -- August 1995 This summary highlights the work performed as part of the AUSCI Concept Definition Report. Additional supporting and background material is presented in a separate document
Creating transportation system intelligence using PeMS. Pravin Varaiya PeMS Development Group
 Creating transportation system intelligence using PeMS Pravin Varaiya PeMS Development Group Summary Conclusion System overview Routine reports: Congestion monitoring, LOS Finding bottlenecks Max flow
APPLICATION OF AERIAL VIDEO FOR TRAFFIC FLOW MONITORING AND MANAGEMENT
 Pitu Mirchandani, Professor, Department of Systems and Industrial Engineering Mark Hickman, Assistant Professor, Department of Civil Engineering Alejandro Angel, Graduate Researcher Dinesh Chandnani, Graduate
TRACY HILLS SPECIFIC PLAN RECIRCULATED DRAFT SUBSEQUENT ENVIRONMENTAL IMPACT REPORT VOLUME III OCTOBER 2015
 TRACY HILLS SPECIFIC PLAN RECIRCULATED DRAFT SUBSEQUENT ENVIRONMENTAL IMPACT REPORT VOLUME III OCTOBER 2015 APPENDIX H-6B CORRESPONDENCE DOCUMENTS LIVERMORE, DATED FALL 2014 Chau, Elizabeth From: Sent:
Bellevue s Traffic Adaptive Signals
 What we ll cover Bellevue s Traffic Adaptive Signals SCATS Phase 1 Implementation SCATS Operations Responsiveness New Features Some Initial Results 2011 Program and Beyond Final Thoughts ITE Quad Mtg April
King County Ombudsman Whistle-Blowers Office Complaint
 King County Ombudsman Whistle-Blowers Office Complaint Filed by: Ho-Chuan Chen, Ph.D., P.E., Supervisor, Travel Forecasting and Data Management Group (TFDM) Hossein Barahimi, Transportation Planner III,
Rural Expressway Intersection Characteristics that Contribute to Reduced Safety Performance
 Rural Expressway Intersection Characteristics that Contribute to Reduced Safety Performance Garrett D. Burchett Center for Transportation Research and Education Iowa State University 2901 South Loop Drive,
195 Hegenberger Road Hotel: Traffic Circulation Analysis in Response to Comments on the Final EIR
 350 Frank H. Ogawa Plaza Suite 300 Oakland, CA 94612 510.839.5066 phone 510.839.5825 fax www.esassoc.com Technical Memorandum date November 12, 2014 to from subject Colleen Liang, Port Associate Environmental
RITIS Training Module 10 Script. To return to the Florida Analytics main page, select Florida Analytics Tools in the upper left corner of the page.
 RITIS Training Module 10 Script Welcome to the Regional Integrated Transportation Information System or RITIS Module 10 CBT. To begin, select the start button or press Shift+N on your keyboard. To return
RITIS Training Module 9 Script
 RITIS Training Module 9 Script Welcome to the Regional Integrated Information System or RITIS Module 09 CBT. To begin, select the start button or press Shift+N on your keyboard. This training module will
Incident Location Tool 4.X. User s Manual
 Incident Location Tool 4.X User s Manual CONTENTS Contents...3 1.0 INSTALLATION and CONFIGURATION... 1 1.1 Installation Procedure... 1 1.1.1 Requirements...1 1.1.2 Setup...1 1.1.3 Restart Message... 5
Bluetooth Travel Time Technology Evaluation Using the BlueTOAD TM
 Bluetooth Travel Time Technology Evaluation Using the BlueTOAD TM E01271 PennDOT District 6-0 ITS & Support Open End Contract Work Order #1 Submitted To: Pennsylvania Department of Transportation Engineering
Using Empirical (real-world) Transportation Data to Extend Travel Demand Model Capabilities
 Transportation Data to Extend Travel Demand Model Capabilities") Portland State University PDXScholar TREC Friday Seminar Series Transportation Research and Education Center (TREC) 10-4-2013 Using Empirical (real-world) Transportation Data to Extend Travel Demand Model
Portland State University PDXScholar TREC Friday Seminar Series Transportation Research and Education Center (TREC) 10-4-2013 Using Empirical (real-world) Transportation Data to Extend Travel Demand Model
RITIS Training Module 4 Script
 RITIS Training Module 4 Script Welcome to the Regional Integrated Information System or RITIS Module 04 CBT. To begin, select the start button or press Shift+N on your keyboard. This training module will
An Analysis of TDM Impacts on a Corridor Segment
 An Analysis of TDM Impacts on a Corridor Segment Phil Winters, CUTR TDM Program Director Liren Zhou, Graduate Research Assistant Sachin Rai, ITS Research Associate Nevine Georggi, TDM Research Associate
TSIS User's Guide. Version 6.0
 TSIS User's Guide Version 6.0 Prepared by: ITT Industries, Inc., Systems Division ATMS R&D and Systems Engineering Program Team P O Box 15012 Colorado Springs, CO 80935-5012 Prepared for: FHWA Office of
Opening the New Woodrow Wilson Memorial Bridge: Planning & Implementing a Major Traffic Switch
 Opening the New Memorial : Planning & Implementing a Major Traffic Switch Scott C. Crumley, P.E., P.T.O.E. Manager March 26, 2009 1 Agenda Background The Major Milestone: Opening the New to Traffic Challenges
QUICK HELP GUIDE. Traffic Signal Management System (TSMS) Modern Traffic Analytics
 Modern Traffic Analytics") QUICK HELP GUIDE Traffic Signal Management System (TSMS) Modern Traffic Analytics www.ms2soft.cotm Table of Contents 1.0 Introduction...1 2.0 Search Types...4 3.0 Map Interactions...5 4.0 Reports...8 5.0
QUICK HELP GUIDE Traffic Signal Management System (TSMS) Modern Traffic Analytics www.ms2soft.cotm Table of Contents 1.0 Introduction...1 2.0 Search Types...4 3.0 Map Interactions...5 4.0 Reports...8 5.0
Speed Limit and Safety Nexus Studies for Automated Enforcement Locations in the District of Columbia East Capitol Street at Southern Avenue NE
 Speed Limit and Safety Nexus Studies for Automated Enforcement Locations in the District of Columbia East Capitol Street at Southern Avenue NE Study Area and Location District PSA Ward ANC Phase Description
Study Area and Location District PSA Ward ANC Phase Description G Proposed 2900 Block Military Road Northwest Eastbound
 Speed Limit and Safety Nexus Studies for Automated Enforcement Locations in the District of Columbia 29 Block Military Road NW E/B Study Area and Location District PSA Ward ANC Phase Description 2 21 3
Understanding the Potential for Video Analytics to Support Traffic Management Functions
 Understanding the Potential for Video Analytics to Support Traffic Management Functions Project Summary Slides November 2014 ENTERPRISE Program Program Goals Facilitate rapid progress in the development
Study Area and Location District PSA Ward ANC Phase Description C Existing 3500 Block Massachusetts Avenue Northwest Eastbound
 Speed Limit and Safety Nexus Studies for Automated Enforcement Locations in the District of Columbia 35 Block Massachusetts Avenue NW Study Area and Location District PSA Ward ANC Phase Description 2 24
Honorable Mayor and Members of the City Council. Memorandum of Understanding: Interstate 80 Integrated Corridor Mobility (I-80 ICM) Project
 Project") Office of the City Manager CONSENT CALENDAR May 1, 2012 To: From: Honorable Mayor and Members of the City Council Christine Daniel, Interim City Manager Submitted by: Andrew Clough, Director, Public Works
Office of the City Manager CONSENT CALENDAR May 1, 2012 To: From: Honorable Mayor and Members of the City Council Christine Daniel, Interim City Manager Submitted by: Andrew Clough, Director, Public Works
PERFORMANCE EVALUATION OF MOHAKHALI FLYOVER BY USING VISSIM SIMULATION SOFTWARE
 PERFORMANCE EVALUATION OF MOHAKHALI FLYOVER BY USING VISSIM SIMULATION SOFTWARE M. S. Mamun *, S. Mohammad, M. A. Haque & M. Y. A. Riyad Department of Civil Engineering, Ahsanullah University of Science
2/4/2008 S:\TRAFFIC\Modeling\01 Support Materials\Documents\CORSIMcal.doc CORSIM Calibration Parameters
 Last Revision: July 8, 00 The CORSIM model is a microscopic simulation model that uses car following theory based on vehicle headways. Thus the calibration parameters are related to both vehicle and driver
ROADWAY LIGHTING CURFEW
 STATE OF RHODE ISLAND AND PROVIDENCE PLANTATIONS Rhode Island Department of Transportation ROADWAY LIGHTING CURFEW IMPLEMENTATION PLAN March 25, 21 TABLE OF CONTENTS INTRUDUCTION/OVERVIEW... 1 1.1. ANTICIPATED
SPEED SURVEY ANALYSIS SYSTEM
 SPEED SURVEY ANALYSIS SYSTEM user s manual CROSSROADS SOFTWARE 210 W. Birch Street, Suite 207 Brea, CA 92821 (714) 990-6433 Fax: (714) 990-5628 www.crossroadssoftware.com Chapter One: Introducing the Speed
RHODES and Next Generation RHODES
 RHODES and Next Generation RHODES Pitu Mirchandani ATLAS Research Laboratory Arizona State University Is adaptive right for you? Panel ITE Meeting, Phoenix March 9, 2011 Acknowledgements: David Lucas,
Synchro Studio 9. with Warrants and TripGen 2014 Getting Started and What s New in Version 9
 Synchro Studio 9 with Warrants and TripGen 2014 Getting Started and What s New in Version 9 Table of Contents CHAPTER 1 INTRODUCTION... 1 1 LICENSE OPTIONS... 1 1 CHAPTER 3 INSTALLING SYNCHRO STUDIO 9...
Ioannis Psarros Department of Civil Engineering and Intermodal Freight Transportation Institute, Memphis, TN
 Ioannis Psarros Department of Civil Engineering and Intermodal Freight Transportation Institute, Memphis, TN CIVL 7904/8904: Traffic Flow Theory (Spring 2014) April 5, 2014 Transportation Research Increased
Executive Summary. City of Goodyear. Prepared for: Prepared by: November, 2008 Copyright 2008, Kimley-Horn and Associates, Inc.
 Goodyear Intelligent Transportation Systems Strategic Plan Executive Summary Prepared for: City of Goodyear Prepared by: 191376000 Copyright 2008, Kimley-Horn and Associates, Inc. I. INTRODUCTION The City
The Freeway Performance Measurement System (PeMS) (PeMS Version 3)
 (PeMS Version 3)") The Freeway Performance Measurement System (PeMS) (PeMS Version 3) Table of Contents Background Capabilities Your Feedback Appendix 1 Background What is PeMS? The Freeway Performance Measurement System
The Freeway Performance Measurement System (PeMS) (PeMS Version 3) Table of Contents Background Capabilities Your Feedback Appendix 1 Background What is PeMS? The Freeway Performance Measurement System
Site 17 W3-160 KEY: District Department of Transportation 55 M Street, SE, Suite 400 Washington, DC 20003
 Speed Limit and Safety Nexus Studies for Automated Enforcement Locations in the District of Columbia Connecticut Avenue at Calvert Street NW Study Area and Location District PSA Ward ANC Phase Description
Study Area and Location District PSA Ward ANC Phase Description D Proposed 1900 Block Foxhall Road Northwest Southbound
 Speed Limit and Safety Nexus Studies for Automated Enforcement Locations in the District of Columbia 19 Block Foxhall Road NW S/B Study Area and Location District PSA Ward ANC Phase Description 2 25 3
research report Evaluation of Driver Reactions for Effective Use of Dynamic Message Signs in Richmond, Virginia
 Final Report VTRC 10-R16 Virginia Transportation Research Council research report Evaluation of Driver Reactions for Effective Use of Dynamic Message Signs in Richmond, Virginia http:/www.virginiadot.org/vtrc/main/online_reports/pdf/10-r16.pdf
NOVEMBER department of transportation CONNECTICUT DEPARTMENT OF TRANSPORTATION. Statewide Computerized Traffic Signal Systems Needs Assessment
 department of transportation NOVEMBER 2015 CONNECTICUT DEPARTMENT OF TRANSPORTATION Statewide Computerized Traffic Signal Systems Needs Assessment EARLY DEPLOYMENT NEEDS ASSESSMENT-NOVEMBER 2015 The Connecticut
Synchro Studio. with Warrants and TripGen. Getting Started and What s New in Version 10
 Synchro Studio with Warrants and TripGen in Version 10 Synchro Studio 10, Warrants 10, & TripGen 10 Updated July 13, 2017 Table of Contents CHAPTER 1 INTRODUCTION... 1-2 LICENSE OPTIONS... 1-2 READER
Study Area and Location District PSA Ward ANC Phase Description A Proposed I-395 Southwest after Exit 4, Eastbound
 Speed Limit and Safety Nexus Studies for Automated Enforcement Locations in the District of Columbia I-395 SW after Exit 4 E/B Study Area and Location District PSA Ward ANC Phase Description 1 71 8 8A
TxDOT TMS PERFORMANCE MEASURES ITS TEXAS Texas Department of Transportation
 TxDOT TMS PERFORMANCE MEASURES ITS TEXAS 2017 Texas Department of Transportation Traffic Management Systems November 2017 TRF-TM Update 1 2 Implementation of TMS Performance Metrics TMS Performance Metrics
Urban Road Traffic Simulation Techniques
 ANALELE UNIVERSITĂłII EFTIMIE MURGU REŞIłA ANUL XVIII, NR. 2, 2011, ISSN 1453-7397 Ana Maria Nicoleta Mocofan Urban Road Traffic Simulation Techniques For achieving a reliable traffic control system it
EVALUATION OF THE EFFECT OF VMS IN REDUCING CONGESTION USING AIMSUN TOOL: A CASE STUDY OF ARTERIAL ROAD NETWORKS WITHIN THE CBD OF KADUNA
 DOI: http://dx.doi.org/10.7708/ijtte.2016.6(2).09 UDC: 656.1:519.872(669) EVALUATION OF THE EFFECT OF VMS IN REDUCING CONGESTION USING AIMSUN TOOL: A CASE STUDY OF ARTERIAL ROAD NETWORKS WITHIN THE CBD
Study Area and Location District PSA Ward ANC Phase Description G Planned Connecticut Avenue Northbound at Military Road Northwest
 Speed Limit and Safety Nexus Studies for Automated Enforcement Locations in the District of Columbia Connecticut Avenue at Military Road NW Study Area and Location District PSA Ward ANC Phase Description
Veirs Mill Road Metrobus Improvements Request to Conduct Public Hearing
 Customer Services, Operations, and Safety Committee Board Information Item III-B September 24, 2009 Veirs Mill Road Metrobus Improvements Request to Conduct Public Hearing Washington Metropolitan Area
Microscopic Traffic Simulation
 Microscopic Traffic Simulation Lecture Notes in Transportation Systems Engineering Prof. Tom V. Mathew Contents Overview 2 Traffic Simulation Models 2 2. Need for simulation.................................
Crystal Springs Upland School Transportation Demand Management Plan. March 2016
 Crystal Springs Upland School Transportation Demand Management Plan March 06 CONTENTS Introduction... Transportation Demand Management (TDM) Program.... Background/Survey of Existing Student Commuting
Chapter 16. Microscopic Traffic Simulation Overview Traffic Simulation Models
 Chapter 6 Microscopic Traffic Simulation 6. Overview The complexity of traffic stream behaviour and the difficulties in performing experiments with real world traffic make computer simulation an important
Design Considerations for Real-time Arterial Performance Measurement Systems Using Transit Bus Probes
 Design Considerations for Real-time Arterial Performance Measurement Systems Using Transit Bus Probes Abraham Emmanuel & David Zavattero Chicago Department of Transportation Project Goals Estimate traffic
Prepared for: Rocklin. Prepared by:
 APPENDIX L Sierra Gateway Apartments Transportation Impact Analysis Report Prepared for: Rocklin Sierra Apartments II, LLC Prepared by: SIERRA GATEWAY APARTMENTS TRANSPORTATION IMPACT ANALYSIS REPORT PREPARED
Managing DC Work Zones: DDOT s Citywide Transportation Management Plan
 Managing DC Work Zones: DDOT s Citywide Transportation Management Plan ARTBA National Work Zone Management Conference September 20, 2016 1 Outline Citywide Transportation Management Plan (TMP) Citywide
Managed Lane owner decision needed San Mateo County s options Understanding revenues & costs Pros & cons of County s options Proposed next steps
 San Mateo County Transportation Authority Meeting August 2, 2018 1 OVERVIEW Managed Lane owner decision needed San Mateo County s options Understanding revenues & costs Pros & cons of County s options
SAFETY ON THE IH 35 EXPANSION PROJECTS. Andy Petter, P.E. - Waco District
 SAFETY ON THE IH 35 EXPANSION PROJECTS Andy Petter, P.E. - Waco District Presentation IH 35 Expansion through the Waco District Safety Requirements on the Projects IH 35 Safety Summit Meetings Crash Data
Operation of Closed Loop Signal Systems
 Operation of Closed Loop Signal Systems Darcy Bullock Associate Professor School of Civil Engineering Purdue University Pre-Conference Proceedings - Page 205 Quantifying the Impact of Traffic Responsive
Dulles Area Transportation Association
 Dulles Area Transportation Association February 8, 2017 Susan Shaw, P.E., Megaprojects Director Virginia Department of Transportation Transform 66: Outside the Beltway 2 Project Scope Multimodal improvements
Tech Note 1101 NTCIP Coordination by Example
 Tech Note 1101 NTCIP Coordination by Example This Tech Note provides examples that let you practice running NTCIP coordination on Naztec controllers. There are 11 distinct coordination modes in the Naztec
Escambia-Santa Rosa Regional ATMS. Escambia-Santa Rosa Regional Advanced Traffic Management System (ATMS) Florida Alabama TPO
 Florida Alabama TPO") Escambia-Santa Rosa Regional ATMS Escambia-Santa Rosa Regional Advanced Traffic Management System (ATMS) Florida Alabama TPO TCC/CAC Meeting: April 11, 2016 TPO Meeting: April 13, 2016 Ben Faust, P.E.
Escambia-Santa Rosa Regional ATMS Escambia-Santa Rosa Regional Advanced Traffic Management System (ATMS) Florida Alabama TPO TCC/CAC Meeting: April 11, 2016 TPO Meeting: April 13, 2016 Ben Faust, P.E.
Traffic Impact Analysis
 LA PALMA VILLAGE INITIAL STUDY CITY OF ANAHEIM Appendices Appendix I Traffic Impact Analysis September 2015 LA PALMA VILLAGE INITIAL STUDY CITY OF ANAHEIM Appendices This page intentionally left blank.
MS2. Modern Traffic Analytics ms2soft.com
 MS2 Modern Traffic Analytics ms2soft.com Updated: October 31, 2014 Table of Contents 1 Introduction 3 2 Search Types 6 3.1 Search by: Study Location 11 3.2 Search by: Crash Data 12 3.3 Search Results Page
Study Area and Location District PSA Ward ANC Phase Description B Planned Branch Avenue Northbound at Alabama Avenue Southeast
 Speed Limit and Safety Nexus Studies for Automated Enforcement Locations in the District of Columbia Branch Avenue at Alabama Avenue SE Study Area and Location District PSA Ward ANC Phase Description 6
Road Intersections Near Level Crossings: Intersection Awareness in Illinois. Brian Vercruysse Illinois Commerce Commission
 Road Intersections Near Level Crossings: Intersection Awareness in Illinois Brian Vercruysse Illinois Commerce Commission Illinois Freight & Passenger Rail Systems Metra Commuter Illinois Rail Crossing
Connected Corridors: I-210 Pilot Integrated Corridor Management System
 PARTNERS FOR ADVANCED TRANSPORTATION TECHNOLOGY INSTITUTE OF TRANSPORTATION STUDIES UNIVERSITY OF CALIFORNIA, BERKELEY Connected Corridors: I-210 Pilot Integrated Corridor Management System Processing
Basic Concepts And Future Directions Of Road Network Reliability Analysis
 Journal of Advanced Transportarion, Vol. 33, No. 2, pp. 12.5-134 Basic Concepts And Future Directions Of Road Network Reliability Analysis Yasunori Iida Background The stability of road networks has become
Appendix D. Transportation Study
 Appendix D Transportation Study Draft KUNZLER TERRACE MINE PROJECT Transportation Study Prepared for May 29 County of Mendocino Draft KUNZLER TERRACE MINE PROJECT Transportation Study Prepared for May
South Central ROP Projects
 Pennsylvania Department of Transportation ROP Overview and Summary South Central ROP Projects November 2007 77 INCIDENT MANAGEMENT (IM) Draft Version 1 July 2007-40 - IM 1: SOUTH CENTRAL PA ITS DEPLOYMENT
An Assessment of Congestion in the Kansas City Region using the MARC Travel Demand Model
 An Assessment of Congestion in the Kansas City Region using the MARC Travel Demand Model The Congestion Management Process Federal Regulations state that all metropolitan planning organizations must carry
Des Moines Area Regional Transit Non Rider Survey
 Moines Area Regional Transit Non Rider Survey helping organizations make better decisions since 1982 Findings Report Submitted to the Moines Area Regional Transit Authority by: ETC Institute 725 W. Frontier
PART 2. SIGNS Chapter 2L. Changeable Message Signs
 PART 2. SIGNS Chapter 2L. Changeable Message Signs TABLE OF CONTENTS Chapter 2L. CHANGEABLE MESSAGE SIGNS Page Section 2L. Description of Changeable Message Signs.................................... 2L-
Economic Crash Analysis Tool. Release Notes
 Release Notes August 2017 Release: 1. Project Information Worksheet: a. Update: Removed the design exception report option b. Enhancement: The first question has been expanded to provide better clarity
CONTRIBUTION TO THE INVESTIGATION OF STOPPING SIGHT DISTANCE IN THREE-DIMENSIONAL SPACE
 National Technical University of Athens School of Civil Engineering Department of Transportation Planning and Engineering Doctoral Dissertation CONTRIBUTION TO THE INVESTIGATION OF STOPPING SIGHT DISTANCE
CTRE MINNESOTA DEPARTMENT OF TRANSPORTATION OFFICE OF RESEARCH SERVICES WEB SITE UPGRADES. Sponsored by. Prepared by
 MINNESOTA DEPARTMENT OF TRANSPORTATION OFFICE OF RESEARCH SERVICES WEB SITE UPGRADES Sponsored by DEPARTMENT MINNESOTA OF TRANSPORTATION Prepared by CTRE Center for Transportation Research and Education
Roadway Alignments and Profiles
 NOTES Module 15 Roadway Alignments and Profiles In this module, you learn how to create horizontal alignments, surface profiles, layout (design) profiles, and profile views in AutoCAD Civil 3D. This module
Synchro Studio 10. with Warrants Release Notes
 Synchro Studio 10 with Warrants Release Notes Table of Contents INTRODUCTION...1 RELEASE 10.3.28: OCTOBER 25, 2018... 1 RELEASE 10.3.15: SEPTEMBER 10, 2018... 1 RELEASE 10.2.0: MAY 21.2018... 1 Release
Synchro Studio 9 With Warrants and TripGen 2014 Summary of Version 9 Releases
 Synchro Studio 9 With Warrants and TripGen 2014 Summary of Version 9 Releases Table of Contents INTRODUCTION...1 VERSION 9.0...1 RELEASE 9.0.902: OCTOBER 20, 2014... 1 RELEASE 9.0.901: AUGUST 18, 2014...
Site 40. Recreational Center
 Speed Limit and Safety Nexus Studies for Automated Enforcement Locations in the District of Columbia Georgia Avenue S/B at Missouri Avenue NW Study Area and Location District PSA Ward ANC Phase Description
The Practical Side of Cell Phones as Traffic Probes
 The Practical Side of Cell Phones as Traffic Probes The information contained in this document is considered proprietary, and may not be reproduced or redistributed without the consent of Delcan Inc. Cell
Interactive Highway Safety Design Model (IHSDM) Workshop Nevada DOT Las Vegas, NV February 13, 2014
 Workshop Nevada DOT Las Vegas, NV February 13, 2014") Interactive Highway Safety Design Model (IHSDM) Workshop Nevada DOT Las Vegas, NV February 13, 2014 Overview Hands-on Exercises: IHSDM Crash Prediction Module (CPM) The Crash Prediction Module estimates
Interactive Highway Safety Design Model (IHSDM) Workshop Nevada DOT Las Vegas, NV February 13, 2014 Overview Hands-on Exercises: IHSDM Crash Prediction Module (CPM) The Crash Prediction Module estimates