Des Moines Area Regional Transit Non Rider Survey
|
|
|
- Brian Eaton
- 5 years ago
- Views:
Transcription

1 Moines Area Regional Transit Non Rider Survey helping organizations make better decisions since 1982 Findings Report Submitted to the Moines Area Regional Transit Authority by: ETC Institute 725 W. Frontier Lane, Olathe, Kansas September 2016
2 Contents Executive Summary.1 Charts and Graphs...Section 1 Tabular Data Overall Results..Section 2 Crosstabluar Data by Zone.....Section 3 GIS Maps......Section 4 Survey Instrument....Section 5
3 2015 Moines Area Regional Transit Non-Rider Survey 2015 Moines Area Regional Transit Non- Rider Survey Executive Summary Introduction ETC Institute conducted a survey of residents in the Moines region and Polk County who were not currently using Moines Area Regional Transit (DART) services. The purpose of this survey was to update DART s long-range transit services plan the DART Forward 2035 Plan. DART would like to understand the public transit needs of the growing and changing population. Some of the topics addressed on the survey included: Perceptions of existing public transportation services in the Moines area Whether residents had used public transportation in cities outside the Moines area Whether residents thought DART services were valuable to the community Reasons residents were not currently using public transportation in the Moines area Factors that would encourage residents to begin using public transportation services in the Moines area Different trip purposes that would interest residents to use DART services Frequency levels that would encourage use of public transportation Different types of transportation which DART could introduce Reasons residents believe DART is important to the area Various transportation improvements that are important to residents Methodology The survey was administered by , mail, and phone to a stratified random sample of 2323 residents who indicated they had not used DART services during the past year. The sample was stratified to ensure the results would be statistically representative of 15 zones: (1) Ankeny, (2) Altoona, (3) Clive, (4) Moines, (5) Grimes (6) Johnston, (7) North-East Rural Polk County, (8) North-West Rural Polk County, (9) Norwalk, (10) Hill, (11) South Rural Polk County, (12) Urbandale, (13) Waukee, (14) Windsor Heights, and (15) West Moines. The actual number of surveys completed in each zone is provided below: ETC Institute (April 2016) Executive Summary 1


4 2015 Moines Area Regional Transit Non-Rider Survey Zone 1: 212 Zone 9: 139 Zone 2: 108 Zone 10: 142 Zone 3: 109 Zone 11: 111 Zone 4: 352 Zone 12: 186 Zone 5: 112 Zone 13: 128 Zone 6: 152 Zone 14: 145 Zone 7: 144 Zone 15: 156 Zone 8: 127 The overall results of the survey have a precision of at least +/-2.0% at the 95% level of confidence. The results for each zone are shown separately in Section 2 of this report. ETC Institute (April 2016) Executive Summary 2
5 Findings 2015 Moines Area Regional Transit Non-Rider Survey Over 80% of survey respondents indicated that they feel DART s service is valuable to the community. The highest percentage reported was in Moines (98.15%), the lowest was in South Rural Polk County (81.71%). Over 60% of survey respondents rate DART s serviced either Excellent or Good. The highest was in Clive (72.97%), and the lowest was in South Rural Polk County (47.5%). Less than 24% of survey respondents indicated they Strongly Agree with the statement that Transit service is not offered near my home. This response was highest in Norwalk (65.69%), and lowest in Windsor Heights (4.29%). The top reason survey respondents would consider using public transportation would be for a work related trip. This response was highest in Norwalk (51.8%), and lowest in South Rural Polk County (25.23%). The top four reasons survey respondents indicated they were not currently using public transportation were: o Respondent prefers to drive rather than use public transportation o Transit service not offered near respondent s home o Respondent has too many places they need to go during the day to use public transportation o Public transportation takes too long compared to travel by other mode The factors which survey respondents indicated would be most likely to cause them to begin using public transportation were: o Transit stops located closer to respondent s home o The time it takes to get to respondent s destination by car increases due to traffic congestion o Transit stops located closer to the place respondent works or visits frequently o Respondent s employer provided incentives to use public transportation services The types of transportation survey respondents indicated they would be Very Likely to use were: o Light rail service, nearly 25% of respondents indicated they would be Very Likely to use this service if it were available. The highest percentage was in North-West Rural Polk County (31.3%), and the lowest was in South Rural Polk County (19.59%). o High speed, rapid bus service that has separate lanes and priority at traffic lights, nearly 20% of respondents indicated they would be Very Likely to use this service if it were available. The highest percentage was in Moines (26.32%), and the lowest was in West Moines (11.54%). ETC Institute (April 2016) Executive Summary 3
6 Section 1: Charts and Graphs
7 Overall Results
8 How Likely Respondent is to Vote in the Next Municipal Election by percentage of respondents surveyed Very Likely 57% Very Unlikely 7% Somewhat Likely 22% Not Sure 7% Somewhat Unlikely 6% Source: ETC Institute (2016 DART Transit Non-Rider Survey)
9 Whether or not Respondent is Registered to Vote by percentage of respondents surveyed Yes 96% No 4% Source: ETC Institute (2016 DART Transit Non-Rider Survey)
10 Is DART s Service Valuable to the Community by percentage of respondents surveyed No 6% Yes 94% Source: ETC Institute (2016 DART Transit Non-Rider Survey)
11 Overall Rating of DART s Services by percentage of respondents surveyed (excluding don't know ) Good 48% Excellent 12% Average 21% Poor 18% Source: ETC Institute (2016 DART Transit Non-Rider Survey)
12 Respondent's Level of Agreement with the Following Statements by percentage of respondents surveyed Transit is Important to a Thriving Community I Prefer to Driving I Have Too Many Places I Need to Go Transit Service is Not Offered Near My Home Public Transportation Takes too Long Transit Service Does Not Go Where I Need to Go Transit Service is Not Offered When I Need to Use Information is Difficult to Understand I Do Not Feel Safe Waiting at Bus Stop I Do Not Feel Safe on the Bus 49% 38% 22% 33% 24% 21% 12% 32% 16% 20% 14% 21% 6% 3% 2% 5% 9% 16% 48% 40% 38% 35% 38% 24% 24% 43% 47% 48% 10% 16% 5% 8% 21% 31% 13% 18% 17% 30% 47% 54% Riding the Bus is Too Expensive 2% 4% 49% 45% Buses are Not On Time 1% 4% 71% 24% Buses Are Not Reliable Source: ETC Institute (2016 DART Transit Non-Rider Survey) 1% 3% 61% 35% 0% 20% 40% 60% 80% 100% Strongly Agree Agree Neutral Disagree/Strongly Disagree
13 Top Three Reasons Why Respondent is Not Using Public Transportation Services by percentage of respondents surveyed who selected the following as one of their top three choices Prefer to driver rather than use public transportation 64% I have too many places I need to go during the day 56% Transit service is not offered near my home Public transportation takes too long compared to travel by other mode Transit does not take me to where I need to go 40% 39% 37% Transit service is not offered when I need to use it 28% Information about service is difficult to understand Public transportation is important for a thriving community I do not feel safe waiting at bus stops Riding the bus is too expensive I do not feel safe on the bus Buses are not on time Buses are not reliable None 11% 8% 5% 3% 3% 2% 1% 3% Source: ETC Institute (2016 DART Transit Non-Rider Survey) 0% 20% 40% 60% 80% Top Choice 2nd Choice 3rd Choice
14 How Likely Each Factor Would Be To Encourage Respondent to Begin Using Public Transportation by percentage of respondents surveyed Transit stops closer to work 18% 34% 22% 26% Transit stops closer to home 17% 34% 22% 27% Employer provided incentives 19% 29% 24% 29% Shelters located at bus stops you use 14% 32% 29% 25% Buses arrive more frequently 13% 32% 31% 23% If DART were faster 12% 31% 35% 22% Time for commute increases due to congestion 9% 33% 23% 35% If it cost less to ride transit 11% 25% 34% 30% Better timed transfers 10% 24% 42% 24% Services offered earlier/later 11% 23% 38% 28% Cost of parking increases 7% 20% 24% 49% Buses are Not On Time 1% 4% 71% 24% Buses Are Not Reliable 1% 3% 61% 35% Source: ETC Institute (2016 DART Transit Non-Rider Survey) 0% 20% 40% 60% 80% 100% Very Likely Likely Not Sure Not Likely/Very Unlikely
15 Top Three Reasons Respondent Would Begin Using Public Transportation Services by percentage of respondents surveyed who selected the following as one of their top three choices Transit stops are located closer to your home 50% Transit stops are located closer to the place you work or visit frequently The time it takes to get to your destination by car increases due to traffic congestion Your employer provided incentives to use public transportation services Buses are scheduled to arrive at stops more frequently If shelters were located at bus stops were you would board/alight at The cost of parking increases at the place you work or at places you visit frequently If DART provided faster service Service were offered earlier or later on existing routes If it cost less to ride transit 27% 27% 23% 19% 19% 18% 16% 36% 43% Better timed transfers between services None 11% 12% Source: ETC Institute (2016 DART Transit Non-Rider Survey) 0% 20% 40% 60% 80% Top Choice 2nd Choice 3rd Choice
16 Minimum Level of Service Frequency That Would Encourage Respondent To Use Public Transit At Least Once A Week by percentage of respondents surveyed Between 10 to 15 min. 23% Between 15 to 20 min. 17% Less than 10 min. 9% Between 20 to 30 min. 14% Between 30 to 45 min. 3% Between 45 to 60 min. 2% Source: ETC Institute (2016 DART Transit Non-Rider Survey) Would not use 32%
17 For What Trip Purposes Would Respondent Be Interested in Using DART Services by percentage of respondents surveyed Personal/recreational 19% Other shopping 12% Grocery shopping 7% Medical 8% College/University 2% School (K-12) 2% Would not use 23% Other 2% Work related 24% Source: ETC Institute (2016 DART Transit Non-Rider Survey)
18 Most Common Trip Purposes Respondent Would Be Interested In by percentage of respondents surveyed Would not use 23% Other 2% Personal/recreational 16% Other shopping 6% Grocery shopping 5% Medical 4% Work related 42% College/University 1% School (K-12) 1% Source: ETC Institute (2016 DART Transit Non-Rider Survey)
19 During What Times of Day Would Respondent be Most Interested in Using Bus Service by percentage of respondents surveyed 12:00 PM - 3:00 PM 8% 9:00 AM - 12:00 PM 10% 5:00 AM - 9:00 AM 24% 3:00 PM - 7:00 PM 24% 7:00 PM - 10:00 PM 7% Source: ETC Institute (2016 DART Transit Non-Rider Survey) 10:00 PM - 5:00 AM 3% Would not use 24%
20 During What Days of the Week Would Respondent Be Most Interested in Using Bus Service by percentage of respondents surveyed Sunday 4% Saturday 7% Friday 15% Would not use 14% Other 1% Thursday 15% Monday 15% Tuesday 15% Wednesday 15% Source: ETC Institute (2016 DART Transit Non-Rider Survey)
21 How Likely Each Factor Would Be To Encourage Respondent to Begin Using Public Transportation by percentage of respondents surveyed Light Rail Train 25% 25% 25% 25% High speed bus service 20% 26% 27% 27% On-demand bus technology 17% 28% 30% 25% Park and Ride services 13% 28% 24% 35% Door-to-door shuttle 17% 23% 24% 36% Fixed bus routes 12% 26% 31% 30% Vanpool service 7% 15% 26% 52% Source: ETC Institute (2016 DART Transit Non-Rider Survey) 0% 20% 40% 60% 80% 100% Very Likely Likely Not Sure Not Likely/Very Unlikely
22 How Important Respondent Believes the Following Purposes for Public Transportation Are by percentage of respondents surveyed Serving low-income, disabled, or senior population 81% 16% 3% Fast, frequent, reliable service 62% 32% 5% Supporting econcomic development 57% 34% 8% Alternative to congested roadways 56% 37% 8% Creating environmentally sustainable city 54% 33% 13% Make getting to/from transit easier 51% 40% 9% Explanding DART's service area 48% 40% 13% Source: ETC Institute (2016 DART Transit Non-Rider Survey) 0% 20% 40% 60% 80% 100% Very Important Somewhat Important Not Important
23 Overall, How Respondent Would Rate the Impression They Have of DART by percentage of respondents surveyed (Excluding Don't Know ) Good 54% Excellent 11% Poor 7% Average 29% Source: ETC Institute (2016 DART Transit Non-Rider Survey)
24 Overall, How Important Respondent Thinks it is for the Region to Support and Fund Public Transportation by percentage of respondents surveyed Very important 51% Not important 7% Somewhat important 31% Not sure 12% Source: ETC Institute (2016 DART Transit Non-Rider Survey)
25 How Respondent Thinks the Current Level of Funding for Public Transportation in the Region Should Change Over the Next Five Years by percentage of respondents surveyed Should stay the same 23% Should be reduced 7% 50% Should be somewhat greater Should be much greater 19% Source: ETC Institute (2016 DART Transit Non-Rider Survey)
26 How Respondent Rates the Importance of the Following Transportation Investments by percentage of respondents surveyed Improving Public Transit 32% 41% 20% 7% Widening Existing roads 23% 37% 26% 15% Improving the Sidewalk Network 20% 37% 27% 17% Building New Roads 15% 33% 33% 19% Improving the Bicycle Network 18% 28% 22% 32% 0% 20% 40% 60% 80% 100% Most Important Neutral/Not Sure Somewhat Important Not Important/Not Important at All Source: ETC Institute (2016 DART Transit Non-Rider Survey)
27 Top Three Investments Respondents Believe Would be Most Important to Focus on in the Region by percentage of respondents surveyed who selected the following as one of their top three choices Improving Public Transit 81% Widening Existing roads 66% Improving the Sidewalk Network 58% Building New Roads 49% Improving the Bicycle Network 46% Source: ETC Institute (2016 DART Transit Non-Rider Survey) 0% 20% 40% 60% 80% 100% Top Choice 2nd Choice 3rd Choice
28 Would Respondent Be Willing to Pay up to an Additional $80/per year, per Household to Expand Public Transportation in the Region by percentage of respondents surveyed No 40% Yes 27% Source: ETC Institute (2016 DART Transit Non-Rider Survey) Not sure 33%
29 Would Respondent Be Willing to Pay up to an Additional $40/per year, per Household to Expand Public Transportation in the Region by percentage of respondents surveyed (If "no or not sure to Q20) No 38% Yes 31% Source: ETC Institute (2016 DART Transit Non-Rider Survey) Not sure 31%
30 Respondent s Level of Support for the Following Sources of Funding by percentage of respondents surveyed Sales Tax: Add ½ Cent Sales Tax in Dallas and Polk County 12% 23% 17% 49% Vehicle Registration Fee: Add a $20 annual fee to each car s registration fee in the areas serviced by DART 12% 22% 14% 52% Property Tax: Add up to 85 cents/$1000 of taxable valuation of houses in areas serviced by DART 5% 14% 17% 64% 0% 20% 40% 60% 80% 100% Strongly Support Somewhat Support Neutral/Not Sure Somewhat/Strongly DO NOT Support Source: ETC Institute (2016 DART Transit Non-Rider Survey)
31 Demographics
32 How Many Operating Vehicles (Cars, Motorcycles, Vans) Does Respondent Have in Their Household by percentage of respondents surveyed 2 47% 1 19% 0 1% Not Provided 6+ 2% 2% 5 2% 4 8% 3 19% Source: ETC Institute (2016 DART Transit Non-Rider Survey)
33 Does Respondent Have a Valid Driver's License by percentage of respondents surveyed No 1% Yes 99% Source: ETC Institute (2016 DART Transit Non-Rider Survey)
34 How Many Licensed Drivers are in the Household by percentage of respondents surveyed 1 20% 2 60% 4 4% 0 1% Not provided 5+ 3% 1% 3 12% Source: ETC Institute (2016 DART Transit Non-Rider Survey)
35 Respondent's Age by percentage of respondents surveyed years 29% years 10% years 36% years 1% 65+ year 24% Source: ETC Institute (2016 DART Transit Non-Rider Survey)
36 Respondent's Ethnicity by percentage of respondents surveyed Caucasian/White 94% 1% Asian/Pacific Islander 2% 1% Black/African American Other 1% American Indian/Eskimo 1% Hispanic Source: ETC Institute (2016 DART Transit Non-Rider Survey)
37 Does Respondent Have a Physical Disability That Causes Them to be Dependent on Others for Transportation by percentage of respondents surveyed No 96% Yes 4% Source: ETC Institute (2016 DART Transit Non-Rider Survey)
38 Employment Status by percentage of respondents surveyed Yes, Employed 72% No 28% Source: ETC Institute (2016 DART Transit Non-Rider Survey)
39 Annual Household Income by percentage of respondents surveyed $30,000 to $59,999 18% $60,000 to $99,999 26% Under $30,000 10% Not provided 13% $100,000 or more 33% Source: ETC Institute (2016 DART Transit Non-Rider Survey)
40 Gender by percentage of respondents surveyed Male 45% Female 55% Source: ETC Institute (2016 DART Transit Non-Rider Survey)
41 Prior to Receiving this Survey Was Respondent Familiar with the Public Transit Services Offered by DART by percentage of respondents surveyed No 22% Yes 78% Source: ETC Institute (2016 DART Transit Non-Rider Survey)
42 Section 2: Tabular Data Overall Results
43 DART Transit Non Rider Survey Q1. How likely are you to vote in the next municipal election? Very Likely 57.34% Somewhat Likely 22.05% Not Sure 7.47% Somewhat Unlikely 6.16% Very Unlikely 6.99% Q2. Are you registered to vote at your current address? No 3.65% Yes 96.35% Q3. Do you feel DART's service is a valuable service to the community? No 5.59% Yes 80.87% Don't Know 13.54% Q3. Do you feel DART's service is a valuable service to the community? Excluding "Don't know" No 6.47% Yes 93.53% Q4. Overall, how would you rate DART's services? Excellent 5.19% Good 20.44% Average 9.08% Poor, needs to be expanded 7.60% Don't know 57.69% Q4. Overall, how would you rate DART's services? Excluding "Don't know" Excellent 12.26% Good 48.31% Average 21.46% Poor, needs to be expanded 17.97%
44 Q5. Respondent's level of satisfaction with the following statements: Q5.1 Public transportation takes too long compared to travel by other mode Strongly Agree 11.82% Agree 32.11% Neutral/Not Sure 42.82% Disagree 11.55% Strongly Disagree 1.70% Q5.2 Transit service is not offered when I need to use it Strongly Agree 14.08% Agree 21.24% Neutral/Not Sure 48.12% Disagree 12.91% Strongly Disagree 3.65% Q5.3 Transit service is not offered near my home Strongly Agree 23.88% Agree 21.10% Neutral/Not Sure 23.92% Disagree 20.18% Strongly Disagree 10.92% Q5.4 Transit service does not take me to where I need to go Strongly Agree 15.73% Agree 19.61% Neutral/Not Sure 46.96% Disagree 13.49% Strongly Disagree 4.21% Q5.5 Information about transit service is difficult to understand Strongly Agree 6.01% Agree 16.06% Neutral/Not Sure 48.27% Disagree 22.45% Strongly Disagree 7.21%
45 Q5. Respondent's level of satisfaction with the following statements: Q5.6 Buses are not on time Strongly Agree 1.10% Agree 3.55% Neutral/Not Sure 71.27% Disagree 19.02% Strongly Disagree 5.06% Q5.7 Buses are not reliable Strongly Agree 1.04% Agree 2.88% Neutral/Not Sure 61.23% Disagree 27.24% Strongly Disagree 7.60% Q5.8 I have too many places I need to go during the day to use public transportation Strongly Agree 22.06% Agree 32.84% Neutral/Not Sure 24.07% Disagree 16.98% Strongly Disagree 4.06% Q5.9 I do not feel safe on the bus Strongly Agree 2.26% Agree 5.15% Neutral/Not Sure 38.47% Disagree 35.44% Strongly Disagree 18.68% Q5.10 I do not feel safe waiting at bus stops Strongly Agree 3.47% Agree 8.78% Neutral/Not Sure 40.28% Disagree 32.32% Strongly Disagree 15.15%
46 Q5. Respondent's level of satisfaction with the following statements: Q5.11 Riding the bus is too expensive Strongly Agree 1.74% Agree 4.26% Neutral/Not Sure 49.18% Disagree 31.06% Strongly Disagree 13.76% Q5.12 I prefer to drive rather than use public transportation Strongly Agree 37.90% Agree 38.13% Neutral/Not Sure 16.11% Disagree 5.19% Strongly Disagree 2.68% Q5.13 Public transportation is important for a thriving community Strongly Agree 49.20% Agree 35.28% Neutral/Not Sure 10.18% Disagree 2.46% Strongly Disagree 2.88%
47 Q6. Top three reasons why respondent is not using public transportation services: Q6. Top choice why respondent is not using public transportation services Public transportation takes too long compared to travel by other mode Transit service is not offered when I need to use it Transit service is not offered near my home Transit service does not take me to where I need to go Information about transit service is difficult to understand Buses are not on time Buses are not reliable I have too many places I need to go during the day to use public transportation I do not feel safe on the bus I do not feel safe waiting at bus stops Riding the bus is too expensive I prefer to drive rather than use public transportation Public transportation is important for a thriving community 8.85% 6.54% 18.59% 8.48% 1.72% 0.28% 0.23% 17.62% 0.60% 0.42% 0.56% 32.04% 0.79% None 3.29% Q6. Second choice why respondent is not using public transportation services Public transportation takes too long compared to travel by other mode Transit service is not offered when I need to use it Transit service is not offered near my home Transit service does not take me to where I need to go Information about transit service is difficult to understand Buses are not on time Buses are not reliable I have too many places I need to go during the day to use public transportation I do not feel safe on the bus I do not feel safe waiting at bus stops Riding the bus is too expensive I prefer to drive rather than use public transportation 12.11% 11.58% 12.00% 13.27% 3.33% 1.00% 0.48% 24.22% 1.16% 2.17% 0.63% 16.08% Public transportation is important for a thriving community 1.96%
48 Q6. Top three reasons why respondent is not using public transportation services: Q6. Third choice why respondent is not using public transportation services Public transportation takes too long compared to travel by other mode Transit service is not offered when I need to use it Transit service is not offered near my home Transit service does not take me to where I need to go Information about transit service is difficult to understand Buses are not on time Buses are not reliable I have too many places I need to go during the day to use public transportation I do not feel safe on the bus I do not feel safe waiting at bus stops Riding the bus is too expensive I prefer to drive rather than use public transportation 17.80% 10.32% 9.89% 15.02% 5.87% 0.56% 0.74% 13.66% 1.55% 2.16% 2.22% 15.45% Public transportation is important for a thriving community 4.76% Q7. How likely respondent would be to begin using public transportation if: Q7.1 The cost of parking increases at the place you work or at places you visit frequently Very Likely 6.73% Likely 20.01% Not Sure 24.26% Not Likely 23.13% Very Unlikely 25.87% Q7.2 The time it takes to get to your destination by car increases due to traffic congestion Very Likely 8.84% Likely 32.56% Not Sure 23.29% Not Likely 20.08% Very Unlikely 15.23% Q7.3 Transit stops are located closer to your home Very Likely 16.99% Likely 34.22% Not Sure 22.18% Not Likely 13.43% Very Unlikely 13.19%
49 Q7. How likely respondent would be to begin using public transportation if: Q7.4 Transit stops are located closer to the place you work or visit frequently Very Likely 17.57% Likely 34.36% Not Sure 22.04% Not Likely 13.09% Very Unlikely 12.94% Q7.5 Buses are scheduled to arrive at stops more frequently Very Likely 13.33% Likely 32.30% Not Sure 31.03% Not Likely 12.25% Very Unlikely 11.08% Q7.6 Service were offered earlier or later on existing routes Very Likely 11.02% Likely 22.99% Not Sure 37.79% Not Likely 15.44% Very Unlikely 12.76% Q7.7 Your employer provided incentives to use public transportation services Very Likely 18.58% Likely 28.64% Not Sure 24.26% Not Likely 13.01% Very Unlikely 15.51% Q7.8 Better timed transfers between services Very Likely 10.21% Likely 23.95% Not Sure 42.09% Not Likely 12.08% Very Unlikely 11.67%
50 Q7. How likely respondent would be to begin using public transportation if: Q7.9 If it cost less to ride transit Very Likely 10.55% Likely 25.18% Not Sure 34.37% Not Likely 16.28% Very Unlikely 13.62% Q7.10 If DART provided faster service Very Likely 11.87% Likely 31.19% Not Sure 35.21% Not Likely 10.11% Very Unlikely 11.62% Q7.11 If shelters were located at bus stops where you would board/alight at Very Likely 14.36% Likely 32.07% Not Sure 29.03% Not Likely 12.12% Very Unlikely 12.42% Q8. Top three reasons respondent would begin using public transportation services Q8. Top choice why respondent would begin using public transportation services The cost of parking increases at the place you work or at places you visit frequently 8.66% The time it takes to get to your destination by car increases due to traffic congestion 14.36% Transit stops are located closer to your home 27.65% Transit stops are located closer to the place you work or visit frequently 9.68% Buses are scheduled to arrive at stops more frequently 4.90% Service were offered earlier or later on existing routes 2.90% Your employer provided incentives to use public transportation services 8.98% Better timed transfers between services 1.18% If it cost less to ride transit 3.23% If DART provided faster service 3.34% If shelters were located at bus stops were you would board/alight at 3.01% None 12.10%
51 Q8. Top three reasons respondent would begin using public transportation services Q8. Second choice why respondent would begin using public transportation services The cost of parking increases at the place you work or at places you visit frequently 5.44% The time it takes to get to your destination by car increases due to traffic congestion 12.17% Transit stops are located closer to your home 14.05% Transit stops are located closer to the place you work or visit frequently 22.91% Buses are scheduled to arrive at stops more frequently 10.55% Service were offered earlier or later on existing routes 6.47% Your employer provided incentives to use public transportation services 7.77% Better timed transfers between services 3.30% If it cost less to ride transit 5.31% If DART provided faster service 5.37% If shelters were located at bus stops were you would board/alight at 6.67% Q8. Third choice why respondent would begin using public transportation services The cost of parking increases at the place you work or at places you visit frequently 4.54% The time it takes to get to your destination by car increases due to traffic congestion 9.15% Transit stops are located closer to your home 8.72% Transit stops are located closer to the place you work or visit frequently 9.94% Buses are scheduled to arrive at stops more frequently 11.74% Service were offered earlier or later on existing routes 8.65% Your employer provided incentives to use public transportation services 10.52% Better timed transfers between services 6.05% If it cost less to ride transit 7.56% If DART provided faster service 9.87% If shelters were located at bus stops were you would board/alight at 13.26% Q9. What is the minimum level of service frequency that would encourage you to use public transit at least once a week? Less than 10 minutes 8.71% Between 10 to 15 minutes 23.39% Between 15 to 20 minutes 16.61% Between 20 to 30 minutes 13.67% Between 30 to 45 minutes 3.49% Between 45 to 60 minutes 2.18% Would not use bus service 31.95%
52 Q10. For what trip purposes would you be interested in using DART services? Multiple responses allowed Work related trip 38.48% School (K 12) 3.92% College/University 3.87% Medical 13.43% Grocery shopping 10.98% Other shopping related trips 18.42% Personal/recreational 30.22% Would not use bus service 35.99% Other 3.14% Q11. Most common trip purpose from Q10 Multiple responses allowed College/University 0.96% Grocery shopping 5.46% Medical 3.77% Other shopping related trips 6.34% Personal/recreational 15.89% School (K 12) 1.28% Work related trip 41.65% Would not use bus service 22.95% Other 1.69% Q12. During what times of day would you be most interested in using bus service? Multiple responses allowed 5:00 AM 9:00 AM 38.40% 9:00 AM 12:00 PM 16.49% 12:00 PM 3:00 PM 13.78% 3:00 PM 7:00 PM 39.22% 7:00 PM 10:00 PM 11.24% 10:00 PM 5:00 AM 5.29% Would not use bus service 38.74% Q13. During what days of the week would you be most interested in using bus service? Multiple responses allowed Monday 43.95% Tuesday 44.98% Wednesday 45.63% Thursday 44.86% Friday 46.02% Saturday 19.54% Sunday 11.88% Would not use bus service 41.46%
53 Q14. How likely respondent would be to use the following types of transportation Q14.1 High speed, rapid bus service that has separate lanes and priority at traffic lights Very Likely 19.62% Likely 26.47% Not Sure 27.06% Not Likely 10.99% Very Unlikely 15.87% Q14.2 On demand bus technology that operates in a similar manner to Uber and Lync Very Likely 17.29% Likely 27.67% Not Sure 29.68% Not Likely 11.17% Very Unlikely 14.20% Q14.3 Door to door shuttle service for seniors or persons with disabilities Very Likely 17.39% Likely 22.65% Not Sure 23.76% Not Likely 13.30% Very Unlikely 22.90% Q14.4 Park and ride services where you park your car & then take an express bus Very Likely 12.67% Likely 27.81% Not Sure 24.26% Not Likely 16.07% Very Unlikely 19.18% Q14.5 Bus service that operates on fixed routes in the area where you live Very Likely 12.18% Likely 26.29% Not Sure 31.46% Not Likely 14.41% Very Unlikely 15.66%
54 Q14. How likely respondent would be to use the following types of transportation Q14.6 Vanpool service, which would involve having people who work at the same place share a van provided by their employer Very Likely 7.00% Likely 14.93% Not Sure 26.36% Not Likely 22.25% Very Unlikely 29.45% Q14.7 Light Rail Train Service Very Likely 24.86% Likely 25.46% Not Sure 24.56% Not Likely 8.06% Very Unlikely 17.06% Q15. How important respondent believes the following purposes are: Q15.1 Serving low income, disabled, or senior populations with few other transportation options Very Important 81.23% Somewhat Important 15.78% Not Important 3.00% Q15.2 Providing an alternative to congested roadways Very Important 55.77% Somewhat Important 36.63% Not Important 7.61% Q15.3 Providing fast, frequent, reliable service on key corridors Very Important 62.43% Somewhat Important 32.19% Not Important 5.38%
55 Q15. How important respondent believes the following purposes are: Q15.4 Making it easier to get to/from transit (better sidewalks, stops, etc.) Very Important 50.55% Somewhat Important 40.46% Not Important 8.99% Q15.5 Helping to create an environmentally friendly, sustainable city not dependent on car travel Very Important 53.95% Somewhat Important 32.97% Not Important 13.08% Q15.6 Expanding DART's service area Very Important 47.82% Somewhat Important 39.60% Not Important 12.58% Q15.7 Supporting economic development and access to jobs Very Important 57.22% Somewhat Important 34.35% Not Important 8.43% Q16. Overall, how would you rate the impression you have of DART? Excellent 8.21% Good 41.72% Average 22.40% Poor 5.09% Don't know 22.58% Q16. Overall, how would you rate the impression you have of DART? Excluding "Don't know" Excellent 10.61% Good 53.88% Average 28.93% Poor 6.58%
56 Q17. Overall, how important do you think it is for the region to support and fund public transportation Very important 51.32% Somewhat important 30.50% Not sure 11.55% Not important 6.62% Q18. How do you think the current level of funding for public transportation (e.g. bus) in the region should change over the next five years? Should be reduced 7.30% Should stay the same 23.37% Should be somewhat greater than it is now 49.92% Should be much greater than it is now 19.41% Q19. Rating importance of the following transportation investments Q19.1 Widening existing roads Most Important 22.58% Somewhat Important 36.69% Neutral/ Not sure 26.07% Not Important 10.15% Not Important at All 4.52% Q19.2 Building new roads Most Important 14.52% Somewhat Important 32.63% Neutral/ Not sure 33.43% Not Important 13.72% Not Important at All 5.70% Q19.3 Improving public transit Most Important 31.97% Somewhat Important 40.81% Neutral/ Not sure 19.82% Not Important 4.28% Not Important at All 3.12%
57 Q19. Rating importance of the following transportation investments Q19.4 Improving the bicycle network Most Important 18.08% Somewhat Important 27.60% Neutral/ Not sure 22.47% Not Important 16.63% Not Important at All 15.23% Q19.5 Improving the sidewalk network Most Important 19.87% Somewhat Important 36.80% Neutral/ Not sure 26.59% Not Important 10.77% Not Important at All 5.97% Q19 2. Top three investments respondents believe would be most important to focus on in the region Q19 2. Top choice of most important investment Widening Existing roads 31.68% Building New Roads 12.09% Improving Public Transit 36.02% Improving the Bicycle Network 10.00% Improving the Sidewalk Network 10.21% Q19 2. Second choice of most important investment Widening Existing roads 18.05% Building New Roads 21.96% Improving Public Transit 21.39% mproving the Bicycle Network 21.00% Improving the Sidewalk Network 17.60% Q19 2. Third choice of most important investment Widening Existing roads 16.30% Building New Roads 14.52% Improving Public Transit 24.03% mproving the Bicycle Network 15.03% Improving the Sidewalk Network 30.12%
58 Q20. Would you be willing to pay up to an additional $80/per year, per household to expand public transportation in the region including more routes, faster service in key corridors, more frequency, and more times? No 40.41% Yes 26.93% Not sure 32.66% Q21. Would you be willing to pay up to an additional $40/per year, per household to expand public transportation in the region including more routes, faster service in key corridors, more frequency, and more times? If "no" or "not sure" to Q20. No 37.88% Yes 31.15% Not sure 30.96% Q22. How strongly respondents support the following funding sources used to grow public transit infrastructure: Q22.1 Vehicle Registration Fee: Add a $20 annual fee to each car's registration fee in the areas serviced by DART Strongly Support 11.88% Somewhat Support 21.69% Neutral/ Not sure 14.46% Somewhat Do NOT Support 13.17% Strongly Do NOT Support 38.81% Q22.2 Sales Tax: Add 1/2 cent sales tax in Dallas and Polk County Strongly Support 12.01% Somewhat Support 22.54% Neutral/ Not sure 16.67% Somewhat Do NOT Support 13.63% Strongly Do NOT Support 35.15%
59 Q22. How strongly respondents support the following funding sources used to grow public transit infrastructure: Q22.3 Property Tax: Add up to 85 cents/$1000 of taxable valuation of houses in areas serviced by DART Strongly Support 5.42% Somewhat Support 13.58% Neutral/ Not sure 17.01% Somewhat Do NOT Support 16.46% Strongly Do NOT Support 47.52% Demographics Q23. How many operating vehicles (cars, motorcycles, vans) do you have in your household? Open ended response % % % % % % % % % % % % % % % Not provided 2.41% Q24. Do you have a valid driver's license? No 1.01% Yes 98.99%
60 Q25. Including yourself, how many licensed drivers do you have in your household? Open ended % % % % % % % % Not provided 2.54% Q26. What is your age? years 1.41% years 10.08% years 28.75% years 35.98% 65+ year 23.78% Q27. Which of the following best describes your race/ethnicity? Multiple responses allowed Asian/Pacific Islander 1.21% Black/African American 1.85% Caucasian/White 91.82% American Indian/Eskimo 0.82% Hispanic 1.08% Other 1.38% Q28. Do you have a physical disability that causes you to be dependent on others for transportation? No 96.45% Yes 3.55% Q29. Are you employed? No 28.08% Yes 71.92%
61 Q30. Would you say your total annual household income is: Under $30, % $30,000 to $59, % $60,000 to $99, % $100,000 or more 33.41% Not provided 13.09% Q30. Would you say your total annual household income is: Excluding "Not provided" Under $30, % $30,000 to $59, % $60,000 to $99, % $100,000 or more 38.44% Q32. Your gender: Female 54.85% Male 45.15% Q33. Prior to receiving this survey, were you familiar with the public transit services offered by DART (the Moines Area Regional Transit Authority)? No 21.53% Yes 78.47%
62 Section 3: Crosstabular Data By Zone
63 DART Transit Non Rider Survey (By District) Q1. How likely are you to vote in the next municipal election? Ankeny Altoona Clive Moines Grimes Johnston East West Norwalk Hill South Urbandale Waukee Windsor Heights West Moines Total Very Likely 48.33% 57.69% 46.67% 63.04% 55.45% 54.30% 61.15% 59.20% 61.87% 65.25% 61.68% 55.14% 43.75% 72.41% 48.37% 57.34% Somewhat Likely 28.71% 19.23% 27.62% 18.62% 25.45% 25.17% 15.83% 23.20% 23.02% 20.57% 15.89% 24.86% 25.00% 13.10% 25.49% 22.05% Not Sure 9.09% 8.65% 5.71% 7.74% 6.36% 8.61% 9.35% 4.80% 6.47% 4.26% 9.35% 6.49% 12.50% 4.83% 7.19% 7.47% Somewhat Unlikely 5.74% 7.69% 11.43% 4.30% 6.36% 4.64% 5.76% 4.00% 5.04% 4.96% 4.67% 7.57% 10.94% 4.14% 9.15% 6.16% Very Unlikely 8.13% 6.73% 8.57% 6.30% 6.36% 7.28% 7.91% 8.80% 3.60% 4.96% 8.41% 5.95% 7.81% 5.52% 9.80% 6.99% % % % % % % % % % % % % % % % Q2. Are you registered to vote at your current address? Ankeny Altoona Clive Moines Grimes Johnston East West Norwalk Hill South Urbandale Waukee Windsor Heights West Moines Total No 4.29% 0.95% 7.41% 4.27% 1.79% 2.65% 2.13% 7.09% 2.16% 2.14% 3.74% 2.72% 4.72% 4.17% 3.90% 3.65% Yes 95.71% 99.05% 92.59% 95.73% 98.21% 97.35% 97.87% 92.91% 97.84% 97.86% 96.26% 97.28% 95.28% 95.83% 96.10% 96.35% % % % % % % % % % % % % % % % Q3. Do you feel DART's service is a valuable service to the community? Windsor West Ankeny Altoona Clive Moines Grimes Johnston East West Norwalk Hill South Urbandale Waukee Heights Moines Total No 4.31% 7.48% 6.60% 1.73% 8.26% 8.72% 3.55% 3.23% 12.23% 4.29% 13.76% 4.35% 6.30% 3.45% 5.23% 5.59% Yes 81.34% 88.79% 82.08% 91.93% 69.72% 75.17% 73.76% 78.23% 69.06% 86.43% 61.47% 82.07% 75.59% 88.28% 86.27% 80.87% Don't know 14.35% 3.74% 11.32% 6.34% 22.02% 16.11% 22.70% 18.55% 18.71% 9.29% 24.77% 13.59% 18.11% 8.28% 8.50% 13.54% % % % % % % % % % % % % % % % Q3. Do you feel DART's service is a valuable service to the community? Excluding "Don't know" Windsor West Ankeny Altoona Clive Moines Grimes Johnston East West Norwalk Hill South Urbandale Waukee Heights Moines Total No 5.03% 7.77% 7.45% 1.85% 10.59% 10.40% 4.59% 3.96% 15.04% 4.72% 18.29% 5.03% 7.69% 3.76% 5.71% 6.47% Yes 94.97% 92.23% 92.55% 98.15% 89.41% 89.60% 95.41% 96.04% 84.96% 95.28% 81.71% 94.97% 92.31% 96.24% 94.29% 93.53% % % % % % % % % % % % % % % %
64 Q4. Overall, how would you rate DART's services? Ankeny Altoona Clive Moines Grimes Johnston East West Norwalk Hill South Urbandale Waukee Windsor Heights West Moines Total Excellent 3.96% 8.65% 2.94% 6.67% 3.67% 6.62% 5.71% 0.81% 2.17% 7.97% 3.74% 6.82% 3.15% 4.17% 7.64% 5.19% Good 16.34% 24.04% 23.53% 28.99% 15.60% 16.91% 12.14% 16.94% 27.54% 17.39% 14.02% 19.89% 16.54% 20.14% 24.31% 20.44% Average 7.92% 8.65% 3.92% 15.07% 4.59% 8.09% 7.86% 8.06% 5.07% 9.42% 9.35% 8.52% 7.09% 11.81% 9.72% 9.08% Poor needs to be expanded 7.43% 5.77% 5.88% 10.72% 3.67% 6.62% 9.29% 6.45% 6.52% 5.80% 10.28% 5.68% 9.45% 9.03% 6.25% 7.60% Don't know 64.36% 52.88% 63.73% 38.55% 72.48% 61.76% 65.00% 67.74% 58.70% 59.42% 62.62% 59.09% 63.78% 54.86% 52.08% 57.69% % % % % % % % % % % % % % % % Q4. Overall, how would you rate DART's services? Excluding "Don't know" Ankeny Altoona Clive Moines Grimes Johnston East West Norwalk Hill South Urbandale Waukee Windsor Heights West Moines Total Excellent 11.11% 18.37% 8.11% 10.85% 13.33% 17.31% 16.33% 2.50% 5.26% 19.64% 10.00% 16.67% 8.70% 9.23% 15.94% 12.26% Good 45.83% 51.02% 64.86% 47.17% 56.67% 44.23% 34.69% 52.50% 66.67% 42.86% 37.50% 48.61% 45.65% 44.62% 50.72% 48.31% Average 22.22% 18.37% 10.81% 24.53% 16.67% 21.15% 22.45% 25.00% 12.28% 23.21% 25.00% 20.83% 19.57% 26.15% 20.29% 21.46% Poor needs to be expanded 20.83% 12.24% 16.22% 17.45% 13.33% 17.31% 26.53% 20.00% 15.79% 14.29% 27.50% 13.89% 26.09% 20.00% 13.04% 17.97% % % % % % % % % % % % % % % %
65 Q5. Respondent's level of satisfaction with the following statements: Q5.1 Public transportation takes too long compared to travel by other mode Ankeny Altoona Clive Moines Grimes Johnston East West Norwalk Hill South Urbandale Waukee Windsor Heights West Moines Total Strongly Agree 8.12% 9.57% 15.46% 14.41% 10.89% 10.61% 10.45% 9.17% 12.50% 15.38% 12.38% 11.24% 11.11% 12.59% 11.35% 11.82% Agree 28.43% 38.30% 36.08% 35.29% 25.74% 43.18% 23.88% 26.67% 30.88% 29.23% 26.67% 32.02% 34.92% 35.66% 31.21% 32.11% Neutral/Not Sure 50.25% 42.55% 46.39% 34.71% 48.51% 34.09% 52.24% 47.50% 44.85% 40.00% 52.38% 42.13% 42.86% 35.66% 42.55% 42.82% Disagree 12.18% 7.45% 2.06% 12.94% 12.87% 10.61% 11.19% 15.00% 11.03% 13.85% 6.67% 12.92% 9.52% 14.69% 12.77% 11.55% Strongly Disagree 1.02% 2.13% 0.00% 2.65% 1.98% 1.52% 2.24% 1.67% 0.74% 1.54% 1.90% 1.69% 1.59% 1.40% 2.13% 1.70% % % % % % % % % % % % % % % % Q5.2 Transit service is not offered when I need to use it Ankeny Altoona Clive Moines Grimes Johnston East West Norwalk Hill South Urbandale Waukee Windsor Heights West Moines Total Strongly Agree 13.19% 10.84% 4.65% 11.15% 11.83% 8.70% 22.90% 17.80% 25.00% 16.39% 21.15% 9.58% 22.76% 6.52% 11.36% 14.08% Agree 21.43% 25.30% 23.26% 21.67% 18.28% 26.96% 20.61% 20.34% 20.59% 18.03% 21.15% 19.16% 23.58% 21.01% 18.94% 21.24% Neutral/Not Sure 52.75% 45.78% 58.14% 39.01% 56.99% 50.43% 45.04% 47.46% 43.38% 53.28% 50.00% 49.10% 48.78% 52.90% 46.21% 48.12% Disagree 9.89% 12.05% 10.47% 20.43% 9.68% 12.17% 9.92% 11.02% 9.56% 9.84% 6.73% 16.17% 4.07% 16.67% 19.70% 12.91% Strongly Disagree 2.75% 6.02% 3.49% 7.74% 3.23% 1.74% 1.53% 3.39% 1.47% 2.46% 0.96% 5.99% 0.81% 2.90% 3.79% 3.65% % % % % % % % % % % % % % % % Q5.3 Transit service is not offered near my home Ankeny Altoona Clive Moines Grimes Johnston East West Norwalk Hill South Urbandale Waukee Windsor Heights West Moines Total Strongly Agree 16.06% 15.22% 9.38% 13.57% 26.00% 12.80% 43.70% 47.15% 65.69% 27.48% 41.67% 13.22% 30.40% 4.29% 13.29% 23.88% Agree 26.94% 17.39% 25.00% 12.09% 34.00% 18.40% 26.67% 21.14% 18.25% 29.01% 16.67% 18.97% 33.60% 17.14% 16.78% 21.10% Neutral/Not Sure 31.09% 19.57% 31.25% 16.52% 33.00% 30.40% 18.52% 19.51% 12.41% 24.43% 34.26% 28.16% 23.20% 27.86% 20.98% 23.92% Disagree 18.13% 32.61% 26.04% 32.15% 4.00% 27.20% 6.67% 9.76% 1.46% 13.74% 6.48% 29.31% 10.40% 29.29% 32.17% 20.18% Strongly Disagree 7.77% 15.22% 8.33% 25.66% 3.00% 11.20% 4.44% 2.44% 2.19% 5.34% 0.93% 10.34% 2.40% 21.43% 16.78% 10.92% % % % % % % % % % % % % % % % Q5.4 Transit service does not take me to where I need to go Ankeny Altoona Clive Moines Grimes Johnston East West Norwalk Hill South Urbandale Waukee Windsor Heights West Moines Total Strongly Agree 16.22% 20.69% 5.56% 12.69% 16.30% 15.57% 14.06% 18.80% 20.00% 17.60% 22.55% 15.79% 20.80% 11.43% 13.48% 15.73% Agree 21.08% 14.94% 23.33% 21.15% 21.74% 23.77% 14.06% 13.68% 20.74% 14.40% 14.71% 18.13% 20.00% 26.43% 21.28% 19.61% Disagree 11.35% 10.34% 16.67% 16.92% 5.43% 13.11% 12.50% 13.68% 14.81% 12.00% 5.88% 14.04% 11.20% 15.00% 19.86% 13.49% Neutral/Not Sure 47.57% 48.28% 52.22% 39.88% 52.17% 43.44% 57.81% 48.72% 42.96% 56.00% 54.90% 48.54% 47.20% 42.86% 39.01% 46.96% Strongly Disagree 3.78% 5.75% 2.22% 9.37% 4.35% 4.10% 1.56% 5.13% 1.48% 0.00% 1.96% 3.51% 0.80% 4.29% 6.38% 4.21% % % % % % % % % % % % % % % %
66 Q5. Respondent's level of satisfaction with the following statements: Q5.5 Information about transit service is difficult to understand Ankeny Altoona Clive Moines Grimes Johnston East West Norwalk Hill South Urbandale Waukee Windsor Heights West Moines Total Strongly Agree 3.26% 6.74% 6.67% 7.44% 6.52% 8.47% 10.94% 6.72% 2.24% 2.48% 6.80% 4.82% 4.84% 6.38% 5.93% 6.01% Agree 17.39% 14.61% 17.78% 17.86% 10.87% 17.80% 16.41% 13.45% 15.67% 12.40% 19.42% 15.66% 14.52% 14.18% 18.52% 16.06% Neutral/Not Sure 53.26% 40.45% 51.11% 36.90% 51.09% 49.15% 52.34% 56.30% 51.49% 57.02% 55.34% 44.58% 51.61% 53.19% 39.26% 48.27% Disagree 21.74% 23.60% 22.22% 23.21% 28.26% 17.80% 14.84% 17.65% 24.63% 19.01% 14.56% 29.52% 27.42% 20.57% 28.15% 22.45% Strongly Disagree 4.35% 14.61% 2.22% 14.58% 3.26% 6.78% 5.47% 5.88% 5.97% 9.09% 3.88% 5.42% 1.61% 5.67% 8.15% 7.21% % % % % % % % % % % % % % % % Q5.6 Buses are not on time Ankeny Altoona Clive Moines Grimes Johnston East West Norwalk Hill South Urbandale Waukee Windsor Heights West Moines Total Strongly Agree 0.00% 1.22% 0.00% 2.16% 1.10% 1.94% 0.78% 1.80% 0.76% 0.00% 1.98% 1.24% 0.83% 0.00% 1.55% 1.10% Agree 4.02% 4.88% 4.88% 5.25% 1.10% 2.91% 0.78% 3.60% 2.29% 2.46% 1.98% 3.11% 3.31% 4.35% 5.43% 3.55% Neutral/Not Sure 75.29% 60.98% 78.05% 61.42% 75.82% 72.82% 79.69% 77.48% 71.76% 61.48% 80.20% 70.81% 76.03% 76.81% 66.67% 71.27% Disagree 17.82% 21.95% 15.85% 22.53% 19.78% 15.53% 14.84% 12.61% 21.37% 30.33% 12.87% 22.36% 15.70% 14.49% 19.38% 19.02% Strongly Disagree 2.87% 10.98% 1.22% 8.64% 2.20% 6.80% 3.91% 4.50% 3.82% 5.74% 2.97% 2.48% 4.13% 4.35% 6.98% 5.06% % % % % % % % % % % % % % % % Q5.7 Buses are not reliable Ankeny Altoona Clive Moines Grimes Johnston East West Norwalk Hill South Urbandale Waukee Windsor Heights West Moines Total Strongly Agree 0.00% 2.38% 0.00% 1.83% 1.09% 1.87% 0.78% 0.89% 0.76% 0.00% 0.99% 1.24% 0.83% 0.72% 1.54% 1.04% Agree 1.70% 1.19% 2.44% 4.59% 3.26% 1.87% 1.56% 6.25% 0.00% 1.65% 1.98% 4.35% 2.48% 4.35% 2.31% 2.88% Neutral/Not Sure 68.18% 52.38% 75.61% 51.07% 64.13% 65.42% 70.31% 66.96% 61.36% 52.07% 66.34% 55.90% 70.25% 60.14% 58.46% 61.23% Disagree 25.57% 28.57% 15.85% 31.50% 28.26% 23.36% 24.22% 20.54% 28.03% 36.36% 23.76% 32.92% 21.49% 29.71% 25.38% 27.24% Strongly Disagree 4.55% 15.48% 6.10% 11.01% 3.26% 7.48% 3.13% 5.36% 9.85% 9.92% 6.93% 5.59% 4.96% 5.07% 12.31% 7.60% % % % % % % % % % % % % % % % Q5.8 I have too many places I need to go during the day to use public transportation Windsor West Ankeny Altoona Clive Moines Grimes Johnston East West Norwalk Hill South Urbandale Waukee Heights Moines Total Strongly Agree 15.63% 22.34% 21.05% 23.15% 24.21% 27.69% 15.50% 8.26% 22.56% 24.60% 24.04% 24.00% 22.22% 26.95% 28.08% 22.06% Agree 31.77% 39.36% 29.47% 36.50% 31.58% 31.54% 34.11% 31.40% 26.32% 30.95% 31.73% 30.29% 38.89% 36.17% 28.77% 32.84% Neutral/Not Sure 31.25% 18.09% 33.68% 19.29% 23.16% 24.62% 26.36% 34.71% 24.81% 21.43% 28.85% 21.71% 22.22% 19.86% 19.18% 24.07% Disagree 17.71% 11.70% 11.58% 16.32% 17.89% 13.85% 18.60% 21.49% 23.31% 17.46% 12.50% 20.57% 13.49% 15.60% 18.49% 16.98% Strongly Disagree 3.65% 8.51% 4.21% 4.75% 3.16% 2.31% 5.43% 4.13% 3.01% 5.56% 2.88% 3.43% 3.17% 1.42% 5.48% 4.06% % % % % % % % % % % % % % % %
67 Q5. Respondent's level of satisfaction with the following statements: Q5.9 I do not feel safe on the bus Ankeny Altoona Clive Moines Grimes Johnston East West Norwalk Hill South Urbandale Waukee Windsor Heights West Moines Total Strongly Agree 0.54% 4.55% 2.25% 3.30% 3.19% 2.50% 3.08% 2.56% 1.49% 2.40% 1.94% 1.23% 0.00% 3.60% 1.48% 2.26% Agree 3.26% 6.82% 2.25% 7.81% 6.38% 6.67% 5.38% 5.98% 2.99% 5.60% 5.83% 3.07% 2.44% 4.32% 5.93% 5.15% Neutral/Not Sure 47.83% 35.23% 42.70% 34.83% 35.11% 30.83% 45.38% 41.88% 44.03% 33.60% 44.66% 39.88% 34.15% 32.37% 36.30% 38.47% Disagree 33.70% 31.82% 33.71% 32.43% 39.36% 36.67% 28.46% 35.90% 38.06% 38.40% 32.04% 37.42% 42.28% 35.97% 39.26% 35.44% Strongly Disagree 14.67% 21.59% 19.10% 21.62% 15.96% 23.33% 17.69% 13.68% 13.43% 20.00% 15.53% 18.40% 21.14% 23.74% 17.04% 18.68% % % % % % % % % % % % % % % % Q5.10 I do not feel safe waiting at bus stops Ankeny Altoona Clive Moines Grimes Johnston East West Norwalk Hill South Urbandale Waukee Windsor Heights West Moines Total Strongly Agree 0.54% 5.56% 1.14% 6.02% 4.26% 2.52% 3.88% 4.27% 2.99% 4.00% 1.98% 0.61% 1.61% 5.04% 5.26% 3.47% Agree 7.07% 13.33% 2.27% 11.75% 6.38% 9.24% 7.75% 10.26% 11.19% 6.40% 12.87% 4.88% 7.26% 8.63% 9.02% 8.78% Neutral/Not Sure 49.46% 36.67% 42.05% 35.54% 36.17% 30.25% 53.49% 40.17% 47.01% 36.80% 48.51% 43.29% 34.68% 36.69% 35.34% 40.28% Disagree 28.26% 23.33% 40.91% 27.11% 41.49% 36.13% 24.03% 33.33% 26.87% 42.40% 29.70% 37.80% 35.48% 32.37% 36.84% 32.32% Strongly Disagree 14.67% 21.11% 13.64% 19.58% 11.70% 21.85% 10.85% 11.97% 11.94% 10.40% 6.93% 13.41% 20.97% 17.27% 13.53% 15.15% % % % % % % % % % % % % % % % Q5.11 Riding the bus is too expensive Ankeny Altoona Clive Moines Grimes Johnston East West Norwalk Hill South Urbandale Waukee Windsor Heights West Moines Total Strongly Agree 0.00% 2.33% 0.00% 3.94% 3.26% 0.00% 2.31% 1.79% 2.26% 3.28% 0.00% 0.60% 0.00% 2.17% 1.46% 1.74% Agree 2.72% 2.33% 2.20% 6.36% 7.61% 4.24% 3.85% 1.79% 2.26% 4.92% 2.94% 6.02% 5.69% 4.35% 2.92% 4.26% Neutral/Not Sure 54.35% 43.02% 51.65% 41.21% 53.26% 39.83% 63.08% 64.29% 51.13% 53.28% 60.78% 46.39% 46.34% 41.30% 43.07% 49.18% Disagree 28.80% 30.23% 35.16% 30.00% 32.61% 38.98% 22.31% 25.00% 31.58% 31.15% 27.45% 31.93% 34.15% 34.06% 35.04% 31.06% Strongly Disagree 14.13% 22.09% 10.99% 18.48% 3.26% 16.95% 8.46% 7.14% 12.78% 7.38% 8.82% 15.06% 13.82% 18.12% 17.52% 13.76% % % % % % % % % % % % % % % % Q5.12 I prefer to drive rather than use public transportation Ankeny Altoona Clive Moines Grimes Johnston East West Norwalk Hill South Urbandale Waukee Windsor Heights West Moines Total Strongly Agree 33.00% 44.90% 42.16% 37.72% 39.39% 38.35% 36.36% 32.52% 38.97% 38.64% 38.32% 41.01% 32.81% 37.32% 41.10% 37.90% Agree 36.50% 24.49% 39.22% 40.64% 41.41% 38.35% 33.33% 38.21% 36.76% 39.39% 33.64% 38.76% 42.97% 45.77% 35.62% 38.13% Neutral/Not Sure 21.00% 19.39% 13.73% 13.74% 12.12% 16.54% 21.97% 20.33% 17.65% 12.12% 21.50% 10.67% 18.75% 11.27% 15.07% 16.11% Disagree 7.50% 7.14% 2.94% 4.68% 5.05% 4.51% 6.06% 6.50% 5.15% 7.58% 5.61% 6.18% 2.34% 3.52% 2.74% 5.19% Strongly Disagree 2.00% 4.08% 1.96% 3.22% 2.02% 2.26% 2.27% 2.44% 1.47% 2.27% 0.93% 3.37% 3.13% 2.11% 5.48% 2.68% % % % % % % % % % % % % % % %
68 Q5. Respondent's level of satisfaction with the following statements: Q5.13 Public transportation is important for a thriving community Windsor West Ankeny Altoona Clive Moines Grimes Johnston East West Norwalk Hill South Urbandale Waukee Heights Moines Total Strongly Agree 39.20% 59.41% 45.36% 58.26% 46.53% 43.38% 49.23% 50.41% 54.41% 58.14% 39.62% 40.91% 50.00% 48.25% 47.62% 49.20% Agree 41.21% 28.71% 38.14% 30.72% 36.63% 36.76% 33.08% 35.54% 29.41% 25.58% 37.74% 42.61% 36.29% 39.16% 38.78% 35.28% Neutral/Not Sure 12.56% 6.93% 11.34% 6.09% 7.92% 11.03% 13.08% 12.40% 10.29% 9.30% 14.15% 11.93% 11.29% 10.49% 8.84% 10.18% Disagree 3.02% 2.97% 4.12% 1.45% 2.97% 4.41% 2.31% 0.83% 1.47% 4.65% 3.77% 2.27% 1.61% 0.00% 3.40% 2.46% Strongly Disagree 4.02% 1.98% 1.03% 3.48% 5.94% 4.41% 2.31% 0.83% 4.41% 2.33% 4.72% 2.27% 0.81% 2.10% 1.36% 2.88% % % % % % % % % % % % % % % %
69 Q6. Top three reasons why respondent is not using public transportation services: Q6. Top choice why respondent is not using public transportation services Ankeny Altoona Clive Moines Grimes Johnston East West Norwalk Hill South Urbandale Waukee Windsor Heights West Moines Total Public transportation takes too long compared to travel by other mode Transit service is not offered when I need to use it Transit service is not offered near my home Transit service does not take me to where I need to go Information about transit service is difficult to understand Buses are not on time Buses are not reliable I have too many places I need to go during the day to use public transportation I do not feel safe on the bus I do not feel safe waiting at bus stops Riding the bus is too expensive I prefer to drive rather than use public transportation Public transportation is important for a thriving community 5.13% 8.00% 16.33% 14.46% 5.94% 11.90% 5.97% 3.25% 3.70% 9.45% 3.70% 9.09% 7.09% 14.60% 7.25% 8.85% 10.26% 8.00% 3.06% 4.82% 4.95% 7.94% 5.22% 4.88% 8.89% 5.51% 7.41% 6.25% 8.66% 5.11% 7.25% 6.54% 15.90% 10.00% 11.22% 7.83% 21.78% 6.35% 44.78% 40.65% 42.22% 16.54% 33.33% 10.23% 22.83% 3.65% 12.32% 18.59% 10.77% 12.00% 5.10% 7.53% 7.92% 11.90% 3.73% 4.88% 2.96% 10.24% 4.63% 9.66% 6.30% 15.33% 13.04% 8.48% 1.03% 4.00% 1.02% 2.71% 0.00% 3.17% 2.99% 1.63% 0.74% 0.79% 0.93% 2.27% 0.79% 0.73% 1.45% 1.72% 0.00% 2.00% 0.00% 0.60% 0.00% 0.00% 0.00% 0.81% 0.00% 0.00% 0.00% 0.00% 0.00% 0.00% 0.72% 0.28% 0.00% 0.00% 0.00% 0.90% 0.00% 0.00% 0.00% 0.81% 0.00% 0.00% 0.00% 0.00% 0.00% 0.00% 0.72% 0.23% 14.87% 15.00% 19.39% 19.58% 20.79% 21.43% 11.19% 9.76% 11.11% 18.11% 14.81% 24.43% 20.47% 19.71% 19.57% 17.62% 0.00% 0.00% 0.00% 0.90% 0.00% 1.59% 0.75% 0.00% 0.00% 0.00% 1.85% 0.57% 0.79% 0.73% 1.45% 0.60% 0.51% 1.00% 0.00% 0.90% 0.99% 0.00% 0.00% 0.00% 0.00% 0.00% 1.85% 0.57% 0.00% 0.00% 0.00% 0.42% 0.00% 1.00% 0.00% 1.51% 0.00% 0.79% 0.75% 0.00% 0.74% 0.00% 0.00% 0.57% 0.00% 1.46% 0.00% 0.56% 35.90% 36.00% 42.86% 34.04% 34.65% 30.16% 21.64% 29.27% 21.48% 35.43% 28.70% 34.09% 27.56% 33.58% 33.33% 32.04% 0.51% 0.00% 1.02% 0.60% 0.99% 2.38% 0.00% 0.00% 0.74% 1.57% 0.00% 1.14% 0.79% 0.73% 1.45% 0.79% None 5.13% 3.00% 0.00% 3.61% 1.98% 2.38% 2.99% 4.07% 7.41% 2.36% 2.78% 1.14% 4.72% 4.38% 1.45% 3.29% % % % % % % % % % % % % % % %
70 Q6. Top three reasons why respondent is not using public transportation services: Q6. Second choice why respondent is not using public transportation services Ankeny Altoona Clive Moines Grimes Johnston East West Norwalk Hill South Urbandale Waukee Windsor Heights West Moines Total Public transportation takes too long compared to travel by other mode Transit service is not offered when I need to use it Transit service is not offered near my home Transit service does not take me to where I need to go Information about transit service is difficult to understand Buses are not on time Buses are not reliable I have too many places I need to go during the day to use public transportation I do not feel safe on the bus I do not feel safe waiting at bus stops Riding the bus is too expensive I prefer to drive rather than use public transportation Public transportation is important for a thriving community 16.57% 9.64% 13.79% 14.19% 9.20% 11.40% 5.83% 10.89% 8.33% 12.07% 5.56% 14.65% 11.02% 12.30% 17.80% 12.11% 10.06% 10.84% 10.34% 9.69% 12.64% 14.04% 15.83% 12.87% 15.00% 11.21% 17.78% 8.92% 15.25% 8.20% 6.78% 11.58% 13.61% 7.23% 6.90% 7.27% 14.94% 8.77% 15.00% 10.89% 20.00% 21.55% 12.22% 12.74% 15.25% 9.84% 7.63% 12.00% 14.79% 15.66% 12.64% 12.80% 9.20% 21.05% 9.17% 20.79% 14.17% 10.34% 16.67% 9.55% 14.41% 6.56% 14.41% 13.27% 4.14% 2.41% 2.30% 2.08% 2.30% 5.26% 5.83% 2.97% 1.67% 0.86% 4.44% 3.82% 1.69% 5.74% 5.08% 3.33% 1.18% 0.00% 0.00% 3.46% 0.00% 0.00% 1.67% 0.00% 0.00% 0.00% 1.11% 1.27% 0.00% 0.82% 0.85% 1.00% 0.00% 1.20% 0.00% 1.04% 0.00% 0.00% 0.00% 0.00% 0.00% 0.00% 0.00% 0.00% 1.69% 1.64% 0.85% 0.48% 20.12% 31.33% 32.18% 22.15% 34.48% 21.93% 20.83% 25.74% 21.67% 23.28% 16.67% 24.20% 22.03% 30.33% 26.27% 24.22% 0.59% 1.20% 0.00% 2.42% 2.30% 0.88% 0.83% 0.00% 0.00% 1.72% 0.00% 0.64% 0.00% 2.46% 2.54% 1.16% 1.18% 1.20% 1.15% 5.19% 0.00% 4.39% 1.67% 0.00% 1.67% 0.00% 2.22% 1.27% 0.85% 5.74% 0.85% 2.17% 0.00% 0.00% 0.00% 1.38% 0.00% 0.00% 1.67% 0.99% 0.83% 0.86% 1.11% 0.64% 0.00% 0.00% 0.85% 0.63% 15.38% 18.07% 17.24% 16.61% 14.94% 11.40% 20.00% 11.88% 15.00% 15.52% 22.22% 17.83% 17.80% 15.57% 11.86% 16.08% 2.37% 1.20% 3.45% 1.73% 0.00% 0.88% 1.67% 2.97% 1.67% 2.59% 0.00% 4.46% 0.00% 0.82% 4.24% 1.96% % % % % % % % % % % % % % % %
71 Q6. Top three reasons why respondent is not using public transportation services: Q6. Third choice why respondent is not using public transportation services Ankeny Altoona Clive Moines Grimes Johnston East West Norwalk Hill South Urbandale Waukee Windsor Heights West Moines Total Public transportation takes too long compared to travel by other mode Transit service is not offered when I need to use it Transit service is not offered near my home Transit service does not take me to where I need to go Information about transit service is difficult to understand Buses are not on time Buses are not reliable I have too many places I need to go during the day to use public transportation I do not feel safe on the bus I do not feel safe waiting at bus stops Riding the bus is too expensive I prefer to drive rather than use public transportation Public transportation is important for a thriving community 19.26% 22.39% 24.66% 19.68% 20.27% 16.84% 17.14% 16.67% 15.60% 12.04% 10.84% 14.84% 18.10% 18.87% 20.88% 17.80% 5.93% 11.94% 2.74% 8.84% 12.16% 6.32% 10.48% 16.67% 9.17% 14.81% 15.66% 8.59% 14.29% 8.49% 13.19% 10.32% 8.89% 7.46% 8.22% 5.62% 14.86% 8.42% 14.29% 12.22% 12.84% 13.89% 12.05% 10.94% 13.33% 7.55% 3.30% 9.89% 17.04% 13.43% 17.81% 13.65% 9.46% 9.47% 18.10% 8.89% 22.94% 22.22% 13.25% 16.41% 15.24% 17.92% 5.49% 15.02% 8.15% 4.48% 5.48% 6.02% 1.35% 7.37% 4.76% 5.56% 4.59% 2.78% 10.84% 5.47% 3.81% 10.38% 5.49% 5.87% 0.74% 0.00% 0.00% 1.20% 0.00% 0.00% 0.00% 0.00% 0.92% 0.00% 0.00% 0.78% 1.90% 0.94% 0.00% 0.56% 0.74% 1.49% 0.00% 2.41% 0.00% 2.11% 0.95% 0.00% 0.00% 0.00% 0.00% 0.78% 0.00% 0.00% 0.00% 0.74% 12.59% 13.43% 16.44% 11.65% 9.46% 15.79% 15.24% 15.56% 16.51% 12.04% 14.46% 12.50% 10.48% 13.21% 19.78% 13.66% 1.48% 1.49% 1.37% 3.21% 2.70% 2.11% 0.95% 2.22% 0.92% 0.00% 0.00% 2.34% 0.00% 0.94% 1.10% 1.55% 1.48% 7.46% 2.74% 1.61% 1.35% 1.05% 0.00% 2.22% 0.00% 3.70% 2.41% 0.00% 1.90% 1.89% 8.79% 2.16% 0.74% 1.49% 1.37% 2.41% 1.35% 6.32% 2.86% 1.11% 0.92% 1.85% 0.00% 5.47% 1.90% 2.83% 1.10% 2.22% 14.81% 7.46% 10.96% 19.28% 18.92% 15.79% 12.38% 14.44% 14.68% 13.89% 13.25% 17.19% 16.19% 14.15% 19.78% 15.45% 8.15% 7.46% 8.22% 4.42% 8.11% 8.42% 2.86% 4.44% 0.92% 2.78% 7.23% 4.69% 2.86% 2.83% 1.10% 4.76% % % % % % % % % % % % % % % %
72 Q7. How likely respondent would be to begin using public transportation if: Q7.1 The cost of parking increases at the place you work or at places you visit frequently Ankeny Altoona Clive Moines Grimes Johnston East West Norwalk Hill South Urbandale Waukee Windsor Heights West Moines Total Very Likely 7.34% 6.90% 1.10% 8.84% 7.61% 8.04% 6.25% 10.34% 6.72% 5.17% 5.66% 5.39% 7.26% 5.84% 4.48% 6.73% Likely 18.64% 17.24% 23.08% 22.87% 16.30% 18.75% 13.28% 20.69% 20.90% 23.28% 16.98% 20.96% 22.58% 19.71% 19.40% 20.01% Not Sure 28.25% 21.84% 21.98% 19.21% 21.74% 21.43% 29.69% 27.59% 20.90% 23.28% 30.19% 26.35% 29.84% 25.55% 20.90% 24.26% Not Likely 24.86% 22.99% 25.27% 24.09% 20.65% 20.54% 23.44% 21.55% 30.60% 19.83% 20.75% 20.36% 24.19% 27.74% 17.16% 23.13% Very Unlikely 20.90% 31.03% 28.57% 25.00% 33.70% 31.25% 27.34% 19.83% 20.90% 28.45% 26.42% 26.95% 16.13% 21.17% 38.06% 25.87% % % % % % % % % % % % % % % % Q7.2 The time it takes to get to your destination by car increases due to traffic congestion Windsor West Ankeny Altoona Clive Moines Grimes Johnston East West Norwalk Hill South Urbandale Waukee Heights Moines Total Very Likely 6.45% 7.87% 6.38% 10.81% 9.78% 9.09% 9.23% 12.71% 9.09% 9.17% 3.85% 7.74% 13.60% 9.42% 4.55% 8.84% Likely 39.25% 33.71% 29.79% 31.83% 27.17% 39.67% 27.69% 34.75% 33.33% 30.00% 26.92% 31.55% 36.00% 31.88% 31.06% 32.56% Not Sure 24.73% 17.98% 26.60% 19.52% 17.39% 19.01% 26.92% 21.19% 25.76% 25.00% 29.81% 23.81% 27.20% 26.09% 21.97% 23.29% Not Likely 19.89% 25.84% 23.40% 22.52% 27.17% 10.74% 19.23% 19.49% 15.91% 18.33% 20.19% 21.43% 15.20% 21.01% 20.45% 20.08% Very Unlikely 9.68% 14.61% 13.83% 15.32% 18.48% 21.49% 16.92% 11.86% 15.91% 17.50% 19.23% 15.48% 8.00% 11.59% 21.97% 15.23% % % % % % % % % % % % % % % % Q7.3 Transit stops are located closer to your home Ankeny Altoona Clive Moines Grimes Johnston East West Norwalk Hill South Urbandale Waukee Windsor Heights West Moines Total Very Likely 14.59% 13.64% 11.24% 20.18% 21.51% 14.29% 17.83% 26.89% 21.64% 15.83% 15.24% 15.48% 15.20% 13.77% 12.69% 16.99% Likely 36.22% 44.32% 31.46% 31.33% 34.41% 33.61% 34.11% 36.97% 38.81% 32.50% 30.48% 30.36% 43.20% 28.26% 34.33% 34.22% Not Sure 27.03% 17.05% 20.22% 18.07% 20.43% 17.65% 23.26% 21.01% 20.90% 23.33% 29.52% 23.81% 20.80% 31.16% 20.15% 22.18% Not Likely 13.51% 13.64% 24.72% 15.06% 8.60% 11.76% 10.08% 5.04% 11.94% 14.17% 8.57% 15.48% 12.80% 15.22% 17.91% 13.43% Very Unlikely 8.65% 11.36% 12.36% 15.36% 15.05% 22.69% 14.73% 10.08% 6.72% 14.17% 16.19% 14.88% 8.00% 11.59% 14.93% 13.19% % % % % % % % % % % % % % % % Q7.4 Transit stops are located closer to the place you work or visit frequently Windsor West Ankeny Altoona Clive Moines Grimes Johnston East West Norwalk Hill South Urbandale Waukee Heights Moines Total Very Likely 18.58% 23.17% 13.64% 18.60% 16.30% 19.33% 15.63% 21.19% 19.40% 12.50% 15.24% 16.77% 19.35% 21.01% 10.85% 17.57% Likely 36.61% 35.37% 30.68% 33.23% 36.96% 32.77% 34.38% 42.37% 40.30% 36.67% 30.48% 31.74% 34.68% 24.64% 36.43% 34.36% Not Sure 22.95% 17.07% 20.45% 20.43% 16.30% 15.97% 25.78% 17.80% 22.39% 21.67% 30.48% 22.75% 25.00% 26.81% 23.26% 22.04% Not Likely 13.11% 12.20% 21.59% 13.11% 14.13% 11.76% 12.50% 8.47% 11.94% 14.17% 9.52% 11.98% 12.90% 16.67% 13.95% 13.09% Very Unlikely 8.74% 12.20% 13.64% 14.63% 16.30% 20.17% 11.72% 10.17% 5.97% 15.00% 14.29% 16.77% 8.06% 10.87% 15.50% 12.94% % % % % % % % % % % % % % % %
73 Q7. How likely respondent would be to begin using public transportation if: Q7.5 Buses are scheduled to arrive at stops more frequently Ankeny Altoona Clive Moines Grimes Johnston East West Norwalk Hill South Urbandale Waukee Windsor Heights West Moines Total Very Likely 11.24% 20.00% 12.36% 17.72% 13.79% 15.52% 12.60% 12.93% 11.94% 5.88% 10.78% 10.98% 17.89% 11.51% 10.94% 13.33% Likely 38.76% 27.06% 22.47% 33.63% 33.33% 30.17% 25.98% 37.93% 33.58% 35.29% 29.41% 32.93% 28.46% 31.65% 34.38% 32.30% Not Sure 29.21% 25.88% 32.58% 26.43% 22.99% 22.41% 40.94% 31.03% 39.55% 36.97% 39.22% 26.22% 36.59% 33.81% 28.13% 31.03% Not Likely 13.48% 15.29% 19.10% 12.01% 16.09% 12.07% 8.66% 7.76% 11.19% 11.76% 5.88% 14.63% 9.76% 15.11% 12.50% 12.25% Very Unlikely 7.30% 11.76% 13.48% 10.21% 13.79% 19.83% 11.81% 10.34% 3.73% 10.08% 14.71% 15.24% 7.32% 7.91% 14.06% 11.08% % % % % % % % % % % % % % % % Q7.6 Service were offered earlier or later on existing routes Ankeny Altoona Clive Moines Grimes Johnston East West Norwalk Hill South Urbandale Waukee Windsor Heights West Moines Total Very Likely 12.07% 15.66% 6.98% 15.76% 9.20% 8.70% 11.02% 10.71% 8.27% 6.84% 4.85% 9.26% 13.01% 11.59% 12.10% 11.02% Likely 22.99% 28.92% 16.28% 24.55% 26.44% 21.74% 19.69% 26.79% 25.56% 23.08% 17.48% 22.84% 25.20% 18.12% 23.39% 22.99% Not Sure 35.63% 30.12% 38.37% 33.03% 33.33% 31.30% 45.67% 41.07% 44.36% 38.46% 51.46% 38.89% 34.96% 41.30% 34.68% 37.79% Not Likely 18.97% 15.66% 22.09% 15.45% 14.94% 14.78% 13.39% 10.71% 15.04% 15.38% 13.59% 12.96% 17.89% 18.84% 12.10% 15.44% Very Unlikely 10.34% 9.64% 16.28% 11.21% 16.09% 23.48% 10.24% 10.71% 6.77% 16.24% 12.62% 16.05% 8.94% 10.14% 17.74% 12.76% % % % % % % % % % % % % % % % Q7.7 Your employer provided incentives to use public transportation services Windsor West Ankeny Altoona Clive Moines Grimes Johnston East West Norwalk Hill South Urbandale Waukee Heights Moines Total Very Likely 15.03% 24.00% 14.67% 23.67% 14.63% 21.43% 15.89% 17.53% 15.87% 16.84% 19.32% 17.81% 18.80% 19.30% 17.31% 18.58% Likely 35.95% 38.67% 26.67% 26.15% 40.24% 32.65% 26.17% 30.93% 33.33% 25.26% 20.45% 23.29% 25.64% 26.32% 24.04% 28.64% Not Sure 24.84% 16.00% 22.67% 20.85% 15.85% 13.27% 27.10% 31.96% 26.98% 24.21% 29.55% 25.34% 34.19% 23.68% 26.92% 24.26% Not Likely 15.03% 9.33% 22.67% 12.72% 7.32% 11.22% 12.15% 6.19% 12.70% 14.74% 11.36% 14.38% 13.68% 14.91% 15.38% 13.01% Very Unlikely 9.15% 12.00% 13.33% 16.61% 21.95% 21.43% 18.69% 13.40% 11.11% 18.95% 19.32% 19.18% 7.69% 15.79% 16.35% 15.51% % % % % % % % % % % % % % % % Q7.8 Better timed transfers between services Ankeny Altoona Clive Moines Grimes Johnston East West Norwalk Hill South Urbandale Waukee Windsor Heights West Moines Total Very Likely 7.74% 18.52% 7.32% 14.63% 8.14% 12.73% 6.25% 15.79% 6.06% 8.62% 5.83% 9.55% 10.08% 6.57% 11.02% 10.21% Likely 22.62% 20.99% 23.17% 29.88% 25.58% 17.27% 24.22% 21.93% 26.52% 20.69% 20.39% 21.66% 19.33% 24.82% 28.81% 23.95% Not Sure 47.62% 34.57% 36.59% 32.32% 40.70% 32.73% 50.78% 45.61% 52.27% 44.83% 53.40% 36.31% 52.94% 48.18% 33.05% 42.09% Not Likely 12.50% 14.81% 19.51% 12.20% 11.63% 14.55% 7.03% 6.14% 10.61% 12.93% 7.77% 15.92% 10.92% 12.41% 13.56% 12.08% Very Unlikely 9.52% 11.11% 13.41% 10.98% 13.95% 22.73% 11.72% 10.53% 4.55% 12.93% 12.62% 16.56% 6.72% 8.03% 13.56% 11.67% % % % % % % % % % % % % % % %
74 Q7. How likely respondent would be to begin using public transportation if: Q7.9 If it cost less to ride transit Ankeny Altoona Clive Moines Grimes Johnston East West Norwalk Hill South Urbandale Waukee Windsor Heights West Moines Total Very Likely 7.14% 9.41% 6.02% 13.62% 8.05% 10.62% 10.08% 14.16% 10.53% 7.56% 10.68% 11.18% 10.74% 9.85% 12.50% 10.55% Likely 26.79% 37.65% 21.69% 23.53% 27.59% 21.24% 27.91% 29.20% 24.81% 27.73% 19.42% 24.84% 19.83% 21.97% 28.33% 25.18% Not Sure 39.88% 20.00% 30.12% 30.34% 34.48% 27.43% 39.53% 33.63% 39.85% 33.61% 46.60% 31.06% 42.98% 34.09% 32.50% 34.37% Not Likely 15.48% 18.82% 28.92% 17.96% 16.09% 15.93% 11.63% 12.39% 18.05% 15.13% 9.71% 13.66% 18.18% 24.24% 9.17% 16.28% Very Unlikely 10.71% 14.12% 13.25% 14.55% 13.79% 24.78% 10.85% 10.62% 6.77% 15.97% 13.59% 19.25% 8.26% 9.85% 17.50% 13.62% % % % % % % % % % % % % % % % Q7.10 If DART provided faster service Ankeny Altoona Clive Moines Grimes Johnston East West Norwalk Hill South Urbandale Waukee Windsor Heights West Moines Total Very Likely 9.30% 14.81% 7.41% 15.22% 10.47% 10.71% 10.16% 16.38% 11.94% 10.17% 8.74% 11.18% 15.57% 7.46% 13.56% 11.87% Likely 37.21% 33.33% 25.93% 32.30% 32.56% 25.89% 28.13% 32.76% 29.10% 35.59% 30.10% 29.19% 34.43% 29.10% 27.97% 31.19% Not Sure 35.47% 29.63% 33.33% 28.88% 32.56% 31.25% 42.97% 34.48% 46.27% 32.20% 43.69% 31.68% 38.52% 43.28% 30.51% 35.21% Not Likely 10.47% 11.11% 19.75% 11.18% 10.47% 8.04% 8.59% 6.03% 8.96% 10.17% 3.88% 13.04% 4.10% 11.94% 13.56% 10.11% Very Unlikely 7.56% 11.11% 13.58% 12.42% 13.95% 24.11% 10.16% 10.34% 3.73% 11.86% 13.59% 14.91% 7.38% 8.21% 14.41% 11.62% % % % % % % % % % % % % % % % Q7.11 If shelters were located at bus stops where you would board/alight at Windsor West Ankeny Altoona Clive Moines Grimes Johnston East West Norwalk Hill South Urbandale Waukee Heights Moines Total Very Likely 11.11% 15.66% 9.41% 18.32% 13.64% 10.71% 12.31% 20.00% 15.67% 15.00% 10.78% 12.35% 20.00% 11.19% 13.39% 14.36% Likely 35.67% 37.35% 29.41% 32.92% 38.64% 33.04% 25.38% 29.57% 35.07% 30.00% 30.39% 26.54% 32.50% 32.09% 33.86% 32.07% Not Sure 30.99% 22.89% 31.76% 22.05% 20.45% 16.96% 41.54% 32.17% 30.60% 30.00% 35.29% 32.72% 31.67% 33.58% 27.56% 29.03% Not Likely 14.04% 14.46% 15.29% 11.49% 12.50% 16.96% 9.23% 6.96% 12.69% 12.50% 9.80% 12.96% 8.33% 13.43% 12.60% 12.12% Very Unlikely 8.19% 9.64% 14.12% 15.22% 14.77% 22.32% 11.54% 11.30% 5.97% 12.50% 13.73% 15.43% 7.50% 9.70% 12.60% 12.42% % % % % % % % % % % % % % % %
75 Q8. Top three reasons respondent would begin using public transportation services Q8. Top choice why respondent would begin using public transportation services The cost of parking increases at the place you work or at places you visit frequently The time it takes to get to your destination by car increases due to traffic congestion Ankeny Altoona Clive Moines Grimes Johnston East West Norwalk Hill South Urbandale Waukee Windsor Heights West Moines 8.59% 9.86% 11.54% 11.18% 2.60% 11.34% 8.77% 7.21% 3.82% 7.96% 7.45% 14.48% 2.59% 8.06% 9.09% 8.66% 17.79% 16.90% 23.08% 14.47% 16.88% 16.49% 8.77% 9.91% 7.63% 10.62% 9.57% 11.72% 23.28% 14.52% 17.36% 14.36% Total Transit stops are located closer to your home Transit stops are located closer to the place you work or visit frequently Buses are scheduled to arrive at stops more frequently Service were offered earlier or later on existing routes Your employer provided incentives to use public transportation services (leave blank if not employed) Better timed transfers between services If it cost less to ride transit If DART provided faster service 25.15% 22.54% 20.51% 15.13% 35.06% 14.43% 43.86% 44.14% 49.62% 38.05% 38.30% 23.45% 21.55% 18.55% 23.97% 27.65% 11.04% 12.68% 6.41% 9.87% 5.19% 19.59% 7.02% 2.70% 6.11% 6.19% 3.19% 15.86% 11.21% 14.52% 9.92% 9.68% 2.45% 4.23% 5.13% 8.55% 3.90% 5.15% 1.75% 5.41% 6.11% 1.77% 3.19% 4.14% 4.31% 4.03% 7.44% 4.90% 4.91% 5.63% 1.28% 1.64% 2.60% 1.03% 1.75% 4.50% 1.53% 3.54% 3.19% 1.38% 2.59% 3.23% 6.61% 2.90% 9.20% 5.63% 14.10% 10.20% 12.99% 12.37% 7.89% 3.60% 5.34% 6.19% 5.32% 8.28% 12.07% 14.52% 6.61% 8.98% 2.45% 1.41% 1.28% 2.30% 0.00% 0.00% 0.00% 0.00% 0.76% 0.00% 1.06% 0.69% 0.86% 2.42% 1.65% 1.18% 1.23% 4.23% 0.00% 5.59% 2.60% 0.00% 3.51% 2.70% 3.05% 4.42% 3.19% 1.38% 2.59% 6.45% 3.31% 3.23% 2.45% 4.23% 0.00% 4.28% 1.30% 4.12% 3.51% 4.50% 2.29% 6.19% 5.32% 1.38% 5.17% 3.23% 0.83% 3.34% If shelters were located at bus stops were you 3.68% 1.41% 2.56% 5.26% 1.30% 2.06% 4.39% 0.90% 2.29% 2.65% 2.13% 1.38% 3.45% 4.03% 2.48% 3.01% would board/alight at None 11.04% 11.27% 14.10% 11.51% 15.58% 13.40% 8.77% 14.41% 11.45% 12.39% 18.09% 15.86% 10.34% 6.45% 10.74% 12.10% % % % % % % % % % % % % % % %
76 Q8. Top three reasons respondent would begin using public transportation services Q8. Second choice why respondent would begin using public transportation services Ankeny Altoona Clive Moines Grimes Johnston East The cost of parking increases at the place you work or at places you visit frequently The time it takes to get to your destination by car increases due to traffic congestion West Norwalk Hill South Urbandale Waukee Windsor Heights West Moines 7.97% 6.25% 9.84% 4.02% 4.92% 6.10% 5.05% 3.30% 4.55% 5.32% 1.43% 5.22% 8.74% 7.02% 3.19% 5.44% 14.49% 12.50% 18.03% 12.05% 8.20% 14.63% 11.11% 14.29% 6.36% 20.21% 4.29% 13.91% 4.85% 13.16% 13.83% 12.17% Total Transit stops are located closer to your home Transit stops are located closer to the place you work or visit frequently Buses are scheduled to arrive at stops more frequently Service were offered earlier or later on existing routes Your employer provided incentives to use public transportation services (leave blank if not employed) Better timed transfers between services If it cost less to ride transit If DART provided faster service 16.67% 12.50% 13.11% 12.45% 18.03% 14.63% 17.17% 10.99% 14.55% 12.77% 12.86% 11.30% 24.27% 7.02% 14.89% 14.05% 24.64% 15.63% 18.03% 12.85% 26.23% 15.85% 30.30% 31.87% 37.27% 26.60% 32.86% 16.52% 26.21% 25.44% 15.96% 22.91% 10.87% 9.38% 8.20% 15.26% 8.20% 8.54% 13.13% 9.89% 5.45% 7.45% 10.00% 10.43% 7.77% 12.28% 11.70% 10.55% 5.80% 7.81% 4.92% 10.44% 6.56% 4.88% 4.04% 2.20% 2.73% 6.38% 7.14% 7.83% 3.88% 7.02% 9.57% 6.47% 7.97% 12.50% 6.56% 9.64% 18.03% 9.76% 3.03% 3.30% 8.18% 4.26% 5.71% 11.30% 5.83% 3.51% 8.51% 7.77% 1.45% 9.38% 8.20% 4.82% 1.64% 3.66% 3.03% 3.30% 0.91% 1.06% 1.43% 2.61% 2.91% 4.39% 2.13% 3.30% 3.62% 1.56% 3.28% 5.22% 1.64% 8.54% 2.02% 12.09% 5.45% 9.57% 5.71% 6.09% 4.85% 6.14% 2.13% 5.31% 5.07% 4.69% 3.28% 6.83% 3.28% 4.88% 5.05% 4.40% 5.45% 3.19% 11.43% 4.35% 2.91% 7.02% 6.38% 5.37% If shelters were located at bus stops were you 1.45% 7.81% 6.56% 6.43% 3.28% 8.54% 6.06% 4.40% 9.09% 3.19% 7.14% 10.43% 7.77% 7.02% 11.70% 6.67% would board/alight at % % % % % % % % % % % % % % %
77 Q8. Top three reasons respondent would begin using public transportation services Q8. Third choice why respondent would begin using public transportation services The cost of parking increases at the place you work or at places you visit frequently The time it takes to get to your destination by car increases due to traffic congestion Ankeny Altoona Clive Moines Grimes Johnston East West Norwalk Hill South Urbandale Waukee Windsor Heights West Moines 3.42% 4.84% 3.70% 3.49% 9.43% 1.49% 4.55% 3.80% 2.91% 10.23% 0.00% 5.45% 7.29% 3.00% 6.58% 4.54% 10.26% 12.90% 7.41% 6.99% 15.09% 7.46% 9.09% 8.86% 10.68% 9.09% 10.61% 10.00% 10.42% 8.00% 5.26% 9.15% Total Transit stops are located closer to your home Transit stops are located closer to the place you work or visit frequently Buses are scheduled to arrive at stops more frequently Service were offered earlier or later on existing routes Your employer provided incentives to use public transportation services (leave blank if not employed) Better timed transfers between services If it cost less to ride transit If DART provided faster service 8.55% 12.90% 9.26% 7.42% 13.21% 4.48% 11.36% 12.66% 5.83% 9.09% 7.58% 8.18% 11.46% 9.00% 3.95% 8.72% 11.97% 8.06% 11.11% 11.35% 11.32% 10.45% 14.77% 6.33% 8.74% 2.27% 9.09% 11.82% 11.46% 8.00% 9.21% 9.94% 13.68% 9.68% 7.41% 12.23% 13.21% 14.93% 10.23% 10.13% 11.65% 12.50% 12.12% 7.27% 15.63% 12.00% 11.84% 11.74% 9.40% 4.84% 11.11% 8.30% 7.55% 13.43% 7.95% 8.86% 9.71% 4.55% 9.09% 5.45% 7.29% 11.00% 13.16% 8.65% 10.26% 8.06% 16.67% 9.17% 5.66% 13.43% 10.23% 16.46% 13.59% 6.82% 13.64% 11.82% 8.33% 8.00% 9.21% 10.52% 5.13% 4.84% 3.70% 9.17% 0.00% 7.46% 3.41% 7.59% 3.88% 5.68% 10.61% 7.27% 2.08% 8.00% 5.26% 6.05% 7.69% 6.45% 9.26% 6.99% 9.43% 7.46% 9.09% 5.06% 5.83% 4.55% 6.06% 7.27% 7.29% 9.00% 14.47% 7.56% 11.11% 12.90% 7.41% 10.48% 11.32% 4.48% 4.55% 8.86% 10.68% 15.91% 6.06% 13.64% 9.38% 8.00% 9.21% 9.87% If shelters were located at bus stops were you 8.55% 14.52% 12.96% 14.41% 3.77% 14.93% 14.77% 11.39% 16.50% 19.32% 15.15% 11.82% 9.38% 16.00% 11.84% 13.26% would board/alight at % % % % % % % % % % % % % % %
78 Q9. What is the minimum level of service frequency that would encourage you to use public transit at least once a week? Ankeny Altoona Clive Moines Grimes Johnston East West Norwalk Hill South Urbandale Waukee Windsor Heights West Moines Total Less than 10 minutes 10.92% 6.25% 8.14% 12.69% 6.98% 6.31% 6.56% 6.54% 3.73% 2.48% 4.21% 8.92% 7.63% 16.79% 11.29% 8.71% Between 10 to 15 minutes 23.56% 31.25% 32.56% 23.53% 20.93% 26.13% 17.21% 25.23% 22.39% 22.31% 8.42% 26.11% 22.88% 23.36% 25.81% 23.39% Between 15 to 20 minutes 21.84% 17.50% 13.95% 17.34% 16.28% 12.61% 9.02% 15.89% 18.66% 17.36% 8.42% 15.29% 22.88% 17.52% 18.55% 16.61% Between 20 to 30 minutes 16.67% 13.75% 13.95% 11.46% 15.12% 15.32% 9.84% 17.76% 15.67% 9.92% 21.05% 14.01% 14.41% 13.14% 8.06% 13.67% Between 30 to 45 minutes 2.87% 5.00% 1.16% 3.41% 1.16% 7.21% 8.20% 5.61% 4.48% 4.13% 2.11% 1.27% 3.39% 0.73% 2.42% 3.49% Between 45 to 60 minutes 0.57% 1.25% 0.00% 1.86% 5.81% 0.00% 5.74% 0.93% 5.22% 4.13% 5.26% 2.55% 0.00% 0.00% 0.81% 2.18% Would not use bus service 23.56% 25.00% 30.23% 29.72% 33.72% 32.43% 43.44% 28.04% 29.85% 39.67% 50.53% 31.85% 28.81% 28.47% 33.06% 31.95% % % % % % % % % % % % % % % % Q10. For what trip purposes would you be interested in using DART services? Windsor West Multiple responses allowed Ankeny Altoona Clive Moines Grimes Johnston East West Norwalk Hill South Urbandale Waukee Heights Moines Total Work related trip 42.92% 42.59% 36.70% 40.91% 41.96% 33.55% 29.86% 41.73% 51.80% 28.17% 25.23% 34.41% 50.78% 41.38% 32.05% 38.48% School (K 12) 1.89% 2.78% 1.83% 6.82% 3.57% 4.61% 2.78% 3.94% 5.04% 4.23% 1.80% 3.23% 4.69% 4.83% 2.56% 3.92% College/University 5.19% 3.70% 3.67% 4.26% 4.46% 3.29% 2.08% 3.15% 5.76% 4.93% 3.60% 4.30% 3.91% 0.69% 3.85% 3.87% Medical 11.32% 10.19% 9.17% 14.20% 8.93% 7.24% 21.53% 15.75% 15.11% 20.42% 19.82% 9.68% 11.72% 11.03% 15.38% 13.43% Grocery shopping 10.85% 4.63% 7.34% 11.93% 9.82% 8.55% 15.28% 15.75% 16.55% 9.15% 19.82% 7.53% 6.25% 9.66% 10.90% 10.98% Other shopping related trips 18.87% 17.59% 13.76% 25.00% 8.93% 12.50% 22.92% 22.83% 23.74% 17.61% 20.72% 16.13% 14.06% 15.86% 14.74% 18.42% Personal/recreational 29.72% 27.78% 24.77% 36.93% 29.46% 32.89% 23.61% 32.28% 26.62% 30.28% 23.42% 29.03% 26.56% 33.79% 32.69% 30.22% Would not use bus service 31.13% 33.33% 41.28% 30.11% 41.07% 43.42% 42.36% 33.86% 27.34% 35.21% 46.85% 39.78% 28.91% 34.48% 42.31% 35.99% Other 5.66% 2.78% 0.00% 4.55% 2.68% 4.61% 1.39% 3.15% 2.88% 5.63% 0.00% 3.23% 1.56% 3.45% 0.64% 3.14% Q11. Most common trip purpose from Q10 Multiple responses allowed Ankeny Altoona Clive Moines Grimes Johnston East West Norwalk Hill South Urbandale Waukee Windsor Heights West Moines Total College/University 1.48% 0.00% 1.12% 0.53% 0.00% 0.00% 0.00% 1.69% 0.00% 2.00% 2.94% 0.94% 0.00% 0.00% 3.28% 0.96% Grocery shopping 4.44% 3.30% 6.74% 5.79% 3.61% 6.50% 8.11% 8.47% 6.52% 6.00% 2.94% 4.72% 0.00% 8.11% 6.56% 5.46% Medical 2.96% 2.20% 2.25% 5.26% 1.20% 0.00% 5.41% 8.47% 2.17% 4.00% 11.76% 1.89% 6.82% 8.11% 4.92% 3.77% Other 2.22% 1.10% 2.25% 0.00% 1.20% 0.81% 0.00% 1.69% 4.35% 6.00% 0.00% 3.77% 2.27% 2.70% 0.82% 1.69% Other shopping related trips 2.22% 3.30% 5.62% 12.11% 3.61% 4.88% 10.81% 3.39% 6.52% 6.00% 11.76% 7.55% 4.55% 5.41% 6.56% 6.34% Personal/recreational 21.48% 15.38% 15.73% 14.21% 13.25% 17.89% 5.41% 22.03% 4.35% 14.00% 8.82% 16.98% 15.91% 16.22% 18.85% 15.89% School (K 12) 0.00% 2.20% 2.25% 1.05% 1.20% 2.44% 0.00% 0.00% 0.00% 2.00% 2.94% 1.89% 0.00% 5.41% 0.00% 1.28% Work related trip 50.37% 48.35% 38.20% 41.58% 40.96% 38.21% 37.84% 35.59% 60.87% 36.00% 17.65% 40.57% 54.55% 32.43% 38.52% 41.65% Would not use bus service 14.81% 24.18% 25.84% 19.47% 34.94% 29.27% 32.43% 18.64% 15.22% 24.00% 41.18% 21.70% 15.91% 21.62% 20.49% 22.95% % % % % % % % % % % % % % % %
79 Q12. During what times of day would you be most interested in using bus service? Windsor West Multiple responses allowed Ankeny Altoona Clive Moines Grimes Johnston East West Norwalk Hill South Urbandale Waukee Heights Moines Total 5:00 AM 9:00 AM 41.98% 39.81% 34.86% 40.06% 39.29% 34.21% 25.69% 41.73% 46.76% 33.80% 29.73% 36.56% 52.34% 44.14% 32.05% 38.40% 9:00 AM 12:00 PM 16.04% 10.19% 14.68% 18.75% 14.29% 14.47% 18.06% 19.69% 20.14% 17.61% 18.92% 13.44% 14.06% 18.62% 14.74% 16.49% 12:00 PM 3:00 PM 15.09% 9.26% 9.17% 17.05% 6.25% 8.55% 16.67% 18.90% 17.27% 18.31% 18.02% 10.22% 8.59% 11.03% 15.38% 13.78% 3:00 PM 7:00 PM 41.04% 34.26% 33.03% 41.19% 40.18% 34.87% 32.64% 42.52% 53.96% 35.92% 33.33% 34.95% 51.56% 44.83% 30.77% 39.22% 7:00 PM 10:00 PM 11.32% 7.41% 11.01% 16.76% 8.93% 5.92% 9.03% 11.02% 12.95% 14.08% 8.11% 10.22% 9.38% 11.72% 10.90% 11.24% 10:00 PM 5:00 AM 5.66% 8.33% 1.83% 11.65% 3.57% 3.95% 2.08% 4.72% 3.60% 3.52% 6.31% 1.61% 5.47% 4.83% 3.85% 5.29% Would not use bus service 34.91% 39.81% 41.28% 33.52% 43.75% 50.00% 46.53% 34.65% 26.62% 42.96% 47.75% 43.55% 28.91% 35.17% 41.03% 38.74% Q13. During what days of the week would you be most interested in using bus service? Windsor West Multiple responses allowed Ankeny Altoona Clive Moines Grimes Johnston East West Norwalk Hill South Urbandale Waukee Heights Moines Total Monday 45.28% 40.74% 38.53% 46.02% 44.64% 36.18% 40.28% 47.24% 56.12% 40.85% 36.04% 41.40% 53.13% 46.21% 42.31% 43.95% Tuesday 47.64% 43.52% 37.61% 44.89% 48.21% 38.16% 40.97% 51.18% 55.40% 42.25% 35.14% 43.55% 53.13% 46.21% 44.87% 44.98% Wednesday 46.70% 41.67% 36.70% 47.73% 48.21% 38.16% 41.67% 52.76% 57.55% 40.85% 37.84% 43.01% 53.91% 51.03% 42.31% 45.63% Thursday 47.17% 40.74% 39.45% 47.16% 43.75% 40.79% 40.97% 52.76% 55.40% 38.03% 36.04% 40.86% 51.56% 46.21% 46.15% 44.86% Friday 49.53% 42.59% 41.28% 50.85% 41.07% 36.18% 39.58% 55.91% 59.71% 40.85% 38.74% 39.78% 54.69% 50.34% 41.03% 46.02% Saturday 19.81% 17.59% 14.68% 25.57% 16.07% 16.45% 20.14% 18.90% 20.14% 21.13% 19.82% 17.20% 19.53% 20.69% 15.38% 19.54% Sunday 11.79% 11.11% 8.26% 18.47% 9.82% 7.24% 15.28% 10.24% 10.79% 14.79% 12.61% 6.45% 10.94% 12.41% 8.97% 11.88% Would not use bus service 38.68% 41.67% 45.87% 37.78% 42.86% 51.97% 46.53% 35.43% 28.06% 45.07% 52.25% 44.09% 32.81% 39.31% 46.15% 41.46%
80 Q14. How likely respondent would be to use the following types of transportation Q14.1 High speed, rapid bus service that has separate lanes and priority at traffic lights Ankeny Altoona Clive Moines Grimes Johnston East West Norwalk Hill South Urbandale Waukee Windsor Heights West Moines Total Very Likely 18.18% 22.22% 14.63% 26.32% 23.91% 13.45% 13.74% 27.83% 21.21% 19.66% 12.24% 19.30% 21.95% 17.99% 11.54% 19.62% Likely 26.14% 30.86% 29.27% 26.93% 21.74% 27.73% 20.61% 19.13% 33.33% 24.79% 24.49% 23.39% 35.77% 24.46% 29.23% 26.47% Not Sure 31.25% 17.28% 24.39% 24.46% 22.83% 29.41% 29.01% 26.96% 30.30% 29.06% 32.65% 27.49% 27.64% 25.90% 25.38% 27.06% Not Likely 13.64% 13.58% 10.98% 8.67% 11.96% 10.08% 11.45% 11.30% 7.58% 11.97% 10.20% 12.28% 7.32% 12.95% 13.85% 10.99% Very Unlikely 10.80% 16.05% 20.73% 13.62% 19.57% 19.33% 25.19% 14.78% 7.58% 14.53% 20.41% 17.54% 7.32% 18.71% 20.00% 15.87% % % % % % % % % % % % % % % % Q14.2 On demand bus technology that operates in a similar manner to Uber and Lync Windsor West Ankeny Altoona Clive Moines Grimes Johnston East West Norwalk Hill South Urbandale Waukee Heights Moines Total Very Likely 14.53% 23.46% 19.75% 23.15% 13.04% 17.89% 13.85% 20.87% 16.67% 18.97% 12.00% 16.86% 18.70% 12.95% 11.11% 17.29% Likely 23.46% 24.69% 24.69% 26.54% 23.91% 31.71% 30.00% 26.96% 34.85% 19.83% 19.00% 30.81% 30.08% 27.34% 37.04% 27.67% Not Sure 39.66% 27.16% 29.63% 25.93% 31.52% 25.20% 23.08% 26.96% 34.09% 30.17% 35.00% 28.49% 34.15% 32.37% 24.44% 29.68% Not Likely 11.73% 9.88% 9.88% 12.04% 13.04% 7.32% 10.77% 13.04% 7.58% 12.93% 14.00% 9.88% 10.57% 12.23% 11.85% 11.17% Very Unlikely 10.61% 14.81% 16.05% 12.35% 18.48% 17.89% 22.31% 12.17% 6.82% 18.10% 20.00% 13.95% 6.50% 15.11% 15.56% 14.20% % % % % % % % % % % % % % % % Q14.3 Door to door shuttle service for seniors or persons with disabilities Windsor West Ankeny Altoona Clive Moines Grimes Johnston East West Norwalk Hill South Urbandale Waukee Heights Moines Total Very Likely 14.02% 21.25% 16.22% 22.96% 6.82% 13.68% 23.85% 16.22% 14.62% 23.28% 24.00% 14.55% 10.08% 16.42% 15.15% 17.39% Likely 16.46% 16.25% 20.27% 23.27% 18.18% 23.93% 20.00% 24.32% 24.62% 20.69% 22.00% 27.27% 18.49% 20.15% 37.88% 22.65% Not Sure 26.22% 26.25% 21.62% 18.24% 22.73% 23.93% 21.54% 25.23% 29.23% 24.14% 24.00% 19.39% 32.77% 31.34% 18.94% 23.76% Not Likely 17.07% 11.25% 17.57% 11.95% 20.45% 12.82% 10.00% 16.22% 13.85% 11.21% 9.00% 14.55% 17.65% 9.70% 9.85% 13.30% Very Unlikely 26.22% 25.00% 24.32% 23.58% 31.82% 25.64% 24.62% 18.02% 17.69% 20.69% 21.00% 24.24% 21.01% 22.39% 18.18% 22.90% % % % % % % % % % % % % % % % Q14.4 Park and ride services where you park your car & then take an express bus Windsor West Ankeny Altoona Clive Moines Grimes Johnston East West Norwalk Hill South Urbandale Waukee Heights Moines Total Very Likely 14.94% 23.46% 5.26% 12.88% 14.13% 12.40% 12.98% 15.52% 17.42% 14.29% 7.07% 8.28% 14.52% 5.84% 12.21% 12.67% Likely 28.74% 25.93% 18.42% 29.14% 28.26% 34.71% 31.30% 32.76% 29.55% 30.25% 27.27% 27.81% 26.61% 16.06% 25.19% 27.81% Not Sure 29.31% 16.05% 34.21% 21.17% 22.83% 20.66% 22.90% 25.00% 18.18% 21.85% 27.27% 24.85% 31.45% 30.66% 21.37% 24.26% Not Likely 16.67% 13.58% 19.74% 16.26% 10.87% 13.22% 12.21% 12.07% 21.97% 12.61% 13.13% 21.30% 13.71% 22.63% 16.03% 16.07% Very Unlikely 10.34% 20.99% 22.37% 20.55% 23.91% 19.01% 20.61% 14.66% 12.88% 21.01% 25.25% 17.75% 13.71% 24.82% 25.19% 19.18% % % % % % % % % % % % % % % %
81 Q14. How likely respondent would be to use the following types of transportation Q14.5 Bus service that operates on fixed routes in the area where you live Ankeny Altoona Clive Moines Grimes Johnston East West Norwalk Hill South Urbandale Waukee Windsor Heights West Moines Total Very Likely 8.05% 18.07% 4.88% 17.90% 13.33% 8.62% 15.27% 17.54% 12.88% 11.97% 14.29% 9.70% 10.57% 5.15% 8.66% 12.18% Likely 25.86% 28.92% 28.05% 27.16% 22.22% 25.00% 19.85% 24.56% 30.30% 30.77% 17.35% 23.64% 29.27% 30.88% 28.35% 26.29% Not Sure 33.91% 27.71% 34.15% 29.32% 28.89% 28.45% 32.82% 35.09% 34.09% 27.35% 31.63% 30.91% 34.96% 33.82% 29.92% 31.46% Not Likely 18.97% 8.43% 14.63% 12.04% 11.11% 17.24% 10.69% 11.40% 14.39% 13.68% 16.33% 18.18% 16.26% 15.44% 15.75% 14.41% Very Unlikely 13.22% 16.87% 18.29% 13.58% 24.44% 20.69% 21.37% 11.40% 8.33% 16.24% 20.41% 17.58% 8.94% 14.71% 17.32% 15.66% % % % % % % % % % % % % % % % Q14.6 Vanpool service, which would involve having people who work at the same place share a van provided by their employer Ankeny Altoona Clive Moines Grimes Johnston East West Norwalk Hill South Urbandale Waukee Windsor Heights West Moines Total Very Likely 4.19% 15.38% 5.26% 9.49% 4.55% 4.81% 5.51% 9.52% 7.75% 7.08% 6.12% 7.55% 4.84% 4.51% 7.20% 7.00% Likely 17.96% 17.95% 14.47% 12.97% 14.77% 20.19% 11.81% 14.29% 20.93% 12.39% 13.27% 16.35% 9.68% 14.29% 15.20% 14.93% Not Sure 34.13% 24.36% 25.00% 28.48% 19.32% 23.08% 27.56% 23.81% 27.91% 20.35% 29.59% 23.90% 36.29% 25.56% 16.80% 26.36% Not Likely 19.76% 17.95% 31.58% 22.15% 29.55% 17.31% 18.90% 24.76% 24.81% 21.24% 18.37% 22.01% 24.19% 22.56% 22.40% 22.25% Very Unlikely 23.95% 24.36% 23.68% 26.90% 31.82% 34.62% 36.22% 27.62% 18.60% 38.94% 32.65% 30.19% 25.00% 33.08% 38.40% 29.45% % % % % % % % % % % % % % % % Q14.7 Light Rail Train Service Ankeny Altoona Clive Moines Grimes Johnston East West Norwalk Hill South Urbandale Waukee Windsor Heights West Moines Total Very Likely 24.00% 29.63% 21.79% 28.26% 20.22% 26.55% 19.23% 31.30% 27.69% 23.93% 19.59% 22.49% 28.23% 24.82% 20.15% 24.86% Likely 24.57% 30.86% 29.49% 27.33% 30.34% 25.66% 20.00% 20.00% 22.31% 23.93% 16.49% 31.95% 26.61% 18.98% 31.34% 25.46% Not Sure 27.43% 20.99% 23.08% 21.43% 19.10% 19.47% 26.92% 20.87% 26.92% 25.64% 39.18% 23.08% 26.61% 29.20% 21.64% 24.56% Not Likely 10.86% 2.47% 6.41% 6.52% 10.11% 7.96% 10.00% 12.17% 8.46% 6.84% 5.15% 7.69% 8.06% 8.03% 8.96% 8.06% Very Unlikely 13.14% 16.05% 19.23% 16.46% 20.22% 20.35% 23.85% 15.65% 14.62% 19.66% 19.59% 14.79% 10.48% 18.98% 17.91% 17.06% % % % % % % % % % % % % % % %
82 Q15. How important respondent believes the following purposes are: Q15.1 Serving low income, disabled, or senior populations with few other transportation options Ankeny Altoona Clive Moines Grimes Johnston East West Norwalk Hill South Urbandale Waukee Windsor Heights West Moines Total Very Important 77.16% 80.00% 78.72% 91.96% 74.49% 75.81% 79.85% 80.17% 75.37% 84.68% 77.78% 80.12% 74.40% 89.29% 80.00% 81.23% Somewhat Important 19.29% 14.74% 18.09% 6.55% 21.43% 20.16% 17.91% 18.10% 20.15% 11.29% 18.52% 16.37% 24.00% 9.29% 16.43% 15.78% Not Important 3.55% 5.26% 3.19% 1.49% 4.08% 4.03% 2.24% 1.72% 4.48% 4.03% 3.70% 3.51% 1.60% 1.43% 3.57% 3.00% % % % % % % % % % % % % % % % Q15.2 Providing an alternative to congested roadways Ankeny Altoona Clive Moines Grimes Johnston East West Norwalk Hill South Urbandale Waukee Windsor Heights West Moines Total Very Important 59.79% 63.44% 53.85% 58.61% 55.10% 46.03% 52.99% 60.17% 55.22% 57.02% 39.62% 58.58% 55.28% 60.00% 52.17% 55.77% Somewhat Important 33.51% 26.88% 37.36% 34.74% 37.76% 42.86% 40.30% 36.44% 37.31% 34.71% 41.51% 37.87% 39.02% 32.86% 39.13% 36.63% Not Important 6.70% 9.68% 8.79% 6.65% 7.14% 11.11% 6.72% 3.39% 7.46% 8.26% 18.87% 3.55% 5.69% 7.14% 8.70% 7.61% % % % % % % % % % % % % % % % Q15.3 Providing fast, frequent, reliable service on key corridors Ankeny Altoona Clive Moines Grimes Johnston East West Norwalk Hill South Urbandale Waukee Windsor Heights West Moines Total Very Important 66.32% 71.43% 53.85% 66.87% 57.29% 60.32% 62.41% 62.71% 59.26% 56.20% 50.00% 62.28% 65.85% 71.01% 57.46% 62.43% Somewhat Important 29.02% 20.88% 41.76% 28.01% 34.38% 32.54% 32.33% 33.90% 34.81% 41.32% 37.25% 34.73% 30.89% 25.36% 35.07% 32.19% Not Important 4.66% 7.69% 4.40% 5.12% 8.33% 7.14% 5.26% 3.39% 5.93% 2.48% 12.75% 2.99% 3.25% 3.62% 7.46% 5.38% % % % % % % % % % % % % % % % Q15.4 Making it easier to get to/from transit (better sidewalks, stops, etc.) Windsor West Ankeny Altoona Clive Moines Grimes Johnston East West Norwalk Hill South Urbandale Waukee Heights Moines Total Very Important 53.65% 63.04% 38.20% 59.27% 53.85% 47.15% 50.00% 48.28% 52.99% 42.74% 39.62% 49.10% 44.35% 52.86% 45.99% 50.55% Somewhat Important 38.02% 30.43% 48.31% 32.52% 36.26% 44.72% 38.81% 43.10% 38.81% 47.01% 43.40% 44.91% 52.42% 37.14% 43.80% 40.46% Not Important 8.33% 6.52% 13.48% 8.21% 9.89% 8.13% 11.19% 8.62% 8.21% 10.26% 16.98% 5.99% 3.23% 10.00% 10.22% 8.99% % % % % % % % % % % % % % % % Q15.5 Helping to create an environmentally friendly, sustainable city not dependent on car travel Windsor West Ankeny Altoona Clive Moines Grimes Johnston East West Norwalk Hill South Urbandale Waukee Heights Moines Total Very Important 55.44% 65.22% 52.75% 60.24% 54.74% 52.03% 46.62% 50.86% 51.49% 50.83% 41.35% 52.69% 51.20% 57.14% 56.20% 53.95% Somewhat Important 32.12% 20.65% 34.07% 28.92% 29.47% 32.52% 41.35% 37.07% 31.34% 32.50% 38.46% 37.72% 36.80% 32.14% 32.12% 32.97% Not Important 12.44% 14.13% 13.19% 10.84% 15.79% 15.45% 12.03% 12.07% 17.16% 16.67% 20.19% 9.58% 12.00% 10.71% 11.68% 13.08% % % % % % % % % % % % % % % %
83 Q15. How important respondent believes the following purposes are: Q15.6 Expanding DART's service area Ankeny Altoona Clive Moines Grimes Johnston East West Norwalk Hill South Urbandale Waukee Windsor Heights West Moines Total Very Important 51.06% 60.00% 41.86% 54.52% 46.24% 36.21% 48.85% 53.91% 53.44% 44.54% 45.71% 40.37% 46.28% 42.75% 42.19% 47.82% Somewhat Important 35.64% 28.89% 40.70% 35.51% 37.63% 48.28% 40.46% 37.39% 38.17% 39.50% 33.33% 50.31% 38.84% 45.65% 44.53% 39.60% Not Important 13.30% 11.11% 17.44% 9.97% 16.13% 15.52% 10.69% 8.70% 8.40% 15.97% 20.95% 9.32% 14.88% 11.59% 13.28% 12.58% % % % % % % % % % % % % % % % Q15.7 Supporting economic development and access to jobs Ankeny Altoona Clive Moines Grimes Johnston East West Norwalk Hill South Urbandale Waukee Windsor Heights West Moines Total Very Important 58.15% 64.04% 54.44% 62.77% 52.13% 53.78% 58.02% 59.32% 53.79% 53.78% 45.19% 57.23% 54.92% 59.12% 59.70% 57.22% Somewhat Important 32.07% 28.09% 38.89% 31.69% 35.11% 36.97% 33.59% 32.20% 37.88% 36.13% 39.42% 34.94% 36.89% 35.04% 32.09% 34.35% Not Important 9.78% 7.87% 6.67% 5.54% 12.77% 9.24% 8.40% 8.47% 8.33% 10.08% 15.38% 7.83% 8.20% 5.84% 8.21% 8.43% % % % % % % % % % % % % % % % Q16. Overall, how would you rate the impression you have of DART? Windsor West Ankeny Altoona Clive Moines Grimes Johnston East West Norwalk Hill South Urbandale Waukee Heights Moines Total Excellent 4.04% 16.67% 6.12% 11.95% 5.83% 4.65% 7.25% 4.84% 8.03% 8.66% 8.41% 12.64% 5.56% 5.00% 9.35% 8.21% Good 40.91% 50.00% 46.94% 41.98% 37.86% 48.06% 36.23% 38.71% 42.34% 37.80% 29.91% 42.53% 36.51% 45.00% 50.36% 41.72% Average 25.76% 14.58% 21.43% 26.24% 19.42% 15.50% 23.19% 21.77% 24.82% 19.69% 21.50% 22.99% 31.75% 17.14% 19.42% 22.40% Poor 5.05% 4.17% 6.12% 5.54% 3.88% 10.08% 5.07% 3.23% 2.92% 4.72% 4.67% 4.02% 3.17% 7.14% 5.76% 5.09% Don't know 24.24% 14.58% 19.39% 14.29% 33.01% 21.71% 28.26% 31.45% 21.90% 29.13% 35.51% 17.82% 23.02% 25.71% 15.11% 22.58% % % % % % % % % % % % % % % % Q16. Overall, how would you rate the impression you have of DART? Windsor West Excluding "Don't know" Ankeny Altoona Clive Moines Grimes Johnston East West Norwalk Hill South Urbandale Waukee Heights Moines Total Excellent 5.33% 19.51% 7.59% 13.95% 8.70% 5.94% 10.10% 7.06% 10.28% 12.22% 13.04% 15.38% 7.22% 6.73% 11.02% 10.61% Good 54.00% 58.54% 58.23% 48.98% 56.52% 61.39% 50.51% 56.47% 54.21% 53.33% 46.38% 51.75% 47.42% 60.58% 59.32% 53.88% Average 34.00% 17.07% 26.58% 30.61% 28.99% 19.80% 32.32% 31.76% 31.78% 27.78% 33.33% 27.97% 41.24% 23.08% 22.88% 28.93% Poor 6.67% 4.88% 7.59% 6.46% 5.80% 12.87% 7.07% 4.71% 3.74% 6.67% 7.25% 4.90% 4.12% 9.62% 6.78% 6.58% % % % % % % % % % % % % % % % Q17. Overall, how important do you think it is for the region to support and fund public transportation Windsor West Ankeny Altoona Clive Moines Grimes Johnston East West Norwalk Hill South Urbandale Waukee Heights Moines Total Very important 52.53% 50.50% 54.64% 63.72% 48.00% 48.85% 39.71% 50.41% 44.12% 49.61% 31.19% 52.27% 42.86% 60.84% 55.41% 51.32% Somewhat important 30.30% 35.64% 31.96% 23.60% 28.00% 34.35% 32.35% 33.33% 35.29% 29.13% 30.28% 32.95% 36.51% 23.08% 32.43% 30.50% Not sure 10.10% 5.94% 5.15% 8.85% 16.00% 7.63% 21.32% 12.20% 12.50% 14.96% 23.85% 9.09% 15.87% 10.49% 6.08% 11.55% Not important 7.07% 7.92% 8.25% 3.83% 8.00% 9.16% 6.62% 4.07% 8.09% 6.30% 14.68% 5.68% 4.76% 5.59% 6.08% 6.62% % % % % % % % % % % % % % % %
84 Q18. How do you think the current level of funding for public transportation (e.g. bus) in the region should change over the next five years? Ankeny Altoona Clive Moines Grimes Johnston East West Norwalk Hill South Urbandale Waukee Windsor Heights West Moines Total Should be reduced 7.55% 8.86% 10.81% 4.82% 9.30% 10.68% 6.56% 2.78% 3.15% 7.34% 16.30% 8.86% 4.46% 8.53% 7.38% 7.30% Should stay the same 22.01% 16.46% 21.62% 23.79% 25.58% 17.48% 34.43% 21.30% 20.47% 22.94% 23.91% 22.15% 32.14% 20.16% 23.77% 23.37% Should be somewhat greater than it is now 48.43% 49.37% 51.35% 49.52% 48.84% 52.43% 45.90% 50.00% 57.48% 51.38% 51.09% 51.27% 41.96% 52.71% 47.54% 49.92% Should be much greater than it is now 22.01% 25.32% 16.22% 21.86% 16.28% 19.42% 13.11% 25.93% 18.90% 18.35% 8.70% 17.72% 21.43% 18.60% 21.31% 19.41% % % % % % % % % % % % % % % % Q19. Rating importance of the following transportation investments Q19.1 Widening existing roads Ankeny Altoona Clive Moines Grimes Johnston East West Norwalk Hill South Urbandale Waukee Windsor Heights West Moines Total Most Important 26.94% 30.21% 20.43% 20.36% 33.33% 24.43% 17.27% 26.27% 18.52% 26.19% 23.15% 18.71% 29.37% 12.95% 19.29% 22.58% Somewhat Important 35.75% 37.50% 41.94% 33.23% 39.39% 41.98% 38.85% 37.29% 37.78% 35.71% 26.85% 38.01% 40.48% 32.37% 39.29% 36.69% Neutral/ Not sure 24.35% 20.83% 25.81% 28.44% 22.22% 18.32% 28.78% 22.03% 29.63% 27.78% 29.63% 32.16% 18.25% 31.65% 23.57% 26.07% Not Important 8.29% 8.33% 7.53% 12.87% 5.05% 10.69% 9.35% 9.32% 8.89% 6.35% 11.11% 9.36% 10.32% 15.11% 13.57% 10.15% Not Important at All 4.66% 3.13% 4.30% 5.09% 0.00% 4.58% 5.76% 5.08% 5.19% 3.97% 9.26% 1.75% 1.59% 7.91% 4.29% 4.52% % % % % % % % % % % % % % % % Q19.2 Building new roads Ankeny Altoona Clive Moines Grimes Johnston East West Norwalk Hill South Urbandale Waukee Windsor Heights West Moines Total Most Important 15.54% 15.05% 14.61% 11.82% 22.92% 18.60% 9.35% 17.09% 11.11% 16.67% 11.11% 16.87% 21.95% 8.03% 13.57% 14.52% Somewhat Important 39.90% 36.56% 34.83% 31.21% 36.46% 27.13% 34.53% 26.50% 34.81% 32.54% 27.78% 34.34% 34.15% 24.82% 33.57% 32.63% Neutral/ Not sure 27.46% 32.26% 31.46% 33.33% 32.29% 36.43% 28.78% 34.19% 34.81% 38.89% 37.04% 33.13% 27.64% 40.88% 35.00% 33.43% Not Important 11.40% 15.05% 14.61% 15.76% 7.29% 15.50% 18.71% 16.24% 11.85% 8.73% 12.96% 12.05% 13.82% 14.60% 14.29% 13.72% Not Important at All 5.70% 1.08% 4.49% 7.88% 1.04% 2.33% 8.63% 5.98% 7.41% 3.17% 11.11% 3.61% 2.44% 11.68% 3.57% 5.70% % % % % % % % % % % % % % % % Q19.3 Improving public transit Ankeny Altoona Clive Moines Grimes Johnston East West Norwalk Hill South Urbandale Waukee Windsor Heights West Moines Total Most Important 32.31% 34.04% 27.96% 40.77% 24.49% 30.23% 30.43% 35.59% 32.59% 30.47% 22.22% 30.00% 29.92% 31.43% 30.00% 31.97% Somewhat Important 37.44% 41.49% 40.86% 39.58% 46.94% 34.11% 43.48% 37.29% 42.96% 41.41% 33.33% 46.47% 37.01% 45.00% 45.71% 40.81% Neutral/ Not sure 24.62% 17.02% 19.35% 14.29% 20.41% 22.48% 21.74% 20.34% 15.56% 23.44% 27.78% 17.06% 25.20% 17.14% 19.29% 19.82% Not Important 4.10% 5.32% 8.60% 3.27% 3.06% 8.53% 2.17% 5.08% 2.96% 3.13% 5.56% 4.71% 6.30% 4.29% 0.71% 4.28% Not Important at All 1.54% 2.13% 3.23% 2.08% 5.10% 4.65% 2.17% 1.69% 5.93% 1.56% 11.11% 1.76% 1.57% 2.14% 4.29% 3.12% % % % % % % % % % % % % % % %
85 Q19. Rating importance of the following transportation investments Q19.4 Improving the bicycle network Ankeny Altoona Clive Moines Grimes Johnston East West Norwalk Hill South Urbandale Waukee Windsor Heights West Moines Total Most Important 15.63% 15.96% 20.43% 20.36% 27.55% 27.69% 11.76% 19.66% 11.85% 17.32% 8.33% 19.41% 11.81% 26.43% 15.00% 18.08% Somewhat Important 30.73% 25.53% 27.96% 26.05% 22.45% 27.69% 27.21% 25.64% 30.37% 26.77% 15.74% 30.00% 33.86% 25.71% 34.29% 27.60% Neutral/ Not sure 21.35% 24.47% 21.51% 23.05% 20.41% 22.31% 24.26% 18.80% 21.48% 28.35% 26.85% 25.29% 21.26% 17.86% 19.29% 22.47% Not Important 18.23% 24.47% 20.43% 14.67% 14.29% 12.31% 17.65% 13.68% 20.74% 15.75% 20.37% 14.12% 14.96% 17.86% 15.71% 16.63% Not Important at All 14.06% 9.57% 9.68% 15.87% 15.31% 10.00% 19.12% 22.22% 15.56% 11.81% 28.70% 11.18% 18.11% 12.14% 15.71% 15.23% % % % % % % % % % % % % % % % Q19.5 Improving the sidewalk network Ankeny Altoona Clive Moines Grimes Johnston East West Norwalk Hill South Urbandale Waukee Windsor Heights West Moines Total Most Important 17.62% 22.92% 18.18% 27.08% 24.49% 22.90% 16.67% 19.66% 12.59% 22.05% 12.84% 22.49% 15.20% 19.15% 14.18% 19.87% Somewhat Important 36.79% 38.54% 31.82% 37.80% 33.67% 42.75% 40.58% 34.19% 41.48% 33.07% 37.61% 31.95% 32.80% 32.62% 43.26% 36.80% Neutral/ Not sure 29.53% 27.08% 28.41% 24.40% 23.47% 21.37% 26.09% 26.50% 25.19% 29.13% 22.94% 31.36% 29.60% 29.08% 24.82% 26.59% Not Important 11.40% 11.46% 15.91% 7.44% 13.27% 7.63% 8.70% 10.26% 11.85% 10.24% 15.60% 8.88% 18.40% 10.64% 9.22% 10.77% Not Important at All 4.66% 0.00% 5.68% 3.27% 5.10% 5.34% 7.97% 9.40% 8.89% 5.51% 11.01% 5.33% 4.00% 8.51% 8.51% 5.97% % % % % % % % % % % % % % % %
86 Q19 2. Top choice of most important investment Ankeny Altoona Clive Q19 2. Top three investments respondents believe would be most important to focus on in the region Moines Grimes Johnston East West Norwalk Hill South Urbandale Waukee Widening Existing Roads 35.09% 43.21% 30.49% 21.59% 39.08% 38.53% 31.67% 32.41% 29.75% 31.62% 43.33% 29.94% 40.00% 21.09% 31.36% 31.68% Building New Roads 10.53% 13.58% 14.63% 11.63% 16.09% 6.42% 15.00% 10.19% 14.05% 15.38% 7.78% 14.01% 15.00% 8.59% 10.17% 12.09% Improving Public Transit 37.43% 25.93% 37.80% 43.85% 24.14% 30.28% 38.33% 37.96% 37.19% 33.33% 28.89% 38.85% 28.33% 36.72% 39.83% 36.02% Improving the Bicycle Network 9.36% 8.64% 10.98% 7.31% 16.09% 15.60% 5.83% 12.96% 9.09% 11.97% 5.56% 8.92% 7.50% 17.19% 8.47% 10.00% Improving the Sidewalk Network 7.60% 8.64% 6.10% 15.61% 4.60% 9.17% 9.17% 6.48% 9.92% 7.69% 14.44% 8.28% 9.17% 16.41% 10.17% 10.21% % % % % % % % % % % % % % % % Windsor Heights West Moines Total Q19 2. Second choice of most important investment Ankeny Altoona Clive Moines Grimes Johnston East West Norwalk Hill South Urbandale Waukee Widening Existing Roads 17.39% 21.13% 23.19% 19.22% 24.39% 12.12% 20.54% 20.20% 16.81% 14.55% 14.46% 16.67% 20.00% 14.41% 18.27% 18.05% Building New Roads 25.47% 29.58% 17.39% 13.17% 25.61% 28.28% 22.32% 24.24% 25.66% 24.55% 26.51% 22.00% 31.30% 13.56% 15.38% 21.96% Improving Public Transit 17.39% 25.35% 23.19% 25.27% 15.85% 17.17% 21.43% 23.23% 23.01% 22.73% 20.48% 16.67% 15.65% 25.42% 25.96% 21.39% Improving the Bicycle Network 21.12% 15.49% 26.09% 20.64% 17.07% 15.15% 19.64% 16.16% 20.35% 19.09% 18.07% 25.33% 21.74% 30.51% 24.04% 21.00% Improving the Sidewalk Network 18.63% 8.45% 10.14% 21.71% 17.07% 27.27% 16.07% 16.16% 14.16% 19.09% 20.48% 19.33% 11.30% 16.10% 16.35% 17.60% % % % % % % % % % % % % % % % Windsor Heights West Moines Total Q19 2. Third choice of most important investment Ankeny Altoona Clive Moines Grimes Johnston East West Norwalk Hill South Urbandale Waukee Widening Existing Roads 15.28% 14.06% 12.28% 16.87% 9.33% 14.13% 20.59% 15.22% 21.90% 19.80% 8.45% 19.20% 10.38% 20.75% 18.18% 16.30% Building New Roads 17.36% 6.25% 15.79% 14.86% 24.00% 9.78% 9.80% 10.87% 17.14% 10.89% 22.54% 14.40% 16.04% 9.43% 19.32% 14.52% Improving Public Transit 25.00% 29.69% 14.04% 18.88% 25.33% 28.26% 21.57% 26.09% 27.62% 29.70% 25.35% 24.00% 27.36% 27.36% 14.77% 24.03% Improving the Bicycle Network 17.36% 15.63% 22.81% 17.27% 13.33% 17.39% 17.65% 21.74% 9.52% 8.91% 7.04% 13.60% 14.15% 12.26% 14.77% 15.03% Improving the Sidewalk Network 25.00% 34.38% 35.09% 32.13% 28.00% 30.43% 30.39% 26.09% 23.81% 30.69% 36.62% 28.80% 32.08% 30.19% 32.95% 30.12% % % % % % % % % % % % % % % % Windsor Heights West Moines Total
87 Q20. Would you be willing to pay up to an additional $80/per year, per household to expand public transportation in the region including more routes, faster service in key corridors, more frequency, and more times? Ankeny Altoona Clive Moines Grimes Johnston East West Norwalk Hill South Urbandale Waukee Windsor Heights West Moines Total No 35.57% 32.99% 36.46% 37.46% 47.96% 40.00% 58.27% 38.71% 40.00% 45.38% 52.29% 35.67% 42.52% 37.76% 34.27% 40.41% Yes 28.87% 22.68% 29.17% 30.68% 24.49% 33.33% 12.23% 24.19% 28.89% 23.85% 11.93% 33.92% 32.28% 29.37% 25.87% 26.93% Not sure 35.57% 44.33% 34.38% 31.86% 27.55% 26.67% 29.50% 37.10% 31.11% 30.77% 35.78% 30.41% 25.20% 32.87% 39.86% 32.66% % % % % % % % % % % % % % % % Q21. Would you be willing to pay up to an additional $40/per year, per household to expand public transportation in the region including more routes, faster service in key corridors, more frequency, and more times? If "no" or "not sure" to Q20. Ankeny Altoona Clive Moines Grimes Johnston East West Norwalk Hill South Urbandale Waukee Windsor Heights West Moines Total No 34.85% 34.25% 36.36% 37.23% 39.19% 48.28% 45.45% 38.20% 37.50% 37.37% 39.78% 33.94% 38.10% 38.61% 30.48% 37.88% Yes 27.27% 19.18% 33.33% 35.50% 27.03% 17.24% 28.10% 28.09% 30.21% 32.32% 27.96% 44.04% 29.76% 39.60% 36.19% 31.15% Not sure 37.88% 46.58% 30.30% 27.27% 33.78% 34.48% 26.45% 33.71% 32.29% 30.30% 32.26% 22.02% 32.14% 21.78% 33.33% 30.96% % % % % % % % % % % % % % % %
88 Strongly Do NOT Support 37.63% 45.00% 34.41% 41.11% 41.84% 38.35% 56.20% 38.02% 27.94% 45.38% 53.33% 29.65% 33.07% 34.97% 29.29% 38.81% % % % % % % % % % % % % % % % Strongly Do NOT Support 34.18% 38.14% 32.98% 34.71% 38.14% 36.43% 48.55% 44.17% 23.70% 33.59% 36.19% 29.48% 38.10% 34.27% 29.79% 35.15% % % % % % % % % % % % % % % % Q22. How strongly respondents support the following funding sources used to grow public transit infrastructure: Q22.1 Vehicle Registration Fee: Add a $20 annual fee to each car's registration fee in the areas serviced by DART Ankeny Altoona Clive Moines Grimes Johnston East West Norwalk Hill South Urbandale Waukee Windsor Heights West Moines Total Strongly Support 10.31% 10.00% 11.83% 14.58% 9.18% 16.54% 6.57% 10.74% 11.03% 10.00% 2.86% 14.53% 11.02% 20.28% 10.71% 11.88% Somewhat Support 27.32% 15.00% 23.66% 20.41% 16.33% 24.06% 16.06% 28.10% 30.15% 18.46% 16.19% 21.51% 22.83% 20.28% 21.43% 21.69% Neutral/ Not sure 13.92% 23.00% 17.20% 12.54% 16.33% 10.53% 10.95% 14.05% 13.24% 13.08% 14.29% 19.19% 12.60% 12.59% 18.57% 14.46% Somewhat Do NOT Support 10.82% 7.00% 12.90% 11.37% 16.33% 10.53% 10.22% 9.09% 17.65% 13.08% 13.33% 15.12% 20.47% 11.89% 20.00% 13.17% Q22.2 Sales Tax: Add 1/2 cent sales tax in Dallas and Polk County Ankeny Altoona Clive Moines Grimes Johnston East West Norwalk Hill South Urbandale Waukee Windsor Heights West Moines Total Strongly Support 11.22% 6.19% 10.64% 14.41% 7.22% 13.18% 10.14% 8.33% 20.74% 13.74% 10.48% 6.94% 11.11% 13.99% 15.60% 12.01% Somewhat Support 21.43% 23.71% 23.40% 22.94% 22.68% 16.28% 15.94% 23.33% 22.22% 25.95% 21.90% 29.48% 19.84% 23.08% 24.11% 22.54% Neutral/ Not sure 18.37% 17.53% 18.09% 15.29% 20.62% 19.38% 11.59% 15.00% 19.26% 15.27% 19.05% 18.50% 17.46% 13.29% 14.89% 16.67% Somewhat Do NOT Support 14.80% 14.43% 14.89% 12.65% 11.34% 14.73% 13.77% 9.17% 14.07% 11.45% 12.38% 15.61% 13.49% 15.38% 15.60% 13.63% Q22.3 Property Tax: Add up to 85 cents/$1000 of taxable valuation of houses in areas serviced by DART Windsor West Ankeny Altoona Clive Moines Grimes Johnston East West Norwalk Hill South Urbandale Waukee Heights Moines Total Strongly Support 4.15% 3.06% 5.38% 7.65% 2.04% 5.43% 3.65% 5.83% 5.22% 6.98% 4.76% 5.78% 3.17% 8.39% 5.04% 5.42% Somewhat Support 12.44% 15.31% 10.75% 13.24% 13.27% 14.73% 7.30% 15.83% 21.64% 10.85% 10.48% 11.56% 16.67% 15.38% 15.11% 13.58% Neutral/ Not sure 19.17% 19.39% 27.96% 15.29% 16.33% 19.38% 8.76% 14.17% 17.91% 20.93% 17.14% 16.76% 18.25% 14.69% 15.11% 17.01% Somewhat Do NOT Support 17.62% 11.22% 16.13% 15.59% 13.27% 13.95% 16.79% 17.50% 14.93% 13.95% 15.24% 19.65% 19.05% 13.29% 25.90% 16.46% Strongly Do NOT Support 46.63% 51.02% 39.78% 48.24% 55.10% 46.51% 63.50% 46.67% 40.30% 47.29% 52.38% 46.24% 42.86% 48.25% 38.85% 47.52% % % % % % % % % % % % % % % %
89 Demographics Q23. How many operating vehicles (cars, motorcycles, vans) do you have in your household? Windsor West Open ended response Ankeny Altoona Clive Moines Grimes Johnston East West Norwalk Hill South Urbandale Waukee Heights Moines Total % 0.93% 0.92% 1.14% 0.00% 0.00% 0.00% 0.00% 0.00% 2.82% 1.80% 0.54% 0.00% 0.69% 0.00% 0.65% % 11.11% 14.68% 27.84% 11.61% 11.84% 22.22% 9.45% 12.95% 17.61% 14.41% 15.59% 11.72% 23.45% 36.54% 19.24% % 48.15% 54.13% 41.19% 52.68% 57.89% 34.03% 41.73% 55.40% 48.59% 43.24% 47.85% 56.25% 54.48% 41.67% 47.27% % 25.93% 14.68% 14.49% 16.96% 15.13% 27.78% 25.20% 20.86% 18.31% 22.52% 23.66% 23.44% 14.48% 11.54% 18.81% % 6.48% 7.34% 7.39% 10.71% 8.55% 8.33% 12.60% 4.32% 8.45% 11.71% 6.99% 7.03% 4.14% 4.49% 7.62% % 0.00% 2.75% 4.55% 0.89% 1.32% 2.78% 3.94% 3.60% 2.11% 2.70% 1.08% 0.00% 0.69% 3.85% 2.41% % 0.93% 1.83% 0.85% 0.00% 0.66% 1.39% 1.57% 0.72% 0.00% 0.90% 0.54% 0.78% 0.69% 0.00% 0.73% % 0.93% 0.92% 0.28% 0.00% 0.00% 2.78% 0.00% 0.72% 0.70% 0.00% 0.00% 0.00% 0.00% 0.00% 0.43% % 0.00% 0.00% 0.57% 0.00% 0.00% 0.00% 0.00% 0.00% 0.00% 0.90% 0.54% 0.00% 0.00% 0.00% 0.17% % 0.00% 0.00% 0.00% 0.00% 0.00% 0.00% 0.00% 0.00% 0.00% 0.00% 0.00% 0.00% 0.00% 0.00% 0.04% % 0.00% 0.00% 0.00% 0.00% 0.00% 0.00% 0.79% 0.00% 0.00% 0.00% 0.00% 0.00% 0.00% 0.00% 0.04% % 0.00% 0.00% 0.00% 0.00% 0.00% 0.00% 0.00% 0.00% 0.00% 0.00% 0.00% 0.78% 0.00% 0.00% 0.04% % 0.00% 0.00% 0.00% 0.00% 0.00% 0.00% 0.79% 0.00% 0.00% 0.00% 0.00% 0.00% 0.00% 0.00% 0.04% % 0.00% 0.00% 0.28% 0.00% 0.00% 0.00% 0.00% 0.00% 0.00% 0.00% 0.00% 0.00% 0.00% 0.00% 0.04% % 0.00% 0.00% 0.00% 0.00% 0.00% 0.00% 0.79% 0.00% 0.00% 0.00% 0.00% 0.00% 0.00% 0.00% 0.04% Not provided 2.36% 5.56% 2.75% 1.42% 7.14% 4.61% 0.69% 3.15% 1.44% 1.41% 1.80% 3.23% 0.00% 1.38% 1.92% 2.41% % % % % % % % % % % % % % % % Q24. Do you have a valid driver's license? Ankeny Altoona Clive Moines Grimes Johnston East West Norwalk Hill South Urbandale Waukee Windsor Heights West Moines Total No 0.48% 0.00% 1.89% 2.32% 0.00% 0.00% 0.70% 0.00% 0.73% 2.16% 0.92% 0.55% 0.00% 2.10% 1.31% 1.01% Yes 99.52% % 98.11% 97.68% % % 99.30% % 99.27% 97.84% 99.08% 99.45% % 97.90% 98.69% 98.99% % % % % % % % % % % % % % % % Q25. Including yourself, how many licensed drivers do you have in your household? Windsor West Open ended Ankeny Altoona Clive Moines Grimes Johnston East West Norwalk Hill South Urbandale Waukee Heights Moines Total % 0.00% 0.92% 0.85% 0.00% 0.00% 0.69% 0.00% 0.00% 2.11% 0.90% 1.08% 0.00% 0.69% 0.00% 0.52% % 13.89% 13.76% 29.55% 10.71% 17.11% 18.75% 11.81% 13.67% 22.54% 16.22% 14.52% 9.38% 23.45% 33.97% 19.93% % 63.89% 60.55% 55.40% 66.07% 64.47% 59.03% 59.84% 63.31% 59.86% 59.46% 64.52% 66.41% 61.38% 49.36% 59.88% % 14.81% 12.84% 10.23% 13.39% 7.24% 15.28% 16.54% 15.11% 12.68% 14.41% 12.90% 14.06% 7.59% 7.69% 12.01% % 2.78% 5.50% 2.56% 5.36% 2.63% 4.17% 7.09% 5.04% 1.41% 7.21% 3.76% 7.81% 3.45% 4.49% 4.18% % 0.00% 0.92% 0.28% 0.89% 1.32% 0.00% 2.36% 0.00% 0.00% 0.90% 1.08% 1.56% 0.00% 1.28% 0.73% % 0.00% 0.00% 0.00% 0.00% 0.00% 0.69% 0.00% 0.00% 0.00% 0.00% 0.00% 0.78% 0.00% 0.64% 0.13% % 0.00% 0.92% 0.00% 0.00% 0.00% 0.00% 0.00% 0.72% 0.00% 0.00% 0.00% 0.00% 0.00% 0.00% 0.09% Not provided 2.83% 4.63% 4.59% 1.14% 3.57% 7.24% 1.39% 2.36% 2.16% 1.41% 0.90% 2.15% 0.00% 3.45% 2.56% 2.54% % % % % % % % % % % % % % % %
90 American Indian/Eskimo 0.94% 0.00% 0.00% 1.99% 0.00% 1.97% 0.69% 2.36% 0.00% 0.00% 0.00% 0.54% 0.78% 0.00% 0.64% 0.82% Hispanic 0.47% 0.00% 1.83% 1.99% 1.79% 2.63% 0.00% 0.00% 2.16% 0.70% 0.90% 0.00% 0.78% 1.38% 0.64% 1.08% Other 0.47% 1.85% 2.75% 0.85% 1.79% 0.66% 2.08% 0.79% 2.16% 4.93% 0.00% 0.00% 0.78% 0.69% 2.56% 1.38% Q26. What is your age? Ankeny Altoona Clive Moines Grimes Johnston East West Norwalk Hill South Urbandale Waukee Windsor Heights West Moines Total years 2.39% 0.00% 1.89% 2.02% 0.00% 1.40% 0.70% 0.82% 1.47% 0.00% 1.83% 1.10% 0.00% 2.08% 3.29% 1.41% years 9.57% 14.15% 11.32% 9.83% 22.02% 5.59% 10.56% 7.38% 10.29% 7.91% 4.59% 6.04% 16.67% 14.58% 5.92% 10.08% years 35.89% 39.62% 18.87% 28.90% 39.45% 29.37% 25.35% 29.51% 30.88% 20.86% 27.52% 24.18% 46.03% 16.67% 21.05% 28.75% years 32.06% 30.19% 39.62% 37.57% 30.28% 43.36% 30.99% 34.43% 40.44% 41.73% 35.78% 41.76% 27.78% 32.64% 36.18% 35.98% 65+ year 20.10% 16.04% 28.30% 21.68% 8.26% 20.28% 32.39% 27.87% 16.91% 29.50% 30.28% 26.92% 9.52% 34.03% 33.55% 23.78% % % % % % % % % % % % % % % % Q27. Which of the following best describes your race/ethnicity? Multiple responses allowed Ankeny Altoona Clive Moines Grimes Johnston East West Norwalk Hill South Urbandale Waukee Windsor Heights West Moines Total Asian/Pacific Islander 1.42% 1.85% 0.00% 1.99% 0.00% 1.97% 0.00% 1.57% 0.72% 0.70% 0.00% 1.61% 3.13% 0.00% 1.28% 1.21% Black/African American 0.00% 0.93% 0.92% 6.82% 0.89% 1.32% 1.39% 2.36% 0.00% 2.11% 0.90% 0.00% 0.78% 1.38% 1.28% 1.85% Caucasian/White 93.40% 96.30% 91.74% 85.23% 93.75% 89.47% 93.75% 92.13% 94.24% 90.14% 97.30% 94.62% 89.06% 94.48% 92.31% 91.82% Q28. Do you have a physical disability that causes you to be dependent on others for transportation? Windsor West Ankeny Altoona Clive Moines Grimes Johnston East West Norwalk Hill South Urbandale Waukee Heights Moines Total No 98.06% 98.10% 98.06% 92.67% % % 93.71% 95.16% 98.55% 95.68% 95.45% 97.81% 98.43% 96.45% 94.56% 96.45% Yes 1.94% 1.90% 1.94% 7.33% 0.00% 0.00% 6.29% 4.84% 1.45% 4.32% 4.55% 2.19% 1.57% 3.55% 5.44% 3.55% % % % % % % % % % % % % % % % Q29. Are you employed? Ankeny Altoona Clive Moines Grimes Johnston East West Norwalk Hill South Urbandale Waukee Windsor Heights West Moines Total No 29.35% 22.12% 26.21% 28.53% 12.04% 25.76% 36.62% 36.89% 22.79% 35.04% 37.04% 27.37% 10.94% 30.50% 34.46% 28.08% Yes 70.65% 77.88% 73.79% 71.47% 87.96% 74.24% 63.38% 63.11% 77.21% 64.96% 62.96% 72.63% 89.06% 69.50% 65.54% 71.92% % % % % % % % % % % % % % % % Q30. Would you say your total annual household income is: Ankeny Altoona Clive Moines Grimes Johnston East West Norwalk Hill South Urbandale Waukee Windsor Heights West Moines Total Under $30, % 5.21% 7.45% 18.58% 7.14% 5.43% 17.91% 5.22% 7.41% 10.77% 11.65% 5.99% 0.81% 8.63% 6.52% 9.59% $30,000 to $59, % 27.08% 17.02% 22.29% 7.14% 13.95% 16.42% 20.87% 17.04% 20.00% 21.36% 12.57% 9.68% 15.83% 26.81% 18.10% $60,000 to $99, % 28.13% 18.09% 28.79% 27.55% 23.26% 32.84% 33.04% 23.70% 30.00% 26.21% 22.16% 12.90% 32.37% 18.12% 25.80% $100,000 or more 32.98% 32.29% 46.81% 19.50% 51.02% 46.51% 20.90% 26.96% 35.56% 32.31% 16.50% 44.91% 58.87% 24.46% 34.78% 33.41% Not provided 13.09% 7.29% 10.64% 10.84% 7.14% 10.85% 11.94% 13.91% 16.30% 6.92% 24.27% 14.37% 17.74% 18.71% 13.77% 13.09% % % % % % % % % % % % % % % %
91 Q30. Would you say your total annual household income is: Excluding "Not provided" Ankeny Altoona Clive Moines Grimes Johnston East West Norwalk Hill South Urbandale Waukee Windsor Heights West Moines Total Under $30, % 5.62% 8.33% 20.83% 7.69% 6.09% 20.34% 6.06% 8.85% 11.57% 15.38% 6.99% 0.98% 10.62% 7.56% 11.04% $30,000 to $59, % 29.21% 19.05% 25.00% 7.69% 15.65% 18.64% 24.24% 20.35% 21.49% 28.21% 14.69% 11.76% 19.47% 31.09% 20.83% $60,000 to $99, % 30.34% 20.24% 32.29% 29.67% 26.09% 37.29% 38.38% 28.32% 32.23% 34.62% 25.87% 15.69% 39.82% 21.01% 29.69% $100,000 or more 37.95% 34.83% 52.38% 21.88% 54.95% 52.17% 23.73% 31.31% 42.48% 34.71% 21.79% 52.45% 71.57% 30.09% 40.34% 38.44% % % % % % % % % % % % % % % % Q32. Your gender: Ankeny Altoona Clive Moines Grimes Johnston East West Norwalk Hill South Urbandale Waukee Windsor Heights West Moines Total Female 60.39% 60.58% 53.77% 59.13% 54.05% 42.76% 62.50% 55.20% 56.12% 62.14% 44.55% 41.76% 47.20% 50.00% 65.13% 54.85% Male 39.61% 39.42% 46.23% 40.87% 45.95% 57.24% 37.50% 44.80% 43.88% 37.86% 55.45% 58.24% 52.80% 50.00% 34.87% 45.15% % % % % % % % % % % % % % % % Q33. Prior to receiving this survey, were you familiar with the public transit services offered by DART (the Moines Area Regional Transit Authority)? Ankeny Altoona Clive Moines Grimes Johnston East West Norwalk Hill South Urbandale Waukee Windsor Heights West Moines Total No 25.51% 21.57% 20.00% 11.99% 16.35% 21.48% 29.71% 29.37% 19.40% 25.74% 34.58% 20.88% 21.95% 19.86% 19.31% 21.53% Yes 74.49% 78.43% 80.00% 88.01% 83.65% 78.52% 70.29% 70.63% 80.60% 74.26% 65.42% 79.12% 78.05% 80.14% 80.69% 78.47% % % % % % % % % % % % % % % %
92 Section 4: GIS Maps


93 Location of Survey Respondents 2016 DART Transit Non-Rider Survey

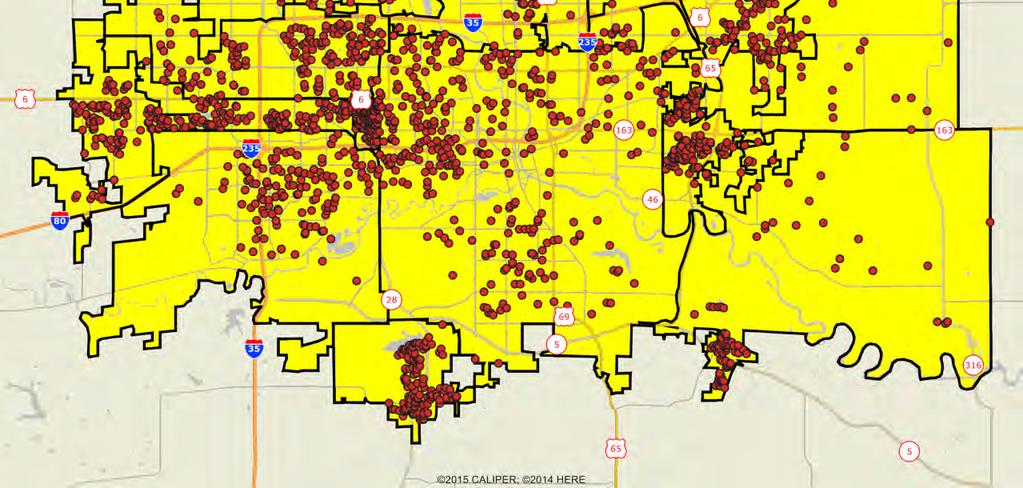

94 Location of Survey Respondents 2016 DART Transit Non-Rider Survey

95 Q1 How Likely Respondent is to Vote in the Next Municipal Election Liklihood Mean rating on a 4-point scale Very Likely Somewhat Likely Somewhat Unlikely Very Unlikely No Response 2016 DART Transit Non-Rider Survey Shading reflects the mean rating for all respondents by zone ETC INSTITUTE

96 Q4. How Respondent s Rate Overall DART Services Quality of Service Mean rating on a 4-point scale Excellent Good Average Poor No Response 2016 DART Transit Non-Rider Survey Shading reflects the mean rating for all respondents by zone ETC INSTITUTE
97 Q5.1 Respondent s Level of Agreement With: Public transportation takes too long compared to travel by other mode Agreement Mean rating on a 5-point scale Strongly Disagree Disagree Neutral Agree Strongly Agree No Response 2016 DART Transit Non-Rider Survey Shading reflects the mean rating for all respondents by zone ETC INSTITUTE

98 Q5.2 Respondent s Level of Agreement With: Transit service is not offered when I need to use it Agreement Mean rating on a 5-point scale Strongly Disagree Disagree Neutral Agree Strongly Agree No Response 2016 DART Transit Non-Rider Survey Shading reflects the mean rating for all respondents by zone ETC INSTITUTE

99 Q5.3 Respondent s Level of Agreement With: Transit service is not offered near my home Agreement Mean rating on a 5-point scale Strongly Disagree Disagree Neutral Agree Strongly Agree No Response 2016 DART Transit Non-Rider Survey Shading reflects the mean rating for all respondents by zone ETC INSTITUTE
100 Q5.4 Respondent s Level of Agreement With: Transit service does not take me to where I need to go Agreement Mean rating on a 5-point scale Strongly Disagree Disagree Neutral Agree Strongly Agree No Response 2016 DART Transit Non-Rider Survey Shading reflects the mean rating for all respondents by zone ETC INSTITUTE
101 Q5.5 Respondent s Level of Agreement With: Information about transit service is difficult to understand Agreement Mean rating on a 5-point scale Strongly Disagree Disagree Neutral Agree Strongly Agree No Response 2016 DART Transit Non-Rider Survey Shading reflects the mean rating for all respondents by zone ETC INSTITUTE
102 Q5.6 Respondent s Level of Agreement With: Buses are not on time Agreement Mean rating on a 5-point scale Strongly Disagree Disagree Neutral Agree Strongly Agree No Response 2016 DART Transit Non-Rider Survey Shading reflects the mean rating for all respondents by zone ETC INSTITUTE
103 Q5.7 Respondent s Level of Agreement With: Buses are not reliable Agreement Mean rating on a 5-point scale Strongly Disagree Disagree Neutral Agree Strongly Agree No Response 2016 DART Transit Non-Rider Survey Shading reflects the mean rating for all respondents by zone ETC INSTITUTE
104 Q5.8 Respondent s Level of Agreement With: I have too many places I need to go during the day to use public transportation Agreement Mean rating on a 5-point scale Strongly Disagree Disagree Neutral Agree Strongly Agree No Response 2016 DART Transit Non-Rider Survey Shading reflects the mean rating for all respondents by zone ETC INSTITUTE
105 Q5.9 Respondent s Level of Agreement With: I do not feel safe on the bus Agreement Mean rating on a 5-point scale Strongly Disagree Disagree Neutral Agree Strongly Agree No Response 2016 DART Transit Non-Rider Survey Shading reflects the mean rating for all respondents by zone ETC INSTITUTE
106 Q5.10 Respondent s Level of Agreement With: I do not feel safe waiting at bus stops Agreement Mean rating on a 5-point scale Strongly Disagree Disagree Neutral Agree Strongly Agree No Response 2016 DART Transit Non-Rider Survey Shading reflects the mean rating for all respondents by zone ETC INSTITUTE
107 Q5.11 Respondent s Level of Agreement With: Riding the bus it too expensive Agreement Mean rating on a 5-point scale Strongly Disagree Disagree Neutral Agree Strongly Agree No Response 2016 DART Transit Non-Rider Survey Shading reflects the mean rating for all respondents by zone ETC INSTITUTE
108 Q5.12 Respondent s Level of Agreement With: I prefer to drive rather than use public transportation Agreement Mean rating on a 5-point scale Strongly Disagree Disagree Neutral Agree Strongly Agree No Response 2016 DART Transit Non-Rider Survey Shading reflects the mean rating for all respondents by zone ETC INSTITUTE

109 Q5.13 Respondent s Level of Agreement With: Public transportation is important for a thriving community Agreement Mean rating on a 5-point scale Strongly Disagree Disagree Neutral Agree Strongly Agree No Response 2016 DART Transit Non-Rider Survey Shading reflects the mean rating for all respondents by zone ETC INSTITUTE


110 Q7.1 How Likely Respondent Would Be To Begin Using Public Transportation if: The cost of parking increases at the place you work or at places you visit frequently Likelihood of Use Mean rating on a 5-point scale Not Likely At All Not Likely Not Sure Likely Very Likely No Response 2016 DART Transit Non-Rider Survey Shading reflects the mean rating for all respondents by zone ETC INSTITUTE
111 Q7.2 How Likely Respondent Would Be To Begin Using Public Transportation if: The time it takes to get to your destination by car increases due to traffic congestion Likelihood of Use Mean rating on a 5-point scale Not Likely At All Not Likely Not Sure Likely Very Likely No Response 2016 DART Transit Non-Rider Survey Shading reflects the mean rating for all respondents by zone ETC INSTITUTE

112 Q7.3 How Likely Respondent Would Be To Begin Using Public Transportation if: Transit stops are located closer to your home Likelihood of Use Mean rating on a 5-point scale Not Likely At All Not Likely Not Sure Likely Very Likely No Response 2016 DART Transit Non-Rider Survey Shading reflects the mean rating for all respondents by zone ETC INSTITUTE
113 Q7.4 How Likely Respondent Would Be To Begin Using Public Transportation if: Transit stops are located closer to the place you work or visit frequently Likelihood of Use Mean rating on a 5-point scale Not Likely At All Not Likely Not Sure Likely Very Likely No Response 2016 DART Transit Non-Rider Survey Shading reflects the mean rating for all respondents by zone ETC INSTITUTE
114 Q7.5 How Likely Respondent Would Be To Begin Using Public Transportation if: Buses are scheduled to arrive at stops more frequently Likelihood of Use Mean rating on a 5-point scale Not Likely At All Not Likely Not Sure Likely Very Likely No Response 2016 DART Transit Non-Rider Survey Shading reflects the mean rating for all respondents by zone ETC INSTITUTE
115 Q7.6 How Likely Respondent Would Be To Begin Using Public Transportation if: Service were offered earlier or later on existing routes Likelihood of Use Mean rating on a 5-point scale Not Likely At All Not Likely Not Sure Likely Very Likely No Response 2016 DART Transit Non-Rider Survey Shading reflects the mean rating for all respondents by zone ETC INSTITUTE

116 Q7.7 How Likely Respondent Would Be To Begin Using Public Transportation if: Your employer provided incentives to use public transportation services Likelihood of Use Mean rating on a 5-point scale Not Likely At All Not Likely Not Sure Likely Very Likely No Response 2016 DART Transit Non-Rider Survey Shading reflects the mean rating for all respondents by zone ETC INSTITUTE
117 Q7.8 How Likely Respondent Would Be To Begin Using Public Transportation if: Better timed transfers between services Likelihood of Use Mean rating on a 5-point scale Not Likely At All Not Likely Not Sure Likely Very Likely No Response 2016 DART Transit Non-Rider Survey Shading reflects the mean rating for all respondents by zone ETC INSTITUTE


118 Q7.9 How Likely Respondent Would Be To Begin Using Public Transportation if: If it cost less to ride transit Likelihood of Use Mean rating on a 5-point scale Not Likely At All Not Likely Not Sure Likely Very Likely No Response 2016 DART Transit Non-Rider Survey Shading reflects the mean rating for all respondents by zone ETC INSTITUTE
119 Q7.10 How Likely Respondent Would Be To Begin Using Public Transportation if: If DART provided faster service Likelihood of Use Mean rating on a 5-point scale Not Likely At All Not Likely Not Sure Likely Very Likely No Response 2016 DART Transit Non-Rider Survey Shading reflects the mean rating for all respondents by zone ETC INSTITUTE

120 Q7.11 How Likely Respondent Would Be To Begin Using Public Transportation if: If shelters were located at bus stops where you would board/alight at Likelihood of Use Mean rating on a 5-point scale Not Likely At All Not Likely Not Sure Likely Very Likely No Response 2016 DART Transit Non-Rider Survey Shading reflects the mean rating for all respondents by zone ETC INSTITUTE

121 Q14.1 How Likely Respondents Would Be To Use The Following Types of Transportation: High speed, rapid bus service that has separate lanes and priority at traffic lights Likelihood of Use Mean rating on a 5-point scale Not Likely At All Not Likely Not Sure Likely Very Likely No Response 2016 DART Transit Non-Rider Survey Shading reflects the mean rating for all respondents by zone ETC INSTITUTE

122 Q14.2 How Likely Respondents Would Be To Use The Following Types of Transportation: On-demand bus technology that operates in a similar manner to Uber and Lync Likelihood of Use Mean rating on a 5-point scale Not Likely At All Not Likely Not Sure Likely Very Likely No Response 2016 DART Transit Non-Rider Survey Shading reflects the mean rating for all respondents by zone ETC INSTITUTE
123 Q14.3 How Likely Respondents Would Be To Use The Following Types of Transportation: Door-to-door shuttle service for seniors or persons with disabilities Likelihood of Use Mean rating on a 5-point scale Not Likely At All Not Likely Not Sure Likely Very Likely No Response 2016 DART Transit Non-Rider Survey Shading reflects the mean rating for all respondents by zone ETC INSTITUTE
124 Q14.4 How Likely Respondents Would Be To Use The Following Types of Transportation: Park and ride services where you park your car & then take an express bus (with limited stops) to your destination Likelihood of Use Mean rating on a 5-point scale Not Likely At All Not Likely Not Sure Likely Very Likely No Response 2016 DART Transit Non-Rider Survey Shading reflects the mean rating for all respondents by zone ETC INSTITUTE
125 Q14.5 How Likely Respondents Would Be To Use The Following Types of Transportation: Bus service that operates on fixed routes in the area where you live Likelihood of Use Mean rating on a 5-point scale Not Likely At All Not Likely Not Sure Likely Very Likely No Response 2016 DART Transit Non-Rider Survey Shading reflects the mean rating for all respondents by zone ETC INSTITUTE
126 Q14.6 How Likely Respondents Would Be To Use The Following Types of Transportation: Vanpool service, which would involve having people who work at the same place share a van provided by their employer Likelihood of Use Mean rating on a 5-point scale Not Likely At All Not Likely Not Sure Likely Very Likely No Response 2016 DART Transit Non-Rider Survey Shading reflects the mean rating for all respondents by zone ETC INSTITUTE
127 Q14.7 How Likely Respondents Would Be To Use The Following Types of Transportation: Light Rail Train Service Likelihood of Use Mean rating on a 5-point scale Not Likely At All Not Likely Not Sure Likely Very Likely No Response 2016 DART Transit Non-Rider Survey Shading reflects the mean rating for all respondents by zone ETC INSTITUTE
128 Q15.1 How Important Is The Following Purpose: Serving low-income, disabled, or senior populations with few other transportation options Importance Mean rating on a 3-point scale Not Important Somewhat Important Very Important No Response 2016 DART Transit Non-Rider Survey Shading reflects the mean rating for all respondents by zone ETC INSTITUTE
129 Q15.2 How Important Is The Following Purpose: Providing an alternative to congested roadways Importance Mean rating on a 3-point scale Not Important Somewhat Important Very Important No Response 2016 DART Transit Non-Rider Survey Shading reflects the mean rating for all respondents by zone ETC INSTITUTE

130 Q15.3 How Important Is The Following Purpose: Providing fast, frequent, reliable service on key corridors Importance Mean rating on a 3-point scale Not Important Somewhat Important Very Important No Response 2016 DART Transit Non-Rider Survey Shading reflects the mean rating for all respondents by zone ETC INSTITUTE

131 Q15.4 How Important Is The Following Purpose: Making it easier to get to/from transit (better Sidewalks, stops, park and ride facilities, etc.) Importance Mean rating on a 3-point scale Not Important Somewhat Important Very Important No Response 2016 DART Transit Non-Rider Survey Shading reflects the mean rating for all respondents by zone ETC INSTITUTE
132 Q15.5 How Important Is The Following Purpose: Helping to create an environmentally-friendly, sustainable city not dependent on car travel Importance Mean rating on a 3-point scale Not Important Somewhat Important Very Important No Response 2016 DART Transit Non-Rider Survey Shading reflects the mean rating for all respondents by zone ETC INSTITUTE

133 Q15.6 How Important Is The Following Purpose: Expanding DART s service area Importance Mean rating on a 3-point scale Not Important Somewhat Important Very Important No Response 2016 DART Transit Non-Rider Survey Shading reflects the mean rating for all respondents by zone ETC INSTITUTE

134 Q15.7 How Important Is The Following Purpose: Supporting economic development and access to jobs Importance Mean rating on a 3-point scale Not Important Somewhat Important Very Important No Response 2016 DART Transit Non-Rider Survey Shading reflects the mean rating for all respondents by zone ETC INSTITUTE
135 Q16 How Respondent s Rate Their Overall Impression of DART Impression of DART Mean rating on a 4-point scale Excellent Good Average Poor No Response 2016 DART Transit Non-Rider Survey Shading reflects the mean rating for all respondents by zone ETC INSTITUTE
136 Q17 Respondents rate how important it is for the region to support and fund public transportation Importance to Fund Mean rating on a 4-point scale Very Important Somewhat Important Not Sure Not Important No Response 2016 DART Transit Non-Rider Survey Shading reflects the mean rating for all respondents by zone ETC INSTITUTE
137 Q18 How Important Respondents Think it is for the Region to Support and Fund Public Transportation DART Funding Mean rating on a 4-point scale Should be reduced Should stay the same Should be somewhat greater than it is now Should be much greater than it is now No Response 2016 DART Transit Non-Rider Survey Shading reflects the mean rating for all respondents by zone ETC INSTITUTE
138 Q19.1 Ranking Importance of Transportation Investments: Widening Existing Roads Importance to Users Mean rating on a 5-point scale Not Important At All Not Important Neutral/Not Sure Somewhat Important Most Important No Response 2016 DART Transit Non-Rider Survey Shading reflects the mean rating for all respondents by zone ETC INSTITUTE
139 Q19.2 Ranking Importance of Transportation Investments: Building New Roads Importance to Users Mean rating on a 5-point scale Not Important At All Not Important Neutral/Not Sure Somewhat Important Most Important No Response 2016 DART Transit Non-Rider Survey Shading reflects the mean rating for all respondents by zone ETC INSTITUTE

140 Q19.3 Ranking Importance of Transportation Investments: Improving Public Transit Importance to Users Mean rating on a 5-point scale Not Important At All Not Important Neutral/Not Sure Somewhat Important Most Important No Response 2016 DART Transit Non-Rider Survey Shading reflects the mean rating for all respondents by zone ETC INSTITUTE
141 Q19.4 Ranking Importance of Transportation Investments: Improving the Bicycle Network Importance to Users Mean rating on a 5-point scale Not Important At All Not Important Neutral/Not Sure Somewhat Important Most Important No Response 2016 DART Transit Non-Rider Survey Shading reflects the mean rating for all respondents by zone ETC INSTITUTE

142 Q19.5 Ranking Importance of Transportation Investments: Improving the Sidewalk Network Importance to Users Mean rating on a 5-point scale Not Important At All Not Important Neutral/Not Sure Somewhat Important Most Important No Response 2016 DART Transit Non-Rider Survey Shading reflects the mean rating for all respondents by zone ETC INSTITUTE

143 Q22.1 Level of Support for the Following Funding Sources: Vehicle Registration Fee: Add a $20 annual fee to each car s registration fee in the areas serviced by DART Level of Support Mean rating on a 5-point scale Strongly Do NOT Support Somewhat Do NOT Support Neutral/Not Sure Somewhat Support Strongly Support No Response 2016 DART Transit Non-Rider Survey Shading reflects the mean rating for all respondents by zone ETC INSTITUTE

144 Q22.2 Level of Support for the Following Funding Sources: Sales Tax: Add ½ cent sales tax in Dallas and Polk County Level of Support Mean rating on a 5-point scale Strongly Do NOT Support Somewhat Do NOT Support Neutral/Not Sure Somewhat Support Strongly Support No Response 2016 DART Transit Non-Rider Survey Shading reflects the mean rating for all respondents by zone ETC INSTITUTE

145 Q22.3 Level of Support for the Following Funding Sources: Add up to 85 cents/$1,000 of taxable valuation of houses in areas serviced by DART Level of Support Mean rating on a 5-point scale Strongly Do NOT Support Somewhat Do NOT Support Neutral/Not Sure Somewhat Support Strongly Support No Response 2016 DART Transit Non-Rider Survey Shading reflects the mean rating for all respondents by zone ETC INSTITUTE
DRAFT. Trail Counter Update. Central Iowa Trail Count Program. Trail counters in Central Iowa
 Trail Counter Update Trail counters in Central Iowa Central Iowa Trail Count Program In October 2011, the MPO began the Central Iowa Trail Count Program with 40 infrared trail counters from TRAFx Research
Crystal Springs Upland School Transportation Demand Management Plan. March 2016
 Crystal Springs Upland School Transportation Demand Management Plan March 06 CONTENTS Introduction... Transportation Demand Management (TDM) Program.... Background/Survey of Existing Student Commuting
Public Outreach Overview Tuesday, September 27. COTA William J. Lhota Building 33 N. High St. Columbus, OH 43215
 Public Outreach Overview Tuesday, September 27 COTA William J. Lhota Building 33 N. High St. Columbus, OH 43215 Project Overview Goals and Overview Create a community vision for the future of public transportation
Respondents Viewpoint on MRT Project in Jakarta
 Respondents Viewpoint on MRT Project in Jakarta Research time: 11.11.2013 11.30.2013 Based on Nusaresearch s panelist Report date: December 2013 Creator: Nusaresearch team A. Executive summary [1] Traffic
The XYZ of ABC 2007 Citizen Survey
 2007 Citizen Survey Please complete this questionnaire if you are the adult (age 18 or older) in the household who most recently had a birthday. The adult's year of birth does not matter. Please circle
Transportation & Mobility
 Transportation & Mobility October 11, 2017 October 11, 2017 Community Dialogue Series Session 3: Transportation & Mobility YOU ARE NOT STUCK IN TRAFFIC. YOU ARE TRAFFIC. October 11, 2017 Community Dialogue
PETER D. HART RESEARCH ASSOCIATES, INC. Study #7006--page 1 May 2003 OMB No
 PETER D. HART RESEARCH ASSOCIATES, INC. Study #7006--page 1 1724 Connecticut Avenue, NW Interviews: 760 respondents Washington, DC 20009 Dates: May 19-20, 2003 (202) 234-5570 FINAL Study #7006 OMB No.
MAKING YOUR TRAVEL EASIER, FASTER, AND MORE CONVENIENT! A SERVICE PROVIDED BY: WISE & HEALTHY AGING CITY OF SANTA MONICA BIG BLUE BUS
 MAKING YOUR TRAVEL EASIER, FASTER, AND MORE CONVENIENT! A SERVICE PROVIDED BY: WISE & HEALTHY AGING CITY OF SANTA MONICA BIG BLUE BUS 3-1018TB WHAT IS SANTA MONICA S MODE PROGRAM? WISE & Healthy Aging
Municipal Service Park 3 December Consolidation of City services to one centralized complex
 Municipal Service Park 3 December 2010 Consolidation of City services to one centralized complex Overview: Operational Challenges and Opportunities South East Connector impacts Opportunities: The South
SH 288 Express Lanes Stated Preference Survey Report. Appendix A: Survey Questionnaire
 SH 288 Express Lanes Stated Preference Survey Report Appendix A: Survey Questionnaire DATA ANALYSIS SOLUTIONS TABLE OF CONTENTS 1.0 INSTRUCTIONS... 1 2.0 SCREENER AND TRIP CHARACTERISTIC QUESTIONS... 2
Looking Ahead. A Context for the Next Twenty Year Needs Assessment. July 2013
 Looking Ahead A Context for the Next Twenty Year Needs Assessment July 2013 A Larger Context for Twenty Year Needs Growing transit demand and complexity of travel paths and times Growing economy changing
The Blue Line Extension
 The Blue Line Extension NORTH CAROLINA JOINT TRANSPORTATION OVERSIGHT COMMITTEE Presented by Carolyn Flowers CATS Chief Executive Officer Raleigh, NC February 10, 2012 Overview Charlotte Area Transit System
Downtown Boise Multimodal Center
 Treasure Valley High Capacity Transit Study Downtown Boise Multimodal Center Environmental Assessment June 2009 Prepared by the Federal Transit Administration and Valley Regional Transit. U.S. Department
MARTA BOARD OF DIRECTORS OCTOBER 4, 2018
 MARTA BOARD OF DIRECTORS OCTOBER 4, 2018 TODAY S AGENDA o Key driver of the program o Recommended plan o Project summaries o Next steps 2 KEY DRIVER: PUBLIC INPUT o Atlanta City Design o Atlanta s Transportation
2009 ATP Solutions Newsletter Questionnaire
 2009 ATP Solutions Newsletter Questionnaire FINAL: May 22, 2009 I. INTRODUCTION AND SCREENING [OPERATOR SHOULD ENTER UNIQUE CODE THAT CORRESPONDS WITH THE RESPONDENT, CODE SHOULD IDENTIFY EACH RESPONDENT
A Plan to Connect Baltimore
 A Plan to Connect Baltimore BaltimoreLink by the Numbers Improved Access to Frequent Transit Lines (frequent = every 15 mins. or better) 131,000 more JOBS (+37%) 205,000 more PEOPLE (+34%) More Service
An Analysis of TDM Impacts on a Corridor Segment
 An Analysis of TDM Impacts on a Corridor Segment Phil Winters, CUTR TDM Program Director Liren Zhou, Graduate Research Assistant Sachin Rai, ITS Research Associate Nevine Georggi, TDM Research Associate
Bus Circulator Feasibility Study Scope of Work March 12, 2018
 The City of Hyattsville Comprehensive Transportation and Infrastructure Study Bus Circulator Feasibility Study Scope of Work March 12, 2018 Project Approach At the request of the City of Hyattsville, Toole
Metropolitan Council Transportation Committee. September 12, 2016
 Metropolitan Council Welcome Commissioner Ulrich SCALE and Collective Impact in Scott County - Mayor Williams Regional Priority Corridors Highways Transit Moving Forward SCALE Scott County Association
November 28, 2012 ALTERNATIVES ANALYSIS PUBLIC MEETING
 November 28, 2012 ALTERNATIVES ANALYSIS PUBLIC MEETING Project Background Description of the Project Alternatives Analysis Process Project Progress Activity Stations Comments Adjourn 2 VIA spent 2 years
Metrobus 30s Line Enhancements
 Customer Service, Operations and Safety Committee Action Item III-C February 14, 2008 Metrobus 30s Line Enhancements Washington Metropolitan Area Transportation Authority Board Action/Information Summary
New Jersey economic issues poll April 5-14, 2018 Stockton Polling Institute Weighted frequencies
 New Jersey economic issues poll April 5-14, 2018 Stockton Polling Institute Weighted frequencies Q1. How would you rate the U.S. economy: Frequency Valid Valid Excellent 47 6.6 6.6 6.6 Good 302 42.1 42.1
The Maryland Transit Administration. A Plan to Connect Baltimore
 The Maryland Transit Administration A Plan to Connect Baltimore 1 What We ve Heard Over 1,100 stakeholder comments submitted through the Bus Network Improvement Project (BNIP) Six workshops, three pop-up
Design Considerations for Real-time Arterial Performance Measurement Systems Using Transit Bus Probes
 Design Considerations for Real-time Arterial Performance Measurement Systems Using Transit Bus Probes Abraham Emmanuel & David Zavattero Chicago Department of Transportation Project Goals Estimate traffic
Agenda Overview. Process Update Overview of Revised Goals Transportation Trends Small Group Breakout Questions and Comments Next Steps Meeting Close
 Agenda Overview Process Update Overview of Revised Goals Transportation Trends Small Group Breakout Questions and Comments Next Steps Meeting Close 2 1. Welcome and Meeting Overview 1. Process Update 3
A Comparative Usability Test. Orbitz.com vs. Hipmunk.com
 A Comparative Usability Test Orbitz.com vs. Hipmunk.com 1 Table of Contents Introduction... 3 Participants... 5 Procedure... 6 Results... 8 Implications... 12 Nuisance variables... 14 Future studies...
Integrating Travel Demand Management into the Long-Range Planning Process 2017 AMPO
 Integrating Travel Demand Management into the Long-Range Planning Process 2017 AMPO October 19, 2017 Chattanooga 2045 RTP Chattanooga 2045 RTP addresses both transportation supply and demand Continued
2018 Overview: WageWorks and HelloWallet
 2018 Overview: WageWorks and HelloWallet Agenda 1 Welcome 2 WageWorks TRIP Overview 3 HelloWallet Overview 4 Q & A 2 Commuter Benefits Transportation Reimbursement Incentive Plan (TRIP) Presented by Holly
ITSMR Research Note. Crashes Involving Cell Phone Use and Distracted Driving KEY FINDINGS ABSTRACT INTRODUCTION. Crash Analyses.
 December 2016 KEY FINDINGS Crash Analyses Less than 1% of police-reported fatal and personal injury (F & PI) crashes involved the use of a cell phone over the five years, 2011-2015. 12 persons were killed
Memorandum CITY OF DALLAS
 Memorandum DATE March 22, 2013 CITY OF DALLAS TO SUBJECT Members of the Transportation and Environment Committee: Linda L. Koop (Chair), Sheffie Kadane (Vice Chair), Sandy Greyson, Delia Jasso, Vonciel
Denver Moves: Transit Task Force
 Insert transit picture Denver Moves: Transit Task Force Meeting #5 April 6, 2017 1. Welcome & Introductions Opening remarks and housekeeping Task Force and audience introductions 2 4/6/2017 Task Force
SAMPLE Treatment Perceptions Survey (TPS) Report. XXXXXX County, N=239. (Not Real Data) All Substance Use Treatment Programs Surveyed.
 Report. XXXXXX County, N=239. (Not Real Data) All Substance Use Treatment Programs Surveyed.") Perceptions Survey (TPS) Report XXXXXX County, N=239 (Not Real Data) All Substance Use s Surveyed November 2017 Prepared by the University of California, Los Angeles Integrated Substance Abuse s *For county
Perceptions Survey (TPS) Report XXXXXX County, N=239 (Not Real Data) All Substance Use s Surveyed November 2017 Prepared by the University of California, Los Angeles Integrated Substance Abuse s *For county
STUDENT TRANSIT PASS PILOT FREQUENTLY ASKED QUESTIONS UNION CITY
 STUDENT TRANSIT PASS PILOT 2018-2019 FREQUENTLY ASKED QUESTIONS UNION CITY What is the Student Transit Pass Pilot? The Student Transit Pass Pilot is a three-year pilot program sponsored by the Alameda
Mail Findings. Australia Post Consumer Survey. Research into consumer preferences of transactional communications
 Australia Post Consumer Survey Mail Findings August 2013 Australia Post Consumer Survey Mail Findings Research into consumer preferences of transactional communications Methodology The Australia Post Consumer
Speed Limit and Safety Nexus Studies for Automated Enforcement Locations in the District of Columbia 1100 Block 4th Street NE
 Speed Limit and Safety Nexus Studies for Automated Enforcement Locations in the District of Columbia 11 Block 4th Street NE Study Area and Location District PSA Ward ANC Phase Description 1 14 6 6C Proposed
Study Area and Location District PSA Ward ANC Phase Description G Proposed 2900 Block Military Road Northwest Eastbound
 Speed Limit and Safety Nexus Studies for Automated Enforcement Locations in the District of Columbia 29 Block Military Road NW E/B Study Area and Location District PSA Ward ANC Phase Description 2 21 3
NEW SERVICES IN KAUFMAN COUNTY
 NEW SERVICES IN KAUFMAN COUNTY Agenda About Funding Explanation Grant / System Efficiency New Service Explanation Process/Timing 2 Committed to the Transit Customer Clients come first. We are often: The
NCTCOG MTP Policy Bundle Application for TXDOT
 MTP Policy Application Acknowledgement I hereby certify that all information provided and contained herein is complete, accurate, and true. I am authorized to provide information on behalf of my agency.
How to make MetroWorks work for you:
 How to make MetroWorks work for you: Setup Select a dedicated program manager to coordinate and be a point of contact for the MetroWorks program. Your MetroWorks program manager will receive a customizable
ITSMR Research Note KEY FINDINGS. Crash Analyses: Ticket Analyses:
 December 2018 KEY FINDINGS Crash Analyses: 2013-2017 Less than 1% of police-reported fatal and personal injury (F & PI) crashes involved the use of a cell phone over the five years, 2013-2017. 15 persons
Dulles Area Transportation Association
 Dulles Area Transportation Association February 8, 2017 Susan Shaw, P.E., Megaprojects Director Virginia Department of Transportation Transform 66: Outside the Beltway 2 Project Scope Multimodal improvements
Speed Limit and Safety Nexus Studies for Automated Enforcement Locations in the District of Columbia East Capitol Street at Southern Avenue NE
 Speed Limit and Safety Nexus Studies for Automated Enforcement Locations in the District of Columbia East Capitol Street at Southern Avenue NE Study Area and Location District PSA Ward ANC Phase Description
Station Community Engagement Survey Results
 Station Community Engagement Survey Results Report Example Report Prepared for: XXXXXXXXXXXXXXXXX 0 McNair Ingenuity Research Pty Ltd ACN. 096 437 991 Level 4, 270 Pacific Highway, Crows Nest, NSW, 2065
West of Hudson Regional Transit Access Study
 West of Hudson Regional Transit Access Study Open House Presentation June 1, 2009 1 Agenda 1. Progress to Date 2. Level 1 Screening Analysis 3. Level 2 Screening Criteria 4. Next Steps 5. Questions and
Council of State Governments. Takoma Langley Transit Center Purple Line Project Briefing. October 28, 2013
 Council of State Governments Takoma Langley Transit Center Purple Line Project Briefing October 28, 2013 Takoma Langley Transit Center Purpose and Need Provide a safe, attractive and efficient facility
TAPS Public Transit Published Charter Rates
 TAPS Public Transit Charter Service Instructions and Request Form When buses or vans are available, charter service is granted on a first come first serve basis based on charter service guidelines below.
TRAFFIC SAFETY FACTS. Young Drivers Report the Highest Level of Phone Involvement in Crash or Near-Crash Incidences. Research Note
 TRAFFIC SAFETY FACTS Research Note DOT HS 811 611 April 2012 Young Drivers Report the Highest Level of Phone Involvement in Crash or Near-Crash Incidences In the first nationally representative telephone
Region of Peel Transportation Demand Management Study July 11, 2003 Stakeholder Workshop Summary
 Region of Peel Transportation Demand Management Study July 11, 2003 Stakeholder Workshop Summary Prepared for: The Regional Municipality of Peel Prepared by UrbanTrans Consultants July, 2003 Table of Contents
Cambridge South East Transport Study: Summary Report of Consultation Findings
 Produced by the Cambridgeshire Research Group Cambridge South East Transport Study: Summary Report of Consultation Findings Version May Cambridgeshire Research Group is the brand name for Cambridgeshire
Activity-Based Human Mobility Patterns Inferred from Mobile Phone Data: A Case Study of Singapore
 Activity-Based Human Mobility Patterns Inferred from Mobile Phone Data: A Case Study of Singapore By: Shan Jiang, Joseph Ferreira, Jr., and Marta C. Gonzalez Published in: 2017 Presented by: Masijia Qiu
Study Area and Location District PSA Ward ANC Phase Description D Proposed 1900 Block Foxhall Road Northwest Southbound
 Speed Limit and Safety Nexus Studies for Automated Enforcement Locations in the District of Columbia 19 Block Foxhall Road NW S/B Study Area and Location District PSA Ward ANC Phase Description 2 25 3
PLANNING COMMISSION JUNE 7, 2018 PUBLIC HEARING
 PLANNING COMMISSION JUNE 7, 2018 PUBLIC HEARING SUBJECT: MUNICIPAL CODE AMENDMENT TO UPDATE TITLE 10, VEHICLES AND TRAFFIC, AND TITLE 19, ZONING ORDINANCE, WEST HOLLYWOOD MUNICIPAL CODE TO AMEND THE TRANSPORTATION
MVTA-Prior Lake-Shakopee Merger. SCALE Presentation, October 10, 2014
 MVTA-Prior Lake-Shakopee Merger SCALE Presentation, October 10, 2014 MVTA Commitment Our Vision The Minnesota Valley Transit Authority is a trusted partner in transportation, serving as an innovative leader
REGULATED DOMESTIC ROAMING RESEARCH REPORT 2017
 REGULATED DOMESTIC ROAMING RESEARCH REPORT 2017 Researching the attitudes and perceptions of regional and remote Australians towards mobile providers and domestic roaming Vodafone Regional Roaming Research
Making Mobility Better, Together JANUARY 31, 2013 AUSTIN CITY COUNCIL PROJECT CONNECT REGIONAL TRANSIT UPDATE
 Making Mobility Better, Together JANUARY 31, 2013 AUSTIN CITY COUNCIL PROJECT CONNECT REGIONAL TRANSIT UPDATE Achieving Compact & Connected Engaging in a regional transit discussion Pursuing a compact
Consumers Use of Mobile Financial Services 2015
 Consumers Use of Mobile Financial Services 2015 Arturo Gonzalez and Ellen A. Merry Division of Consumer and Community Affairs Federal Reserve Board The analysis and conclusions set forth in this presentation
Summer 2013 Courses Introduction to Computer Hardware I
 Summer 2013 Courses Introduction to Computer Hardware I This course will introduce members to the basics of computer repair. Members will learn the functions of the various parts and components of the
Study Area and Location District PSA Ward ANC Phase Description A Proposed 6100 Block Georgia Avenue Northwest Southbound
 Speed Limit and Safety Nexus Studies for Automated Enforcement Locations in the District of Columbia 6100 Block Georgia Avenue NW Study Area and Location District PSA Ward ANC Phase Description 4 402 4
Travel Time on the Highway 7 Corridor YORK REGION. Robert Bruce President TPA North America Inc.
 Travel Time on the Highway 7 Corridor YORK REGION Robert Bruce President TPA North America Inc. Presentation Overview Introduction to vivanext project Project Description Bluetooth Traffic Monitoring Overview
vision42
 vision42 www.vision42.org vision4 auto-free light rail 2 boulevard for 42nd Street Roxanne Warren, AIA, Chair George Haikalis, ASCE, Co-Chair Institute for Rational Urban Mobility,Inc. www.vision42.org
GORE BUILDING. 238 N. Massachusetts Avenue, Lakeland, FL 33801
 GORE BUILDING 238 N. Massachusetts Avenue, Lakeland, FL 33801 CDB LOCATION REDEVELOPMENT PROJECT MUNN PARK HISTORIC DISTRICT INCENTIVES AVAILABLE ADJACENT PARKING INCLUDED BK698301 Phone: (863) 683-3425
HOW CANADIANS BANK. Annual tracking study on Canadian attitudes and behaviours towards banking. Prepared for:
 HOW CANADIANS BANK Annual tracking study on Canadian attitudes and behaviours towards banking Prepared for: 2016 METHODOLOGY Data collection method Hybrid phone/online survey methodology. 817 interviews
Florida Rural Household Travel Survey Mobile App
 Florida Rural Household Travel Survey Mobile App presented by Michelle Arnold, AICP, EI Transportation Planner & Mark Knoblauch, GISP Senior GIS/IT Project Manager AECOM May 6, 2015 Purpose Model Task
Study Area and Location District PSA Ward ANC Phase Description B Planned Branch Avenue Northbound at Alabama Avenue Southeast
 Speed Limit and Safety Nexus Studies for Automated Enforcement Locations in the District of Columbia Branch Avenue at Alabama Avenue SE Study Area and Location District PSA Ward ANC Phase Description 6
Transit Development Plan/Transportation Demand. Chuck Steigerwald Director of Strategic Planning. Management Plan
 Transit Development Plan/Transportation Demand Chuck Steigerwald Director of Strategic Planning Management Plan OmniRide Strategic Plan Phase III TDP/TDMP Recommended service changes Ten-year plan Final
TDM Awards Private Sector Application
 TDM Awards Private Sector Apply for a TDM award and let us help you achieve your highest recognition level GVF works year-round with its partners to develop programs and incorporate TDM and/or sustainability
DATE: September 2014 Project Sponsors Rachel Schuett and Transportation Team Transportation Demand Management (TDM) Data Collection
 Data Collection") DATE: September 2014 TO: FROM: RE: Project Sponsors Rachel Schuett and Transportation Team Transportation Demand Management (TDM) Data Collection The San Francisco Planning Department and the San Francisco
DATE: September 2014 TO: FROM: RE: Project Sponsors Rachel Schuett and Transportation Team Transportation Demand Management (TDM) Data Collection The San Francisco Planning Department and the San Francisco
Study Area and Location District PSA Ward ANC Phase Description C Existing 3500 Block Massachusetts Avenue Northwest Eastbound
 Speed Limit and Safety Nexus Studies for Automated Enforcement Locations in the District of Columbia 35 Block Massachusetts Avenue NW Study Area and Location District PSA Ward ANC Phase Description 2 24
Local Search Insights
 Local Search Insights click The YP to edit Advantage master title style Summary of comscore Research November 2014 All surveys results data herein are from comscore YP Value Proposition study, September
2016 Member Needs Survey Results
 Member Needs Survey Results Page 1 2016 Member Needs Survey Results June 11, 2016 Member Needs Survey Results Page 2 Priority Areas of Focus Based on the 2013 Member Needs Survey results and the AAE Strategic
GreenThumb Garden Registration
 GreenThumb Garden Registration 2015-2019 Garden Name Block Lot CB Jurisdiction Two members must provide full contact information on the license agreement, including phone numbers, addresses and emails.
LAWRENCE-DOUGLAS COUNTY INTELLIGENT JOURNEY
 LAWRENCE-DOUGLAS COUNTY INTELLIGENT JOURNEY L-DC REGIONAL ITS ARCHITECTURE AND STRATEGIC DEPLOYMENT PLAN EXECUTIVE SUMMARY The Lawrence-Douglas County Metropolitan Planning Organization (L- DC MPO) has
2017 PIT Summary: Boulder County
 A Point-in-Time (PIT) count provides a snapshot of homelessness by interviewing those who are homeless at a particular time. The Metropolitan Denver Homeless Initiative (MDHI) conducted a PIT study of
HOW THE SMART SPEAKER IS REVOLUTIONIZING THE HOME
 HOW THE SMART SPEAKER IS REVOLUTIONIZING THE HOME 2017 was predicted to be the year of the smart home, but consumers are taking their time adopting the new technology. While companies currently offer consumers
Behavioral Adjustments & Equity Effects of Congestion Pricing: Analysis of Morning Commutes During the Stockholm Trial
 Behavioral Adjustments & Equity Effects of Congestion Pricing: Analysis of Morning Commutes During the Stockholm Trial Anders Karlström & Joel P. Franklin Dept. of Transport & Economics Royal Institute
TRACY HILLS SPECIFIC PLAN RECIRCULATED DRAFT SUBSEQUENT ENVIRONMENTAL IMPACT REPORT VOLUME III OCTOBER 2015
 TRACY HILLS SPECIFIC PLAN RECIRCULATED DRAFT SUBSEQUENT ENVIRONMENTAL IMPACT REPORT VOLUME III OCTOBER 2015 APPENDIX H-6B CORRESPONDENCE DOCUMENTS LIVERMORE, DATED FALL 2014 Chau, Elizabeth From: Sent:
Transportation and Road Improvement GO Bond. September 2016 Report
 1 2014 Transportation and Road Improvement GO Bond 2 2014 Transportation and Road Improvement GO Bond Projects Nearing Completion Projects Moving into and is expected to last one year. By Spring 2017,
Study Area and Location District PSA Ward ANC Phase Description A Proposed I-395 Southwest after Exit 4, Eastbound
 Speed Limit and Safety Nexus Studies for Automated Enforcement Locations in the District of Columbia I-395 SW after Exit 4 E/B Study Area and Location District PSA Ward ANC Phase Description 1 71 8 8A
Snyder leads by 5%, Peters leads by 14% Snyder 48% - Schauer 43% Peters 52% - Land 38%
 P R E S S R E L E A S E FOR RELEASE AFTER 6:30 PM October 28, 2014: Contact: Steve Mitchell 248-891-2414 Snyder leads by 5%, Peters leads by 14% Snyder 48% - Schauer 43% Peters 52% - Land 38% EAST LANSING,
Charting the Progress of Smart City Development in Shanghai
 Charting the Progress of Smart City Development in Shanghai Xueguo Wen Executive Vice President of Shanghai Academy 2017 TM Forum 1 C ONTENTS Current situation Experience and outlook Strategic cooperation
Australia. Consumer Survey Mail Findings
 Australia Post Consumer Survey Mail Findings July 2012 Methodology The Australia Post Consumer Survey measures consumer attitudes and behaviours of interest to Australia Post, particularly mail (letters),
Site 40. Recreational Center
 Speed Limit and Safety Nexus Studies for Automated Enforcement Locations in the District of Columbia Georgia Avenue S/B at Missouri Avenue NW Study Area and Location District PSA Ward ANC Phase Description
Study Area and Location District PSA Ward ANC Phase Description A Existing 1700 Block North Portal Drive Northwest Southwest-bound
 Speed Limit and Safety Nexus Studies for Automated Enforcement Locations in the District of Columbia 17 Block North Portal Drive NW Study Area and Location District PSA Ward ANC Phase Description 4 41
Palm Beach TPA TAC September 5, 2018
 Palm Beach TPA TAC September 5, 2018 STEVE ANDERSON, AICP Palm Tran Project Manager ADAMS CONSULTING GROUP TINDALE OLIVER Project Team 1996 Palm Tran 2 1996 County Population: 900,000 people Gas: $0.97
Meeting attendees are now required to go through security screenings upon entering the building. Please allow for extra time.
 TO WHOM IT MAY CONCERN: NOTICE OF RE-SCHEDULED BOARD MEETINGS This is notice that the re-scheduled meetings of the Board of Directors of the New Jersey Transit Corporation, NJ Transit Rail Operations,
Homeless Management Information System (HMIS)
") Mid-America Regional Council 600 Broadway, Suite 200 Kansas City, Missouri 64105 (816)474-4240 Kcmetrohmis.org Homeless Management Information System (HMIS) Data Quality Plan Kansas City Metro-Jackson,
Mid-America Regional Council 600 Broadway, Suite 200 Kansas City, Missouri 64105 (816)474-4240 Kcmetrohmis.org Homeless Management Information System (HMIS) Data Quality Plan Kansas City Metro-Jackson,
Bike Sharing Feasibility Study and Implementation Plan 2012
 Source: Nice Ride (Twin Cities MN) Source: Capital Bikeshare (Washington, DC) City of Cleveland Bike Sharing Feasibility Study and Implementation Plan 2012 November 20, 2013 Toole Design Group BrownFlynn,
VTA s BART Silicon Valley Phase II Extension Project San Jose Downtown Association
 VTA s BART Silicon Valley Phase II Extension Project San Jose Downtown Association August 24, 2017 THANK YOU! San Jose Downtown Association for inviting us & San Jose First United Methodist Church for
a. Co-Chairs will recap the work to date and explain the intent of the Downtown Access Strategy Update.
 TRANSPORTATION COMMITTEE DATE: Thursday, January 24, 2019 TIME: 12:00 p.m. 1:30 a.m. PLACE: Bellevue Downtown Association Fifth Floor Conference Room Co-Chairs: Amy Carlson & Susan Stead AGENDA 1. Welcome,
Creating Dallas-Fort Worth s Transportation System: Celebrating Partnerships and Milestones
 Creating Dallas-Fort Worth s Transportation System: Celebrating Partnerships and Milestones Presentation to the Texas Transportation Commission August 27, 2014 Presenters Mike Cantrell Commissioner, Dallas
RIDE WITH TRANSLOC ANDROID USER GUIDE
 RIDE WITH TRANSLOC ANDROID USER GUIDE PURPOSE: The following guide will give a in-depth overview of how to best use the TransLoc Rider application, and how to utilize the OnDemand demand-response service
Vancouver Terminal Grain Storage Project. Feedback Form Inside. Community Engagement. October 1 19, 2012 PROJECT OV ERVIE W
 Feedback Form Inside Vancouver Terminal Grain Storage Project Community Engagement October 1 19, 2012 PROJECT OV ERVIE W www.richardson.ca/news/vancouver-grain-terminal RICHARDSON INTERNATIONAL LIMITED
APPENDIX G: Biennial Exhibition Device Survey Questions
 APPENDIX G: Biennial Exhibition Device Survey Questions STANDARD DEVICE QUESTIONS Did you use Whitney s Audio Guide to access the Museum s audio guide tour during today s visit? If so, please take a few
METRO SHORT RANGE TRANSIT PLAN FY Executive Summary May 2009 DIVERSIFIED TRANSPORTATION SOLUTIONS
 METRO SHORT RANGE TRANSIT PLAN FY 2010 2014 2014 Executive Summary May 2009 DIVERSIFIED TRANSPORTATION SOLUTIONS OVERVIEW Purpose of Metro SRTP Develop multi year strategic plan to improve transit quality,
Victim Personal Statements 2016/17
 Victim Personal Statements / Analysis of the offer and take-up of Victim Personal Statements using the Crime Survey for England and Wales, April to March. November Foreword One of my commitments as Victims
Site 17 W3-160 KEY: District Department of Transportation 55 M Street, SE, Suite 400 Washington, DC 20003
 Speed Limit and Safety Nexus Studies for Automated Enforcement Locations in the District of Columbia Connecticut Avenue at Calvert Street NW Study Area and Location District PSA Ward ANC Phase Description
After looking at the map here:
 Tuesday, November 24, 2009 10:52 AM Subject: FW: [Metro.net] customer comment Date: Friday, November 20, 2009 3:33 PM From: Regional Connector To: Ginny Brideau ,
COUNCIL REPORT. Item Meeting date: August 13, 2018 Engineering & Public Works
 Item 7.3.5 Meeting date: August 13, 2018 Department: Prepared by: Reviewed by: SUBJECT: Engineering & Public Works COUNCIL REPORT George Elliott, P.Eng., Director of Engineering & Public Works Greg McClinchey,
Implementation Plan FY
 Implementation Plan FY 2013 2015 January 18, 2012 Financial Integrity - Address the District's Structural Deficit - Financially support the District's reinvention of its family of services - Promote funding
Board of Directors April 25, BART The Next 40 Years BART Metro Vision Update Enhancing Service, Capacity and Coverage
 Board of Directors April 25, 2013 BART The Next 40 Years BART Metro Vision Update Enhancing Service, Capacity and Coverage Agenda Project background Update on progress of study Review evaluation process