Introduction to Exploratory Data Analysis
|
|
|
- Winifred Harvey
- 5 years ago
- Views:
Transcription
1 Introduction to Exploratory Data Analysis Ref: NIST/SEMATECH e-handbook of Statistical Methods The original work in Exploratory Data Analysis (EDA) was done by Tukey (1977) and developed since that time by many others. It is more of an attitude rather than a prescribed set of techniques. The attitude is to play with the data first and visualize the data and then develop models and conclusions. The analysis is based on graphical and statistical methods. The reason for the heavy reliance on graphics is that by its very nature the main role of EDA is to open-mindedly explore, and graphics gives the analysts unparalleled power to do so, enticing the data to reveal its structural secrets, and being always ready to gain some new, often unsuspected, insight into the data. In combination with the natural pattern-recognition capabilities that we all possess, graphics provides, of course, unparalleled power to carry this out. One prominent example of this technique, often in the news, is Data Mining a process to explore large amounts of data (for example by Google, Amazon, NSA) to try to identify patterns and relationships and then use the conclusions to make predictions. For example, several years ago, Netflix offered a one million dollar prize to the team that could significantly improve their ability to predict movies that customers would enjoy. The techniques described below are the very foundation principles on which these advanced analyses are based on. Goals of EPA The primary goal of EDA is to maximize the analyst's insight into a data set and into the underlying structure of a data set, while providing all of the specific items that an analyst would want to extract from a data set, such as: 1. a good-fitting, parsimonious model 2. a list of outliers 3. a sense of robustness of conclusions 4. estimates for parameters 5. uncertainties for those estimates 6. identify important factors 7. determine optimal values for parameter 8. test underlying assumptions Insight into the Data Insight implies detecting and uncovering underlying structure in the data. Such underlying structure may not be encapsulated in the list of items above; such items serve as the specific targets of an analysis, but the real insight and "feel" for a data set comes as the analyst judiciously probes and explores the various subtleties of the data. The "feel" for the data comes almost exclusively from the application of various graphical techniques, the collection of which serves as the window into the essence of the data. Graphics are irreplaceable--there are no quantitative analogues that will give the same insight as well-chosen graphics. To get a "feel" for the data, it is not enough for the analyst to know what is in the data; the analyst also must know what is not in the data, and the only way to do that is to draw on our own human patternrecognition and comparative abilities in the context of a series of judicious graphical techniques applied to the data.
2 Difference between Exploratory Data Analysis and Classical Analysis These three approaches are similar in that they all start with a general science/engineering problem and all yield science/engineering conclusions. The difference is the sequence and focus of the intermediate steps. Classical: The focus is on the model--estimating parameters of the model and generating predicted values from the model. Problem => Data => Model => Analysis => Conclusions Exploratory (EDA): the focus is on the data--its structure, outliers, and models suggested by the data. Bayesian: Problem => Data => Analysis => Model => Conclusions Problem => Data => Model => Prior Distribution => Analysis => Conclusions
3 Gallery of Graphical Techniques The particular graphical techniques employed in EDA are often quite simple, consisting of various techniques of: 1. Plotting the raw data in an appropriate form. Examples of different plots are shown below. 2. Plotting simple statistics such as mean plots, standard deviation plots, box plots, and main effects plots of the raw data. For large data sets, software programs are used to do these calculations. 3. Positioning such plots so as to maximize our natural pattern-recognition abilities, such as using multiple plots per page. These principles described earlier by Tufte are used here. This section provides a gallery of some useful graphical techniques. These are arranged by problem type. The full details can be found using the link above. There are others for more complex problems. (c is a constant; e is the error; t is time). Univariate y = c + e Run Sequence Plot: Lag Plot: Histogram: Normal Probability Plot: Plot: PPCC Plot:
4 Weibull Plot: Probability Plot: Box-Cox Linearity Plot: Box-Cox Normality Plot: Bootstrap Plot: Time Series y = f(t) + e Run Sequence Plot: Spectral Plot: Autocorrelation Plot: Complex Demodulation Amplitude Plot: Complex Demodulation Phase Plot: Factor y = f(x) + e Scatter Plot: Box Plot: Bihistogram: Quantile- Quantile Plot: Mean Plot: Standard Deviation Plot:
5 Experimental Design and Process Models In this procedure, one or more process variables (or factors) are changed in the same experiment in order to observe the effect the changes have on one or more response variables. The (statistical) design of experiments (DOE) is an efficient procedure for planning experiments so that the data obtained can be analyzed to yield valid and objective conclusions. Well chosen experimental designs maximize the amount of "information" that can be obtained for a given amount of experimental effort. Process Models A process model is a mathematical description of a physical process that can predict the outcome based on the individual values of input variable. It is common to begin with a process model of the `black box' type, with several discrete or continuous input parameters that can be controlled--that is, varied at will by the experimenter--and one or more measured output responses. The output responses are assumed continuous. Experimental data are used to derive an empirical (approximation) model linking the outputs and inputs. These empirical models generally contain first and second-order terms.
6 Problem for end of section: An EDA/Graphics Example Anscombe Example A simple, classic (Anscombe) example of the central role that graphics play in terms of providing insight into a data set starts with the following data set: Data X Y Summary Statistics If the goal of the analysis is to compute summary statistics plus determine the best linear fit for Y as a function of X, the results might be given as: N = 11 Mean of X = 9.0 Mean of Y = 7.5 Intercept = 3 Slope = 0.5 Residual standard deviation = Correlation = The above quantitative analysis, although valuable, gives us only limited insight into the data. Scatter Plot In contrast, the following simple scatter plot of the data
7 suggests the following: 1. The data set "behaves like" a linear curve with some scatter; 2. there is no justification for a more complicated model (e.g., quadratic); 3. there are no outliers; 4. the vertical spread of the data appears to be of equal height irrespective of the X-value; this indicates that the data are equally-precise throughout and so a "regular" (that is, equi-weighted) fit is appropriate. Three Additional Data Sets This kind of characterization for the data serves as the core for getting insight/feel for the data. Such insight/feel does not come from the quantitative statistics; on the contrary, calculations of quantitative statistics such as intercept and slope should be subsequent to the characterization and will make sense only if the characterization is true. To illustrate the loss of information that results when the graphics insight step is skipped, consider the following three data sets [Anscombe data sets 2, 3, and 4]: X2 Y2 X3 Y3 X4 Y
8 Quantitative Statistics for Data Set 2 Quantitative Statistics for Data Sets 3 and 4 A quantitative analysis on data set 2 yields N = 11 Mean of X = 9.0 Mean of Y = 7.5 Intercept = 3 Slope = 0.5 Residual standard deviation = Correlation = which is identical to the analysis for data set 1. One might naively assume that the two data sets are "equivalent" since that is what the statistics tell us; but what do the statistics not tell us? Remarkably, a quantitative analysis on data sets 3 and 4 also yields N = 11 Mean of X = 9.0 Mean of Y = 7.5 Intercept = 3 Slope = 0.5 Residual standard deviation = Correlation = (0.817 for data set 4) which implies that in some quantitative sense, all four of the data sets are "equivalent". In fact, the four data sets are far from "equivalent" and a scatter plot of each data set, which would be step 1 of any EDA approach, would tell us that immediately. Scatter Plots Interpretation of Scatter Plots Conclusions from the scatter plots are: 1. data set 1 is clearly linear with some scatter. 2. data set 2 is clearly quadratic. 3. data set 3 clearly has an outlier. 4. data set 4 is obviously the victim of a poor experimental design with a single point far removed from the bulk of the data "wagging the dog".
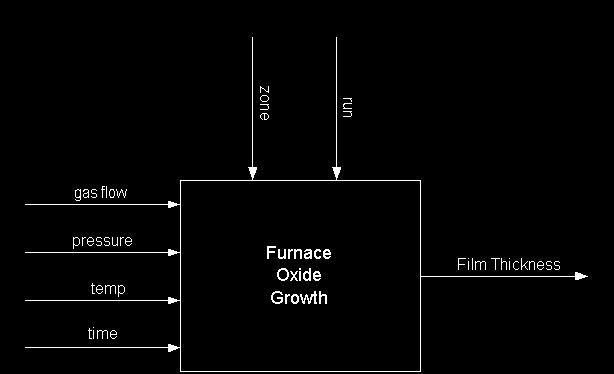
9 Importance of Exploratory Analysis These points are exactly the substance that provide and define "insight" and "feel" for a data set. They are the goals and the fruits of an open exploratory data analysis (EDA) approach to the data. Quantitative statistics are not wrong per se, but they are incomplete. They are incomplete because they are numeric summaries which in the summarization operation do a good job of focusing on a particular aspect of the data (e.g., location, intercept, slope, degree of relatedness, etc.) by judiciously reducing the data to a few numbers. Doing so also filters the data, necessarily omitting and screening out other sometimes crucial information in the focusing operation. Quantitative statistics focus but also filter; and filtering is exactly what makes the quantitative approach incomplete at best and misleading at worst. The estimated intercepts (= 3) and slopes (= 0.5) for data sets 2, 3, and 4 are misleading because the estimation is done in the context of an assumed linear model and that linearity assumption is the fatal flaw in this analysis. The EDA approach of deliberately postponing the model selection until further along in the analysis has many rewards, not the least of which is the ultimate convergence to a muchimproved model and the formulation of valid and supportable scientific and engineering conclusions. Exam Problem Schematic Process Model In the picture below we are modeling this process with one output (film thickness) that is influenced by four controlled factors (gas flow, pressure, temperature and time) and two uncontrolled factors (run and zone). The four controlled factors are part of our recipe and will remain constant throughout this study. We know that there is runto-run variation that is due to many different factors (input material variation, variation in consumables, etc.). We also know that the different zones in the furnace have an effect. A zone is a region of the furnace tube that holds one boat. There are four zones in these tubes. The zones in the middle of the tube grow oxide a little bit differently from the ones on the ends. In fact, there are temperature offsets in the recipe to help minimize this problem.
10
UNIT I READING: GRAPHICAL METHODS
 UNIT I READING: GRAPHICAL METHODS One of the most effective tools for the visual evaluation of data is a graph. The investigator is usually interested in a quantitative graph that shows the relationship
/4 Directions: Graph the functions, then answer the following question.
 1.) Graph y = x. Label the graph. Standard: F-BF.3 Identify the effect on the graph of replacing f(x) by f(x) +k, k f(x), f(kx), and f(x+k), for specific values of k; find the value of k given the graphs.
Experimental Design and Graphical Analysis of Data
 Experimental Design and Graphical Analysis of Data A. Designing a controlled experiment When scientists set up experiments they often attempt to determine how a given variable affects another variable.
Further Maths Notes. Common Mistakes. Read the bold words in the exam! Always check data entry. Write equations in terms of variables
 Further Maths Notes Common Mistakes Read the bold words in the exam! Always check data entry Remember to interpret data with the multipliers specified (e.g. in thousands) Write equations in terms of variables
3. Data Analysis and Statistics
 3. Data Analysis and Statistics 3.1 Visual Analysis of Data 3.2.1 Basic Statistics Examples 3.2.2 Basic Statistical Theory 3.3 Normal Distributions 3.4 Bivariate Data 3.1 Visual Analysis of Data Visual
IT 403 Practice Problems (1-2) Answers
 Answers") IT 403 Practice Problems (1-2) Answers #1. Using Tukey's Hinges method ('Inclusionary'), what is Q3 for this dataset? 2 3 5 7 11 13 17 a. 7 b. 11 c. 12 d. 15 c (12) #2. How do quartiles and percentiles
IT 403 Practice Problems (1-2) Answers #1. Using Tukey's Hinges method ('Inclusionary'), what is Q3 for this dataset? 2 3 5 7 11 13 17 a. 7 b. 11 c. 12 d. 15 c (12) #2. How do quartiles and percentiles
Unit I Reading Graphical Methods
 Unit I Reading Graphical Methods One of the most effective tools for the visual evaluation of data is a graph. The investigator is usually interested in a quantitative graph that shows the relationship
Data Analyst Nanodegree Syllabus
 Data Analyst Nanodegree Syllabus Discover Insights from Data with Python, R, SQL, and Tableau Before You Start Prerequisites : In order to succeed in this program, we recommend having experience working
Visualizing univariate data 1
 Visualizing univariate data 1 Xijin Ge SDSU Math/Stat Broad perspectives of exploratory data analysis(eda) EDA is not a mere collection of techniques; EDA is a new altitude and philosophy as to how we
Algebra 1, 4th 4.5 weeks
 The following practice standards will be used throughout 4.5 weeks:. Make sense of problems and persevere in solving them.. Reason abstractly and quantitatively. 3. Construct viable arguments and critique
1. Assumptions. 1. Introduction. 2. Terminology
 4. Process Modeling 4. Process Modeling The goal for this chapter is to present the background and specific analysis techniques needed to construct a statistical model that describes a particular scientific
Course of study- Algebra Introduction: Algebra 1-2 is a course offered in the Mathematics Department. The course will be primarily taken by
 Course of study- Algebra 1-2 1. Introduction: Algebra 1-2 is a course offered in the Mathematics Department. The course will be primarily taken by students in Grades 9 and 10, but since all students must
STA Module 2B Organizing Data and Comparing Distributions (Part II)
") STA 2023 Module 2B Organizing Data and Comparing Distributions (Part II) Learning Objectives Upon completing this module, you should be able to 1 Explain the purpose of a measure of center 2 Obtain and
STA 2023 Module 2B Organizing Data and Comparing Distributions (Part II) Learning Objectives Upon completing this module, you should be able to 1 Explain the purpose of a measure of center 2 Obtain and
STA Learning Objectives. Learning Objectives (cont.) Module 2B Organizing Data and Comparing Distributions (Part II)
 Module 2B Organizing Data and Comparing Distributions (Part II)") STA 2023 Module 2B Organizing Data and Comparing Distributions (Part II) Learning Objectives Upon completing this module, you should be able to 1 Explain the purpose of a measure of center 2 Obtain and
STA 2023 Module 2B Organizing Data and Comparing Distributions (Part II) Learning Objectives Upon completing this module, you should be able to 1 Explain the purpose of a measure of center 2 Obtain and
STANDARDS OF LEARNING CONTENT REVIEW NOTES ALGEBRA I. 4 th Nine Weeks,
 STANDARDS OF LEARNING CONTENT REVIEW NOTES ALGEBRA I 4 th Nine Weeks, 2016-2017 1 OVERVIEW Algebra I Content Review Notes are designed by the High School Mathematics Steering Committee as a resource for
Data Mining. CS57300 Purdue University. Bruno Ribeiro. February 1st, 2018
 Data Mining CS57300 Purdue University Bruno Ribeiro February 1st, 2018 1 Exploratory Data Analysis & Feature Construction How to explore a dataset Understanding the variables (values, ranges, and empirical
Course: Algebra MP: Reason abstractively and quantitatively MP: Model with mathematics MP: Look for and make use of structure
 Modeling Cluster: Interpret the structure of expressions. A.SSE.1: Interpret expressions that represent a quantity in terms of its context. a. Interpret parts of an expression, such as terms, factors,
Exploratory Data Analysis EDA
 Exploratory Data Analysis EDA Luc Anselin http://spatial.uchicago.edu 1 from EDA to ESDA dynamic graphics primer on multivariate EDA interpretation and limitations 2 From EDA to ESDA 3 Exploratory Data
Foundation Level Learning Targets Version 2.2
 Milwaukee Public Schools High School Mathematics Foundation Level Learning Targets Version 2.2 Note: Non-Negotiable Learning Targets and descriptors are identified with an *. The specifications aligned
STA Rev. F Learning Objectives. Learning Objectives (Cont.) Module 3 Descriptive Measures
 Module 3 Descriptive Measures") STA 2023 Module 3 Descriptive Measures Learning Objectives Upon completing this module, you should be able to: 1. Explain the purpose of a measure of center. 2. Obtain and interpret the mean, median, and
STA 2023 Module 3 Descriptive Measures Learning Objectives Upon completing this module, you should be able to: 1. Explain the purpose of a measure of center. 2. Obtain and interpret the mean, median, and
Lab Activity #2- Statistics and Graphing
 Lab Activity #2- Statistics and Graphing Graphical Representation of Data and the Use of Google Sheets : Scientists answer posed questions by performing experiments which provide information about a given
CCSSM Curriculum Analysis Project Tool 1 Interpreting Functions in Grades 9-12
 Tool 1: Standards for Mathematical ent: Interpreting Functions CCSSM Curriculum Analysis Project Tool 1 Interpreting Functions in Grades 9-12 Name of Reviewer School/District Date Name of Curriculum Materials:
Making Science Graphs and Interpreting Data
 Making Science Graphs and Interpreting Data Eye Opener: 5 mins What do you see? What do you think? Look up terms you don t know What do Graphs Tell You? A graph is a way of expressing a relationship between
Learner Expectations UNIT 1: GRAPICAL AND NUMERIC REPRESENTATIONS OF DATA. Sept. Fathom Lab: Distributions and Best Methods of Display
 CURRICULUM MAP TEMPLATE Priority Standards = Approximately 70% Supporting Standards = Approximately 20% Additional Standards = Approximately 10% HONORS PROBABILITY AND STATISTICS Essential Questions &
Understanding and Comparing Distributions. Chapter 4
 Understanding and Comparing Distributions Chapter 4 Objectives: Boxplot Calculate Outliers Comparing Distributions Timeplot The Big Picture We can answer much more interesting questions about variables
How to use FSBforecast Excel add in for regression analysis
 How to use FSBforecast Excel add in for regression analysis FSBforecast is an Excel add in for data analysis and regression that was developed here at the Fuqua School of Business over the last 3 years
Business: Administrative Information Services Crosswalk to AZ Math Standards
 Page 1 of 1 August 1998 2M-P1 Construct and draw inferences including measures of central tendency, from charts, tables, graphs and data plots that summarize data from real-world situations. PO 4 2.0 Manage
STA 570 Spring Lecture 5 Tuesday, Feb 1
 STA 570 Spring 2011 Lecture 5 Tuesday, Feb 1 Descriptive Statistics Summarizing Univariate Data o Standard Deviation, Empirical Rule, IQR o Boxplots Summarizing Bivariate Data o Contingency Tables o Row
Regression III: Advanced Methods
 Lecture 3: Distributions Regression III: Advanced Methods William G. Jacoby Michigan State University Goals of the lecture Examine data in graphical form Graphs for looking at univariate distributions
2016 Stat-Ease, Inc. & CAMO Software
 Multivariate Analysis and Design of Experiments in practice using The Unscrambler X Frank Westad CAMO Software fw@camo.com Pat Whitcomb Stat-Ease pat@statease.com Agenda Goal: Part 1: Part 2: Show how
Data Analyst Nanodegree Syllabus
 Data Analyst Nanodegree Syllabus Discover Insights from Data with Python, R, SQL, and Tableau Before You Start Prerequisites : In order to succeed in this program, we recommend having experience working
Type of graph: Explain why you picked this type of graph. Temperature (C) of product formed per minute)
 of product formed per minute)") Name: Graphing Raw Data Key Idea: Unprocessed data is called raw data. A set of data is often processed or transformed to make it easier to understand and to identify important features. Constructing Tables
Name: Graphing Raw Data Key Idea: Unprocessed data is called raw data. A set of data is often processed or transformed to make it easier to understand and to identify important features. Constructing Tables
Applying Supervised Learning
 Applying Supervised Learning When to Consider Supervised Learning A supervised learning algorithm takes a known set of input data (the training set) and known responses to the data (output), and trains
LAB 2: DATA FILTERING AND NOISE REDUCTION
 NAME: LAB TIME: LAB 2: DATA FILTERING AND NOISE REDUCTION In this exercise, you will use Microsoft Excel to generate several synthetic data sets based on a simplified model of daily high temperatures in
SLStats.notebook. January 12, Statistics:
 Statistics: 1 2 3 Ways to display data: 4 generic arithmetic mean sample 14A: Opener, #3,4 (Vocabulary, histograms, frequency tables, stem and leaf) 14B.1: #3,5,8,9,11,12,14,15,16 (Mean, median, mode,
Chapter 5. Understanding and Comparing Distributions. Copyright 2012, 2008, 2005 Pearson Education, Inc.
 Chapter 5 Understanding and Comparing Distributions The Big Picture We can answer much more interesting questions about variables when we compare distributions for different groups. Below is a histogram
Part I, Chapters 4 & 5. Data Tables and Data Analysis Statistics and Figures
 Part I, Chapters 4 & 5 Data Tables and Data Analysis Statistics and Figures Descriptive Statistics 1 Are data points clumped? (order variable / exp. variable) Concentrated around one value? Concentrated
Themes in the Texas CCRS - Mathematics
 1. Compare real numbers. a. Classify numbers as natural, whole, integers, rational, irrational, real, imaginary, &/or complex. b. Use and apply the relative magnitude of real numbers by using inequality
Year 10 General Mathematics Unit 2
 Year 11 General Maths Year 10 General Mathematics Unit 2 Bivariate Data Chapter 4 Chapter Four 1 st Edition 2 nd Edition 2013 4A 1, 2, 3, 4, 6, 7, 8, 9, 10, 11 1, 2, 3, 4, 6, 7, 8, 9, 10, 11 2F (FM) 1,
You will begin by exploring the locations of the long term care facilities in Massachusetts using descriptive statistics.
 Getting Started 1. Create a folder on the desktop and call it your last name. 2. Copy and paste the data you will need to your folder from the folder specified by the instructor. Exercise 1: Explore the
Adaptive Waveform Inversion: Theory Mike Warner*, Imperial College London, and Lluís Guasch, Sub Salt Solutions Limited
 Adaptive Waveform Inversion: Theory Mike Warner*, Imperial College London, and Lluís Guasch, Sub Salt Solutions Limited Summary We present a new method for performing full-waveform inversion that appears
Using Excel for Graphical Analysis of Data
 Using Excel for Graphical Analysis of Data Introduction In several upcoming labs, a primary goal will be to determine the mathematical relationship between two variable physical parameters. Graphs are
We deliver Global Engineering Solutions. Efficiently. This page contains no technical data Subject to the EAR or the ITAR
 Numerical Computation, Statistical analysis and Visualization Using MATLAB and Tools Authors: Jamuna Konda, Jyothi Bonthu, Harpitha Joginipally Infotech Enterprises Ltd, Hyderabad, India August 8, 2013
Cover Page. The handle holds various files of this Leiden University dissertation.
 Cover Page The handle http://hdl.handle.net/1887/22055 holds various files of this Leiden University dissertation. Author: Koch, Patrick Title: Efficient tuning in supervised machine learning Issue Date:
An introduction to plotting data
 An introduction to plotting data Eric D. Black California Institute of Technology February 25, 2014 1 Introduction Plotting data is one of the essential skills every scientist must have. We use it on a
DSC 201: Data Analysis & Visualization
 DSC 201: Data Analysis & Visualization Exploratory Data Analysis Dr. David Koop What is Exploratory Data Analysis? "Detective work" to summarize and explore datasets Includes: - Data acquisition and input
Why Use Graphs? Test Grade. Time Sleeping (Hrs) Time Sleeping (Hrs) Test Grade
 Time Sleeping (Hrs) Test Grade") Analyzing Graphs Why Use Graphs? It has once been said that a picture is worth a thousand words. This is very true in science. In science we deal with numbers, some times a great many numbers. These numbers,
Analyzing Graphs Why Use Graphs? It has once been said that a picture is worth a thousand words. This is very true in science. In science we deal with numbers, some times a great many numbers. These numbers,
Vocabulary Unit 2-3: Linear Functions & Healthy Lifestyles. Scale model a three dimensional model that is similar to a three dimensional object.
 Scale a scale is the ratio of any length in a scale drawing to the corresponding actual length. The lengths may be in different units. Scale drawing a drawing that is similar to an actual object or place.
Experiment 1 CH Fall 2004 INTRODUCTION TO SPREADSHEETS
 Experiment 1 CH 222 - Fall 2004 INTRODUCTION TO SPREADSHEETS Introduction Spreadsheets are valuable tools utilized in a variety of fields. They can be used for tasks as simple as adding or subtracting
Predictive Analysis: Evaluation and Experimentation. Heejun Kim
 Predictive Analysis: Evaluation and Experimentation Heejun Kim June 19, 2018 Evaluation and Experimentation Evaluation Metrics Cross-Validation Significance Tests Evaluation Predictive analysis: training
Robustness analysis of metal forming simulation state of the art in practice. Lectures. S. Wolff
 Lectures Robustness analysis of metal forming simulation state of the art in practice S. Wolff presented at the ICAFT-SFU 2015 Source: www.dynardo.de/en/library Robustness analysis of metal forming simulation
Bootstrapping Method for 14 June 2016 R. Russell Rhinehart. Bootstrapping
 Bootstrapping Method for www.r3eda.com 14 June 2016 R. Russell Rhinehart Bootstrapping This is extracted from the book, Nonlinear Regression Modeling for Engineering Applications: Modeling, Model Validation,
Table of Contents (As covered from textbook)
") Table of Contents (As covered from textbook) Ch 1 Data and Decisions Ch 2 Displaying and Describing Categorical Data Ch 3 Displaying and Describing Quantitative Data Ch 4 Correlation and Linear Regression
Table of Contents (As covered from textbook) Ch 1 Data and Decisions Ch 2 Displaying and Describing Categorical Data Ch 3 Displaying and Describing Quantitative Data Ch 4 Correlation and Linear Regression
Response to API 1163 and Its Impact on Pipeline Integrity Management
 ECNDT 2 - Tu.2.7.1 Response to API 3 and Its Impact on Pipeline Integrity Management Munendra S TOMAR, Martin FINGERHUT; RTD Quality Services, USA Abstract. Knowing the accuracy and reliability of ILI
STANDARDS OF LEARNING CONTENT REVIEW NOTES. ALGEBRA I Part II. 3 rd Nine Weeks,
 STANDARDS OF LEARNING CONTENT REVIEW NOTES ALGEBRA I Part II 3 rd Nine Weeks, 2016-2017 1 OVERVIEW Algebra I Content Review Notes are designed by the High School Mathematics Steering Committee as a resource
Weighted Alternating Least Squares (WALS) for Movie Recommendations) Drew Hodun SCPD. Abstract
 for Movie Recommendations) Drew Hodun SCPD. Abstract") Weighted Alternating Least Squares (WALS) for Movie Recommendations) Drew Hodun SCPD Abstract There are two common main approaches to ML recommender systems, feedback-based systems and content-based systems.
Weighted Alternating Least Squares (WALS) for Movie Recommendations) Drew Hodun SCPD Abstract There are two common main approaches to ML recommender systems, feedback-based systems and content-based systems.
Lecture 3 Questions that we should be able to answer by the end of this lecture:
 Lecture 3 Questions that we should be able to answer by the end of this lecture: Which is the better exam score? 67 on an exam with mean 50 and SD 10 or 62 on an exam with mean 40 and SD 12 Is it fair
Assembly dynamics of microtubules at molecular resolution
 Supplementary Information with: Assembly dynamics of microtubules at molecular resolution Jacob W.J. Kerssemakers 1,2, E. Laura Munteanu 1, Liedewij Laan 1, Tim L. Noetzel 2, Marcel E. Janson 1,3, and
Geostatistical Reservoir Characterization of McMurray Formation by 2-D Modeling
 Geostatistical Reservoir Characterization of McMurray Formation by 2-D Modeling Weishan Ren, Oy Leuangthong and Clayton V. Deutsch Department of Civil & Environmental Engineering, University of Alberta
Montana City School GRADE 5
 Montana City School GRADE 5 Montana Standard 1: Students engage in the mathematical processes of problem solving and reasoning, estimation, communication, connections and applications, and using appropriate
MATH& 146 Lesson 8. Section 1.6 Averages and Variation
 MATH& 146 Lesson 8 Section 1.6 Averages and Variation 1 Summarizing Data The distribution of a variable is the overall pattern of how often the possible values occur. For numerical variables, three summary
D-Optimal Designs. Chapter 888. Introduction. D-Optimal Design Overview
 Chapter 888 Introduction This procedure generates D-optimal designs for multi-factor experiments with both quantitative and qualitative factors. The factors can have a mixed number of levels. For example,
Mathematics. Algebra, Functions, and Data Analysis Curriculum Guide. Revised 2010
 Mathematics Algebra, Functions, and Data Analysis Curriculum Guide Revised 010 This page is intentionally left blank. Introduction The Mathematics Curriculum Guide serves as a guide for teachers when planning
Chapter 3 Analyzing Normal Quantitative Data
 Chapter 3 Analyzing Normal Quantitative Data Introduction: In chapters 1 and 2, we focused on analyzing categorical data and exploring relationships between categorical data sets. We will now be doing
STATISTICS (STAT) Statistics (STAT) 1
 Statistics (STAT) 1") Statistics (STAT) 1 STATISTICS (STAT) STAT 2013 Elementary Statistics (A) Prerequisites: MATH 1483 or MATH 1513, each with a grade of "C" or better; or an acceptable placement score (see placement.okstate.edu).
Statistics (STAT) 1 STATISTICS (STAT) STAT 2013 Elementary Statistics (A) Prerequisites: MATH 1483 or MATH 1513, each with a grade of "C" or better; or an acceptable placement score (see placement.okstate.edu).
Simple shooting-projection method for numerical solution of two-point Boundary Value Problems
 Simple shooting-projection method for numerical solution of two-point Boundary Value Problems Stefan M. Filipo Ivan D. Gospodino a Department of Programming and Computer System Application, University
FUNCTIONS AND MODELS
 1 FUNCTIONS AND MODELS FUNCTIONS AND MODELS In this section, we assume that you have access to a graphing calculator or a computer with graphing software. FUNCTIONS AND MODELS 1.4 Graphing Calculators
WESTMORELAND COUNTY PUBLIC SCHOOLS Integrated Instructional Pacing Guide and Checklist Algebra, Functions & Data Analysis
 WESTMORELAND COUNTY PUBLIC SCHOOLS 2013 2014 Integrated Instructional Pacing Guide and Checklist Algebra, Functions & Data Analysis FIRST QUARTER and SECOND QUARTER (s) ESS Vocabulary A.4 A.5 Equations
Carnegie LearningÒ Middle School Math Solution Correlations Course 3 NCSCoS: Grade 8
 MATHEMATICAL PRACTICES - 1 - Make sense of problems and persevere in solving them. Explain the meaning of a problem and look for entry points to its solution. Analyze givens, constraints, relationships,
Curve fitting. Lab. Formulation. Truncation Error Round-off. Measurement. Good data. Not as good data. Least squares polynomials.
 Formulating models We can use information from data to formulate mathematical models These models rely on assumptions about the data or data not collected Different assumptions will lead to different models.
Integrated Mathematics I Performance Level Descriptors
 Limited A student performing at the Limited Level demonstrates a minimal command of Ohio s Learning Standards for Integrated Mathematics I. A student at this level has an emerging ability to demonstrate
M7D1.a: Formulate questions and collect data from a census of at least 30 objects and from samples of varying sizes.
 M7D1.a: Formulate questions and collect data from a census of at least 30 objects and from samples of varying sizes. Population: Census: Biased: Sample: The entire group of objects or individuals considered
Lecture Slides. Elementary Statistics Twelfth Edition. by Mario F. Triola. and the Triola Statistics Series. Section 2.1- #
 Lecture Slides Elementary Statistics Twelfth Edition and the Triola Statistics Series by Mario F. Triola Chapter 2 Summarizing and Graphing Data 2-1 Review and Preview 2-2 Frequency Distributions 2-3 Histograms
8. Automatic Content Analysis
 8. Automatic Content Analysis 8.1 Statistics for Multimedia Content Analysis 8.2 Basic Parameters for Video Analysis 8.3 Deriving Video Semantics 8.4 Basic Parameters for Audio Analysis 8.5 Deriving Audio
DSC 201: Data Analysis & Visualization
 DSC 201: Data Analysis & Visualization Exploratory Data Analysis Dr. David Koop Python Support for Time The datetime package - Has date, time, and datetime classes -.now() method: the current datetime
Building Better Parametric Cost Models
 Building Better Parametric Cost Models Based on the PMI PMBOK Guide Fourth Edition 37 IPDI has been reviewed and approved as a provider of project management training by the Project Management Institute
Partial coverage inspection of corroded engineering components using extreme value analysis
 Partial coverage inspection of corroded engineering components using extreme value analysis Daniel Benstock and Frederic Cegla Citation: AIP Conference Proceedings 1706, 200012 (2016); doi: 10.1063/1.4940656
Learning Objectives. Continuous Random Variables & The Normal Probability Distribution. Continuous Random Variable
 Learning Objectives Continuous Random Variables & The Normal Probability Distribution 1. Understand characteristics about continuous random variables and probability distributions 2. Understand the uniform
The latest trend of hybrid instrumentation
 Multivariate Data Processing of Spectral Images: The Ugly, the Bad, and the True The results of various multivariate data-processing methods of Raman maps recorded with a dispersive Raman microscope are
Computer Exercises in System Identification
 Computer Exercises in System Identification Part 2 This version: March 21, 2018 REGLERTEKNIK AUTOMATIC CONTROL LINKÖPING 1 Parametric Identification of Black-Box Models Parametric black-box models are
CHAPTER 3: Data Description
 CHAPTER 3: Data Description You ve tabulated and made pretty pictures. Now what numbers do you use to summarize your data? Ch3: Data Description Santorico Page 68 You ll find a link on our website to a
Averages and Variation
 Averages and Variation 3 Copyright Cengage Learning. All rights reserved. 3.1-1 Section 3.1 Measures of Central Tendency: Mode, Median, and Mean Copyright Cengage Learning. All rights reserved. 3.1-2 Focus
Chapter 3. Bootstrap. 3.1 Introduction. 3.2 The general idea
 Chapter 3 Bootstrap 3.1 Introduction The estimation of parameters in probability distributions is a basic problem in statistics that one tends to encounter already during the very first course on the subject.
Data Analysis and Solver Plugins for KSpread USER S MANUAL. Tomasz Maliszewski
 Data Analysis and Solver Plugins for KSpread USER S MANUAL Tomasz Maliszewski tmaliszewski@wp.pl Table of Content CHAPTER 1: INTRODUCTION... 3 1.1. ABOUT DATA ANALYSIS PLUGIN... 3 1.3. ABOUT SOLVER PLUGIN...
CHAPTER 2: Describing Location in a Distribution
 CHAPTER 2: Describing Location in a Distribution 2.1 Goals: 1. Compute and use z-scores given the mean and sd 2. Compute and use the p th percentile of an observation 3. Intro to density curves 4. More
Graphical Analysis of Data using Microsoft Excel [2016 Version]
![Graphical Analysis of Data using Microsoft Excel [2016 Version]](/thumbs/72/67574169.jpg "Graphical Analysis of Data using Microsoft Excel [2016 Version]") Graphical Analysis of Data using Microsoft Excel [2016 Version] Introduction In several upcoming labs, a primary goal will be to determine the mathematical relationship between two variable physical parameters.
Graphical Analysis of Data using Microsoft Excel [2016 Version] Introduction In several upcoming labs, a primary goal will be to determine the mathematical relationship between two variable physical parameters.
Here is the data collected.
 Introduction to Scientific Analysis of Data Using Spreadsheets. Computer spreadsheets are very powerful tools that are widely used in Business, Science, and Engineering to perform calculations and record,
Section 18-1: Graphical Representation of Linear Equations and Functions
 Section 18-1: Graphical Representation of Linear Equations and Functions Prepare a table of solutions and locate the solutions on a coordinate system: f(x) = 2x 5 Learning Outcome 2 Write x + 3 = 5 as
Input: Concepts, Instances, Attributes
 Input: Concepts, Instances, Attributes 1 Terminology Components of the input: Concepts: kinds of things that can be learned aim: intelligible and operational concept description Instances: the individual,
Variogram Inversion and Uncertainty Using Dynamic Data. Simultaneouos Inversion with Variogram Updating
 Variogram Inversion and Uncertainty Using Dynamic Data Z. A. Reza (zreza@ualberta.ca) and C. V. Deutsch (cdeutsch@civil.ualberta.ca) Department of Civil & Environmental Engineering, University of Alberta
Data Mining: Exploring Data. Lecture Notes for Data Exploration Chapter. Introduction to Data Mining
 Data Mining: Exploring Data Lecture Notes for Data Exploration Chapter Introduction to Data Mining by Tan, Steinbach, Karpatne, Kumar 02/03/2018 Introduction to Data Mining 1 What is data exploration?
2.1 Objectives. Math Chapter 2. Chapter 2. Variable. Categorical Variable EXPLORING DATA WITH GRAPHS AND NUMERICAL SUMMARIES
 EXPLORING DATA WITH GRAPHS AND NUMERICAL SUMMARIES Chapter 2 2.1 Objectives 2.1 What Are the Types of Data? www.managementscientist.org 1. Know the definitions of a. Variable b. Categorical versus quantitative
Analytical Techniques for Anomaly Detection Through Features, Signal-Noise Separation and Partial-Value Association
 Proceedings of Machine Learning Research 77:20 32, 2017 KDD 2017: Workshop on Anomaly Detection in Finance Analytical Techniques for Anomaly Detection Through Features, Signal-Noise Separation and Partial-Value
1. Data Analysis Yields Numbers & Visualizations. 2. Why Visualize Data? 3. What do Visualizations do? 4. Research on Visualizations
 Data Analysis & Business Intelligence Made Easy with Excel Power Tools Excel Data Analysis Basics = E-DAB Notes for Video: E-DAB-05- Visualizations: Table, Charts, Conditional Formatting & Dashboards Outcomes
Stat 528 (Autumn 2008) Density Curves and the Normal Distribution. Measures of center and spread. Features of the normal distribution
 Density Curves and the Normal Distribution. Measures of center and spread. Features of the normal distribution") Stat 528 (Autumn 2008) Density Curves and the Normal Distribution Reading: Section 1.3 Density curves An example: GRE scores Measures of center and spread The normal distribution Features of the normal
Stat 528 (Autumn 2008) Density Curves and the Normal Distribution Reading: Section 1.3 Density curves An example: GRE scores Measures of center and spread The normal distribution Features of the normal
Integrated Math I. IM1.1.3 Understand and use the distributive, associative, and commutative properties.
 Standard 1: Number Sense and Computation Students simplify and compare expressions. They use rational exponents and simplify square roots. IM1.1.1 Compare real number expressions. IM1.1.2 Simplify square
Chapter 2. Frequency distribution. Summarizing and Graphing Data
 Frequency distribution Chapter 2 Summarizing and Graphing Data Shows how data are partitioned among several categories (or classes) by listing the categories along with the number (frequency) of data values
Using Excel for Graphical Analysis of Data
 EXERCISE Using Excel for Graphical Analysis of Data Introduction In several upcoming experiments, a primary goal will be to determine the mathematical relationship between two variable physical parameters.
The basic arrangement of numeric data is called an ARRAY. Array is the derived data from fundamental data Example :- To store marks of 50 student
 Organizing data Learning Outcome 1. make an array 2. divide the array into class intervals 3. describe the characteristics of a table 4. construct a frequency distribution table 5. constructing a composite
Side-by-Side Comparison of the Texas Educational Knowledge and Skills (TEKS) and Louisiana Grade Level Expectations (GLEs) MATHEMATICS: Geometry
 and Louisiana Grade Level Expectations (GLEs) MATHEMATICS: Geometry") Side-by-Side Comparison of the Texas Educational Knowledge and Skills (TEKS) and Louisiana Grade Level Expectations (GLEs) MATHEMATICS: Geometry TEKS Comments Louisiana GLE (G.1) Geometric Structure. The
Side-by-Side Comparison of the Texas Educational Knowledge and Skills (TEKS) and Louisiana Grade Level Expectations (GLEs) MATHEMATICS: Geometry TEKS Comments Louisiana GLE (G.1) Geometric Structure. The