Last Updated: SHUFFLEBOARD
|
|
|
- Brittney Ray
- 5 years ago
- Views:
Transcription
1 Last Updated: SHUFFLEBOARD
2 Table of Contents Getting started with Shuffleboard...3 Tour of Shuffleboard...4 Displaying data from your robot...8 Working with widgets Working with Lists Creating and manipulating tabs Setting global preferences for Shuffleboard Shuffleboard FAQ, issues, and bugs Advanced applications Displaying camera streams Working with graphs Using record and playback Working with Commands and Subsystems Testing and tuning PID loops Viewing hierarchies of data... 46
3 Getting started with Shuffleboard Page 3
4 Tour of Shuffleboard Shuffleboard is a dashboard for FRC based on newer technologies such as JavaFX that are available to Java programs. It is designed to be used for creating dashboards for C++ and Java programs. If you've used SmartDashboard in the past then you are already familiar with many of the features of Shuffleboard since they fundamentally work the same way. But Shuffleboard has many features that aren't in SmartDashboard. Here are some of the highlights: Graphics is based on JavaFX, the Java graphics standard. Each of the components has an associated style sheet so it becomes possible to have different "skins" or "themes" for Shuffleboard. We supply default light and dark themes. Shuffleboard supports multiple sheets for the display of your data. In fact you can create a new sheet (shown as a tab in the Shuffleboard window) and indicate if and which data should be autopopulated on it. By default there is a Test tab and a SmartDashboard tab that are autopopulated as data arrives. Other tabs might be for robot debugging vs. driving. Graphical display elements (widgets) are laid out on a grid to keep the interface clean and easy to read. You can change the grid size to have more or less resolution in your layouts and visual cues are provided to help you change your layout using drag and drop. Or you can choose to turn off the grid lines although the grid layout is preserved. Layouts are saved and the previous layout is instantiated by default when you run shuffleboard again. There is a record and playback feature that lets you review the data sent by your robot program after it finishes. That way you can carefully review the actions of the robot if something goes wrong. Graph widgets are available for numeric data and you can drag data onto a graph to see multiple points at the same time and on the same scale. You can extend Shuffleboard by writing your own widgets that are specific to your team's requirements. Documentation on extending it are on the Shuffleboard Github Wiki. Page 4

5 1. Sources area: Here are data sources from which you can choose values from NetworkTables or other sources to display by dragging a value into one of the tabs 2. Tab panes: This is where you data is displayed from the robot or other sources. In this example it is Test-mode subsystems that are shown here in the LiveWindow tab. This area can show any number of tabbed windows, and each window has it's own set of properties like grid size and auto-populate. 3. Record/playback controls: set of media-like controls where you can playback the current session to see historical data Page 5

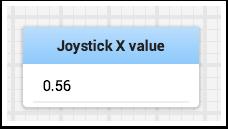
6 Starting Shuffleboard You can start Shuffleboard in one of three ways: 1. You can automatically start it when the Driver Station starts by setting the "Dashboard Type" to Shuffleboard in the settings tab as shown in the picture above. 2. You can run it by double-clicking on the.jar file in <user-directory>/wpilib/tools/ shuffleboard.jar. This is useful on a development system that does not have the Driver Station installed such as a Mac or Linux system. 3. You can start it from the command line by typing the command: java -jar shuffleboard.jar from home-dir/ WPILib/tools directory. This is often easiest on a a development system that doesn't have the Driver Station installed. Getting robot data onto the dashboard The easiest way to get data displayed on the dashboard is simply to use methods in the SmartDashboard class. For example to write a number to Shuffleboard write: SmartDashboard.putNumber("Joystick X value", joystick1.getx()); to see a field displayed with the label "Joystick X value" and a value of the X value of the joystick. Each time this line of code is executed, a new joystick value will be sent to Shuffleboard. Remember: you must write the joystick value whenever you want to see an updated value. Executing this line once at the start of the program will only display the value once at the time the line of code was executed. Page 6
7 Page 7

8 Displaying data from your robot Your robot can display data in regular operating modes like Teleop and Autonomous modes but you can also display the status and operate all the robot subsystems when the robot is switched to Test mode. By default you'll see two tabs when you start Shuffleboard, one for Teleop/ Autonomous and another for Test mode. The currently selected tab is underlined as can be seen in the picture below. Often debugging or monitoring the status of a robot envolves writing a number of values to the console and watching them stream by. With Shuffleboard you can put values to a GUI that is automatically constructed based on your program. As values are updated, the corresponding GUI element changes value - there is no need to try to catch numbers streaming by on the screen. Page 8


9 Displaying values in normal operating mode (autonomous or teleop) You can write Boolean, Numeric, or String values to Shuffleboard by simply calling the correct method for the type and including the name and the value of the data, no additional code is required. Numeric types such as char, int, long, float or double call SmartDashboard.putNumber("dashboard-name", value). Page 9
10 String types call SmartDashboard.putString("dashboard-name", value) and Boolean types call SmartDashboard.putBoolean("dashboard-name", value) Note: the methods are all part of the SmartDashboard class. The values will be displayed automatically in both Shuffleboard or SmartDashboard. You can even have an instance of Shuffleboard and SmartDashboard running and the values will be written to both of them. Each time your program calls SmartDashboard.put<type>() a new value is written to that widget in the dashboard, so to keep changing values up to date, be sure to call the put<type>() function whenever the value changes. As you can imagine this is a great way of debugging and getting status of your robot as it is operating. The SmartDashboard class is just shorthand for writing to the SmartDashboard subtable in NetworkTables. Changing the display type of data Depending on the data type of the values being sent to Shuffleboard you can often change the display format. In the previous example you can see that number values were displayed as either decimal numbers, a dial to better represent angles, and as a voltage view for the turret potentiometer. To set the display type right-click on the tile and select "Show as...". You can choose display types from the list in the popup menu. Page 10

11 Displaying data in Test mode You may add code to your program to display values for your sensors and actuators while the robot is in Test mode. This can be selected from the Driver Station whenever the robot is not on the field. The code to display these values is automatically generated by RobotBuilder or manually added to your program and is described in the next article. Test mode is designed to verify the correct operation of the sensors and actuators on a robot. In addition it can be used for obtaining setpoints from sensors such as potentiometers and for tuning PID loops in your code. Page 11

12 Setting test mode Enable Test Mode in the Driver Station by clicking on the "Test" button and setting "Enable" on the robot. When doing this, Shuffleboard will display the status of any actuators and sensors used by your program organized by subsystem. Getting data from the Sources view Normally network table data automatically appears on one of the tabs and you just rearrange and use that data. Sometimes you might want to recover a value that was accidentally deleted from the tab or display a value that is not part of the SmartDashboard/ NetworkTable key. For these cases the values can be dragged onto a pane from NetworkTable view under Sources on the left side of the window. Choose the value that you want to display and just drag it to the pane and it will be automatically created with the default type of widget for the data type. Page 12


13 Note: sometimes the Sources view is not visible on the left - it is possible to drag the divider between the tabbed panes and the Sources so the sources is not visible. If this happens move the cursor over the left edge and look for a divider resizing cursor, then left click and drag out the view. In the two images below you can see where to click and drag, and when finished the divider is as shown in the second image. Page 13

14 Working with widgets The visual displays that you manipulate on the screen in Shuffleboard are called widgets. Widgets are generally automatically displayed from values that the robot program publishes with NetworkTables. Moving widgets Widgets can be moved simply with drag and drop. Just move the cursor over the widget, left-click and drag it to the new position. When dragging you can only place widgets on grid squares and the size of the grid will effect the resolution of your display. When dragging a red or green outline will be displayed. Green generally means that there is enough room at the current location to drop the widget and red generally means that it will overlap or be too big to drop. In the example below a widget is being moved to a location where it doesn't fit. Resizing widgets Widgets can be resized by clicking and dragging the edge or corner of the widget image. The cursor will change to a resize-cursor when it is in the right position to resize the widget. As with moving widgets, a green or red outline will be drawn indicating that the widget can be resized or not. The example below shows a widget being resized to a larger area with the green outline indicating that there is no overlap with surrounding widgets. Page 14

15 Changing the display type of widgets Shuffleboard is very rich in display types depending on the data published from the robot. It will automatically choose a default display type, but you might want to change it depending on the application. To see what the possible displays are for any widget, right-click on the widget and select the "Show as..." and from the popup menu, choose the desired type. In the example below are two data values, one a number and the other a boolean. You can see the different types of display options that are available to each. The boolean value has only two possible values (true/ false) it can be shown as a boolean box (the red/green color), or text, or a toggle button or toggle switch. The. number value can be displayed as a graph, number bar, number slider, dial, text, or a voltage view depending on the context of the value. Page 15

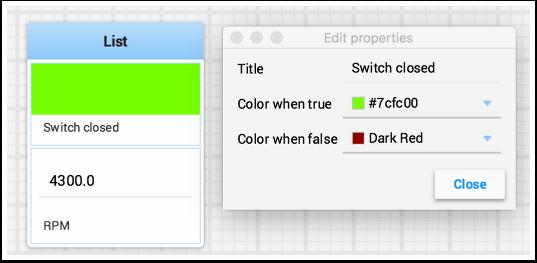
16 Changing the title of widgets You can change the title of widgets by double-clicking in their title bar and editing the title to the new value. If a widget is contained in a layout, then right-click on the widget and select the properties. From there you can change the widget title that is displayed. Changing widget properties You can change the appearance of a widget such as the range of values represented, colors or some other visual element. In cases where this is possible right-click on the widget and select "Edit properties" from the popup menu. In this boolean value widget shown below, the widget title, true color and false color can all be editted. Page 16
17 Page 17

18 Working with Lists Lists are sets of tiles that are be logically grouped together in a vertical layout. When tiles are added to a list, it becomes visually obvious that the tiles are related in function. In addition tiles in lists take up less screen space than the same tiles directly on the desktop because tiles in a list don't display the dark window title, but instead display a smaller textual label documenting the contents of the list. Page 18

19 Creating a list A list can be created by: 1. right-clicking on the first tile that should go into the list. 2. Select the "Add to new layout..." option from the popup menu. 3. A new list will be created called "List" and the tile will be at the top of it. Notice that tiles in lists do not have the window title at the top, but instead have the text that was in the window title. Adding tiles to a list Add tiles to a list layout by: 1. identify the list and the tile to be added. 2. drag the new tile onto the list. 3. the tile will be added to the list. If there is no room as the list is currently sized, the tile will be added off the end of the list and a vertical scrollbar will be added if it's not already there. Page 19


20 Rearranging tiles in a list Tiles in a list an be rearranged by right-clicking on the tile to be moved and selecting: 1. "Move up" to move the tile before the previous tile Page 20

21 2. "Move down" to move the tile after the next tile 3. "Send to top" to move the tile to the top of the list 4. "Send to bottom" to move the tile to the bottom of the list 5. "Remove from list" to delete the tile from the list. Renaming a list You can rename a list by double-clicking on the list title and changing the name. Click outside fo the title to save the changes Page 21

22 Creating and manipulating tabs The tabbed layout the Shuffleboard uses help separate different "views" of your robot data and make the displays more useful. You might have a tab the has the display for helping debug the robot program and a different tab for use in competitions. There are a number of options that make tabs very powerful. You can control which data from NetworkTables or other sources appears in each of your tabs using the auto-populate options described later in this article. Default tabs When you open Shuffleboard for the first time there are two tabs, labeled SmartDashboard and LiveWindow. These correspond to the two views that SmartDashboard had depending on whether your robot is running in Autonomous/Teleop or Test mode. In shuffleboard both of these views are available any time. On the SmartDashboard tab all the values that are written using the SmartDashboard.putType() set of methods. On the LiveWindow tab all the autogenerated debugging values are shown. Page 22
23 Switching between tabs You can switch between tabs clicking on the tab label at the top of the window. In the case above, simply click on SmartDashboard or LiveWindow to see the values that are associated with each tab. Adding tabs and deleting tabs You can add additional tabs by clicking on the plus(+) symbol just to the right of the last tab. Once you create a new tab you can set the label by double-clicking on the label in the tab and editing it. You can also right-click on the tab or use the Tab menu to bring up the tab preferences and from that window you can change the name by editing the Title field. Page 23
24 Setting the tab to auto-populate One of the most powerful features with tabs is to have them automatically populate new values based on a source prefix that is supplied in the tab Preferences pane. In the above example the Preferences pane has a Source prefix of "SmartDashboard/Shooter" and Auto populate is turned on. Any values that are written using the SmartDashboard class that specifies a sub-key of Shooter will automatically appear on that tab. Note: keys that match more than one Source prefix will appear in both tabs. Because those keys also start with SmartDashboard/ and that's the Source prefix for the default SmartDashboard tab, those widgets will appear in both panes. To only have values appear in one pane, you can use NetworkTables to write labels and values and use a different path that is not under SmartDashboard. Alternatively you could let everything appear in the SmartDashboard tab making it very cluttered, but have specific tabs for your needs that will be better filtered. Using the tab grid and spacing Each tab can have it's own Tile size (number of pixels per large square). So some tabs might have courser resolution for easier layout and others might have a find grid. The Tile size in the Tab preferences overrides any global settings in the Shuffleboard preferences. In addition you can specify that padding between the drawing in the widget and the edge of the of the widget. If you program user interfaces these parameters are usually referred to as horizontal and vertical gap (hgap, vgap). Moving widgets between tabs Currently there is no way to easily move widgets between tabs without deleting it from one tab and dragging the field from the sources hierarchy on the left into the new pane. We hope to have that capability in a subsequent update soon. Page 24

25 Setting global preferences for Shuffleboard There are a number of settings that set the way Shuffleboard looks and behaves. Those are on the Shuffleboard Preferences pane that can be accessed from the File menu. Setting the theme Shuffleboard supports two themes, Material Dark and Material Dark and the setting depends on your preferences. This uses css styles that apply to the entire application and can be changed any time. Setting the default tile size Shuffleboard positions tiles on a grid when you are adding or moving them yourself or when they are auto-populated. You can set the default tile size when for each tab or it can be set globally for all the tabs created after the default setting is changed. Finer resolution in the grid results in finer Page 25

26 control over placement of tiles. This can be set in the Shuffleboard Preferences window as shown below. Working with the layout save files Shuffleboard will default to saving your layout when you exit the application. You can also save it explicitly using the File / Save and File / Save as... menu options. The preferences window has options to cause the previous layout to be automatically applied when Shuffleboard starts. In addition, Shuffleboard will always display a "Save layout" window to remind you to save the layout. You can choose to turn off the automatic prompt on exit, but be sure to save the layout manually in this case so you don't loose your changes. Page 26


27 Setting the team number In order for Shuffleboard to be able to find your NetworkTables server on your robot, specify your team number in the "NetworkTables" tab on the Preferences pane. If you're running Shuffleboard with a running Driver Station, the Server field will be auto-populated with the correct information. If you're running on a computer without the Driver Station, you can manually enter your team number or the robotrio network address. Page 27
28 Shuffleboard FAQ, issues, and bugs Shuffleboard as well as most of the other control system components were developed with Java 8 and will not work with Java 9. Be sure before reporting problems that your computer has Java 8 (version update 40 or higher) installed and it is set as the default Java Environment. Frequently Asked Questions How do I report issues, bugs or feature requests with Shuffleboard? Bugs, issues, and feature requests can be added on the Shuffleboard Github page by creating an issue. We will try to address them as they are entered into the system. Please try to look at existing issues before creating new ones to make sure you aren't duplicating something that has already been reported or work that is planned. You can find the issues on the shuffleboard site. How can I add my own widgets or other extensions to Shuffleboard? The Shuffleboard wiki has a large amount of documentation on extending the program with custom plugins. In the future we will be posting a sample plugin project that can be used for additional custom widgets, but for now the wiki documentation is complete. How can I build Shuffleboard from the source code? YOu can get the source code by downloading, cloning, or forking the repository on the GitHub site. To build and run Shuffleboard from the source, make sure that the current directory is the top level source code and use one of these commands: Application Running Shuffleboard Building the APIs and utility classes for plugin creation Building the complete application jar file Command (for Windows systems run the gradlew.bat file)./gradlew :app:run./gradlew :api:shadowjar./gradlew :app:shadowjar Page 28
29 Advanced applications Page 29

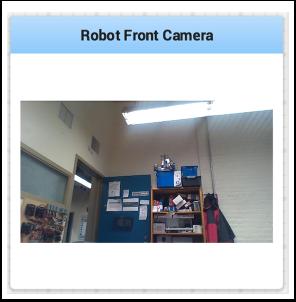
30 Displaying camera streams Camera streams from the robot can be viewed on a tab in Shuffleboard. This is useful for viewing what the robot is seeing to give a less obstructed view for operators or helping visualize the output from a vision algorithm running on the driver station computer or a coprocessor on the robot. Any stream that is running using the CameraServer API can be viewed in a camera stream widget. Adding a camera stream To add a camera to your dashboard select "Sources" and view the "CameraServer" source in the left side panel in the Shuffleboard window as shown in the example below. A list of camera streams will be shown, in this case there is only one camera called "Robot Front Camera". Drag that to the tab where it should be displayed. Alternatively the stream can also be placed on the dashboard by right-clicking on the stream in the Sources list and selecting "Show as: Camera Stream". Once the camera stream is added it will be displayed in the window. It can be resized and moved where you would like it. Be aware that sending too much data from too high a resolution or too high a frame rate will cause high CPU usage on both the roborio and the laptop. Page 30
31 Page 31

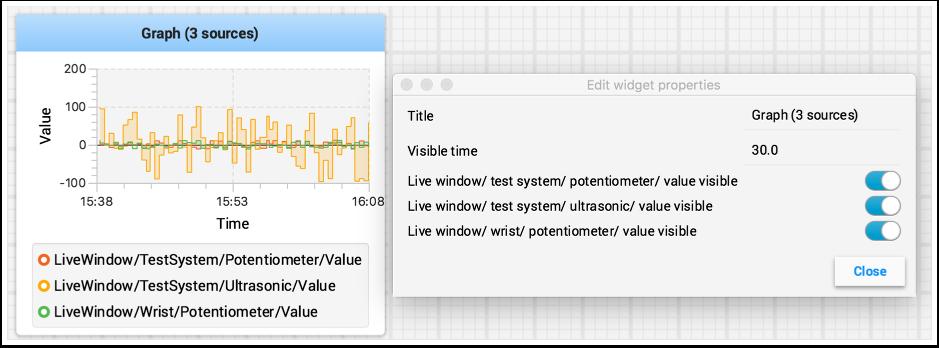
32 Working with graphs With Shuffleboard you can graph numeric values over time. Graphs are very. useful to see how sensor or motor values are changing as your robot is operating. For example the sensor value can be graphed in a PID loop to see how it is responding during tuning. To create a graph, choose a numeric value and right-click in the heading and select "Show as..." and then choose graph. The graph widget shows line plots of the value that you selected. It will automatically set the scale and the default time interval that the graph will show will be 30 seconds. You can change that in the setting for the graph (see below). Page 32
 and drop it onto the graph and that value will be added as shown below.")
33 Adding an additional data value to the graph For related values it is often desirable to show multiple values on the same graph. To do that, simply drag additional values from the NetworkTable source view (left side of the Shuffleboard window) and drop it onto the graph and that value will be added as shown below. You can continue to drag additional values onto the graph. Page 33

34 You can resize the graph vertically to view the legend if it is not displayed as shown in the image below. The legend shows all the sources that are used in the plot. Page 34

35 Setting properties for the graph You can set the number of seconds that are shown in the graph by changing the "Visible time" in the graph widget properties. To access the properties, right-click on the graph and select "Edit properties". In addition to setting the visible time the graph can selectively turn sources on and off by turning the switch on and off for each of the sources shown in the properties window (see below). Page 35
36 Page 36

37 Using record and playback Shuffleboard can log all widget updates during a session. Later the log file can be "played back" to see what happened during a match or a practice run. This is especially useful if something doesn't operate as intended during a match and you want to see what happened. Each recording is captured in a recording file. Creating a recording When shuffleboard starts it begins recording to all the NetworkTable values are recorded and continues until stopped by hitting the record/stop button in the recorder controls as shown below. If a new recording is desired, such as when a new piece of code or mechanical system is being tested, stop the current recording if it is running, and click the record button. Click the button again to stop recording and close the recording file. If the button is round (as shown) then click it to start a recording. If the button is a square, then a recoding is currently running so click it to stop the recording. Playing back a recording Previous recordings can be played back by: 1. selecting the "Recording" menu then click "Load playback". 2. Choose a recording from the from the directory shown. Recordings are grouped by date and the file names are the time the recording was made to help identify the correct one. Select the correct recording from the list. Page 37

38 Controlling the playback Selecting the recoding file will begin playback of that file. While the recording is playing the recording controls will show the current time within the recording as well as the option to loop the recording while watching it. When the recording is being played back the "transport" controls will allow the playback to be controlled. The controls work as follows: 1. The left double-arrow button backs up the playback to the last changed data point 2. The play/pause controls starts and stops the playback 3. The square stop button stops playback and resumes showing current robot values 4. The right double-arrow skips forward to the next changed data value 5. The scrubber is a slider that allow direct positioning to any point in time to view different parts of the recording 6. The loop switch turns on playback looping, that is, the playback will run over and over until stopped 7. The time shows the current point within the recording and the total time of the recording Page 38
39 Additional notes Graphs won't display properly while scrubbing the timeline but if it is playing through where the graph history can be captured by the graph then they will display as in the original run. Currently images will not play back correctly from your recordings. We are working on adding this function inn the future. Page 39

40 Working with Commands and Subsystems When using the Command-based framework Shuffleboard makes it easier to understand what the robot is doing by displaying the state of various commands and subsystems in real-time. Displaying subsystems To see the status of a subsystem while the robot is operating in either automous or telop modes, that is what it's default command is and what command is currently using that subsystem send a subsystem instance to Shuffleboard: Java: SmartDashboard.putData(command-reference); C++: SmartDashboard::PutData(command-pointer); Shuffleboard will display the subsystem name, the default command associated with thisi subsystem, and the currently running command. In this example the default command for the Elevator subsystem is called "AutonomousCommand" and it is also the current command that is using the Elevator subsystem. Page 40

41 Testing and viewing subsystems in Test mode In Test mode (Test/Enabled in the driver station) subsystems maybe displayed in the LiveWindow tab with the sensors and actuators of the subsystem. This is ideal for verifying of sensors are working and seeing the values that they are returning. In addition the actuators can be operated, for example motors can be operated using sliders to set the speed and direction. For PIDSubsystems the P, I, D, and F constants are displayed along with the setpoint and an enable control. This is useful for tuning PIDSubsystems by adjusting the constants, putting in a setpoint, and enabling the embedded PIDController. The the mechanisms response can be observed. Then the parameters can be changed, the PIDController re-enabled until a reasonable set of parameters is found. More information on tuning PIDSubsystems can be found here: Testing and tuning PID loops. Using RobotBuilder will automatically generate the code to get the subsystem displayed in Test mode. The code that is necessary to have subsystems displayed is shown below where subsystemname is a string containing the name of the subsystem: Page 41

42 setname(subsystem-name); Displaying commands Using commands and subsystems makes very modular robot programs that can easily be tested and modified. Part of this is because commands can be written completely independently of other commands and can therefor be easily run from Shuffleboard. To write a command to Shuffleboard use the SmartDashboard.putData method as shown here: SmartDashboard.putData(:ElevatorMove: up", new ElevatorMove(2.7); Shuffleboard will display the command name and a button to execute the command. In this way individual commands and command groups can easily be tested without needing special test code in a robot program. In the image below there are a number of commands contained in a Shuffleboard list. Pressing the button once runs the command and pressing it again stops the command. To use this feature the robot must be enabled in teleop mode. Page 42
43 Testing and tuning PID loops One challenge in using sensors to control mechanisms is to have a good algorithm to drive the motors to the proper position or speed. The most commonly used control algorithm is called PID control. There is a good set of videos (look for the robot controls playlist) that explain the control algorithms described here The PID algorithm converts sensor values into motor speeds by: 1. Reading sensor values to determine how far the robot or mechanism from the desired setpoint. The setpoint is the sensor value that corresponds to the expected goal. For example, a robot arm with a wrist joint should be able to move to a specified angle very quickly and stop at that angle as indicated by a sensor. A potentiometer is a sensor that can measure. rotational angle. By connecting it to an analog input, the program can get a voltage measurement that is directly proportional to the angle. 2. Compute an error (the difference between the sensor value and the desired value). The sign of the error value indicates which side of the setpoint the wrist is on. For example negative values might indicate that the measured wrist angle is larger than the desired wrist angle. The magnitude of the error is how far the measured wrist angle is from the actual wrist angle. If the error is zero, then the measured angle exactly matches the desired angle. The error can be used as an input to the PID algorithm to compute a motor speed. 3. The resultant motor speed is them used to drive the motor in the correct direction and a speed that hopefully will reach the setpoint as quickly as possible without overshooting (moving past the setpoint). WPILib has a PIDController class that implements the PID algorithm and accepts constants that correspond to the Kp, Ki, and Kd values. The PID algorithm has three components that contribute to computing the motor speed from the error. 1. P (proportional) - this is a term that when multiplied by a constant (Kp) will generate a motor speed that will help move the motor in the correct direction and speed. 2. I (integral) - this term is the sum of successive errors. The longer the error exists the larger the integral contribution will be. It is simply a sum of all the errors over time. If the wrist isn't quite getting to the setpoint because of a large load it is trying to move, the integral term will continue to increase (sum of the errors) until it contributes enough to the motor speed to get it to move to the setpoint. The sum of the errors is multiplied by a constant (Ki) to scale the integral term for the system. 3. D (differential) - this value is the rate of change of the errors. It is used to slow down the motor speed if it's moving too fast. It's computed by taking the difference between the current error value and the previous error value. It is also multiplied by a constant (kd) to scale it to match the rest of the system. Page 43

44 Tuning the PID controller Tuning the PID controller consists of picking constants that will give good performance. Shuffleboard helps this process by displaying the details of a PID subsystem with a user interface for setting constant values and testing how well it operates. This is displayed while the robot is operating in test mode (done by setting "Test" in the driver station). This is the test mode picture of a wrist subsystem that has a potentiometer as the sensor (pot) and a speed controller connected to the motor. It has a number of areas that correspond to the PIDSubsystem. 1. The analog input voltage value from the potentiometer. This is the sensor input value. 2. A slider that moves the wrist motor in either direction with 0 as stopped. The positive and negative values correspond to moving up or down. 3. The PID constants as described above (F is a feedforward value that is used for speed PID loops) 4. The setpoint value that corresponds the to the pot value when the wrist has reached the desired value Page 44
45 5. Enables the PID controller - that is, starts it looping at regular intervals reading the pot value, computing the error, applying the P, I, and D terms and setting the motor value. Try various values to get the desired motor performance. You can look at the video linked to at the beginning of this article or other sources on the internet to get the desired performance. Page 45
46 Viewing hierarchies of data Dragging a key with other keys below it (deeper in the hierarchy) displays the hierarchy in a tree, similar to the NetworkTables sources on the left. Currently this feature is unavailable, but we expect to have it soon in an update. Page 46
The new SmartDashboard (SFX)
") The new SmartDashboard (SFX) We have a new SmartDashboard that uses the more modern JavaFX for it's user interface. This has the promise of much richer user interfaces since it allows the widgets to have
The new SmartDashboard (SFX) We have a new SmartDashboard that uses the more modern JavaFX for it's user interface. This has the promise of much richer user interfaces since it allows the widgets to have
Last Updated: ROBOTBUILDER
 Last Updated: 06-11-2016 ROBOTBUILDER Table of Contents The basic steps to create a robot program...4 Overview of RobotBuilder...5 Starting RobotBuilder... 12 The RobotBuilder user interface... 14 Setting
ROBOT NETWORKING: USING NETWORKTABLES
 ROBOT NETWORKING: USING NETWORKTABLES Last Updated: 02-26-2018 Table of Contents Getting started with NetworkTables...3 What is NetworkTables...4 Listening for value changes...7 Creating a client-side
Last Updated: ROBOTBUILDER
 Last Updated: 12-01-2016 ROBOTBUILDER Table of Contents The basic steps to create a robot program...4 Overview of RobotBuilder...5 Starting RobotBuilder... 12 The RobotBuilder user interface... 14 Setting
COMMAND BASED PROGRAMMING
 COMMAND BASED PROGRAMMING Last Updated: 09-11-2016 Table of Contents Command based programming...4 What is Command based programming?...5 Creating a command based robot project in C++... 10 Installing
Choosing a Base Class
 Choosing a Base Class There a number of base classes (starting points) for your robot program. Each base class sets the style and structure of your program. Be sure to read through this section before
Last Updated: SMARTDASHBOARD
 Last Updated: 11-11-2016 SMARTDASHBOARD Table of Contents SmartDashboard...4 Getting Started with the SmartDashboard...5 Displaying Expressions from Within the Robot Program... 10 Changing the display
Getting Started with the SmartDashboard
 Getting Started with the SmartDashboard The SmartDashboard typically runs on the Driver Station computer and will do two functions: 1. View robot data that is displayed as program status as your program
FRC Driver Station LabVIEW Dashboard
 FRC Driver Station LabVIEW Dashboard The Dashboard application installed and launched by the FRC Driver Station is a LabVIEW program designed to provide teams with basic feedback from their robot, with
Last Updated: SMARTDASHBOARD
 Last Updated: 07-18-2017 SMARTDASHBOARD Table of Contents SmartDashboard...4 Getting Started with the SmartDashboard...5 Displaying Expressions from Within the Robot Program... 10 Changing the display
2015 FRC Software Component Overview
 2015 FRC Software Component Overview The 2015 FRC Control System consists of a wide variety of mandatory and optional software components designed to assist you in the design, development and debugging
Program your face off
 Program your face off Game plan Basics of Programming Primitive types, loops, and conditionals. What is an Object oriented language? Tips and tricks of WPIlib Iterative and Command Based robots Feedback
ANIMATOR TIMELINE EDITOR FOR UNITY
 ANIMATOR Thanks for purchasing! This document contains a how-to guide and general information to help you get the most out of this product. Look here first for answers and to get started. What s New? v1.53
Last Updated: BETA TESTING
 Last Updated: 10-13-2017 2018 BETA TESTING Table of Contents 2018 Beta Testing - Getting Started...3 Welcome...4 Accessing the 2018 Beta Project...5 Reporting Progress...8 Trackers - Reporting Bugs...
Controlling the Drawing Display
 Controlling the Drawing Display In This Chapter 8 AutoCAD provides many ways to display views of your drawing. As you edit your drawing, you can control the drawing display and move quickly to different
Handout Objectives: a. b. c. d. 3. a. b. c. d. e a. b. 6. a. b. c. d. Overview:
 Computer Basics I Handout Objectives: 1. Control program windows and menus. 2. Graphical user interface (GUI) a. Desktop b. Manage Windows c. Recycle Bin d. Creating a New Folder 3. Control Panel. a. Appearance
Intro To Excel Spreadsheet for use in Introductory Sciences
 INTRO TO EXCEL SPREADSHEET (World Population) Objectives: Become familiar with the Excel spreadsheet environment. (Parts 1-5) Learn to create and save a worksheet. (Part 1) Perform simple calculations,
GETTING STARTED WITH JAVA
 GETTING STARTED WITH JAVA Last Updated: 12-04-2018 Table of Contents Setting up the Development Environment...3 Installing the Java development tools...4 Configuring the NetBeans installation... 11 Understanding
GETTING STARTED WITH JAVA
 GETTING STARTED WITH JAVA Last Updated: 07-11-2016 Table of Contents Setting up the Development Environment...3 Installing the Java development tools...4 Configuring the NetBeans installation... 12 Understanding
SPARTAN ROBOTICS FRC 971
 SPARTAN ROBOTICS FRC 971 Controls Documentation 2015 Design Goals Create a reliable and effective system for controlling and debugging robot code that provides greater flexibility and higher performance
Introduction. Using Shapes. Word 2010 Working with Shapes. Video: Working with Shapes in Word To Insert a Shape: Page 1
 Word 2010 Working with Shapes Introduction Page 1 You can add a variety of shapes to your document including arrows, callouts, squares, stars, flowchart shapes and more. Want to set your name and address
Microsoft Word
 OBJECTS: Shapes (part 1) Shapes and the Drawing Tools Basic shapes can be used to graphically represent information or categories. The NOTE: Please read the Objects (add-on) document before continuing.
Tracking changes in Word 2007 Table of Contents
 Tracking changes in Word 2007 Table of Contents TRACK CHANGES: OVERVIEW... 2 UNDERSTANDING THE TRACK CHANGES FEATURE... 2 HOW DID THOSE TRACKED CHANGES AND COMMENTS GET THERE?... 2 WHY MICROSOFT OFFICE
ArcView QuickStart Guide. Contents. The ArcView Screen. Elements of an ArcView Project. Creating an ArcView Project. Adding Themes to Views
 ArcView QuickStart Guide Page 1 ArcView QuickStart Guide Contents The ArcView Screen Elements of an ArcView Project Creating an ArcView Project Adding Themes to Views Zoom and Pan Tools Querying Themes
OssCharts User/Set-Up Guide
 OssCharts User/Set-Up Guide Please refer to the following documents for further information: N/A Subject: Manufacturer: Model Range: Software Version: OssCharts User/Set-Up Guide OneSight Solutions N/A
Office 1 Using Microsoft Word
 Office 1 Using Microsoft Word A free class offered by Birchard Public Library 423 Croghan Street Fremont, OH 43420 419-334-7101 X216 On the web at www.birchard.lib.oh.us Class content created by Westerville
Creating a robot project
 Creating a robot project Liquid error: No route matches {:action=>"show", :controller=>"spaces/chapters", :space_id=>"3120", :manual_id=>"7952", :id=>nil} Launching WindRiver Workbench WindRiver Workbench
FRC LABVIEW PROGRAMMING
 FRC LABVIEW PROGRAMMING Last Updated: 01-07-2017 Table of Contents Setting up the Development Environment...3 Installing LabVIEW for FRC 2017 (LabVIEW only)...4 Installing the FRC 2017 Update Suite (All
PowerPoint Slide Basics. Introduction
 PowerPoint 2016 Slide Basics Introduction Every PowerPoint presentation is composed of a series of slides. To begin creating a slide show, you'll need to know the basics of working with slides. You'll
Tutorial 3: Using the Waveform Viewer Introduces the basics of using the waveform viewer. Read Tutorial SIMPLIS Tutorials SIMPLIS provide a range of t
 Tutorials Introductory Tutorials These tutorials are designed to give new users a basic understanding of how to use SIMetrix and SIMetrix/SIMPLIS. Tutorial 1: Getting Started Guides you through getting
Working with the Dope Sheet Editor to speed up animation and reverse time.
 Bouncing a Ball Page 1 of 2 Tutorial Bouncing a Ball A bouncing ball is a common first project for new animators. This classic example is an excellent tool for explaining basic animation processes in 3ds
Using Excel This is only a brief overview that highlights some of the useful points in a spreadsheet program.
 Using Excel 2007 This is only a brief overview that highlights some of the useful points in a spreadsheet program. 1. Input of data - Generally you should attempt to put the independent variable on the
Program and Graphical User Interface Design
 CHAPTER 2 Program and Graphical User Interface Design OBJECTIVES You will have mastered the material in this chapter when you can: Open and close Visual Studio 2010 Create a Visual Basic 2010 Windows Application
PowerPoint Introduction. Video: Slide Basics. Understanding slides and slide layouts. Slide Basics
 PowerPoint 2013 Slide Basics Introduction PowerPoint presentations are made up of a series of slides. Slides contain the information you will present to your audience. This might include text, pictures,
NSCC SUMMER LEARNING SESSIONS MICROSOFT OFFICE SESSION
 NSCC SUMMER LEARNING SESSIONS MICROSOFT OFFICE SESSION Module 1 Using Windows Welcome! Microsoft Windows is an important part of everyday student life. Whether you are logging onto an NSCC computer or
FRC LabVIEW Sub vi Example
 FRC LabVIEW Sub vi Example Realizing you have a clever piece of code that would be useful in lots of places, or wanting to un clutter your program to make it more understandable, you decide to put some
Let s Make a Front Panel using FrontCAD
 Let s Make a Front Panel using FrontCAD By Jim Patchell FrontCad is meant to be a simple, easy to use CAD program for creating front panel designs and artwork. It is a free, open source program, with the
Clip Art and Graphics. Inserting Clip Art. Inserting Other Graphics. Creating Your Own Shapes. Formatting the Shape
 1 of 1 Clip Art and Graphics Inserting Clip Art Click where you want the picture to go (you can change its position later.) From the Insert tab, find the Illustrations Area and click on the Clip Art button
Chapter 1 What is the Home Control Assistant?
 Chapter 1 What is the Home Control Assistant? About this guide In today s complex world, busy people can benefit from a home environment that anticipates their needs and helps take care of itself. For
05: A Gentle Introduction to Virtools
 05: A Gentle Introduction to Virtools Download the archive for this lab Virtools is the part of this course that everyone seems to really hate. This year, we're going to do our best to go over it in several
Following a tour is the easiest way to learn Prism.
 Page 1 of 25 A tour of Prism Following a tour is the easiest way to learn Prism. View a movie Watch and listen to a ten minute introductory movie from Prism's Welcome dialog. Or view it on the web. Read
What is Publisher, anyway?
 What is Publisher, anyway? Microsoft Publisher designed for users who need to create and personalize publications such as marketing materials, business stationery, signage, newsletters and other items
FRC Driver Station Powered by NI LabVIEW
 FRC Driver Station Powered by NI LabVIEW This article describes the use and features of the FRC Driver Station Powered by NI LabVIEW. For information on installing the Driver Station software see this
Intermediate Microsoft Excel
 Intermediate Microsoft Excel Class learning objectives By the end of class, students should be able to perform the following tasks in Microsoft Word: 1. Completing a Series 2. Review of Excel Basics Create
Introduction to Picasa
 Introduction to Picasa Importing Pictures Picasa can import pictures from your camera, media card, scanner, CD, or drives and folders on your computer. When you connect a drive or device with new pictures,
1 Overview Sequencer PS2 Control...26 C O N T E N T S INTRODUCTION...5 USER INTERFACE...6 CONNECTING...7 SIMULATOR...
 AL5 ARM GUIDE C O N T E N T S CHAPTER 1 1 Overview...4 INTRODUCTION...5 USER INTERFACE...6 CONNECTING...7 CONNECTING VIA USB (FOR SSC-32U, RB-LYN-850)...7 CONNECTING VIA SERIAL CABLE (FOR DISCONTINUED
Top Producer 7i Tips & Tricks Volume 1
 Top Producer 7i Tips & Tricks Volume 1 TOP PRODUCER Systems Inc. 1 Table of Contents 1 Using Quick Action Commands...3 1.1 Use the Commands Instead of the Menu s...3 2 Scrolling Within a Long List...5
Adafruit WebIDE. Created by Tyler Cooper. Last updated on :29:47 PM UTC
 Adafruit WebIDE Created by Tyler Cooper Last updated on 2018-03-12 08:29:47 PM UTC Guide Contents Guide Contents Overview Installation Easy installation: Manual Installation: Uninstallation: Getting Started
PowerPoint for Art History Presentations
 PowerPoint for Art History Presentations For PC computers running Microsoft Office 2007+ Adapted by The University of California, Berkeley from the Institute of Fine Arts document by Elizabeth S. Funk
CHAPTER 1 COPYRIGHTED MATERIAL. Getting to Know AutoCAD. Opening a new drawing. Getting familiar with the AutoCAD and AutoCAD LT Graphics windows
 CHAPTER 1 Getting to Know AutoCAD Opening a new drawing Getting familiar with the AutoCAD and AutoCAD LT Graphics windows Modifying the display Displaying and arranging toolbars COPYRIGHTED MATERIAL 2
Chapter 1. Getting to Know Illustrator
 Chapter 1 Getting to Know Illustrator Exploring the Illustrator Workspace The arrangement of windows and panels that you see on your monitor is called the workspace. The Illustrator workspace features
disclabel help: what is disclabel?
 disclabel help: what is disclabel? disclabel helps you make great-looking labels for your CDs, DVDs, and related materials mightier than the pen. Features: Start with a pre-designed template, or make your
The Domino Designer QuickStart Tutorial
 The Domino Designer QuickStart Tutorial 1. Welcome The Domino Designer QuickStart Tutorial You've installed Domino Designer, you've taken the Designer Guided Tour, and maybe you've even read some of the
Videos...31 Training Videos...32 Webinar recording: Monday 5th December
 GATORCREATOR Table of Contents Articles... 3 Drag and Drop Email Editor (Overview)... 4 Hidden Elements...15 Tracked Mailto: Links...18 Template Restrictions Custom Templates...21 Nifty Images User Guide...22
Chapter 7 Inserting Spreadsheets, Charts, and Other Objects
 Impress Guide Chapter 7 Inserting Spreadsheets, Charts, and Other Objects OpenOffice.org Copyright This document is Copyright 2007 by its contributors as listed in the section titled Authors. You can distribute
Getting Started with HCA and X10
 Getting Started with HCA and X10 This Getting Started Guide continues from the previous Getting Started with HCA Installation and Introduction which covers installing HCA and the basic operations available
Input: Interaction Techniques
 Input: Interaction Techniques Administration Questions about homework? 2 Interaction techniques A method for carrying out a specific interactive task Example: enter a number in a range could use (simulated)
Copyright 2004, Mighty Computer Services
 EZ-GRAPH DATABASE PROGRAM MANUAL Copyright 2004, Mighty Computer Services The Table of Contents is located at the end of this document. I. Purpose EZ-Graph Database makes it easy to draw and maintain basic
AutoCollage 2008 makes it easy to create an AutoCollage from a folder of Images. To create an AutoCollage:
 Page 1 of 18 Using AutoCollage 2008 AutoCollage 2008 makes it easy to create an AutoCollage from a folder of Images. To create an AutoCollage: 1. Click on a folder name in the Image Browser. 2. Once at
Lecture- 5. Introduction to Microsoft Excel
 Lecture- 5 Introduction to Microsoft Excel The Microsoft Excel Window Microsoft Excel is an electronic spreadsheet. You can use it to organize your data into rows and columns. You can also use it to perform
Arduino IDE Friday, 26 October 2018
 Arduino IDE Friday, 26 October 2018 12:38 PM Looking Under The Hood Of The Arduino IDE FIND THE ARDUINO IDE DOWNLOAD First, jump on the internet with your favorite browser, and navigate to www.arduino.cc.
SSC32 SERVO SEQUENCER GUIDE
 SSC32 SERVO SEQUENCER GUIDE C O N T E N T S CHAPTER 1 1 Overview 3 INTRODUCTION... 4 USER INTERFACE... 5 CONNECTING... 6 CONNECTING VIA SERIAL CABLE...6 SERVO CONTROLS... 7 SERVO CONFIGURATION...8 CONTROL
Learning to use the drawing tools
 Create a blank slide This module was developed for Office 2000 and 2001, but although there are cosmetic changes in the appearance of some of the tools, the basic functionality is the same in Powerpoint
econnect Baccarat User Guide EC7 June 2017
 econnect Baccarat User Guide EC7 June 2017 Table of Contents Baccarat Camera View A. Card Displayed on Virtual Table B. Bet Session Recording C. How to open a camera D. What is displayed on Data View E.
2 Getting Started. Getting Started (v1.8.6) 3/5/2007
 3/5/2007") 2 Getting Started Java will be used in the examples in this section; however, the information applies to all supported languages for which you have installed a compiler (e.g., Ada, C, C++, Java) unless
2 Getting Started Java will be used in the examples in this section; however, the information applies to all supported languages for which you have installed a compiler (e.g., Ada, C, C++, Java) unless
How to Create Greeting Cards using LibreOffice Draw
 by Len Nasman, Bristol Village Ohio Computer Club If you want to create your own greeting cards, but you do not want to spend a lot of money on special software, you are in luck. It turns out that with
TSM Report Designer. Even Microsoft Excel s Data Import add-in can be used to extract TSM information into an Excel spread sheet for reporting.
 TSM Report Designer The TSM Report Designer is used to create and modify your TSM reports. Each report in TSM prints data found in the databases assigned to that report. TSM opens these databases according
Getting Started. In This Chapter
 Getting Started In This Chapter 2 This chapter introduces concepts and procedures that help you get started with AutoCAD. You learn how to open, close, and manage your drawings. You also learn about the
ImageVis3D "Hands On"-Session
 ImageVis3D "Hands On"-Session Center for Integrative Biomedical Computing 2009 Workshop, Northeastern University 1 1. The current state of ImageVis3D Remember : 1. If you find any problems in ImageVis3D,
DOING MORE WITH POWERPOINT: MICROSOFT OFFICE 2013
 DOING MORE WITH POWERPOINT: MICROSOFT OFFICE 2013 GETTING STARTED PAGE 02 Prerequisites What You Will Learn USING MICROSOFT POWERPOINT PAGE 03 Slide Views MORE TASKS IN MICROSOFT POWERPOINT PAGE 05 Formatting
Welcome to Book Display Widgets
 Welcome to Book Display Widgets Book Display Widgets allow you to create virtual book displays on your website, where covers link to that item s record in your catalog. Bring your own lists of books, or
Introduction to Microsoft Office PowerPoint 2010
 Introduction to Microsoft Office PowerPoint 2010 TABLE OF CONTENTS Open PowerPoint 2010... 1 About the Editing Screen... 1 Create a Title Slide... 6 Save Your Presentation... 6 Create a New Slide... 7
Copyright 2018 MakeUseOf. All Rights Reserved.
 15 Power User Tips for Tabs in Firefox 57 Quantum Written by Lori Kaufman Published March 2018. Read the original article here: https://www.makeuseof.com/tag/firefox-tabs-tips/ This ebook is the intellectual
Excel 2013 Intermediate
 Instructor s Excel 2013 Tutorial 2 - Charts Excel 2013 Intermediate 103-124 Unit 2 - Charts Quick Links Chart Concepts Page EX197 EX199 EX200 Selecting Source Data Pages EX198 EX234 EX237 Creating a Chart
Microsoft Lync 2013 Quick-Start Guide. ThinkTel Communications Professional Services Last Updated: June 18, 2013
 Microsoft Lync 2013 Quick-Start Guide ThinkTel Communications Professional Services Last Updated: June 18, 2013 Instant Messaging & Presence Accept an IM request Click anywhere on the picture display area
Excel 2010: Basics Learning Guide
 Excel 2010: Basics Learning Guide Exploring Excel 2010 At first glance, Excel 2010 is largely the same as before. This guide will help clarify the new changes put into Excel 2010. The File Button The purple
Input part 3: Interaction Techniques
 Input part 3: Interaction Techniques Interaction techniques A method for carrying out a specific interactive task Example: enter a number in a range could use (simulated) slider (simulated) knob type in
Fruit Snake SECTION 1
 Fruit Snake SECTION 1 For the first full Construct 2 game you're going to create a snake game. In this game, you'll have a snake that will "eat" fruit, and grow longer with each object or piece of fruit
TRAINING SESSION Q2 2016
 There are 8 main topics in this training session which focus on the Sketch tools in IRONCAD. Content Sketch... 2 3D Scene Background Settings... 3 Creating a new empty Sketch... 4 Foam with cut out for
MET 107 Drawing Tool (Shapes) Notes Day 3
 Notes Day 3") MET 107 Drawing Tool (Shapes) Notes Day 3 Shapes: (Insert Tab Shapes) Example: Select on the rounded rectangle Then use the mouse to position the upper left corner and produce the size by dragging out
MET 107 Drawing Tool (Shapes) Notes Day 3 Shapes: (Insert Tab Shapes) Example: Select on the rounded rectangle Then use the mouse to position the upper left corner and produce the size by dragging out
SAS Visual Analytics 8.2: Working with Report Content
 SAS Visual Analytics 8.2: Working with Report Content About Objects After selecting your data source and data items, add one or more objects to display the results. SAS Visual Analytics provides objects
FM 4/100 USB Software for OSX
 FM 4/100 USB Software for OSX JLCooper makes no warranties, express or implied, regarding this software s fitness for a particular purpose, and in no event shall JLCooper Electronics be liable for incidental
Getting Started (1.8.7) 9/2/2009
 9/2/2009") 2 Getting Started For the examples in this section, Microsoft Windows and Java will be used. However, much of the information applies to other operating systems and supported languages for which you have
2 Getting Started For the examples in this section, Microsoft Windows and Java will be used. However, much of the information applies to other operating systems and supported languages for which you have
Welcome to Book Display Widgets
 Welcome to Book Display Widgets Book Display Widgets allow you to create virtual book displays on your website, where covers link to that item s record in your catalog. As a subscriber to Ebook Central
Microsoft Access 2016 Intro to Forms and Reports
 Microsoft Access 2016 Intro to Forms and Reports training@health.ufl.edu Access 2016: Intro to Forms and Reports 2.0 hours Topics include using the AutoForm/AutoReport tool, and the Form and Report Wizards.
ACE USER MANUAL ACE Development Team ANALOG DEVICES, INC., OCTOBER 2015
 ACE USER MANUAL ACE Development Team ANALOG DEVICES, INC., OCTOBER 2015 Contents 1 Introduction... 3 2 Getting Started with ACE... 3 2.1 Installation Instructions... 3 2.2 Quick Start... 5 2.3 Showing
Getting Started with HCA and Insteon
 Getting Started with HCA and Insteon This Getting Started Guide continues from the previous Getting Started with HCA Installation and Introduction which covers installing HCA and the basic operations available
Keynote 08 Basics Website:
 Website: http://etc.usf.edu/te/ Keynote is Apple's presentation application. Keynote is installed as part of the iwork suite, which also includes the word processing program Pages and the spreadsheet program
Geographical Information Systems Institute. Center for Geographic Analysis, Harvard University. LAB EXERCISE 1: Basic Mapping in ArcMap
 Harvard University Introduction to ArcMap Geographical Information Systems Institute Center for Geographic Analysis, Harvard University LAB EXERCISE 1: Basic Mapping in ArcMap Individual files (lab instructions,
WinTruss Tutorial By Matt Sutton
 WinTruss Tutorial By Matt Sutton WinTruss is a powerful, intuitive, and flexible truss analyzer. This tutorial is written to introduce you to many of the features available on WinTruss. The easiest way
Microsoft Excel 2010 Tutorial
 1 Microsoft Excel 2010 Tutorial Excel is a spreadsheet program in the Microsoft Office system. You can use Excel to create and format workbooks (a collection of spreadsheets) in order to analyze data and
FRC Driver Station Powered by NI LabVIEW
 This article describes the use and features of the 2016. For information on installing the Driver Station software see this document. Starting the FRC Driver Station The FRC Driver Station can be launched
Creating a Title Block & Border Using Chief Architect. Architectural Design & Residential Construction Penncrest High School
 Creating a Title Block & Border Using Chief Architect Architectural Design & Residential Construction Penncrest High School 2017-2018 Select New Layout to begin designing your Title Block. Note: Once the
Last Updated: FRC 2019 BETA
 Last Updated: 10-29-2018 FRC 2019 BETA Table of Contents Alpha Test (Publically available)...4 Alpha Test Info...5 Installing VS Code...6 VS Code Basics and WPILib in VS Code... 16 Creating a new WPILib
A Quick Introduction to the Genesis Framework for WordPress. How to Install the Genesis Framework (and a Child Theme)
") Table of Contents A Quick Introduction to the Genesis Framework for WordPress Introduction to the Genesis Framework... 5 1.1 What's a Framework?... 5 1.2 What's a Child Theme?... 5 1.3 Theme Files... 5
Table of Contents A Quick Introduction to the Genesis Framework for WordPress Introduction to the Genesis Framework... 5 1.1 What's a Framework?... 5 1.2 What's a Child Theme?... 5 1.3 Theme Files... 5
Making a One Degree Motor Arm with Potentiometer and PID
 Making a One Degree Motor Arm with Potentiometer and PID Version 1.0 June 8, 2018 Introduction This guide will demonstrate the coding steps to make a motor move to desired positions using a potentiometer.
Impress Guide Chapter 1 Introducing Impress
 Impress Guide Chapter 1 Introducing Impress This PDF is designed to be read onscreen, two pages at a time. If you want to print a copy, your PDF viewer should have an option for printing two pages on one
Command and Control Tutorial
 Command and Control Tutorial Introduction Command and Control is a new LabVIEW template added for the 2016 season which organizes robot code into commands and controllers for a collection of robot-specific
Bridgit Conferencing Software User s Guide. Version 3.0
 Bridgit Conferencing Software User s Guide Version 3.0 ii Table Of Contents Introducing Bridgit Conferencing Software... 1 System Requirements... 1 Getting Bridgit Conferencing Software... 2 The Bridgit
Welcome Application. Introducing the Visual Studio.NET IDE. Objectives. Outline
 2 T U T O R I A L Objectives In this tutorial, you will learn to: Navigate Visual Studio.NET s Start Page. Create a Visual Basic.NET solution. Use the IDE s menus and toolbars. Manipulate windows in the