BUSINESS DECISION MAKING. Topic 1 Introduction to Statistical Thinking and Business Decision Making Process; Data Collection and Presentation
|
|
|
- Dora Fitzgerald
- 5 years ago
- Views:
Transcription
1 BUSINESS DECISION MAKING Topic 1 Introduction to Statistical Thinking and Business Decision Making Process; Data Collection and Presentation (Chap 1 The Nature of Probability and Statistics) (Chap 2 Frequency Distributions and Graphs) Bluman, Chapter 1 & 2 1
2 How is Statistics used in Business? To solve Business problems and make decisions, population censuses, opinion polls, consumer data bases, and sales and demand data are required to gather information about customers make sales forecasting do market research The role of the Statistician is to determine, for a given question, the type of data that is needed, the way it should be collected and how it should be analysed in order to best answer that question. Peter Chapter 1 2
3 Business Problem-Solving Process Business Question Define Objectives Review Past Data and Brainstorm Management Action Report & Present Interpret & Draw Conclusions Implement, monitor, more research Hypotheses to test Phrase as Statistical Question Analyse Data Peter Chapter 2 Collect Data (Qualitative/Quantitative) 3
4 Chapter 1 Overview Introduction 1-1 Descriptive and Inferential Statistics 1-2 Variables and Types of Data 1-3 Data Collection & Sampling Techniques 1-4 Experimental Designs 1-5 Computers and Calculators Bluman Chapter 1 4
5 Chapter 1 Objectives 1. Demonstrate knowledge of statistical terms. 2. Differentiate between the two branches of statistics. 3. Identify types of data. 4. Identify the measurement level for each variable. 5. Identify the four basic sampling techniques. Bluman, Chapter 1 5
6 Introduction Statistics is the science of conducting studies to collect, organize, summarize, analyze, and draw conclusions from data. Bluman Chapter 1 6
7 1-1 Descriptive and Inferential Statistics A variable is a characteristic or attribute that can assume different values. The values that a variable can assume are called data. A population consists of all subjects (human or otherwise) that are studied. A sample is a subset of the population. Bluman Chapter 1 7
8 1-1 Descriptive and Inferential Statistics Descriptive statistics consists of the collection, organization, summarization, and presentation of data. Inferential statistics consists of generalizing from samples to populations, performing estimations and hypothesis tests, determining relationships among variables, and making predictions. Bluman Chapter 1 8
9 1-2 Variables and Types of Data Data Qualitative Categorical Quantitative Numerical, Can be ranked Discrete Countable 5, 29, 8000, etc. Continuous Can be decimals 2.59, 312.1, etc. Bluman Chapter 1 9
10 1-2 Recorded Values and Boundaries Variable Recorded Value Boundaries Length 15 centimeters (cm) Temperature 86 Fahrenheit ( F) Time 0.43 second (sec) Mass 1.6 grams (g) cm F sec g Bluman Chapter 1 10
11 1-2 Variables and Types of Data Levels of Measurement 1. Nominal categorical (names) 2. Ordinal nominal, plus can be ranked (order) 3. Interval ordinal, plus intervals are consistent 4. Ratio interval, plus ratios are consistent, true zero Bluman Chapter 1 11
12 1-2 Variables and Types of Data Determine the measurement level. Variable Nominal Ordinal Interval Ratio Level Hair Color Yes No Nominal Zip Code Yes No Nominal Letter Grade Yes Yes No Ordinal ACT Score Yes Yes Yes No Interval Height Yes Yes Yes Yes Ratio Age Yes Yes Yes Yes Ratio Temperature (F) Yes Yes Yes No Interval Bluman Chapter 1 12
13 1-3 Data Collection and Sampling Techniques Some Sampling Techniques Random random number generator Systematic every k th subject Stratified divide population into layers Cluster use intact groups Convenient mall surveys Bluman Chapter 1 13
14 1-3 Random Sampling Samples are selected by using chance methods or random numbers Every member of the population has the same chance of being selected Random samples can be chosen by mechanical means (like lotteries), or by computers generating random numbers Example: 30 random numbers (from 1 to 1,000)

15 1-3 Systematic Sampling The items or individuals of the population are arranged in some order. A random starting point is selected and then every kth member of the population is selected for the sample. Example: Sample 8 customers from a total of 64 First Group: randomly select 3 rd person, then 8 th person (k) after that. N = 64 n = 8 k = 8 15
 according to some common characteristic Samples")

16 1-3 Stratified Sampling Divide population into subgroups (called strata) according to some common characteristic Samples within the strata should be randomly selected Samples from subgroups are combined into one Population Divided into 4 strata Sample 16
17 1-3 Cluster Sampling Population is divided into several groups called clusters by some means such as geographical area, each representative of the population The clusters are randomly selected and all members of the selected clusters will be used as the subjects of the samples Population divided into 16 clusters. Randomly selected clusters for sample 17
18 1-3 Convenient Sampling Samples that are convenient to obtain are used Samples selected may or may not represent the population Researcher needs to investigate the characteristics of the population and determines that the sample is representative before using it Example: interview customers entering a mall to determine the nature of their visit 18
19 Chapter 2 Overview Introduction 2-1 Organizing Data 2-2 Histograms, Frequency Polygons, and Ogives 2-3 Other Types of Graphs 2-4 Paired Data and Scatter Plots 19
20 Chapter 2 Objectives 1. Organize data using frequency distributions. 2. Represent data in frequency distributions graphically using histograms, frequency polygons, and ogives. 20
21 2-1 Organizing Data Data collected in original form is called raw data. A frequency distribution is the organization of raw data in table form, using classes and frequencies. Nominal- or ordinal-level data that can be placed in categories is organized in categorical frequency distributions. 21
22 Chapter 2 Frequency Distributions and Graphs Section 2-1 Example
23 Categorical Frequency Distribution Twenty-five army indicates were given a blood test to determine their blood type. Raw Data: A,B,B,AB,O O,O,B,AB,B B,B,O,A,O A,O,O,O,AB AB,A,O,B,A Construct a frequency distribution for the data. 23
24 Categorical Frequency Distribution Twenty-five army indicates were given a blood test to determine their blood type. Raw Data: A,B,B,AB,O O,O,B,AB,B B,B,O,A,O A,O,O,O,AB AB,A,O,B,A Class Tally Frequency Percent A IIII 5 20 B IIII II 7 28 O IIII IIII 9 36 AB IIII
25 Grouped Frequency Distribution Grouped frequency distributions are used when the range of the data is large. The smallest and largest possible data values in a class are the lower and upper class limits. Class boundaries separate the classes. To find a class boundary, average the upper class limit of one class and the lower class limit of the next class. 25
26 Grouped Frequency Distribution The class width can be calculated by subtracting successive lower class limits (or boundaries) successive upper class limits (or boundaries) upper and lower class boundaries The class midpoint X m can be calculated by averaging upper and lower class limits (or boundaries) 26
27 Rules for Classes in Grouped Frequency Distributions 1. There should be 5-20 classes. 2. The class width should be an odd number. 3. The classes must be mutually exclusive. 4. The classes must be continuous. 5. The classes must be exhaustive. 6. The classes must be equal in width (except in openended distributions). 27
28 Chapter 2 Frequency Distributions and Graphs Section 2-1 Example
29 Constructing a Grouped Frequency Distribution The following data represent the record high temperatures for each of the 50 states. Construct a grouped frequency distribution for the data using 7 classes
30 Constructing a Grouped Frequency Distribution STEP 1 Determine the classes. Find the class width by dividing the range by the number of classes 7. Range = High Low = = 34 Width = Range/7 = 34/7 = 5 Rounding Rule: Always round up if a remainder. 30
31 Constructing a Grouped Frequency Distribution For convenience sake, we will choose the lowest data value, 100, for the first lower class limit. The subsequent lower class limits are found by adding the width to the previous lower class limits. Class Limits The first upper class limit is one less than the next lower class limit. The subsequent upper class limits are found by adding the width to the previous upper class limits. 31
32 Constructing a Grouped Frequency Distribution The class boundary is midway between an upper class limit and a subsequent lower class limit. 104,104.5,105 Class Limits Class Boundaries Frequency Cumulative Frequency
33 Constructing a Grouped Frequency Distribution STEP 2 Tally the data. STEP 3 Find the frequencies. Class Limits Class Boundaries Frequency Cumulative Frequency
34 Constructing a Grouped Frequency Distribution STEP 4 Find the cumulative frequencies by keeping a running total of the frequencies. Class Limits Class Boundaries Frequency Cumulative Frequency
35 2-2 Histograms, Frequency Polygons, and Ogives 3 Most Common Graphs in Research 1. Histogram 2. Frequency Polygon 3. Cumulative Frequency Polygon (Ogive) 35

36 2-2 Histograms, Frequency Polygons, and Ogives The histogram is a graph that displays the data by using vertical bars of various heights to represent the frequencies of the classes. The class boundaries are represented on the horizontal axis. 36
37 Chapter 2 Frequency Distributions and Graphs Section 2-2 Example
38 Histograms Construct a histogram to represent the data for the record high temperatures for each of the 50 states (see Example 2 2 for the data). 38
39 Histograms Histograms use class boundaries and frequencies of the classes. Class Limits Class Boundaries Frequency

40 Histograms Histograms use class boundaries and frequencies of the classes. 40
41 2.2 Histograms, Frequency Polygons, and Ogives The frequency polygon is a graph that displays the data by using lines that connect points plotted for the frequencies at the class midpoints. The frequencies are represented by the heights of the points. The class midpoints are represented on the horizontal axis. 41
42 Chapter 2 Frequency Distributions and Graphs Section 2-2 Example
43 Frequency Polygons Construct a frequency polygon to represent the data for the record high temperatures for each of the 50 states (see Example 2 2 for the data). 43
44 Frequency Polygons Frequency polygons use class midpoints and frequencies of the classes. Class Limits Class Midpoints Frequency
45 Frequency Polygons Frequency polygons use class midpoints and frequencies of the classes. A frequency polygon is anchored on the x-axis before the first class and after the last class. 45
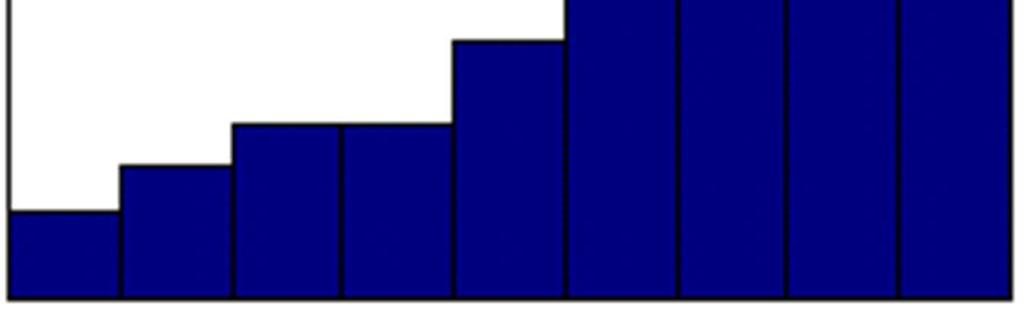
46 2.2 Histograms, Frequency Polygons, and Ogives The ogive is a graph that represents the cumulative frequencies for the classes in a frequency distribution. The upper class boundaries are represented on the horizontal axis. 46
47 Chapter 2 Frequency Distributions and Graphs Section 2-2 Example
48 Ogives Construct an ogive to represent the data for the record high temperatures for each of the 50 states (see Example 2 2 for the data). 48
49 Ogives Ogives use upper class boundaries and cumulative frequencies of the classes. Class Limits Class Boundaries Frequency Cumulative Frequency
50 Ogives Ogives use upper class boundaries and cumulative frequencies of the classes. Class Boundaries Less than Less than Less than Less than Less than Less than Less than Cumulative Frequency
51 Ogives Ogives use upper class boundaries and cumulative frequencies of the classes. 51
52 Procedure Table Constructing Statistical Graphs 1: Draw and label the x and y axes. 2: Choose a suitable scale for the frequencies or cumulative frequencies, and label it on the y axis. 3: Represent the class boundaries for the histogram or ogive, or the midpoint for the frequency polygon, on the x axis. 4: Plot the points and then draw the bars or lines. 52
53 2.2 Histograms, Frequency Polygons, and Ogives If proportions are used instead of frequencies, the graphs are called relative frequency graphs. Relative frequency graphs are used when the proportion of data values that fall into a given class is more important than the actual number of data values that fall into that class. 53
54 Chapter 2 Frequency Distributions and Graphs Section 2-2 Example
55 Construct a histogram, frequency polygon, and ogive using relative frequencies for the distribution (shown here) of the miles that 20 randomly selected runners ran during a given week. Class Boundaries Frequency
56 Histograms The following is a frequency distribution of miles run per week by 20 selected runners. Class Boundaries Frequency Relative Frequency 1 1/20 = /20 = /20 = /20 = /20 = /20 = /20 = 0.10 Σf = 20 Σrf = 1.00 Divide each frequency by the total frequency to get the relative frequency. 56

57 Histograms Use the class boundaries and the relative frequencies of the classes. 57
58 Frequency Polygons The following is a frequency distribution of miles run per week by 20 selected runners. Class Boundaries Class Midpoints Relative Frequency
59 Frequency Polygons Use the class midpoints and the relative frequencies of the classes. 59
60 Ogives The following is a frequency distribution of miles run per week by 20 selected runners. Class Boundaries Frequency Cumulative Frequency Cum. Rel. Frequency Σf = /20 = 3/20 = 6/20 = 11/20 = 15/20 = 18/20 = 20/20 =
61 Ogives Ogives use upper class boundaries and cumulative frequencies of the classes. Class Boundaries Less than 10.5 Less than 15.5 Less than 20.5 Less than 25.5 Less than 30.5 Less than 35.5 Less than 40.5 Cum. Rel. Frequency
62 Ogives Use the upper class boundaries and the cumulative relative frequencies. 62
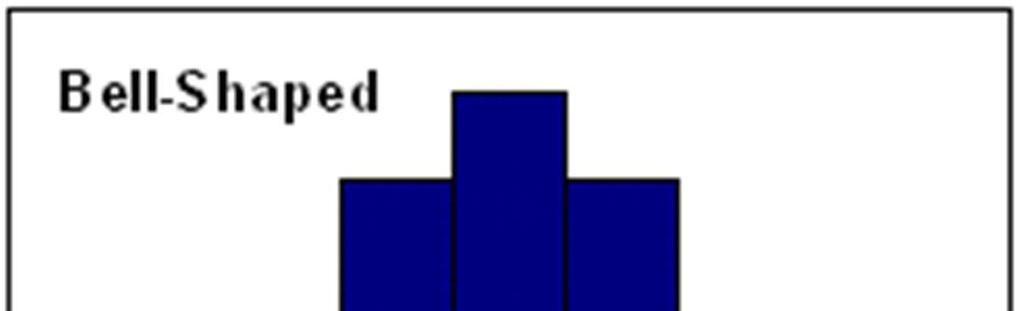
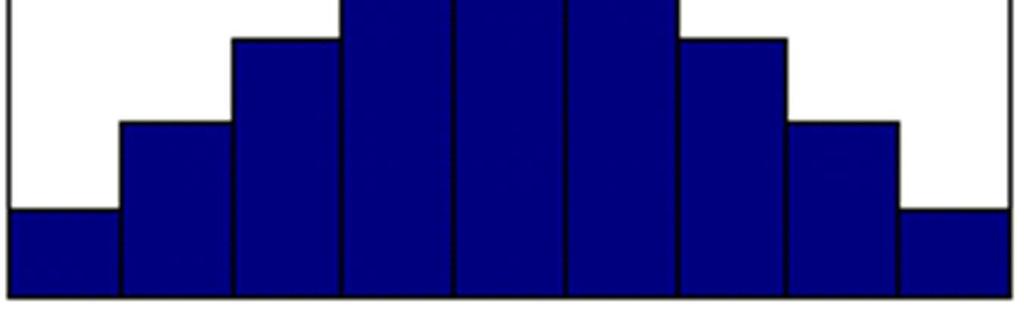
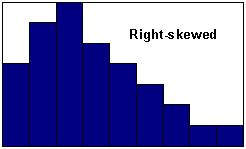
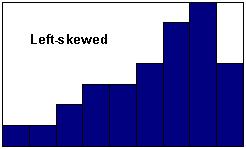
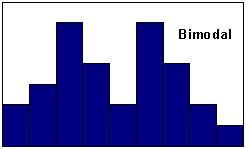
63 Shapes of Distributions 63
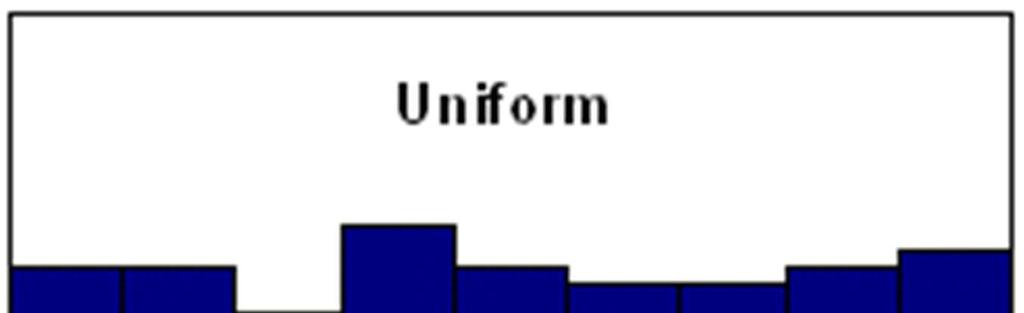
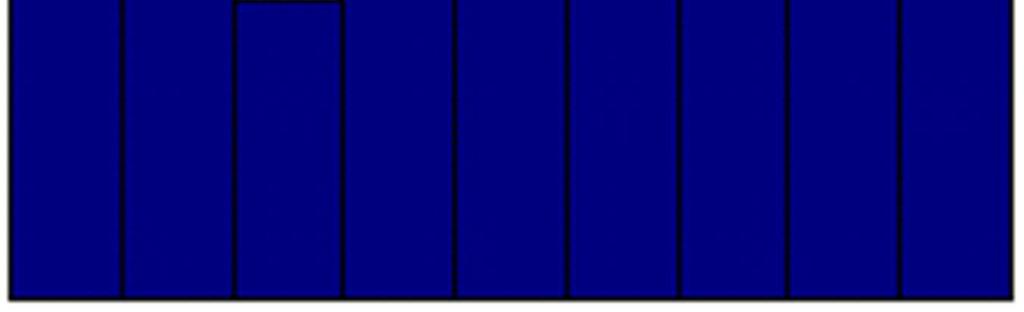
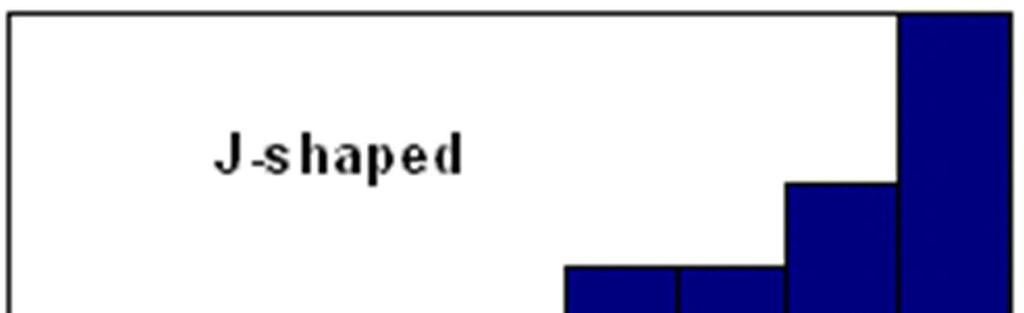


64 Shapes of Distributions 64
Courtesy :
 STATISTICS The Nature of Statistics Introduction Statistics is the science of data Statistics is the science of conducting studies to collect, organize, summarize, analyze, and draw conclusions from data.
Chapter 2. Frequency Distributions and Graphs. Bluman, Chapter 2
 Chapter 2 Frequency Distributions and Graphs 1 Chapter 2 Overview Introduction 2-1 Organizing Data 2-2 Histograms, Frequency Polygons, and Ogives 2-3 Other Types of Graphs 2 Chapter 2 Objectives 1. Organize
Frequency Distributions and Graphs
 //05 C H A P T E R T W O s and s and Outline CHAPTER - Organizing Data - Histograms, Polygons, and - Other Types of -4 Paired Data and Scatter Plots Learning Objectives Organize data using a frequency
Spell out your full name (first, middle and last)
") Spell out your full name (first, middle and last) Be ready to share the following counts: Number of letters in your full name. Number of vowels Number of consonants Section 2-1 Organizing Data After completing
Spell out your full name (first, middle and last) Be ready to share the following counts: Number of letters in your full name. Number of vowels Number of consonants Section 2-1 Organizing Data After completing
This chapter will show how to organize data and then construct appropriate graphs to represent the data in a concise, easy-to-understand form.
 CHAPTER 2 Frequency Distributions and Graphs Objectives Organize data using frequency distributions. Represent data in frequency distributions graphically using histograms, frequency polygons, and ogives.
MATH 117 Statistical Methods for Management I Chapter Two
 Jubail University College MATH 117 Statistical Methods for Management I Chapter Two There are a wide variety of ways to summarize, organize, and present data: I. Tables 1. Distribution Table (Categorical
Elementary Statistics
 1 Elementary Statistics Introduction Statistics is the collection of methods for planning experiments, obtaining data, and then organizing, summarizing, presenting, analyzing, interpreting, and drawing
CHAPTER 2. Objectives. Frequency Distributions and Graphs. Basic Vocabulary. Introduction. Organise data using frequency distributions.
 CHAPTER 2 Objectives Organise data using frequency distributions. Distributions and Graphs Represent data in frequency distributions graphically using histograms, frequency polygons, and ogives. Represent
Frequency distribution
 Frequency distribution In order to describe situations, draw conclusions, or make inferences about events, the researcher must organize the data in some meaningful way. The most convenient method of organizing
Overview. Frequency Distributions. Chapter 2 Summarizing & Graphing Data. Descriptive Statistics. Inferential Statistics. Frequency Distribution
 Chapter 2 Summarizing & Graphing Data Slide 1 Overview Descriptive Statistics Slide 2 A) Overview B) Frequency Distributions C) Visualizing Data summarize or describe the important characteristics of a
Data Statistics Population. Census Sample Correlation... Statistical & Practical Significance. Qualitative Data Discrete Data Continuous Data
 Data Statistics Population Census Sample Correlation... Voluntary Response Sample Statistical & Practical Significance Quantitative Data Qualitative Data Discrete Data Continuous Data Fewer vs Less Ratio
Test Bank for Privitera, Statistics for the Behavioral Sciences
 1. A simple frequency distribution A) can be used to summarize grouped data B) can be used to summarize ungrouped data C) summarizes the frequency of scores in a given category or range 2. To determine
Organizing Data. Class limits (in miles) Tally Frequency Total 50
 Tally Frequency Total 50") 2 2 Organizing Data Objective 1. Organize data using frequency distributions. Suppose a researcher wished to do a study on the number of miles the employees of a large department store traveled to work
2 2 Organizing Data Objective 1. Organize data using frequency distributions. Suppose a researcher wished to do a study on the number of miles the employees of a large department store traveled to work
Section 2-2 Frequency Distributions. Copyright 2010, 2007, 2004 Pearson Education, Inc
 Section 2-2 Frequency Distributions Copyright 2010, 2007, 2004 Pearson Education, Inc. 2.1-1 Frequency Distribution Frequency Distribution (or Frequency Table) It shows how a data set is partitioned among
Section 2-2. Histograms, frequency polygons and ogives. Friday, January 25, 13
 Section 2-2 Histograms, frequency polygons and ogives 1 Histograms 2 Histograms The histogram is a graph that displays the data by using contiguous vertical bars of various heights to represent the frequencies
Data can be in the form of numbers, words, measurements, observations or even just descriptions of things.
 + What is Data? Data is a collection of facts. Data can be in the form of numbers, words, measurements, observations or even just descriptions of things. In most cases, data needs to be interpreted and
Chapter 2: Understanding Data Distributions with Tables and Graphs
 Test Bank Chapter 2: Understanding Data with Tables and Graphs Multiple Choice 1. Which of the following would best depict nominal level data? a. pie chart b. line graph c. histogram d. polygon Ans: A
Downloaded from
 UNIT 2 WHAT IS STATISTICS? Researchers deal with a large amount of data and have to draw dependable conclusions on the basis of data collected for the purpose. Statistics help the researchers in making
Frequency Distributions
 Displaying Data Frequency Distributions After collecting data, the first task for a researcher is to organize and summarize the data so that it is possible to get a general overview of the results. Remember,
Chapter 2 Describing, Exploring, and Comparing Data
 Slide 1 Chapter 2 Describing, Exploring, and Comparing Data Slide 2 2-1 Overview 2-2 Frequency Distributions 2-3 Visualizing Data 2-4 Measures of Center 2-5 Measures of Variation 2-6 Measures of Relative
Graphical Presentation for Statistical Data (Relevant to AAT Examination Paper 4: Business Economics and Financial Mathematics) Introduction
 Introduction") Graphical Presentation for Statistical Data (Relevant to AAT Examination Paper 4: Business Economics and Financial Mathematics) Y O Lam, SCOPE, City University of Hong Kong Introduction The most convenient
Graphical Presentation for Statistical Data (Relevant to AAT Examination Paper 4: Business Economics and Financial Mathematics) Y O Lam, SCOPE, City University of Hong Kong Introduction The most convenient
2.1: Frequency Distributions
 2.1: Frequency Distributions Frequency Distribution: organization of data into groups called. A: Categorical Frequency Distribution used for and level qualitative data that can be put into categories.
Lecture Slides. Elementary Statistics Twelfth Edition. by Mario F. Triola. and the Triola Statistics Series. Section 2.1- #
 Lecture Slides Elementary Statistics Twelfth Edition and the Triola Statistics Series by Mario F. Triola Chapter 2 Summarizing and Graphing Data 2-1 Review and Preview 2-2 Frequency Distributions 2-3 Histograms
download instant at Summarizing Data: Listing and Grouping
 Ch. 2 download instant at www.easysemester.com Summarizing Data: Listing and Grouping 2.1 Multiple Choice Questions MULTIPLE CHOICE. Choose the one alternative that best completes the statement or answers
Round each observation to the nearest tenth of a cent and draw a stem and leaf plot.
 Warm Up Round each observation to the nearest tenth of a cent and draw a stem and leaf plot. 1. Constructing Frequency Polygons 2. Create Cumulative Frequency and Cumulative Relative Frequency Tables 3.
Chapter 2 - Graphical Summaries of Data
 Chapter 2 - Graphical Summaries of Data Data recorded in the sequence in which they are collected and before they are processed or ranked are called raw data. Raw data is often difficult to make sense
B. Graphing Representation of Data
 B Graphing Representation of Data The second way of displaying data is by use of graphs Although such visual aids are even easier to read than tables, they often do not give the same detail It is essential
Describing Data: Frequency Tables, Frequency Distributions, and Graphic Presentation
 Describing Data: Frequency Tables, Frequency Distributions, and Graphic Presentation Chapter 2 McGraw-Hill/Irwin Copyright 2010 by The McGraw-Hill Companies, Inc. All rights reserved. GOALS 1. Organize
MATH1635, Statistics (2)
") MATH1635, Statistics (2) Chapter 2 Histograms and Frequency Distributions I. A Histogram is a form of bar graph in which: A. The width of a bar is designated by an interval or ratio data value and thus
MATH1635, Statistics (2) Chapter 2 Histograms and Frequency Distributions I. A Histogram is a form of bar graph in which: A. The width of a bar is designated by an interval or ratio data value and thus
Math Tech IIII, Sep 14
 Math Tech IIII, Sep 14 Variations on the Frequency Histogram 2 Book Sections: 2.3 Essential Questions: What are the methods for displaying data, and how can I build them? What are variations of the frequency
Basic Statistical Terms and Definitions
 I. Basics Basic Statistical Terms and Definitions Statistics is a collection of methods for planning experiments, and obtaining data. The data is then organized and summarized so that professionals can
Chapter 2. Frequency distribution. Summarizing and Graphing Data
 Frequency distribution Chapter 2 Summarizing and Graphing Data Shows how data are partitioned among several categories (or classes) by listing the categories along with the number (frequency) of data values
JUST THE MATHS UNIT NUMBER STATISTICS 1 (The presentation of data) A.J.Hobson
 A.J.Hobson") JUST THE MATHS UNIT NUMBER 18.1 STATISTICS 1 (The presentation of data) by A.J.Hobson 18.1.1 Introduction 18.1.2 The tabulation of data 18.1.3 The graphical representation of data 18.1.4 Exercises 18.1.5
JUST THE MATHS UNIT NUMBER 18.1 STATISTICS 1 (The presentation of data) by A.J.Hobson 18.1.1 Introduction 18.1.2 The tabulation of data 18.1.3 The graphical representation of data 18.1.4 Exercises 18.1.5
Chapter 2 - Frequency Distributions and Graphs
 1. Which of the following does not need to be done when constructing a frequency distribution? A) select the number of classes desired B) find the range C) make the class width an even number D) use classes
Lecture Slides. Elementary Statistics Tenth Edition. by Mario F. Triola. and the Triola Statistics Series. Slide 1
 Lecture Slides Elementary Statistics Tenth Edition and the Triola Statistics Series by Mario F. Triola Slide 1 Chapter 2 Summarizing and Graphing Data 2-1 Overview 2-2 Frequency Distributions 2-3 Histograms
Applied Statistics for the Behavioral Sciences
 Applied Statistics for the Behavioral Sciences Chapter 2 Frequency Distributions and Graphs Chapter 2 Outline Organization of Data Simple Frequency Distributions Grouped Frequency Distributions Graphs
Special Review Section. Copyright 2014 Pearson Education, Inc.
 Special Review Section SRS-1--1 Special Review Section Chapter 1: The Where, Why, and How of Data Collection Chapter 2: Graphs, Charts, and Tables Describing Your Data Chapter 3: Describing Data Using
NOTES TO CONSIDER BEFORE ATTEMPTING EX 1A TYPES OF DATA
 NOTES TO CONSIDER BEFORE ATTEMPTING EX 1A TYPES OF DATA Statistics is concerned with scientific methods of collecting, recording, organising, summarising, presenting and analysing data from which future
Chapter 2 Organizing and Graphing Data. 2.1 Organizing and Graphing Qualitative Data
 Chapter 2 Organizing and Graphing Data 2.1 Organizing and Graphing Qualitative Data 2.2 Organizing and Graphing Quantitative Data 2.3 Stem-and-leaf Displays 2.4 Dotplots 2.1 Organizing and Graphing Qualitative
Raw Data is data before it has been arranged in a useful manner or analyzed using statistical techniques.
 Section 2.1 - Introduction Graphs are commonly used to organize, summarize, and analyze collections of data. Using a graph to visually present a data set makes it easy to comprehend and to describe the
Chapter 2: Graphical Summaries of Data 2.1 Graphical Summaries for Qualitative Data. Frequency: Frequency distribution:
 Chapter 2: Graphical Summaries of Data 2.1 Graphical Summaries for Qualitative Data Frequency: Frequency distribution: Example 2.1 The following are survey results from Fall 2014 Statistics class regarding
Chapter Two: Descriptive Methods 1/50
 Chapter Two: Descriptive Methods 1/50 2.1 Introduction 2/50 2.1 Introduction We previously said that descriptive statistics is made up of various techniques used to summarize the information contained
STAT STATISTICAL METHODS. Statistics: The science of using data to make decisions and draw conclusions
 STAT 515 --- STATISTICAL METHODS Statistics: The science of using data to make decisions and draw conclusions Two branches: Descriptive Statistics: The collection and presentation (through graphical and
Slide Copyright 2005 Pearson Education, Inc. SEVENTH EDITION and EXPANDED SEVENTH EDITION. Chapter 13. Statistics Sampling Techniques
 SEVENTH EDITION and EXPANDED SEVENTH EDITION Slide - Chapter Statistics. Sampling Techniques Statistics Statistics is the art and science of gathering, analyzing, and making inferences from numerical information
2.3 Organizing Quantitative Data
 2.3 Organizing Quantitative Data This section will focus on ways to organize quantitative data into tables, charts, and graphs. Quantitative data is organized by dividing the observations into classes
Prob and Stats, Sep 4
 Prob and Stats, Sep 4 Variations on the Frequency Histogram Book Sections: N/A Essential Questions: What are the methods for displaying data, and how can I build them? What are variations of the frequency
CHAPTER 2: SAMPLING AND DATA
 CHAPTER 2: SAMPLING AND DATA This presentation is based on material and graphs from Open Stax and is copyrighted by Open Stax and Georgia Highlands College. OUTLINE 2.1 Stem-and-Leaf Graphs (Stemplots),
STP 226 ELEMENTARY STATISTICS NOTES
 ELEMENTARY STATISTICS NOTES PART 2 - DESCRIPTIVE STATISTICS CHAPTER 2 ORGANIZING DATA Descriptive Statistics - include methods for organizing and summarizing information clearly and effectively. - classify
- 1 - Class Intervals
 - 1 - Class Intervals To work with continuous numeric data and to represent it in some sort of a graph or a chart, you have to separate the data into class intervals that is, intervals of equal length.
Part I, Chapters 4 & 5. Data Tables and Data Analysis Statistics and Figures
 Part I, Chapters 4 & 5 Data Tables and Data Analysis Statistics and Figures Descriptive Statistics 1 Are data points clumped? (order variable / exp. variable) Concentrated around one value? Concentrated
2.1: Frequency Distributions and Their Graphs
 2.1: Frequency Distributions and Their Graphs Frequency Distribution - way to display data that has many entries - table that shows classes or intervals of data entries and the number of entries in each
Measures of Central Tendency
 Page of 6 Measures of Central Tendency A measure of central tendency is a value used to represent the typical or average value in a data set. The Mean The sum of all data values divided by the number of
McGraw-Hill Ryerson. Data Management 12. Section 5.1 Continuous Random Variables. Continuous Random. Variables
 McGraw-Hill Ryerson Data Management 12 Section Continuous Random I am learning to distinguish between discrete variables and continuous variables work with sample values for situations that can take on
Chapter 2. Descriptive Statistics: Organizing, Displaying and Summarizing Data
 Chapter 2 Descriptive Statistics: Organizing, Displaying and Summarizing Data Objectives Student should be able to Organize data Tabulate data into frequency/relative frequency tables Display data graphically
demonstrate an understanding of the exponent rules of multiplication and division, and apply them to simplify expressions Number Sense and Algebra
 MPM 1D - Grade Nine Academic Mathematics This guide has been organized in alignment with the 2005 Ontario Mathematics Curriculum. Each of the specific curriculum expectations are cross-referenced to the
At the end of the chapter, you will learn to: Present data in textual form. Construct different types of table and graphs
 DATA PRESENTATION At the end of the chapter, you will learn to: Present data in textual form Construct different types of table and graphs Identify the characteristics of a good table and graph Identify
Prepare a stem-and-leaf graph for the following data. In your final display, you should arrange the leaves for each stem in increasing order.
 Chapter 2 2.1 Descriptive Statistics A stem-and-leaf graph, also called a stemplot, allows for a nice overview of quantitative data without losing information on individual observations. It can be a good
Measures of Central Tendency. A measure of central tendency is a value used to represent the typical or average value in a data set.
 Measures of Central Tendency A measure of central tendency is a value used to represent the typical or average value in a data set. The Mean the sum of all data values divided by the number of values in
28 CHAPTER 2 Summarizing and Graphing Data
 8 CHAPTER Summarizing and Graphing Data. The two requested histograms are given below. They give very different visual images of the shape of the distribution. An outlier can have a significant effect
STATISTICS Chapter (1) Introduction
 Introduction") REFERENCES: 1. Calculus and analytic geometry By Thomas / FINNEY sixth Edition. 2. Advanced engineering mathematics By C.Ray Wylie fifth edition Lovis C. Barrett 3. Mathematical Methods for science students
REFERENCES: 1. Calculus and analytic geometry By Thomas / FINNEY sixth Edition. 2. Advanced engineering mathematics By C.Ray Wylie fifth edition Lovis C. Barrett 3. Mathematical Methods for science students
2. The histogram. class limits class boundaries frequency cumulative frequency
 MA 115 Lecture 03 - Some Standard Graphs Friday, September, 017 Objectives: Introduce some standard statistical graph types. 1. Some Standard Kinds of Graphs Last week, we looked at the Frequency Distribution
MAT 110 WORKSHOP. Updated Fall 2018
 MAT 110 WORKSHOP Updated Fall 2018 UNIT 3: STATISTICS Introduction Choosing a Sample Simple Random Sample: a set of individuals from the population chosen in a way that every individual has an equal chance
The basic arrangement of numeric data is called an ARRAY. Array is the derived data from fundamental data Example :- To store marks of 50 student
 Organizing data Learning Outcome 1. make an array 2. divide the array into class intervals 3. describe the characteristics of a table 4. construct a frequency distribution table 5. constructing a composite
+ Statistical Methods in
 + Statistical Methods in Practice STA/MTH 3379 + Dr. A. B. W. Manage Associate Professor of Statistics Department of Mathematics & Statistics Sam Houston State University Discovering Statistics 2nd Edition
TYPES OF NUMBER P1 P2 P3 Learning Objective Understand place value in large numbers Add and subtract large numbers (up to 3 digits) Multiply and
 Multiply and") TYPES OF NUMBER P1 P2 P3 Understand place value in large numbers Add and subtract large numbers (up to 3 digits) Multiply and divide large numbers (up to 3 by 2) Understand positive and negative integers
TYPES OF NUMBER P1 P2 P3 Understand place value in large numbers Add and subtract large numbers (up to 3 digits) Multiply and divide large numbers (up to 3 by 2) Understand positive and negative integers
Chapter 2: Frequency Distributions
 Chapter 2: Frequency Distributions Chapter Outline 2.1 Introduction to Frequency Distributions 2.2 Frequency Distribution Tables Obtaining ΣX from a Frequency Distribution Table Proportions and Percentages
MATH 1070 Introductory Statistics Lecture notes Descriptive Statistics and Graphical Representation
 MATH 1070 Introductory Statistics Lecture notes Descriptive Statistics and Graphical Representation Objectives: 1. Learn the meaning of descriptive versus inferential statistics 2. Identify bar graphs,
Ms Nurazrin Jupri. Frequency Distributions
 Frequency Distributions Frequency Distributions After collecting data, the first task for a researcher is to organize and simplify the data so that it is possible to get a general overview of the results.
Things you ll know (or know better to watch out for!) when you leave in December: 1. What you can and cannot infer from graphs.
 when you leave in December: 1. What you can and cannot infer from graphs.") 1 2 Things you ll know (or know better to watch out for!) when you leave in December: 1. What you can and cannot infer from graphs. 2. How to construct (in your head!) and interpret confidence intervals.
1 2 Things you ll know (or know better to watch out for!) when you leave in December: 1. What you can and cannot infer from graphs. 2. How to construct (in your head!) and interpret confidence intervals.
Tabular & Graphical Presentation of data
 Tabular & Graphical Presentation of data bjectives: To know how to make frequency distributions and its importance To know different terminology in frequency distribution table To learn different graphs/diagrams
Lesson 18-1 Lesson Lesson 18-1 Lesson Lesson 18-2 Lesson 18-2
 Topic 18 Set A Words survey data Topic 18 Set A Words Lesson 18-1 Lesson 18-1 sample line plot Lesson 18-1 Lesson 18-1 frequency table bar graph Lesson 18-2 Lesson 18-2 Instead of making 2-sided copies
UNIT 15 GRAPHICAL PRESENTATION OF DATA-I
 UNIT 15 GRAPHICAL PRESENTATION OF DATA-I Graphical Presentation of Data-I Structure 15.1 Introduction Objectives 15.2 Graphical Presentation 15.3 Types of Graphs Histogram Frequency Polygon Frequency Curve
SOST 201 September 20, Stem-and-leaf display 2. Miscellaneous issues class limits, rounding, and interval width.
 1 Social Studies 201 September 20, 2006 Presenting data and stem-and-leaf display See text, chapter 4, pp. 87-160. Introduction Statistical analysis primarily deals with issues where it is possible to
1.2. Pictorial and Tabular Methods in Descriptive Statistics
 1.2. Pictorial and Tabular Methods in Descriptive Statistics Section Objectives. 1. Stem-and-Leaf displays. 2. Dotplots. 3. Histogram. Types of histogram shapes. Common notation. Sample size n : the number
Statistical Methods. Instructor: Lingsong Zhang. Any questions, ask me during the office hour, or me, I will answer promptly.
 Statistical Methods Instructor: Lingsong Zhang 1 Issues before Class Statistical Methods Lingsong Zhang Office: Math 544 Email: lingsong@purdue.edu Phone: 765-494-7913 Office Hour: Monday 1:00 pm - 2:00
https://testbankreal.com/download/business-statistics-10th-edition-groebnertest-bank/ Business Statistics 10th Edition Groebner SOLUTIONS MANUAL
 Business Statistics 10th Edition Groebner TEST BANK Business Statistics 10th Edition Groebner SOLUTIONS MANUAL Full download at: Full download at: https://testbankreal.com/download/business-statistics-10th-edition-groebnertest-bank/
Common Core Vocabulary and Representations
 Vocabulary Description Representation 2-Column Table A two-column table shows the relationship between two values. 5 Group Columns 5 group columns represent 5 more or 5 less. a ten represented as a 5-group
JULY GRADE 6(MATHEMATICS) OBJECTIVE LEARNER PROFILE ATL INTERDISCIPLINARY TOPIC- NUMBER. Topic-1
 OBJECTIVE LEARNER PROFILE ATL INTERDISCIPLINARY TOPIC- NUMBER. Topic-1") JULY GRADE 6(MATHEMATICS) OBJECTIVE LEARNER PROFILE ATL INTERDISCIPLINARY TOPIC- NUMBER Topic-1 Topic - 1 Topic- 1 Topic-1 Significant Concepts- We depend on numbers everyday and we need to understand
JULY GRADE 6(MATHEMATICS) OBJECTIVE LEARNER PROFILE ATL INTERDISCIPLINARY TOPIC- NUMBER Topic-1 Topic - 1 Topic- 1 Topic-1 Significant Concepts- We depend on numbers everyday and we need to understand
Frequency, proportional, and percentage distributions.
 1 Social Studies 201 September 13-15, 2004 Presenting data and stem-and-leaf display See text, chapter 4, pp. 87-160. Introduction Statistical analysis primarily deals with issues where it is possible
YEAR 7 SCHEME OF WORK - EXTENSION
 YEAR 7 SCHEME OF WORK - EXTENSION Autumn Term 1 Number Skills Spring Term 1 Angles and Shape Summer Term 1 Multiplicative Reasoning Analysing and displaying data Decimals Perimeter, Area and Volume Half
3.2-Measures of Center
 3.2-Measures of Center Characteristics of Center: Measures of center, including mean, median, and mode are tools for analyzing data which reflect the value at the center or middle of a set of data. We
Math 227 EXCEL / MEGASTAT Guide
 Math 227 EXCEL / MEGASTAT Guide Introduction Introduction: Ch2: Frequency Distributions and Graphs Construct Frequency Distributions and various types of graphs: Histograms, Polygons, Pie Charts, Stem-and-Leaf
number Understand the equivalence between recurring decimals and fractions
 number Understand the equivalence between recurring decimals and fractions Using and Applying Algebra Calculating Shape, Space and Measure Handling Data Use fractions or percentages to solve problems involving
STAT10010 Introductory Statistics Lab 2
 STAT10010 Introductory Statistics Lab 2 1. Aims of Lab 2 By the end of this lab you will be able to: i. Recognize the type of recorded data. ii. iii. iv. Construct summaries of recorded variables. Calculate
Organizing and Summarizing Data
 1 Organizing and Summarizing Data Key Definitions Frequency Distribution: This lists each category of data and how often they occur. : The percent of observations within the one of the categories. This
Making Science Graphs and Interpreting Data
 Making Science Graphs and Interpreting Data Eye Opener: 5 mins What do you see? What do you think? Look up terms you don t know What do Graphs Tell You? A graph is a way of expressing a relationship between
Mathematics Year 9-11 Skills and Knowledge Checklist. Name: Class: Set : 4 Date Year 9 MEG :
 Personal targets to help me achieve my grade : AFL Sheet Number 1 : Integers, Decimals, Fractions Integers I can multiply single digit numbers (know my times tables) I can multiply and divide by a power
Chapters 1.5 and 2.5 Statistics: Collecting and Displaying Data
 Chapters 1.5 and 2.5 Statistics: Collecting and Displaying Data Chapter Objectives: Decide which data is relevant, know methods to collect and organize data ; Design and use a data collection sheet or
Data Has Shape. Did you know? Data has Shape! Examples. My Data What do you think the shape of height data for this class looks like?
 L01 Data Has Shape Did you know? Data has Shape! Examples My Data What do you think the shape of height data for this class looks like? Data From you Calculate your height in inches From the shape of the
Age Related Maths Expectations
 Step 1 Times Tables Addition Subtraction Multiplication Division Fractions Decimals Percentage & I can count in 2 s, 5 s and 10 s from 0 to 100 I can add in 1 s using practical resources I can add in 1
Elementary Statistics. Organizing Raw Data
 Organizing Raw Data What is a Raw Data? Raw Data (sometimes called source data) is data that has not been processed for meaningful use. What is a Frequency Distribution Table? A Frequency Distribution
Raw Data. Statistics 1/8/2016. Relative Frequency Distribution. Frequency Distributions for Qualitative Data
 Statistics Raw Data Raw data is random and unranked data. Organizing Data Frequency distributions list all the categories and the numbers of elements that belong to each category Frequency Distributions
TIPS4Math Grades 4 to 6 Overview Grade 4 Grade 5 Grade 6 Collect, Organize, and Display Primary Data (4+ days)
") Collect, Organize, and Display Primary Data (4+ days) Collect, Organize, Display and Interpret Categorical Data (5+ days) 4m88 Collect data by conducting a survey or an experiment to do with the 4m89 Collect
Collect, Organize, and Display Primary Data (4+ days) Collect, Organize, Display and Interpret Categorical Data (5+ days) 4m88 Collect data by conducting a survey or an experiment to do with the 4m89 Collect
LESSON 3: CENTRAL TENDENCY
 LESSON 3: CENTRAL TENDENCY Outline Arithmetic mean, median and mode Ungrouped data Grouped data Percentiles, fractiles, and quartiles Ungrouped data Grouped data 1 MEAN Mean is defined as follows: Sum
Math Lesson Plan 6th Grade Curriculum Total Activities: 302
 TimeLearning Online Learning for Homeschool and Enrichment www.timelearning.com Languages Arts, Math and more Multimedia s, Interactive Exercises, Printable Worksheets and Assessments Student Paced Learning
Unit 7 Statistics. AFM Mrs. Valentine. 7.1 Samples and Surveys
 Unit 7 Statistics AFM Mrs. Valentine 7.1 Samples and Surveys v Obj.: I will understand the different methods of sampling and studying data. I will be able to determine the type used in an example, and
DAY 52 BOX-AND-WHISKER
 DAY 52 BOX-AND-WHISKER VOCABULARY The Median is the middle number of a set of data when the numbers are arranged in numerical order. The Range of a set of data is the difference between the highest and
Averages and Variation
 Averages and Variation 3 Copyright Cengage Learning. All rights reserved. 3.1-1 Section 3.1 Measures of Central Tendency: Mode, Median, and Mean Copyright Cengage Learning. All rights reserved. 3.1-2 Focus
Prentice Hall Mathematics: Course Correlated to: Colorado Model Content Standards and Grade Level Expectations (Grade 6)
") Colorado Model Content Standards and Grade Level Expectations (Grade 6) Standard 1: Students develop number sense and use numbers and number relationships in problemsolving situations and communicate the
Colorado Model Content Standards and Grade Level Expectations (Grade 6) Standard 1: Students develop number sense and use numbers and number relationships in problemsolving situations and communicate the
Type of graph: Explain why you picked this type of graph. Temperature (C) of product formed per minute)
 of product formed per minute)") Name: Graphing Raw Data Key Idea: Unprocessed data is called raw data. A set of data is often processed or transformed to make it easier to understand and to identify important features. Constructing Tables
Name: Graphing Raw Data Key Idea: Unprocessed data is called raw data. A set of data is often processed or transformed to make it easier to understand and to identify important features. Constructing Tables