3020 N. Schevene Blvd. Phone: Flagstaff, AZ USA
|
|
|
- Roger Ball
- 5 years ago
- Views:
Transcription
1 NAME: Directional Slope 1.2a Aka: dir_slope.avx Last modified: October 6, 2006 TOPICS: Slope Direction Angle Bearing AUTHOR: Jeff Jenness Wildlife Biologist, GIS Analyst Jenness Enterprises Web Site: N. Schevene Blvd. Phone: Flagstaff, AZ USA DESCRIPTION: This extension generates a grid of estimated slope values, where the slope is measured in specified directions. This differs from the standard slope value which estimates the absolute slope in the steepest direction. Results: Produces a grid of slope values in either Percent or Degrees. REQUIRES: Spatial Analyst, plus a projected grid of elevation values. The elevation units must be the same as the coordinate system units. If your elevation grid is unprojected and you do not have access to ArcInfo Grid Projection utilities, you can use the author s Grid Projector extension to project your grid (see This extension also requires that the file "avdlog.dll" be present in the ArcView/BIN32 directory (or $AVBIN/avdlog.dll) and that the Dialog Designer extension be located in your ArcView/ext32 directory, which they usually are if you're running AV 3.1 or better. The Dialog Designer doesn't have to be loaded; it just has to be available. If you are running AV 3.0a, you can download the appropriate files for free from ESRI at: REVISIONS: Version 1.2a: Minor update, adds a function to check scripts if extension crashes. Recommended Citation Format: For those who wish to cite this extension, the author recommends something similar to: Jenness, J Directional Slope (dir_slope.avx) extension for ArcView 3.x, v. 1.2a. Jenness Enterprises. Available at: Please let me know if you cite this extension in a publication (jeffj@jennessent.com). I will update the citation list to include any publications that I am told about. Table of Contents GENERAL INSTRUCTIONS:... 2 CALCULATING SLOPE IN CARDINAL DIRECTIONS:... 3 CALCULATING SLOPE IN ANY DIRECTION:... 5 HOW THIS EXTENSION CALCULATES SLOPE:... 7 REFERENCES TROUBLESHOOTING... 11
2 General Instructions: 1) Begin by placing the "dir_slope.avx " file into the ArcView extensions directory (../../Av_gis30/Arcview/ext32/). 2) After starting ArcView, load the extension by clicking on File --> Extensions, scrolling down through the list of available extensions, and then clicking on the checkbox next to the extension called "Directional Slope." 3) The extension will add two buttons to your View. These buttons will only be enabled if you have a single grid theme active in your view. The slope calculations will be done on the active grid, and the extension assumes this is a grid of elevation values in which the elevation units are the same as the X- and Y-Coordinate units (i.e. the grid must be projected). If your elevation grid is unprojected and you do not have access to ArcInfo Grid Projection utilities, you can use the author s Grid Projector extension to project your grid (see a. This button calculates slope in the cardinal directions North, Northeast, East, Southeast, South, Southwest, West and Northwest. Slope values may be calculated in either Degrees or Percent. b. This button calculates slope in a single specified direction and can use any compass bearing. Slope values may be calculated in either Degrees or Percent. IMPORTANT: There are many ways to calculate slope based on different assumptions of what the slope should represent. The method presented here makes intuitive sense to the author, but please review the methods section (How this extension calculates slope, p. 7), to judge for yourself whether this method is appropriate for your analysis.


3 Calculating Slope in Cardinal Directions: This function will calculate the slopes in any or all of the 8 cardinal directions North, Northeast, East, Southeast, South, Southwest, West and Northwest. Slope values may be calculated in either Degrees or Percent. First select your elevation grid and click the directions to use: button. You will first be asked which cardinal Select as many directions as you want by holding down the [Shift] key, then click OK. Next, specify whether you want slope values in Percent or Degrees, or both: Make your selection, click OK, and the extension will create the specified grids and add them to your view.


4 NOTE: These grids are temporary, so they will be deleted from the hard drive if they are deleted from the view. These grids will become permanent if you save the project, or click Save Dataset or Convert to Grid in the view Theme menu. The extension will also generate a short report describing what it did:

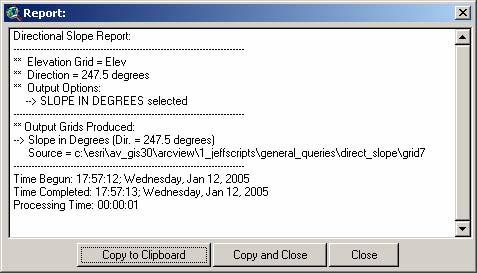
5 Calculating Slope in Any Direction: This function will calculate the slope in a single specified direction and can use any compass bearing. Slope values may be calculated in either Degrees or Percent. First select your elevation grid and click the button. You will be asked what direction to calculate use and whether you want your output in Degrees or Percent: Click OK and the extension will add the grid(s) to your view: NOTE: This grid is temporary, so it will be deleted from the hard drive if it is deleted from the view. The grid will become permanent if you save the project, or click Save Dataset or Convert to Grid in the view Theme menu. The extension will also generate a short report describing what it did:
6

7 How this extension calculates slope: The slope of a cell is generally defined as the absolute value of the slope in the steepest direction. For example, given a simple elevation grid with 9 cells labeled A I, several algorithms are available to calculate the slope of cell E based on some combination of the elevation value in that cell and the 8 adjacent cells. In an early example, Evans (1972) describes and discusses several terrain measures developed by W. R. Tobler, in which the slope (or gradient) is defined as the 1 st derivative of the landscape surface, and calculated as: ( Zi, j+ 1 Zi, j 1) + ( Zi 1, j Zi+ 1, j) 2 2 Gradient = 2d (Evans 1972, p. 52) where Zi, j+ 1 = Cell B Zi, j 1 = Cell H Zi 1, j Zi+ 1, j = Cell D = Cell F d = Cell Size ESRI software uses the algorithm described by Burrough and McDonnell (1998, p ; see also % Slope = ΔZ + ΔZ where ΔZ where ΔZ 2 x 2 y = = 2 2 x y ( A+ 2D+ G) ( C + 2F + I) 8( cell size) ( A+ 2B+ C) ( G+ 2H + I) 8( cell size) In general: Slope in Degrees = Arctan (% Slope) 180 π Kevin Jones provides an excellent discussion and comparison of 8 slope algorithms (Jones 1998), ranking them in order of accuracy when applied to two complex surfaces in which the true slopes are known. The ESRI algorithm, described as Horn s method in Jones paper, ranked 2 nd in accuracy on one surface and 3 rd on another surface.

![For example, it would seem reasonable to use the cell size, slope and aspect of a cell to estimate the surface area in that cell (see Berry [2002] for a good description of this method), but Hodgson](/docs-images/90/102840958/images/8-1.jpg "s findings suggest that alternative methods may be more appropriate (one possibility is described by Jenness [2004]).")
8 Interestingly, Hodgson (1995) describes how most slope and aspect algorithms generate values reflecting an area 1.6 to 2 times the size of the actual cell, which implies that operations that rely on both cell size and slope or aspect may be unduly influenced by adjacent cells. For example, it would seem reasonable to use the cell size, slope and aspect of a cell to estimate the surface area in that cell (see Berry [2002] for a good description of this method), but Hodgson s findings suggest that alternative methods may be more appropriate (one possibility is described by Jenness [2004]). This extension takes a reasonably simple (and possibly simplistic) approach to estimate the slope of a cell in a particular direction. It assumes that the elevation values for all cells are reasonable estimates of the elevation at the centerpoints of the cells. Slopes are calculated from the vertical and horizontal distances between the centerpoint of the focal cell and the centerpoint of the adjacent cell in the direction specified. If the direction is not a cardinal direction, then the slope is calculated from the focal cell centerpoint to an interpolated point between 2 adjacent cell centerpoints. Vertical Distance % Slope = Horizontal Distance 180 Degrees Slope = Arctan(% Slope) π To illustrate this, consider a sample elevation grid. The focal cell and the 8 adjacent cells can be pictured as a set of adjacent columns, each rising to the cell elevation value: We are interested in the elevation value of the focal cell centerpoint, plus the elevation values along the ring connecting the 8 adjacent cell centerpoints. This extension calculates the directional slope of the focal cell by drawing a line out from the focal centerpoint in the specified direction, and intersecting that line with ring illustrated above. If the


9 direction is one of the 8 cardinal directions, then the intersection point is the cell center of the adjacent cell. If the line goes in a direction other than one of the cardinal directions, then we need to interpolate the elevation at the point in which bearing intersects the ring. For example, the bearing 247.5º would intersect the ring somewhere between the cell centerpoints of the cells to the West and Southwest: Using a bit of trigonometry, we can determine that the intersection point is 58.6% of the way along the line connecting the SW centerpoint to the W centerpoint. Therefore, the interpolated elevation at that point would be (0.586 [elevation at W]) + (0.414 [elevation at SW]). Using the sample grid above, the slope calculations would go as follows:
10 Focal Cell Elevation = 165 ( ) ( ) Interpolation Point Elevation =. +. = if Cell Size = 30, then Horizontal Distance = Vertical Distance = = % Slope = = ( ) 180 Degrees Slope = Arctan = π IMPORTANT: One thing to note about this method is that the distance between points changes depending on the direction. At the most extreme, the distance from the focal cell centerpoint to centerpoints in diagonal directions (NE, SE, SW and NW) is times the distance to centerpoints in straight directions (N, E, S, and W). This may have important implications for your analysis because slopes tend to become shallower over larger distances, and therefore slopes to the N, E, S and W will tend to be slightly steeper than slopes to the NE, SE, SW and NW. This method does have the advantage, though, of producing slope estimates based on the least amount of interpolated data. In other words, the best data we have regarding the elevations around a grid cell are the elevation values in the 8 adjacent grid cells, and each of these grid cells should be equally likely to have a correct elevation value. If the elevation value of a grid cell is most likely to be found at the cell centerpoint (which should be the case if all cells are averaged), then the square-shaped ring connecting those 8 cell centerpoints should represent a line of leastinterpolated values, and therefore the most reliable source to calculate slope. Slopes along cardinal directions to the exact cell centerpoints of adjacent cells are not interpolated at all (except to the degree that the original grid was interpolated). If it is important to estimate directional slope in a way that all directions are based on the same horizontal distance, then the best solution would likely be to use the methods described above, except using a circular ring with Radius = Cell Size instead of a square ring. In this case the bearings to the North, South, East and West would be identical to the method described above, but all other elevation points should be interpolated from the 4 closest cells to the interpolation point.
11 References Berry, J. K Use surface area for realistic calculations. Geoworld 15(9):20-1. Burrough, P. A. and R. McDonnell Principals of Geographical Information Systems. Oxford University Press. Evans, I. S Chapter 2 General geomorphometry, derivations of altitude and descriptive statistics. Pages in R. J. Chorley, Editor. Spatial analysis in geomorphology. Harper & Row, Publishers. New York, New York, USA. Hodgson, M. E What cell size does the computed slope/aspect angle represent? Photogrammetric Engineering & Remote Sensing 61: Jenness, J Calculating landscape surface area from digital elevation models. Wildlife Society Bulletin 32(3): Jones, K. H A comparison of two approaches to ranking algorithms used to compute hill slopes. GeoInformatica 1:3, Kluwer Academic Publishers, Boston. Wang, K., and C-P. Lo An assessment of the accuracy of triangulated irregular networks (TINs) and lattices in ARC/INFO. Transactions in GIS 3(2): Troubleshooting If you encounter some strange crash, please click the menu item Check Directional Slope Scripts in either the View or Project Help menu. Click this as soon as you are able to following the crash. With any luck, that function will generate a report with enough information for the author to find and fix the problem. Enjoy! Please contact the author if you have problems or find bugs. Jeff Jenness jeffj@jennessent.com Jenness Enterprises N. Schevene Blvd. (928) Flagstaff, AZ USA Updates to this extension and an on-line version of this manual are available at Please visit Jenness Enterprises ArcView Extensions site for more ArcView Extensions and other software by the author. We also offer customized ArcView-based GIS consultation services to help you meet your specific data analysis and application development needs.
 NAME: Repeating Shapes Aka: repeat_shapes.avx Last modified: October 31, 2005 TOPICS: hexagon, square, triangle, repeat, sample, tessellation, array, matrix, lattice, point, systematic, grid, extent AUTHOR:
Alternate Animal Movement Routes v. 2.1
 Alternate Animal Movement Routes v. 2.1 Aka: altroutes.avx Last modified: April 12, 2005 TOPICS: ArcView 3.x, Animal Movement, Alternate, Route, Path, Proportion, Distance, Bearing, Azimuth, Angle, Point,
New Shapes from Input Table: You can also create a new shapefile using data from an input table. You have three options in this case:
 NAME: Distance/Azimuth Tools v. 1.6 Last modified: February 21, 2005 TOPICS: ArcView 3.x, Distance, Bearing, Azimuth, Angle, Point, Line, Polyline, Polygon, Shape, View, Analysis, Tools, Vertices, Shift
NAME: Repeating Shapes for ArcGIS Installation File: Last modified: TOPICS: AUTHOR: DESCRIPTION: Output:
 NAME: Repeating Shapes for ArcGIS Installation File: repeat_shapes.exe Last modified: November 4, 2012 TOPICS: hexagon, square, triangle, repeat, sample, tessellation, array, matrix, lattice, point, systematic,
 NAME: Center of Mass, v..b Aka: center_of_mass.avx Last modified: September 8, 006 TOPICS: Polygon, Centroid, Center of Mass, Vector, Area AUTHOR: Jeff Jenness Wildlife Biologist, GIS Analyst Email: jeffj@jennessent.com
NAME: Grid Tools (Jenness Enterprises), v Aka: grid_tools_jen.avx. Last modified: July 9, 2006
, v Aka: grid_tools_jen.avx. Last modified: July 9, 2006") NAME: Grid Tools (Jenness Enterprises), v. 1.7 Aka: grid_tools_jen.avx Last modified: July 9, 2006 TOPICS: statistics, neighborhood, legend, clip, merge, mosaic, combine, ramp, rainbow, color, GTheme,
NAME: Grid Tools (Jenness Enterprises), v. 1.7 Aka: grid_tools_jen.avx Last modified: July 9, 2006 TOPICS: statistics, neighborhood, legend, clip, merge, mosaic, combine, ramp, rainbow, color, GTheme,
Copyright The McGraw-Hill Companies, Inc. Permission required for reproduction or display.
 Chapter 13. TERRAIN MAPPING AND ANALYSIS 13.1 Data for Terrain Mapping and Analysis 13.1.1 DEM 13.1.2 TIN Box 13.1 Terrain Data Format 13.2 Terrain Mapping 13.2.1 Contouring 13.2.2 Vertical Profiling 13.2.3
Terrain Modeling with ArcView GIS from ArcUser magazine
 Lesson 7: Rotating Point Symbols Lesson Goal: Correctly orient geologic symbols by joining adjusted Azimuth and Bearing data to point data. What You Will Need: A Pentium class PC with 32 MB of RAM (minimum)
START>PROGRAMS>ARCGIS>
 Department of Urban Studies and Planning Spring 2006 Department of Architecture Site and Urban Systems Planning 11.304J / 4.255J GIS EXERCISE 2 Objectives: To generate the following maps using ArcGIS Software:
GIS OPERATION MANUAL
 GIS OPERATION MANUAL 1. Computer System Description Hardware Make Compaq Presario 5004 CPU AMD Athlon 1.1 Ghz Main Memory 640MB CD-ROM 52 X CD-RW 8 X HD 57GB Monitor 19 inch Video Adapter 16 Mb Nvidia
Lecture 9. Raster Data Analysis. Tomislav Sapic GIS Technologist Faculty of Natural Resources Management Lakehead University
 Lecture 9 Raster Data Analysis Tomislav Sapic GIS Technologist Faculty of Natural Resources Management Lakehead University Raster Data Model The GIS raster data model represents datasets in which square
Contents of Lecture. Surface (Terrain) Data Models. Terrain Surface Representation. Sampling in Surface Model DEM
 Data Models. Terrain Surface Representation. Sampling in Surface Model DEM") Lecture 13: Advanced Data Models: Terrain mapping and Analysis Contents of Lecture Surface Data Models DEM GRID Model TIN Model Visibility Analysis Geography 373 Spring, 2006 Changjoo Kim 11/29/2006 1
Lecture 13: Advanced Data Models: Terrain mapping and Analysis Contents of Lecture Surface Data Models DEM GRID Model TIN Model Visibility Analysis Geography 373 Spring, 2006 Changjoo Kim 11/29/2006 1
1.1. Driving Around Euclid. Goals. Launch 1.1
 1.1 Driving Around Euclid Goals Review the coordinate system Explore distances on a coordinate grid In this problem, students review the concept of the coordinate grid and are introduced to the idea of
Geographic Surfaces. David Tenenbaum EEOS 383 UMass Boston
 Geographic Surfaces Up to this point, we have talked about spatial data models that operate in two dimensions How about the rd dimension? Surface the continuous variation in space of a third dimension
Math For Surveyors. James A. Coan Sr. PLS
 Math For Surveyors James A. Coan Sr. PLS Topics Covered 1) The Right Triangle 2) Oblique Triangles 3) Azimuths, Angles, & Bearings 4) Coordinate geometry (COGO) 5) Law of Sines 6) Bearing, Bearing Intersections
GIS LAB 8. Raster Data Applications Watershed Delineation
 GIS LAB 8 Raster Data Applications Watershed Delineation This lab will require you to further your familiarity with raster data structures and the Spatial Analyst. The data for this lab are drawn from
The Drunken Sailor s Challenge
 The Drunken Sailor s Challenge CS7001 mini-project by Arya Irani with Tucker Balch September 29, 2003 Introduction The idea [1] is to design an agent to navigate a two-dimensional field of obstacles given
Vector Data Analysis Working with Topographic Data. Vector data analysis working with topographic data.
 Vector Data Analysis Working with Topographic Data Vector data analysis working with topographic data. 1 Triangulated Irregular Network Triangulated Irregular Network 2 Triangulated Irregular Networks
Applied Cartography and Introduction to GIS GEOG 2017 EL. Lecture-7 Chapters 13 and 14
 Applied Cartography and Introduction to GIS GEOG 2017 EL Lecture-7 Chapters 13 and 14 Data for Terrain Mapping and Analysis DEM (digital elevation model) and TIN (triangulated irregular network) are two
GEON Points2Grid Utility Instructions By: Christopher Crosby OpenTopography Facility, San Diego Supercomputer Center
 GEON Points2Grid Utility Instructions By: Christopher Crosby (ccrosby@sdsc.edu) OpenTopography Facility, San Diego Supercomputer Center (Formerly: GEON / Active Tectonics Research Group School of Earth
Using LiDAR (Light Distancing And Ranging) data to more accurately describe avalanche terrain
 data to more accurately describe avalanche terrain") International Snow Science Workshop, Davos 009, Proceedings Using LiDAR (Light Distancing And Ranging) data to more accurately describe avalanche terrain Christopher M. McCollister, and Robert H. Comey,
International Snow Science Workshop, Davos 009, Proceedings Using LiDAR (Light Distancing And Ranging) data to more accurately describe avalanche terrain Christopher M. McCollister, and Robert H. Comey,
Polar Plots and Circular Statistics
 Polar Plots and Circular Statistics Last updated 23 June 2014 Jeff Jenness About the Author Jeff Jenness is an independent GIS consultant specializing in developing analytical applications for a wide variety
1. Which diagram best represents the location of the isolines for the elevation field of this landscape? (1) (2) (3) (4)
 (2) (3) (4)") Base your answers to questions 1 through 5 on your knowledge of earth science and on the diagram below which represents the elevation data for a certain landscape region. Points A, B, C, and D are specific
Base your answers to questions 1 through 5 on your knowledge of earth science and on the diagram below which represents the elevation data for a certain landscape region. Points A, B, C, and D are specific
Gaston County GIS. Interactive Mapping Website
 Gaston County GIS Interactive Mapping Website The Gaston County GIS mapping website optimizes the available window viewing area and has interactive tools, collapsible menus and movable windows. This map
Mapping Distance and Density
 Mapping Distance and Density Distance functions allow you to determine the nearest location of something or the least-cost path to a particular destination. Density functions, on the other hand, allow
Lab 12: Sampling and Interpolation
 Lab 12: Sampling and Interpolation What You ll Learn: -Systematic and random sampling -Majority filtering -Stratified sampling -A few basic interpolation methods Data for the exercise are in the L12 subdirectory.
Lab 12: Sampling and Interpolation
 Lab 12: Sampling and Interpolation What You ll Learn: -Systematic and random sampling -Majority filtering -Stratified sampling -A few basic interpolation methods Videos that show how to copy/paste data
Terrain Modeling with ArcView GIS from ArcUser magazine
 Lesson 6: DEM-Based Terrain Modeling Lesson Goal: Lean how to output a grid theme that can be used to generate a thematic two-dimensional map, compute an attractive hillshaded map, and create a contour
B A
 GIS in Water Resources Exercise #3 Solution Part 1. Slope Calculations 1.1 Hand Calculation (Point A only): (i) ESRI Slope Cell Referencing 45.4 46.1 47 48.6 47.7 45 46.1 46.4 B 47.9 47.4 45.1 45.8 46.8
A stratum is a pair of surfaces. When defining a stratum, you are prompted to select Surface1 and Surface2.
 That CAD Girl J ennifer dib ona Website: www.thatcadgirl.com Email: thatcadgirl@aol.com Phone: (919) 417-8351 Fax: (919) 573-0351 Volume Calculations Initial Setup You must be attached to the correct Land
Machine Evolution. Machine Evolution. Let s look at. Machine Evolution. Machine Evolution. Machine Evolution. Machine Evolution
 Let s look at As you will see later in this course, neural networks can learn, that is, adapt to given constraints. For example, NNs can approximate a given function. In biology, such learning corresponds
Georeferencing & Spatial Adjustment
 Georeferencing & Spatial Adjustment Aligning Raster and Vector Data to the Real World Rotation Differential Scaling Distortion Skew Translation 1 The Problem How are geographically unregistered data, either
PROFILE EXTRACTOR 6.0 USER GUIDE Extracts a cross section profile from TIN or GRID theme.
 PROFILE EXTRACTOR 6.0 USER GUIDE Extracts a cross section profile from TIN or GRID theme. INDEX: SYSTEM REQUIREMENTS INSTALLATION SET-UP MAIN DIALOG 1. GRID PANEL 2. SETTINGS PANEL 3. EXTRACT FROM PANEL
RASTER ANALYSIS S H A W N L. P E N M A N E A R T H D A T A A N A LY S I S C E N T E R U N I V E R S I T Y O F N E W M E X I C O
 RASTER ANALYSIS S H A W N L. P E N M A N E A R T H D A T A A N A LY S I S C E N T E R U N I V E R S I T Y O F N E W M E X I C O TOPICS COVERED Spatial Analyst basics Raster / Vector conversion Raster data
Map Library ArcView Version 1 02/20/03 Page 1 of 12. ArcView GIS
 Map Library ArcView Version 1 02/20/03 Page 1 of 12 1. Introduction 1 ArcView GIS ArcView is the most popular desktop GIS analysis and map presentation software package.. With ArcView GIS you can create
Civil 3D Introduction
 Civil 3D Introduction Points Overview Points are data collected by surveyors which represent existing site conditions (elevations, boundaries, utilities, etc.). Each point is numbered (or named) and has
Dijkstra's Algorithm
 Shortest Path Algorithm Dijkstra's Algorithm To find the shortest path from the origin node to the destination node No matrix calculation Floyd s Algorithm To find all the shortest paths from the nodes
Basic Tasks in ArcGIS 10.3.x
 Basic Tasks in ArcGIS 10.3.x This guide provides instructions for performing a few basic tasks in ArcGIS 10.3.1, such as adding data to a map document, viewing and changing coordinate system information,
Hexagonal Lattice Systems Based on Rotationally Invariant Constraints
 Hexagonal Lattice Systems Based on Rotationally Invariant Constraints Leah A. Chrestien St. Stephen s College University Enclave, North Campus Delhi 110007, India In this paper, periodic and aperiodic
Digital Elevation Model & Surface Analysis
 Topics: Digital Elevation Model & Surface Analysis 1. Introduction 2. Create raster DEM 3. Examine Lidar DEM 4. Deriving secondary surface products 5. Mapping contours 6. Viewshed Analysis 7. Extract elevation
Geographic Information Technology Training Alliance (GITTA) presents: Terrain Analysis
 presents: Terrain Analysis") Geographic Information Technology Training Alliance (GITTA) presents: Responsible persons: Friedjoff Trautwein, Helmut Flitter, Marco Hugentobler, Patrick Lüscher, Philipp Weckenbrock, Robert Weibel, Suzette
Geographic Information Technology Training Alliance (GITTA) presents: Responsible persons: Friedjoff Trautwein, Helmut Flitter, Marco Hugentobler, Patrick Lüscher, Philipp Weckenbrock, Robert Weibel, Suzette
METIER Course n februray Introduction to ArcView 3
 METIER Course n 2 Information Management in Environmental Sciences 19-23 februray 2007 Introduction to ArcView 3 tél : (33) 04 67 54 87 54 Maison de la Télédétection en Languedoc-Roussillon fax : (33)
Distance in mm from nearest latitude line to location x 150 = seconds of latitude Distance in mm between latitude 2.5 tick marks (along the sides)
") LATITUDE FORMULA FOR 1:24000 SCALE WITH 2.5 TICK MARKS Distance in mm from nearest latitude line to location x 150 = seconds of latitude Distance in mm between latitude 2.5 tick marks (along the sides)
LATITUDE FORMULA FOR 1:24000 SCALE WITH 2.5 TICK MARKS Distance in mm from nearest latitude line to location x 150 = seconds of latitude Distance in mm between latitude 2.5 tick marks (along the sides)
ArcView QuickStart Guide. Contents. The ArcView Screen. Elements of an ArcView Project. Creating an ArcView Project. Adding Themes to Views
 ArcView QuickStart Guide Page 1 ArcView QuickStart Guide Contents The ArcView Screen Elements of an ArcView Project Creating an ArcView Project Adding Themes to Views Zoom and Pan Tools Querying Themes
Cell based GIS. Introduction to rasters
 Week 9 Cell based GIS Introduction to rasters topics of the week Spatial Problems Modeling Raster basics Application functions Analysis environment, the mask Application functions Spatial Analyst in ArcGIS
Computation of Slope
 Computation of Slope Prepared by David R. Maidment and David Tarboton GIS in Water Resources Class University of Texas at Austin September 2011, Revised December 2011 There are various ways in which slope
Georeferencing & Spatial Adjustment 2/13/2018
 Georeferencing & Spatial Adjustment The Problem Aligning Raster and Vector Data to the Real World How are geographically unregistered data, either raster or vector, made to align with data that exist in
Tutorial 18: 3D and Spatial Analyst - Creating a TIN and Visual Analysis
 Tutorial 18: 3D and Spatial Analyst - Creating a TIN and Visual Analysis Module content 18.1. Creating a TIN 18.2. Spatial Analyst Viewsheds, Slopes, Hillshades and Density. 18.1 Creating a TIN Sometimes
GEOGRAPHIC INFORMATION SYSTEMS Lecture 25: 3D Analyst
 GEOGRAPHIC INFORMATION SYSTEMS Lecture 25: 3D Analyst 3D Analyst - 3D Analyst is an ArcGIS extension designed to work with TIN data (triangulated irregular network) - many of the tools in 3D Analyst also
Angle, symmetry and transformation
 Terms Illustrations Definition Acute angle An angle greater than 0 and less than 90. Alternate angles Where two straight lines are cut by a third, as in the diagrams, the angles d and f (also c and e)
Distance in mm from nearest latitude line to location x 150 = seconds of latitude Distance in mm between latitude 2.5 tick marks (along the sides)
") LATITUDE FORMULA FOR 1:24000 SCALE WITH 2.5 TICK MARKS Distance in mm from nearest latitude line to location x 150 = seconds of latitude Distance in mm between latitude 2.5 tick marks (along the sides)
LATITUDE FORMULA FOR 1:24000 SCALE WITH 2.5 TICK MARKS Distance in mm from nearest latitude line to location x 150 = seconds of latitude Distance in mm between latitude 2.5 tick marks (along the sides)
I CALCULATIONS WITHIN AN ATTRIBUTE TABLE
 Geology & Geophysics REU GPS/GIS 1-day workshop handout #4: Working with data in ArcGIS You will create a raster DEM by interpolating contour data, create a shaded relief image, and pull data out of the
COMPARISON OF TWO METHODS FOR DERIVING SKELETON LINES OF TERRAIN
 COMPARISON OF TWO METHODS FOR DERIVING SKELETON LINES OF TERRAIN T. Gökgöz, F. Gülgen Yildiz Technical University, Dept. of Geodesy and Photogrammetry Engineering, 34349 Besiktas Istanbul, Turkey (gokgoz,
The Problem. Georeferencing & Spatial Adjustment. Nature of the problem: For Example: Georeferencing & Spatial Adjustment 2/4/2014
 Georeferencing & Spatial Adjustment Aligning Raster and Vector Data to a GIS The Problem How are geographically unregistered data, either raster or vector, made to align with data that exist in geographical
Lab 10: Raster Analyses
 Lab 10: Raster Analyses What You ll Learn: Spatial analysis and modeling with raster data. You will estimate the access costs for all points on a landscape, based on slope and distance to roads. You ll
The Problem. Georeferencing & Spatial Adjustment. Nature Of The Problem: For Example: Georeferencing & Spatial Adjustment 9/20/2016
 Georeferencing & Spatial Adjustment Aligning Raster and Vector Data to the Real World The Problem How are geographically unregistered data, either raster or vector, made to align with data that exist in
Mapping 2001 Census Data Using ArcView 3.3
 Mapping 2001 Census Data Using ArcView 3.3 These procedures outline: 1. Mapping a theme (making a map) 2. Preparing the layout for printing and exporting the map into various file formats. In order to
Subject: Computer Applications Grade: 9th Mr. Holmes Unit Lesson Layer Duration MS Excel Chapter: 7 - Creating a Chart in Excel
 Subject: Computer Applications Grade: 9th Mr. Holmes Unit Lesson Layer Duration MS Excel Chapter: 7 - Creating a Chart in Excel Applied (do) 3/11/13 3/2/13 Essential Questions What do you think about,
Understanding Topographic Maps
 Understanding Topographic Maps 1. Every point on a contour line represents the exact same elevation (remember the glass inserted into the mountain). As a result of this every contour line must eventually
COPYRIGHTED MATERIAL. Introduction to 3D Data: Modeling with ArcGIS 3D Analyst and Google Earth CHAPTER 1
 CHAPTER 1 Introduction to 3D Data: Modeling with ArcGIS 3D Analyst and Google Earth Introduction to 3D Data is a self - study tutorial workbook that teaches you how to create data and maps with ESRI s
Digitizing and Editing Polygons in the STS Gypsy Moth Project. M. Dodd 2/10/04
 Digitizing and Editing Polygons in the STS Gypsy Moth Project M. Dodd 2/10/04 Digitizing and Editing Polygons in the STS Gypsy Moth Project OVERVIEW OF DIGITIZING IN STS 3 THE DIGITIZING WINDOW 4 DIGITIZING
Surface Analysis. Data for Surface Analysis. What are Surfaces 4/22/2010
 Surface Analysis Cornell University Data for Surface Analysis Vector Triangulated Irregular Networks (TIN) a surface layer where space is partitioned into a set of non-overlapping triangles Attribute and
LAB #7 Creating TIN and 3D scenes (ArcScene) GISC, UNIVERSITY OF CALIFORNIA BERKELEY
 GISC, UNIVERSITY OF CALIFORNIA BERKELEY") LAB #7 Creating TIN and 3D scenes (ArcScene) GISC, UNIVERSITY OF CALIFORNIA BERKELEY The purpose of this laboratory is to introduce and explore surface data analysis using a vector data model: TIN. We
LAB #7 Creating TIN and 3D scenes (ArcScene) GISC, UNIVERSITY OF CALIFORNIA BERKELEY The purpose of this laboratory is to introduce and explore surface data analysis using a vector data model: TIN. We
Draw Me a Picture: Creating Advanced Shapes
 Draw Me a Picture: Creating Advanced Shapes Insert WordArt After adding lines and shapes to your workbook, you may find that your spreadsheet needs to be more dynamic. You could then add visual emphasis
Computer Database Structure for Managing Data :-
 The Map as an Abstraction of Space :- We begin the process of abstraction by conceptualizing what we encounter as a group of points, lines, areas and surfaces. We make decision about which object to take
Lab 11: Terrain Analyses
 Lab 11: Terrain Analyses What You ll Learn: Basic terrain analysis functions, including watershed, viewshed, and profile processing. There is a mix of old and new functions used in this lab. We ll explain
Using GIS to Site Minimal Excavation Helicopter Landings
 Using GIS to Site Minimal Excavation Helicopter Landings The objective of this analysis is to develop a suitability map for aid in locating helicopter landings in mountainous terrain. The tutorial uses
GY301 Geomorphology Lab 5 Topographic Map: Final GIS Map Construction
 GY301 Geomorphology Lab 5 Topographic Map: Final GIS Map Construction Introduction This document describes how to take the data collected with the total station for the campus topographic map project and
Tutorial: Using SAGA for Least Cost Path Analysis
 Tutorial: Using SAGA for Least Cost Path Analysis Developed by Kim Cimmery (Kapcimmery at hot mail dot com) March 2013 1. Introduction The shortest path between two points is a straight line (unless you
The GIS Spatial Data Model
 The GIS Spatial Data Model Introduction: Spatial data are what drive a GIS. Every piece of functionality that makes a GIS separate from another analytical environment is rooted in the spatially explicit
Field-Scale Watershed Analysis
 Conservation Applications of LiDAR Field-Scale Watershed Analysis A Supplemental Exercise for the Hydrologic Applications Module Andy Jenks, University of Minnesota Department of Forest Resources 2013
Creating a Text Frame. Create a Table and Type Text. Pointer Tool Text Tool Table Tool Word Art Tool
 Pointer Tool Text Tool Table Tool Word Art Tool Picture Tool Clipart Tool Creating a Text Frame Select the Text Tool with the Pointer Tool. Position the mouse pointer where you want one corner of the text
Whole Numbers. Integers and Temperature
 Whole Numbers Know the meaning of count and be able to count Know that a whole number is a normal counting number such as 0, 1, 2, 3, 4, Know the meanings of even number and odd number Know that approximating
Pond Distance and Habitat for use in Wildlife Modeling
 Pond Distance and Habitat for use in Wildlife Modeling These instructions enable you to aggregate layers within a study area, calculate new fields, and create new data out of existing data, for use in
BASIC MATHEMATICS FOR CADASTRAL MAPPING
 BASIC MATHEMATICS FOR CADASTRAL MAPPING Chapter 5 2015 Cadastral Mapping Manual 5-1 Introduction Data which a mapper must use to solve problems comes from a myriad of sources both new and old. The general
Class #2. Data Models: maps as models of reality, geographical and attribute measurement & vector and raster (and other) data structures
 data structures") Class #2 Data Models: maps as models of reality, geographical and attribute measurement & vector and raster (and other) data structures Role of a Data Model Levels of Data Model Abstraction GIS as Digital
Class #2 Data Models: maps as models of reality, geographical and attribute measurement & vector and raster (and other) data structures Role of a Data Model Levels of Data Model Abstraction GIS as Digital
I. Project Title Light Detection and Ranging (LIDAR) Processing
 Processing") I. Project Title Light Detection and Ranging (LIDAR) Processing II. Lead Investigator Ryan P. Lanclos Research Specialist 107 Stewart Hall Department of Geography University of Missouri Columbia Columbia,
I. Project Title Light Detection and Ranging (LIDAR) Processing II. Lead Investigator Ryan P. Lanclos Research Specialist 107 Stewart Hall Department of Geography University of Missouri Columbia Columbia,
Measuring the Performance of Algorithms for Generating Ground Slope
 This file was created by scanning the printed publication. Errors identified by the software have been corrected; however, some errors may remain. Measuring the Performance of Algorithms for Generating
Introduction to GIS 2011
 Introduction to GIS 2011 Digital Elevation Models CREATING A TIN SURFACE FROM CONTOUR LINES 1. Start ArcCatalog from either Desktop or Start Menu. 2. In ArcCatalog, create a new folder dem under your c:\introgis_2011
Descriptive Geometry. Lines in Descriptive Geometry
 48-175 Descriptive Geometry Lines in Descriptive Geometry recap-depicting lines 2 taking an auxiliary view of a line 3 Given a segment in two adjacent views, t and f, and the view of a point, X, on the
MODULE 1 BASIC LIDAR TECHNIQUES
 MODULE SCENARIO One of the first tasks a geographic information systems (GIS) department using lidar data should perform is to check the quality of the data delivered by the data provider. The department
Roadway Alignments and Profiles
 NOTES Module 15 Roadway Alignments and Profiles In this module, you learn how to create horizontal alignments, surface profiles, layout (design) profiles, and profile views in AutoCAD Civil 3D. This module
ACS-1805 Introduction to Programming (with App Inventor)
") ACS-1805 Introduction to Programming (with App Inventor) Chapter 8 Creating Animated Apps 10/25/2018 1 What We Will Learn The methods for creating apps with simple animations objects that move Including
ACS-1805 Introduction to Programming (with App Inventor) Chapter 8 Creating Animated Apps 10/25/2018 1 What We Will Learn The methods for creating apps with simple animations objects that move Including
Final project: Lecture 21 - Chapter 8 (Raster Analysis, part2) GEOL 452/552 - GIS for Geoscientists I
 GEOL 452/552 - GIS for Geoscientists I") GEOL 452/552 - GIS for Geoscientists I Lecture 21 - Chapter 8 (Raster Analysis, part2) Talk about class project (copy follow_along_data\ch8a_class_ex into U:\ArcGIS\ if needed) Catch up with lecture 20
GEOL 452/552 - GIS for Geoscientists I Lecture 21 - Chapter 8 (Raster Analysis, part2) Talk about class project (copy follow_along_data\ch8a_class_ex into U:\ArcGIS\ if needed) Catch up with lecture 20
Geographic Information Systems (GIS) Spatial Analyst [10] Dr. Mohammad N. Almasri. [10] Spring 2018 GIS Dr. Mohammad N. Almasri Spatial Analyst
![Geographic Information Systems (GIS) Spatial Analyst [10] Dr. Mohammad N. Almasri. [10] Spring 2018 GIS Dr. Mohammad N. Almasri Spatial Analyst](/thumbs/80/81171101.jpg "Geographic Information Systems (GIS) Spatial Analyst [10] Dr. Mohammad N. Almasri. [10] Spring 2018 GIS Dr. Mohammad N. Almasri Spatial Analyst") Geographic Information Systems (GIS) Spatial Analyst [10] Dr. Mohammad N. Almasri 1 Preface POINTS, LINES, and POLYGONS are good at representing geographic objects with distinct shapes They are less good
Geographic Information Systems (GIS) Spatial Analyst [10] Dr. Mohammad N. Almasri 1 Preface POINTS, LINES, and POLYGONS are good at representing geographic objects with distinct shapes They are less good
3.1 Units. Angle Unit. Direction Reference
 Various settings allow the user to configure the software to function to his/her preference. It is important to review all the settings prior to using the software to ensure they are set to produce the
Measuring the Lengths of Receiving Polygon Edges
 Measuring the Lengths of Receiving Polygon Edges These instructions enable you to create shapefiles that represent the edge along a receiving polygon that may then be used in the analysis of potential
TPC Desktop Series. Traverses Learning Guide 1/18
 TPC Desktop Series Traverses Learning Guide 1/18 NOTICE The information in this document is subject to change without notice. TRAVERSE PC. Inc. assumes no responsibility for any errors that may appear
Watershed Sciences 4930 & 6920 GEOGRAPHIC INFORMATION SYSTEMS
 HOUSEKEEPING Watershed Sciences 4930 & 6920 GEOGRAPHIC INFORMATION SYSTEMS CONTOURS! Self-Paced Lab Due Friday! WEEK SIX Lecture RASTER ANALYSES Joe Wheaton YOUR EXCERCISE Integer Elevations Rounded up
HEC-RAS 3.0 January, 2001 Release Notes
 HEC-RAS 3.0 January, 2001 Release Notes A new version of HEC-RAS (3.0) has been released with significant new features over the previous version (2.21). Version 3.0 includes unsteady flow routing capabilities,
Neighbourhood Operations Specific Theory
 Neighbourhood Operations Specific Theory Neighbourhood operations are a method of analysing data in a GIS environment. They are especially important when a situation requires the analysis of relationships
4. If you are prompted to enable hardware acceleration to improve performance, click
 Exercise 1a: Creating new points ArcGIS 10 Complexity: Beginner Data Requirement: ArcGIS Tutorial Data Setup About creating new points In this exercise, you will use an aerial photograph to create a new
APPENDIX E2. Vernal Pool Watershed Mapping
 APPENDIX E2 Vernal Pool Watershed Mapping MEMORANDUM To: U.S. Fish and Wildlife Service From: Tyler Friesen, Dudek Subject: SSHCP Vernal Pool Watershed Analysis Using LIDAR Data Date: February 6, 2014
INTRODUCTION TO GIS WORKSHOP EXERCISE
 111 Mulford Hall, College of Natural Resources, UC Berkeley (510) 643-4539 INTRODUCTION TO GIS WORKSHOP EXERCISE This exercise is a survey of some GIS and spatial analysis tools for ecological and natural
Initial Analysis of Natural and Anthropogenic Adjustments in the Lower Mississippi River since 1880
 Richard Knox CE 394K Fall 2011 Initial Analysis of Natural and Anthropogenic Adjustments in the Lower Mississippi River since 1880 Objective: The objective of this term project is to use ArcGIS to evaluate
GISC9312- Geospatial Visualization
 GISC9312- Geospatial Visualization Assignment#D1 Ibeabuchi Nkemakolam April 17, 2013 Janet Finlay BA,.BSc. GIS-GM Program Professor Niagara College 135 Taylor Road Niagara-On-The-Lake, ON L0S 1J0 Dear
Topic 5: Raster and Vector Data Models
 Geography 38/42:286 GIS 1 Topic 5: Raster and Vector Data Models Chapters 3 & 4: Chang (Chapter 4: DeMers) 1 The Nature of Geographic Data Most features or phenomena occur as either: discrete entities
IMPROVING THE ACCURACY OF DIGITAL TERRAIN MODELS
 STUDIA UNIV. BABEŞ BOLYAI, INFORMATICA, Volume XLV, Number 1, 2000 IMPROVING THE ACCURACY OF DIGITAL TERRAIN MODELS GABRIELA DROJ Abstract. The change from paper maps to GIS, in various kinds of geographical
Terrain Analysis. Using QGIS and SAGA
 Terrain Analysis Using QGIS and SAGA Tutorial ID: IGET_RS_010 This tutorial has been developed by BVIEER as part of the IGET web portal intended to provide easy access to geospatial education. This tutorial
Welcome to NR402 GIS Applications in Natural Resources. This course consists of 9 lessons, including Power point presentations, demonstrations,
 Welcome to NR402 GIS Applications in Natural Resources. This course consists of 9 lessons, including Power point presentations, demonstrations, readings, and hands on GIS lab exercises. Following the last