Example of one enclave in the field. strike. Right hand rule convention of orientation. pitch or rake. dip
|
|
|
- Gillian Osborne
- 5 years ago
- Views:
Transcription


1 Example of one enclave in the field strike Right hand rule convention of orientation pitch or rake dip Example of a thin section of rock Example of an upside down thin section of rock

2 Orientation of the 3 faces of a block sample from the orientation of its (xy )face
 With orientation of the top")
3 Cutting sections in a core A) With orientation of the dip B) With orientation of the top arrow


4 164 W 18 = 164 / 18 dip at SW 76 = 122 / 76 dip at + 90 Conversion to the right hand rule

5 Open image Zoom backward Click on this button to select the scale bar on the image


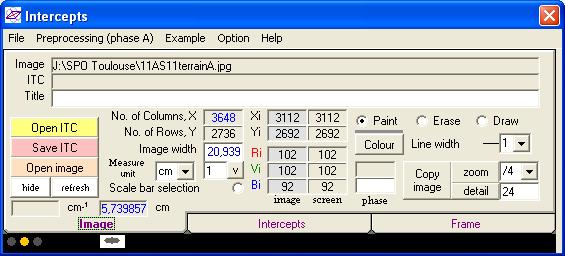
6 It calculates the image width

7 Click again on the button to select the scale bar on the image X is now N 89 and Y is at in the image N E X is N89 [k] Y is N89+90 [j]


8 Use frame to resize the image

9 Activate the calculation in grey levels Click on H button to visualize the histogram Select the number of sub-windows Columns X / 4 First sub-window Rows Y / 2 Second sub-window


10 Selection of the grey level detection of intercept : 50 A difference between two pixels greater or equal to 50 grey levels is a boundary Display the results with Fourier series analysis Option visualizing the intercept detection Like for example with intercepts in and out in green and red Fast calculation by inertia tensor method
 recording; with image scale Selection of the number of harmonics used to rebuilt")
11 Draw the intercept boundaries on the top of the image; alone (V); delete them (X) There is only one phase when processing the data in grey levels Rose diagram selection with display options Draw the roses on the image; with phases in grey; on the top of intercept boundaries; on a white background with metafile (wmf) recording; with image scale Selection of the number of harmonics used to rebuilt the rose diagrams 6 means that we sum all data from 0 to 6 and 8 to 20 are a blank noise Fourier power spectrum For each sub-window For all the image Anisotropy Full shape ratio using power spectrum from 0 to 6 Angle calculated from the X orientation of the image for exportation to Ellipsoid.exe Size adjustment assuming that objects are ellipses (not appropriate for rectangular objects)
; delete them (X); with classes colour; with classes in grey Image orientation X Click with left button to display the")
12 Mean length intercept rose diagram or rose of traverses For exportation of the data to Elliposid.exe Results Draw the intercept boundaries on the top of the image; alone (V); delete them (X); with classes colour; with classes in grey Image orientation X Click with left button to display the following buttons For all the image Y For each sub-window Scale Metafile are compatible with Illustrator, Coreldraw,


13 Intercepts map Roses on image Display with a line width of 4 pixels to be visible on a zoom / 4


14 Click on >>Ellipsoid Data format selection Start by the image orientation Group of images to be combined in ellipsoid Use it to visualize each subwindow in the image Click on tab to open the table of output; Tranfert to transfert the data; Copy to copy the data Cd copy also sub-window positions for other purposes Coordinates of the sub-windows not used in Ellipsoid You may add a caption that will be printed between the sub-window number and the code of image group Click on S% to weight each data to its surface area %
15 Save your work with all the orientations and the image compressed in packbit with 8 bits per pixel (grey level or phase color code) Then open Elliposoid.exe Table for input data Table of 2D ellipse compatibility with 3D ellipsoid Table of comparison between shape ratio r and orientation rake of input data and output results for each image section (number, azimuth, plunge) Results 1 with scale factors; 2 without scale factors; 3 with simple averaging on perpendicular sections. e is an error estimate given by the vector linking input and output long axes

16 Click on Copy (Intercepts) Immediately after the Copy in Intercepts, click on Paste for the first image Then click on Add for the following images


17 N.L*M.L : normalized length (in arbitrary unit) times mean length (in metric unit) Click on Ellipsoid to display the first result and save it before selecting any option


18 Mean length given by the input data /mean L by avoiding overflow facilitate the calculation of eigenvalues The density calculation may be time consuming To export the plot in a metafile

19 Click on this row to display the data of this section in the graphic Order number; azimuth, pitch, shape ratio (ellipse pitch, shape ratio) F ½ : compatibility index between all 2D ellipsoidal sections and the 3D ellipsoid Mean F ½ : compatibility index between 2D ellipsoidal sections and the 576 intermediate 3D ellipsoid Input data long axis Long axis found on the section of the ellipsoid (F ½ =2.4% and e=2.3%) Check the consistency between the full ellipsoid and the mean ellipsoid of the 576 combinations of sub-windows.
20 Be careful when using scale factor! A strong F ½ indicates that sizes may be wrong (not consistent between images) Consistent P parameters Not consistent P parameters The full ellipsoid P is not in the center of the could of subdata


21 The sizes of the long and short axes of the B section have been multiplied by 10 to show that calculation with a wrong scale factor may give false results whereas calculation without scale factor remains correct. The gathering of directions along A, B and C is due to an intersection effect which force those directions to rotate toward the image plans or their poles. Such error can be detected by anomalous standard deviations, hyperboloids or strong F ½ (25% and mean at 37% here).
Insight: Measurement Tool. User Guide
 OMERO Beta v2.2: Measurement Tool User Guide - 1 - October 2007 Insight: Measurement Tool User Guide Open Microscopy Environment: http://www.openmicroscopy.org OMERO Beta v2.2: Measurement Tool User Guide
Introduction to Google SketchUp
 Introduction to Google SketchUp When initially opening SketchUp, it will be useful to select the Google Earth Modelling Meters option from the initial menu. If this menu doesn t appear, the same option
ORIENTATIONS OF LINES AND PLANES IN SPACE
 GG303 Lab 1 8/21/09 1 ORIENTATIONS OF LINES AND PLANES IN SPACE I Main Topics A Definitions of points, lines, and planes B Geologic methods for describing lines and planes C Attitude symbols for geologic
ArtemiS SUITE diagram
 Intuitive, interactive graphical display of two- or three-dimensional data sets HEARING IS A FASCINATING SENSATION ArtemiS SUITE Motivation The diagram displays your analysis results in the form of graphical
Fundamentals of Structural Geology Exercise: concepts from chapter 2
 0B Reading: Fundamentals of Structural Geology, Ch 2 1) Develop a MATLAB script that plots the spherical datum (Fig. 2.1a) with unit radius as a wire-frame diagram using lines of constant latitude and
Chapter 1. Linear Equations and Straight Lines. 2 of 71. Copyright 2014, 2010, 2007 Pearson Education, Inc.
 Chapter 1 Linear Equations and Straight Lines 2 of 71 Outline 1.1 Coordinate Systems and Graphs 1.4 The Slope of a Straight Line 1.3 The Intersection Point of a Pair of Lines 1.2 Linear Inequalities 1.5
8. SPHERICAL PROJECTIONS (I)
") I Main Topics A What is a spherical projecgon? B Equal- angle (stereographic) projecgon of a line C Equal- angle (stereographic) projecgon of a plane D IntersecGon of two planes 9/14/16 GG303 1 Focal Mechanism,
I Main Topics A What is a spherical projecgon? B Equal- angle (stereographic) projecgon of a line C Equal- angle (stereographic) projecgon of a plane D IntersecGon of two planes 9/14/16 GG303 1 Focal Mechanism,
CSTools Guide (for ArcGIS version 10.2 and 10.3)
") CSTools Guide (for ArcGIS version 10.2 and 10.3) 1. Why to use Orientation Analysis and Cross section tools (CSTools) in ArcGIS? 2 2. Data format 2 2.1 Coordinate Systems 2 3. How to get the tools into
CSTools Guide (for ArcGIS version 10.2 and 10.3) 1. Why to use Orientation Analysis and Cross section tools (CSTools) in ArcGIS? 2 2. Data format 2 2.1 Coordinate Systems 2 3. How to get the tools into
JASCO CANVAS PROGRAM OPERATION MANUAL
 JASCO CANVAS PROGRAM OPERATION MANUAL P/N: 0302-1840A April 1999 Contents 1. What is JASCO Canvas?...1 1.1 Features...1 1.2 About this Manual...1 2. Installation...1 3. Operating Procedure - Tutorial...2
Mathematics (www.tiwariacademy.com)
") () Miscellaneous Exercise on Chapter 10 Question 1: Find the values of k for which the line is (a) Parallel to the x-axis, (b) Parallel to the y-axis, (c) Passing through the origin. Answer 1: The given
() Miscellaneous Exercise on Chapter 10 Question 1: Find the values of k for which the line is (a) Parallel to the x-axis, (b) Parallel to the y-axis, (c) Passing through the origin. Answer 1: The given
Managing Trends. About Trends CHAPTER. Send documentation comments to
 CHAPTER 11 Trends provides historical data of a node in the network over a period of time. When the value of a node in the specified trend changes, the changes are recorded in the trend logs and displayed
TI- Nspire Testing Instructions
 TI- Nspire Testing Instructions Table of Contents How to Nsolve How to Check Compositions of Functions How to Verify Compositions of Functions How to Check Factoring How to Use Graphs to Backward Factor
Introduction.
 Product information Image Systems AB Main office: Ågatan 40, SE-582 22 Linköping Phone +46 13 200 100, fax +46 13 200 150 info@imagesystems.se, Introduction TEMA Automotive is the world leading system
Section 33: Advanced Charts
 Section 33 Advanced Charts By the end of this Section you should be able to: Use Chart Options Add Moving Averages to Charts Change a 3D Chart View Use Data Labels and Markers Create Stacked Bar Charts
Aspire Mathematics Periodic Classroom Standard Coverage
 Aspire Mathematics Periodic Classroom Standard Coverage Archdiocese of Chicago Curricular Benchmarks for Mathematics 1 2 3 4 5 Grade 3 Number and Operations-Fractions Develop understanding of fractions
Examination in Image Processing
 Umeå University, TFE Ulrik Söderström 203-03-27 Examination in Image Processing Time for examination: 4.00 20.00 Please try to extend the answers as much as possible. Do not answer in a single sentence.
form are graphed in Cartesian coordinates, and are graphed in Cartesian coordinates.
 Plot 3D Introduction Plot 3D graphs objects in three dimensions. It has five basic modes: 1. Cartesian mode, where surfaces defined by equations of the form are graphed in Cartesian coordinates, 2. cylindrical
Pre-Calculus Guided Notes: Chapter 10 Conics. A circle is
 Name: Pre-Calculus Guided Notes: Chapter 10 Conics Section Circles A circle is _ Example 1 Write an equation for the circle with center (3, ) and radius 5. To do this, we ll need the x1 y y1 distance formula:
2. Give an example of a non-constant function f(x, y) such that the average value of f over is 0.
 such that the average value of f over is 0.") Midterm 3 Review Short Answer 2. Give an example of a non-constant function f(x, y) such that the average value of f over is 0. 3. Compute the Riemann sum for the double integral where for the given grid
Midterm 3 Review Short Answer 2. Give an example of a non-constant function f(x, y) such that the average value of f over is 0. 3. Compute the Riemann sum for the double integral where for the given grid
1. Define the material properties. Activate the Data Entry menu if it s not already visible, and click on Materials.
 CE 533, Fall 2014 Guide for Using RISA3D 1 / 9 Example Structure. The procedure for calculating frequencies and modes shapes of a multidegree of freedom (MDOF) system will be demonstrated using the following
Multiframe Oct 2008
 Multiframe 11.01 3 Oct 2008 Windows Release Note This release note describes the Windows version 11.01 of Multiframe, Steel Designer and Section Maker. This release will run on Windows XP/2003/Vista/2008.
SUPPLEMENTARY FILE S1: 3D AIRWAY TUBE RECONSTRUCTION AND CELL-BASED MECHANICAL MODEL. RELATED TO FIGURE 1, FIGURE 7, AND STAR METHODS.
 SUPPLEMENTARY FILE S1: 3D AIRWAY TUBE RECONSTRUCTION AND CELL-BASED MECHANICAL MODEL. RELATED TO FIGURE 1, FIGURE 7, AND STAR METHODS. 1. 3D AIRWAY TUBE RECONSTRUCTION. RELATED TO FIGURE 1 AND STAR METHODS
Analysis of Planar Anisotropy of Fibre Systems by Using 2D Fourier Transform
 Maroš Tunák, Aleš Linka Technical University in Liberec Faculty of Textile Engineering Department of Textile Materials Studentská 2, 461 17 Liberec 1, Czech Republic E-mail: maros.tunak@tul.cz ales.linka@tul.cz
an OpenOffice spreadsheet method to calculate paleostress from striated faults User's Guide
 y-graph an OpenOffice spreadsheet method to calculate paleostress from striated faults User's Guide 1 0. Introduction 1 1. Input data 1 1.1 SDD 2 1.2 AD 4 1.3 DD 6 2. Fault Rotation 8 3. y-r calculation
Digital Image Processing Fundamentals
 Ioannis Pitas Digital Image Processing Fundamentals Chapter 7 Shape Description Answers to the Chapter Questions Thessaloniki 1998 Chapter 7: Shape description 7.1 Introduction 1. Why is invariance to
TABLE OF CONTENTS PRODUCT DESCRIPTION VISUALIZATION OPTIONS MEASUREMENT OPTIONS SINGLE MEASUREMENT / TIME SERIES BEAM STABILITY POINTING STABILITY
 TABLE OF CONTENTS PRODUCT DESCRIPTION VISUALIZATION OPTIONS MEASUREMENT OPTIONS SINGLE MEASUREMENT / TIME SERIES BEAM STABILITY POINTING STABILITY BEAM QUALITY M 2 BEAM WIDTH METHODS SHORT VERSION OVERVIEW
Anno accademico 2006/2007. Davide Migliore
 Robotica Anno accademico 6/7 Davide Migliore migliore@elet.polimi.it Today What is a feature? Some useful information The world of features: Detectors Edges detection Corners/Points detection Descriptors?!?!?
Section 4.4: Parabolas
 Objective: Graph parabolas using the vertex, x-intercepts, and y-intercept. Just as the graph of a linear equation y mx b can be drawn, the graph of a quadratic equation y ax bx c can be drawn. The graph
What is Publisher, anyway?
 What is Publisher, anyway? Microsoft Publisher designed for users who need to create and personalize publications such as marketing materials, business stationery, signage, newsletters and other items
Unit #13 : Integration to Find Areas and Volumes, Volumes of Revolution
 Unit #13 : Integration to Find Areas and Volumes, Volumes of Revolution Goals: Beabletoapplyaslicingapproachtoconstructintegralsforareasandvolumes. Be able to visualize surfaces generated by rotating functions
Cylinders and Quadric Surfaces A cylinder is a three dimensional shape that is determined by
 Cylinders and Quadric Surfaces A cylinder is a three dimensional shape that is determined by a two dimensional (plane) curve C in three dimensional space a line L in a plane not parallel to the one in
CSE528 Computer Graphics: Theory, Algorithms, and Applications
 CSE528 Computer Graphics: Theory, Algorithms, and Applications Hong Qin Stony Brook University (SUNY at Stony Brook) Stony Brook, New York 11794-2424 Tel: (631)632-845; Fax: (631)632-8334 qin@cs.stonybrook.edu
DOWN PLUNGE CROSS SECTIONS
 GG303 Lab 7 10/6/10 1 DOWN PLUNGE CROSS SECTIONS I Main Topics A Cylindrical folds B Downplunge cross-section views C Apparent dip II Cylindrical folds A Surface of a cylindrical fold is parallel to a
Click here to be a Dips 7.0 Beta Tester! 3D Stereosphere. Contour Arbitrary Data on Stereonet. Curved Boreholes. Intersection Calculator
 DIPS7.0 It s been 3 years since the release of Dips 6.0, so it s time for an upgrade! The latest version of our popular stereonet program - Dips 7.0 - is scheduled for release in early 2016. If you would
How to Measure Wedge. Purpose. Introduction. Tools Needed
 Purpose Optical Wedge Application (OWA) is an add-on analysis tool for measurement of optical wedges in either transmission or reflection. OWA can measure a single part or many parts simultaneously (e.g.
9.5 Polar Coordinates. Copyright Cengage Learning. All rights reserved.
 9.5 Polar Coordinates Copyright Cengage Learning. All rights reserved. Introduction Representation of graphs of equations as collections of points (x, y), where x and y represent the directed distances
Digital Image Processing
 Digital Image Processing Part 9: Representation and Description AASS Learning Systems Lab, Dep. Teknik Room T1209 (Fr, 11-12 o'clock) achim.lilienthal@oru.se Course Book Chapter 11 2011-05-17 Contents
Creating a Basic Chart in Excel 2007
 Creating a Basic Chart in Excel 2007 A chart is a pictorial representation of the data you enter in a worksheet. Often, a chart can be a more descriptive way of representing your data. As a result, those
Quadric Surfaces. Philippe B. Laval. Today KSU. Philippe B. Laval (KSU) Quadric Surfaces Today 1 / 24
 Quadric Surfaces Today 1 / 24") Quadric Surfaces Philippe B. Laval KSU Today Philippe B. Laval (KSU) Quadric Surfaces Today 1 / 24 Introduction A quadric surface is the graph of a second degree equation in three variables. The general
Quadric Surfaces Philippe B. Laval KSU Today Philippe B. Laval (KSU) Quadric Surfaces Today 1 / 24 Introduction A quadric surface is the graph of a second degree equation in three variables. The general
Practical Image and Video Processing Using MATLAB
 Practical Image and Video Processing Using MATLAB Chapter 18 Feature extraction and representation What will we learn? What is feature extraction and why is it a critical step in most computer vision and
Year 7 Set 1 : Unit 1 : Number 1. Learning Objectives: Level 5
 Year 7 Set 1 : Unit 1 : Number 1 I can place decimals in order of size I can place negative numbers in order of size I can add and subtract negative numbers I can set out and do addition, subtraction,
Tutorial 3 Sets, Planes and Queries
 Tutorial 3 Sets, Planes and Queries Add User Plane Add Set Window / Freehand / Cluster Analysis Weighted / Unweighted Planes Query Examples Major Planes Plot Introduction This tutorial is a continuation
Graphing Linear Equations
 Graphing Linear Equations Question 1: What is a rectangular coordinate system? Answer 1: The rectangular coordinate system is used to graph points and equations. To create the rectangular coordinate system,
Quadric Surfaces. Philippe B. Laval. Spring 2012 KSU. Philippe B. Laval (KSU) Quadric Surfaces Spring /
 Quadric Surfaces Spring /") .... Quadric Surfaces Philippe B. Laval KSU Spring 2012 Philippe B. Laval (KSU) Quadric Surfaces Spring 2012 1 / 15 Introduction A quadric surface is the graph of a second degree equation in three variables.
.... Quadric Surfaces Philippe B. Laval KSU Spring 2012 Philippe B. Laval (KSU) Quadric Surfaces Spring 2012 1 / 15 Introduction A quadric surface is the graph of a second degree equation in three variables.
3.1 Units. Angle Unit. Direction Reference
 Various settings allow the user to configure the software to function to his/her preference. It is important to review all the settings prior to using the software to ensure they are set to produce the
VERY LARGE TELESCOPE 3D Visualization Tool Cookbook
 European Organisation for Astronomical Research in the Southern Hemisphere VERY LARGE TELESCOPE 3D Visualization Tool Cookbook VLT-SPE-ESO-19500-5652 Issue 1.0 10 July 2012 Prepared: Mark Westmoquette
How to...create a Video VBOX Gauge in Inkscape. So you want to create your own gauge? How about a transparent background for those text elements?
 BASIC GAUGE CREATION The Video VBox setup software is capable of using many different image formats for gauge backgrounds, static images, or logos, including Bitmaps, JPEGs, or PNG s. When the software
Script for the Excel-based applet StereogramHeijn_v2.2.xls
 Script for the Excel-based applet StereogramHeijn_v2.2.xls Heijn van Gent, MSc. 25.05.2006 Aim of the applet: The aim of this applet is to plot planes and lineations in a lower Hemisphere Schmidt Net using
Anima-LP. Version 2.1alpha. User's Manual. August 10, 1992
 Anima-LP Version 2.1alpha User's Manual August 10, 1992 Christopher V. Jones Faculty of Business Administration Simon Fraser University Burnaby, BC V5A 1S6 CANADA chris_jones@sfu.ca 1992 Christopher V.
cief Data Analysis Chapter Overview Chapter 12:
 page 285 Chapter 12: cief Data Analysis Chapter Overview Analysis Screen Overview Opening Run Files How Run Data is Displayed Viewing Run Data Data Notifications and Warnings Checking Your Results Group
Programme. Introduction to Animation Shop
 HEART Trust NTA Vocational Training Development Institute Programme Course Animations Learning Objectives: Use the animation tools Prepare for an animation Create an animation with animation
Fifth Grade Math Pacing Guide. Chapter One Whole Numbers (10 Days)
") Chapter One Whole Numbers (10 Days) Common Core 5.NBT.1. Recognize that in a multi-digit number, a digit in one place represents 10 times as much as it represents in the place to its right and 1/10 of
Chapter One Whole Numbers (10 Days) Common Core 5.NBT.1. Recognize that in a multi-digit number, a digit in one place represents 10 times as much as it represents in the place to its right and 1/10 of
TSM Report Designer. Even Microsoft Excel s Data Import add-in can be used to extract TSM information into an Excel spread sheet for reporting.
 TSM Report Designer The TSM Report Designer is used to create and modify your TSM reports. Each report in TSM prints data found in the databases assigned to that report. TSM opens these databases according
NEW FEATURES IN gint VERSION 8
 NEW FEATURES IN gint VERSION 8 gint Version 8 has over 100 new features in the following areas: Data Design Caption value changes object selector display If at least one record has a value in the Caption,
E0005E - Industrial Image Analysis
 E0005E - Industrial Image Analysis The Hough Transform Matthew Thurley slides by Johan Carlson 1 This Lecture The Hough transform Detection of lines Detection of other shapes (the generalized Hough transform)
CSE328 Fundamentals of Computer Graphics
 CSE328 Fundamentals of Computer Graphics Hong Qin State University of New York at Stony Brook (Stony Brook University) Stony Brook, New York 794--44 Tel: (63)632-845; Fax: (63)632-8334 qin@cs.sunysb.edu
PARTS OF A WORKSHEET. Rows Run horizontally across a worksheet and are labeled with numbers.
 1 BEGINNING EXCEL While its primary function is to be a number cruncher, Excel is a versatile program that is used in a variety of ways. Because it easily organizes, manages, and displays information,
Section 18-1: Graphical Representation of Linear Equations and Functions
 Section 18-1: Graphical Representation of Linear Equations and Functions Prepare a table of solutions and locate the solutions on a coordinate system: f(x) = 2x 5 Learning Outcome 2 Write x + 3 = 5 as
Podium Plus Data Analysis Software. User Manual. SWIS10 Version
 SWIS10 Version Issue 1.10 February 2005 Contents 1 Introduction 6 1.1 What is Podium Plus? 6 1.2 About This Manual 6 1.3 Typographical Conventions 7 1.4 Getting Technical Support 7 2 Getting Started 8
SPHERICAL PROJECTIONS (II) Schedule Updates and Reminders: Bring tracing paper &needles for Lab 5
 Schedule Updates and Reminders: Bring tracing paper &needles for Lab 5") GG303 ecture 9 9/4/01 1 SPHERICA PRJECTINS (II) Schedule Updates and Reminders: Bring tracing paper &needles for ab 5 I ain Topics A Angles between lines and planes B Determination of fold axes C Equal-
GG303 ecture 9 9/4/01 1 SPHERICA PRJECTINS (II) Schedule Updates and Reminders: Bring tracing paper &needles for ab 5 I ain Topics A Angles between lines and planes B Determination of fold axes C Equal-
PITSCO Math Individualized Prescriptive Lessons (IPLs)
") Orientation Integers 10-10 Orientation I 20-10 Speaking Math Define common math vocabulary. Explore the four basic operations and their solutions. Form equations and expressions. 20-20 Place Value Define
Orientation Integers 10-10 Orientation I 20-10 Speaking Math Define common math vocabulary. Explore the four basic operations and their solutions. Form equations and expressions. 20-20 Place Value Define
Engineering Geology. Engineering Geology is backbone of civil engineering. Topographic Maps. Eng. Iqbal Marie
 Engineering Geology Engineering Geology is backbone of civil engineering Topographic Maps Eng. Iqbal Marie Maps: are a two dimensional representation, of an area or region. There are many types of maps,
Multiframe Windows Version 16. User Manual
 Multiframe Windows Version 16 User Manual Bentley Systems, Incorporated 2013 License & Copyright Multiframe Program & User Manual 2013 Bentley Systems, Incorporated iii Table of Contents License & Copyright...
12.6 Cylinders and Quadric Surfaces
 12 Vectors and the Geometry of Space 12.6 and Copyright Cengage Learning. All rights reserved. Copyright Cengage Learning. All rights reserved. and We have already looked at two special types of surfaces:
Probabilistic Analysis Tutorial
 Probabilistic Analysis Tutorial 2-1 Probabilistic Analysis Tutorial This tutorial will familiarize the user with the Probabilistic Analysis features of Swedge. In a Probabilistic Analysis, you can define
SNAP Centre Workshop. Graphing Lines
 SNAP Centre Workshop Graphing Lines 45 Graphing a Line Using Test Values A simple way to linear equation involves finding test values, plotting the points on a coordinate plane, and connecting the points.
InDesign Tools Overview
 InDesign Tools Overview REFERENCE If your palettes aren t visible you can activate them by selecting: Window > Tools Transform Color Tool Box A Use the selection tool to select, move, and resize objects.
graphing_9.1.notebook March 15, 2019
 1 2 3 Writing the equation of a line in slope intercept form. In order to write an equation in y = mx + b form you will need the slope "m" and the y intercept "b". We will subsitute the values for m and
Section 12.2: Quadric Surfaces
 Section 12.2: Quadric Surfaces Goals: 1. To recognize and write equations of quadric surfaces 2. To graph quadric surfaces by hand Definitions: 1. A quadric surface is the three-dimensional graph of an
ü 12.1 Vectors Students should read Sections of Rogawski's Calculus [1] for a detailed discussion of the material presented in this section.
![ü 12.1 Vectors Students should read Sections of Rogawski's Calculus [1] for a detailed discussion of the material presented in this section.](/thumbs/75/71742148.jpg "ü 12.1 Vectors Students should read Sections of Rogawski's Calculus [1] for a detailed discussion of the material presented in this section.") Chapter 12 Vector Geometry Useful Tip: If you are reading the electronic version of this publication formatted as a Mathematica Notebook, then it is possible to view 3-D plots generated by Mathematica
Chapter 12 Vector Geometry Useful Tip: If you are reading the electronic version of this publication formatted as a Mathematica Notebook, then it is possible to view 3-D plots generated by Mathematica
Podium Data Analysis Software. User Manual. SWIS10 Version
 SWIS10 Version Issue 1.00 March 2003 Contents 1 Introduction 5 1.1 What is Podium? 5 1.2 About This Manual 5 1.3 Typographical Conventions 6 1.4 Getting Technical Support 6 2 Getting Started 7 2.1 System
Number and Quantity. Reporting Topic Grade Level Standards Standard Summary
 Course Title: Fifth Grade Math Description: In fifth grade the content focuses on procedures, concepts, and applications in three critical areas: Developing fluency with addition and subtraction of fractions,
3D Surface Plots with Groups
 Chapter 942 3D Surface Plots with Groups Introduction In PASS, it is easy to study power and sample size calculations for a range of possible parameter values. When at least 3 input parameters vary, you
Lecture 8 Object Descriptors
 Lecture 8 Object Descriptors Azadeh Fakhrzadeh Centre for Image Analysis Swedish University of Agricultural Sciences Uppsala University 2 Reading instructions Chapter 11.1 11.4 in G-W Azadeh Fakhrzadeh
SHAPE, SPACE & MEASURE
 STAGE 1 Know the place value headings up to millions Recall primes to 19 Know the first 12 square numbers Know the Roman numerals I, V, X, L, C, D, M Know the % symbol Know percentage and decimal equivalents
Stamina Software Pty Ltd. TRAINING MANUAL Viságe Reporter
 Stamina Software Pty Ltd TRAINING MANUAL Viságe Reporter Version: 2 21 st January 2009 Contents Introduction...1 Assumed Knowledge...1 Pre Planning...1 Report Designer Location...2 Report Designer Screen
Overview for Families
 unit: Graphing Equations Mathematical strand: Algebra The following pages will help you to understand the mathematics that your child is currently studying as well as the type of problems (s)he will solve
Excel Level 1: Beginner. Get started in Excel. Look good with easy formatting. Set out your first Excel calculations. Increase your efficiency
 Excel 2010 Level 1: Beginner Learning basic skills for Excel 2010 Estimated time: 04:05 6 modules - 49 topics Get started in Excel Discover Excel and carry out simple tasks: opening a workbook saving it,
SUM - This says to add together cells F28 through F35. Notice that it will show your result is
 COUNTA - The COUNTA function will examine a set of cells and tell you how many cells are not empty. In this example, Excel analyzed 19 cells and found that only 18 were not empty. COUNTBLANK - The COUNTBLANK
CoE4TN4 Image Processing
 CoE4TN4 Image Processing Chapter 11 Image Representation & Description Image Representation & Description After an image is segmented into regions, the regions are represented and described in a form suitable
Target Lithology Voxels
 Target Lithology Voxels The Target Lithology Voxels tool enables you to create a 3D grid (voxel) based on data contained in a string channel within a from-to drillhole database. A lithology voxel can be
Rectangular Coordinates in Space
 Rectangular Coordinates in Space Philippe B. Laval KSU Today Philippe B. Laval (KSU) Rectangular Coordinates in Space Today 1 / 11 Introduction We quickly review one and two-dimensional spaces and then
Background CE 342. Why RISA-2D? Availability
 Background CE 342 RISA-2D RISA-2D is a structural analysis program, which can model: Beams, frames, trusses and plates. Any linear elastic structural material. Typical supports, such as pins, rollers and
Casey County Schools- 5 th Grade Math Curriculum Map
 Week(s) Standard I can statement(s) Critical Vocabulary Weeks 1-2 5.NBT.1 Recognize that in a multi-digit number, a digit in one place represents 10 times as much as it represents in the place to its right
GRADE 5. Operations & Algebraic Thinking - Domain
 Write and interpret numerical expressions. CLUSTERS: 1. Use parentheses, brackets, or braces in numerical expressions, and evaluate expressions with these symbols. 2. Write simple expressions that record
Buds Public School, Dubai
 Buds Public School, Dubai Subject: Maths Grade: 11 AB Topic: Statistics, Probability, Trigonometry, 3D, Conic Section, Straight lines and Limits and Derivatives Statistics and Probability: 1. Find the
GEO 154 CARTOGRAPHY II- PLOTTING USING AUTOCAD- ASSIGMENT HELP
 GEO 154 CARTOGRAPHY II- PLOTTING USING AUTOCAD- ASSIGMENT HELP DOCUMENT. For one to two reasons data may not be in a format that can be integrated into AutoCAD software, but coordinates may be separated
Podium Data Analysis Software. User Manual. RCA40 Version
 RCA40 Version Issue 1.00 March 2003 Contents 1 Introduction 5 1.1 What is Podium? 5 1.2 About This Manual 5 1.3 Typographical Conventions 6 1.4 Getting Technical Support 6 2 Getting Started 7 2.1 System
Microsoft Excel 2007
 Microsoft Excel 2007 1 Excel is Microsoft s Spreadsheet program. Spreadsheets are often used as a method of displaying and manipulating groups of data in an effective manner. It was originally created
Sample Sizes: up to 1 X1 X 1/4. Scanners: 50 X 50 X 17 microns and 15 X 15 X 7 microns
 R-AFM100 For Nanotechnology Researchers Wanting to do routine scanning of nano-structures Instrument Innovators Using AFM as a platform to create a new instrument Educators Teaching students about AFM
1. ORIENTATIONS OF LINES AND PLANES IN SPACE
 I Main Topics A Defini@ons of points, lines, and planes B Geologic methods for describing lines and planes C AMtude symbols for geologic maps D Reference frames 1 II Defini@ons of points, lines, and planes
GTPS Curriculum 5 th Grade Math. Topic: Topic 1 - Understand Place Value
 Topic: Topic 1 - Understand Place Value Understand the place value system. 5.NBT.1. Recognize that in a multi-digit number, a digit in one place represents 10 times as much as it represents in the place
Chapter 3A Rectangular Coordinate System
 Fry Texas A&M University! Math 150! Spring 2015!!! Unit 4!!! 1 Chapter 3A Rectangular Coordinate System A is any set of ordered pairs of real numbers. The of the relation is the set of all first elements
Solution Notes. COMP 151: Terms Test
 Family Name:.............................. Other Names:............................. ID Number:............................... Signature.................................. Solution Notes COMP 151: Terms
5.OA.1 5.OA.2. The Common Core Institute
 Operations and Algebraic Thinking The Common Core Institute Cluster: Write and interpret numerical expressions. 5.OA.1: Use parentheses, brackets, or braces in numerical expressions, and evaluate expressions
Common Core Math Curriculum Map
 Module 1 - Math Test: 8/2/2013 Understand the place value system. 5.NBT.1 * 5.NBT.2 * 5.NBT.3 * 5.NBT.4 Recognize that in a multi-digit number, a digit in one place represents 10 times as much as it represents
Common Core Math Curriculum Map
 Module 1 - Math Test: 9/25/2013 Write and interpret numerical expressions. 5.OA.1 * 5.OA.2 Use parentheses, brackets, or braces in numerical expressions, and evaluate expressions with these symbols. (A).
Fixed Perimeter Rectangles Geometry Creating a Document
 Activity Overview: This activity provides the steps to create a TI-Nspire document that will be used to investigate side length and area in a rectangle with a fixed perimeter. An algebraic approach is
Interactive Math Glossary Terms and Definitions
 Terms and Definitions Absolute Value the magnitude of a number, or the distance from 0 on a real number line Addend any number or quantity being added addend + addend = sum Additive Property of Area the
+ b. From this we can derive the following equations:
 A. GEOMETRY REVIEW Pythagorean Theorem (A. p. 58) Hypotenuse c Leg a 9º Leg b The Pythagorean Theorem is a statement about right triangles. A right triangle is one that contains a right angle, that is,