CSTools Guide (for ArcGIS version 10.2 and 10.3)
|
|
|
- Oswald Simon
- 6 years ago
- Views:
Transcription
1 CSTools Guide (for ArcGIS version 10.2 and 10.3) 1. Why to use Orientation Analysis and Cross section tools (CSTools) in ArcGIS? 2 2. Data format Coordinate Systems 2 3. How to get the tools into my computer? 2 4. Attention! 2 5. Individual tools guide New Projection Plot in Azimuthal Projection tool Additional functions Link Map and Projection tool Density distribution diagram Spatial Averaging tool and Map of Fold Axes tool Rose histogram CSProfile tool 7 1
2 1. Why to use Orientation Analysis and Cross section tools (CSTools) in ArcGIS? Orientation Analysis Tools described here offer practical method of processing tectonic data in relation to their location and attributes. Use them in combination with GIS tools to work and understand your set of tectonic data. In ArcGIS, Selection Tools are available, which you can use to select tectonic orientations in the map according to their location or attributes, such as type of structure, orientation or relation to geological units. These tools enable to plot orientations into diagram (azimuthal projection equalarea net) as points or great circles, count the density distribution diagrams, map of spatial averages, map of fold axes or a rose histogram). Link Tool connects data in the diagram and the map. Profile Tool was added to create profile line of cross section from dmr. Several additional functions are available (eigenvectors, vector calculator). As a result you can get an overview of main structures in the map, to accompany your map with diagrams and enjoy working in a single environment with no need of data transfer. 2. Data format Shapefile as a layer in ArcMap is an input for the tools. Tools dialog boxes offer layers from an Active Data Frame as an input. Table: attribute table should contain fields for dip direction and dip (double or integer type of field). The fields order or names do not matter. Additional fields - station ID and type of structure - can be also useful. 2.1 Coordinate Systems!!Your data should be in projected coordinate system in meters (not in geographic coordinate system in degrees). How to project your shapefile in WGS 1985 (degrees) to Projected Coordinate System? Use Project Tool located in ArcToolbox (in ArcMap or ArcCatalog). Open ArcToolbox window, click on Data Management Tools Projections and Transformations Feature. Here is the Project Tool located. Double click, fill parameters, new shapefile with desired coordinate system is created. 3. How to get the tools into my computer? Installation is easy; double click at Esri Add-In File. Confirm installation. In ArcMap display the toolbar Orientation Analysis and Cross section tools for ArcGIS 10_2 or 10_3. For detailed guide see CSTools_for_10_2_and_10_3_installation.pdf. 4. Attention! Please, if ever happen to stop working with some error message, give me a notice! I would be grateful to you. If you have any idea what to improve or what is missing tell me about it! 2
3 Recommendation: files and folders names should not use any spaces or marks like %ˇ?! etc. Use underscore instead of spaces. 5. Individual tools guide 5.0 New Projection This button should be used before the orientations of geological structures are plotted. New Data Frame is added. Navigate to diagram_outline.shp to add to the projection. Diagram outline is shapefile delivered with this add-in. Outputs of Plot in Azimuthal Projection tool, Density Distribution Diagram and Rose Histogram tools are to be observed in this projection. It is azimuthal lower hemisphere equalarea projection as indicated in the new data frame name. The Data Frame does not have coordinate system as same as the diagram outline. Radius of the diagram is 200 units and the tools calculate with this number. Drag the layer with structural data to this Data Frame and make sure it is active before you use the Plot in Azimuthal Projection, Density Distribution Diagram, or Rose Histogram tools. You can switch to Layout view to see both the projection and the map Data Frame. 5.1 Plot in Azimuthal Projection tool This tool plots selected orientations from the input layer to azimuthal equal-area projection (lower hemisphere). Create New Projection by the New Projection button first. Make it active and drag the layer with structural data here. In the dialog box, choose the input layer in the first box. Only layers from the active Data Frame are in the menu. Then choose field for control point ID and field for type of S (planar) structure. These fields are optional. If you want to plot planes, select fields for dip direction and dip. (Convert strikes to dip directions first, if your data contain that). Planes can be plotted as normals to planes or as great circles. Great circles are convenient for small datasets - a few orientations, otherwise the diagram is unclear and the tool takes too much time to execute. If you want to plot lines, select fields for trend and plunge, optionally for type of L structure. Selected fields are then in the output shapefile. Plotting options include graphical points or a shapefile. With shp there is also txt file generated in the workspace. Shapefile can be used by the Link Map and Projection tool to link selected data in the map and the projection. Great circles cannot be plotted as graphics; new shapefile must be created. 3


4 5.1.1 Additional functions Eigenvectors can be calculated and plotted as graphics or shapefile. There is also Euler/Vector calculator to convert angles to vector components and vice versa, compute pole to plane, cross product and dot product of two lines. Tip: Any orientation written manually into the text boxes of eigenvectors can be plotted into the projection by the Plot Eigenvector button. Every time you plot the orientations in a new shapefile, new field N is added into the output shp table. This field contains FIDs of the original data, which is the way, how the orientations in the new shp can be linked to the original data. 5.2 Link Map and Projection tool This tool links data in the projection with corresponding orientations in the map, and vice versa. Select points in the diagram or in the map by Selection tool first. These points will be linked. The result of the Link tool is selection in the layer that is linked to. Both layers must be in the active Data Frame. 4
. Equivalent points are selected in the TO layer. 5.")
5 Use the Link Map and Projection button and in the first box of the dialog box choose the layer with selected points (FROM layer). In the second box choose the layer, you want to link to (TO layer). Click on the button representing the link direction ( diagram to map or map to diagram ). Equivalent points are selected in the TO layer. 5.3 Density distribution diagram This tool calculates the density distribution diagram. Create the new projection by the New Projection button first. Make it active and drag the layer with structural data here. Use the Density Distribution Diagram button. In the dialog box, choose the input layer in the first box. Only layers from the active Data Frame are in the menu. You can change the workspace. Untick the option Plot only selected features if you want to work with all (not only selected) features. Select fields for dip direction and dip. Type a name for the output raster and select colour of the output raster. Smoothing parameter: for less data, smaller number is adequate, produces more smoothed diagrams. Smoothing parameter is set in default, but try to change, higher number produces more detailed diagrams. Maximum is 100. Watson density is calculated. 5.4 Spatial Averaging tool and Map of Fold Axes tool This tool calculates spatial averages (resp. fold axes) in a net of stations. The interval is set by user as well as the radius of influence (this radius determines the space around the station within the tectonic orientations have influence on the calculation). Orientation matrix is used. Influence of each orientation is determined by the distance from the averaging station. Eigenvalues and eigenvectors are computed. The highest eigenvalue is used to compute the spatial averages and the lowest to compute fold axes. If there is a selection in the input layer, the tool works with this selection. If no selection, the tool works with all features. 5

6 Choose the input layer in the first box, then fields for dip and dip direction. Type the interval of the net of stations and radius of influence. Type the name of the output. You can change the workspace. There are informative values in the text boxes below: numbers of stations in X and Y directions and the extent of the data in meters. Use Calculate button. Text file with x, y and computed orientation (dip direction and dip, resp. trend and plunge) is generated in the selected workspace and shapefile is created from that. This shp is added to ArcMap and rotated symbols are set. 5.6 Rose histogram The Rose Histogram tool creates diagram that represents the frequency of orientations of geological structures. Orientations are read from point geometry data (orientations are in the attribute table) or are calculated from the geometry of polylines. Orientations are matched to one of 10 degrees classes. The class with the highest frequency is 100% of the diagram radius; other classes are relative to it. Point Input: Dip directions from an attribute table of point data are converted to strikes. Select the field containing the dip directions. Line Input: Orientation for each line is calculated. Options are: mean vector of polyline segments orientation or orientation of straight line connecting the start and the end point of the polyline. Optionally use the button Line Azimuths and calculate orientations of input polyline data. Orientations are added to the attribute table. Both methods of calculation are used (mean vector of segments orientations and start-end point orientation). Optionally the length of the polyline can be considered, when you tick the option Weight the line influence by the line length. The influence of the line is multiplied by its length. (Short lines will have less influence than the long lines). Fields in the output polygon shp: class_no : class number (1-18), count : number of orientations that fall in this class, tot_length : total length of lines in this class in kilometres (when weighted by length), rel_length : relative length of classes (from 0 to 1) 6

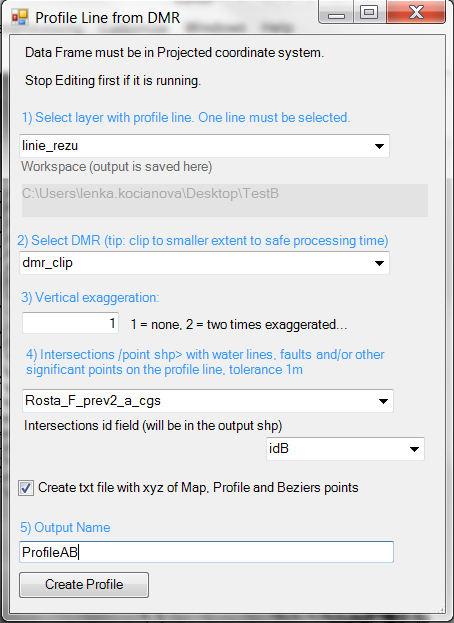
7 Using tool - steps Use the Rose histogram button Dialog box appears. In the first box Input Feature layer, choose the input layer- line or point shapefile. Number of selected features is displayed, if there is any selection. The tool works with selection. If there is no selection, the tool works with all features. Lines input: Optionally use the Line Azimuths button to add line orientations in the input attribute table. Points input: Select the dip direction field. You can change the workspace. Type a name of the output polygon shapefile. Lines input: Tick Weigh the line influence by the line length if you want to weigh by the lines lengths. Select the option of how the line orientation is calculated. Click on Calculate histogram from Lines or..from points. 5.7 CSProfile tool This tool creates profile line of cross section from dmr. Input is the line shp with one line selected (line of cross section in the map). Input is DMR, pixel value=elevation. Both inputs must be in projected coordinate system. Optional input is point shapefile with intersections. These points are intersections of line of cross section with water lines or spot height or other points that you want to have on the profile line. Optionally you can tick the option Create txt files with Map points (points along the line of cross section in the map in given interval, where the elevation is taken), Profile points (points in the plane of cross section, that form the profile line - exact elevation read from dmr at Map points) and Beziers points (approximation is calculated from profile points using beziers approximation, otherwise the profile line is zigzagged). You can use the Profile points to create profile line with exact elevation values. Output is a line shp with profile line and a point shp with intersections (if this input was set). 7
8 8
Name: Date: June 27th, 2011 GIS Boot Camps For Educators Lecture_3
 Name: Date: June 27th, 2011 GIS Boot Camps For Educators Lecture_3 Practical: Creating and Editing Shapefiles Using Straight, AutoComplete and Cut Polygon Tools Use ArcCatalog to copy data files from:
Display Layers in Geosoft 3D View
 Use the New 2D/3D Workflow features in Target for ArcGIS In Target for ArcGIS version 3.5, there are three new interconnected features that make integrating 2D and 3D data in plan and section maps easier.
Delineating Watersheds from a Digital Elevation Model (DEM)
") Delineating Watersheds from a Digital Elevation Model (DEM) (Using example from the ESRI virtual campus found at http://training.esri.com/courses/natres/index.cfm?c=153) Download locations for additional
Delineating Watersheds from a Digital Elevation Model (DEM) (Using example from the ESRI virtual campus found at http://training.esri.com/courses/natres/index.cfm?c=153) Download locations for additional
Ex. 4: Locational Editing of The BARC
 Ex. 4: Locational Editing of The BARC Using the BARC for BAER Support Document Updated: April 2010 These exercises are written for ArcGIS 9.x. Some steps may vary slightly if you are working in ArcGIS
Calculate a Distance Matrix of Locations along River Network
 Calculate a Distance Matrix of Locations along River Network These instructions enable you to measure the length of line segments between points, which is much more useful than simple straight-line distances
GIS LAB 8. Raster Data Applications Watershed Delineation
 GIS LAB 8 Raster Data Applications Watershed Delineation This lab will require you to further your familiarity with raster data structures and the Spatial Analyst. The data for this lab are drawn from
LAB 1: Introduction to ArcGIS 8
 LAB 1: Introduction to ArcGIS 8 Outline Introduction Purpose Lab Basics o About the Computers o About the software o Additional information Data ArcGIS Applications o Starting ArcGIS o o o Conclusion To
Finding and Using Spatial Data
 Finding and Using Spatial Data Introduction In this lab, you will download two different versions of the National Wetlands Inventory (NWI) dataset for a region of Massachusetts, from a source on the internet.
Introduction to GIS 2011
 Introduction to GIS 2011 Digital Elevation Models CREATING A TIN SURFACE FROM CONTOUR LINES 1. Start ArcCatalog from either Desktop or Start Menu. 2. In ArcCatalog, create a new folder dem under your c:\introgis_2011
Objective: To be come more familiar with some more advanced applications in ArcGIS.
 Advanced Procedures in ArcGIS 2005 SPACE Workshop OSU Author: Jason VanHorn Purpose: Having gone through Getting to know ArcGIS, you are now ready to do some more advanced applications. In this lab you
Spatial Analysis with Raster Datasets
 Spatial Analysis with Raster Datasets Francisco Olivera, Ph.D., P.E. Srikanth Koka Lauren Walker Aishwarya Vijaykumar Keri Clary Department of Civil Engineering April 21, 2014 Contents Brief Overview of
Data Assembly, Part II. GIS Cyberinfrastructure Module Day 4
 Data Assembly, Part II GIS Cyberinfrastructure Module Day 4 Objectives Continuation of effective troubleshooting Create shapefiles for analysis with buffers, union, and dissolve functions Calculate polygon
A Second Look at DEM s
 A Second Look at DEM s Overview Detailed topographic data is available for the U.S. from several sources and in several formats. Perhaps the most readily available and easy to use is the National Elevation
Tutorial 18: 3D and Spatial Analyst - Creating a TIN and Visual Analysis
 Tutorial 18: 3D and Spatial Analyst - Creating a TIN and Visual Analysis Module content 18.1. Creating a TIN 18.2. Spatial Analyst Viewsheds, Slopes, Hillshades and Density. 18.1 Creating a TIN Sometimes
Lab 1: Introduction to ArcGIS
 Lab 1: Introduction to ArcGIS Objectives In this lab you will: 1) Learn the basics of the software package we will be using for the remainder of the semester, and 2) Discover the role that climate and
Answer the following general questions: 1. What happens when you right click on an icon on your desktop? When you left double click on an icon?
 Name: Date: June 27th, 2011 GIS Boot Camps For Educators Practical: Explore ArcGIS 10 Desktop Tools and functionality Day_1 Lecture 1 Sources: o ArcGIS Desktop help o ESRI website o Getting to Know ArcGIS
Working with Elevation Data URPL 969 Applied GIS Workshop: Rethinking New Orleans After Hurricane Katrina Spring 2006
 Working with Elevation Data URPL 969 Applied GIS Workshop: Rethinking New Orleans After Hurricane Katrina Spring 2006 This GIS lab exercise will explore Light Detection And Ranging (LiDAR) data for New
Lesson 8 : How to Create a Distance from a Water Layer
 Created By: Lane Carter Advisor: Paul Evangelista Date: July 2011 Software: ArcGIS 10 Lesson 8 : How to Create a Distance from a Water Layer Background This tutorial will cover the basic processes involved
Importing GPS points and Hyperlinking images.
 Geol 3050 GIS for Geologists Exercise 15 Exercise 15 Making a Virtual Fieldtrip: Importing GPS points and Hyperlinking images. Due: Thursday, March 22. Goal: A) Get familiar with importing GPS points and
GIS Basics for Urban Studies
 GIS Basics for Urban Studies Date: March 21, 2018 Contacts: Mehdi Aminipouri, Graduate Peer GIS Faciliator, SFU Library (maminipo@sfu.ca) Keshav Mukunda, GIS & Map Librarian Librarian for Geography (kmukunda@sfu.ca)
STUDENT PAGES GIS Tutorial Treasure in the Treasure State
 STUDENT PAGES GIS Tutorial Treasure in the Treasure State Copyright 2015 Bear Trust International GIS Tutorial 1 Exercise 1: Make a Hand Drawn Map of the School Yard and Playground Your teacher will provide
Proximity Analysis. Proximity Analysis
 Proximity Analysis Proximity Analysis 1 Ever wonder How close is the nearest gas station? What is the distance between your house and the candy store? What is the shortest route to get to Starbucks? Is
ArcMap - EXPLORING THE DATABASE Part I. SPATIAL DATA FORMATS Part II
 Week 5 ArcMap - EXPLORING THE DATABASE Part I SPATIAL DATA FORMATS Part II topics of the week Exploring the Database More on the Table of Contents Exploration tools Identify, Find, Measure, Map tips, Hyperlink,
Geographical Information Systems Institute. Center for Geographic Analysis, Harvard University. LAB EXERCISE 1: Basic Mapping in ArcMap
 Harvard University Introduction to ArcMap Geographical Information Systems Institute Center for Geographic Analysis, Harvard University LAB EXERCISE 1: Basic Mapping in ArcMap Individual files (lab instructions,
Tutorial 1: Finding and Displaying Spatial Data Using ArcGIS
 Tutorial 1: Finding and Displaying Spatial Data Using ArcGIS This tutorial will introduce you to the following: Websites where you may browse to find geospatial information Identifying spatial data, usable
Appendix 2: Random Plots Workbook: Unstratified Sample
 Appendix 2: Random Plots Workbook: Unstratified Sample These instructions will help users of all skill levels create a random sample of i-tree Eco plot centers, plot areas, and the associated i-tree Eco-required
Lab 12: Sampling and Interpolation
 Lab 12: Sampling and Interpolation What You ll Learn: -Systematic and random sampling -Majority filtering -Stratified sampling -A few basic interpolation methods Videos that show how to copy/paste data
Follow-Up on the Nueces River Groundwater Problem Uvalde Co. TX
 Follow-Up on the Nueces River Groundwater Problem Uvalde Co. TX Analysis by Ryan Kraft 12/4/2014 1 Problem Formulation A reduction in discharge was detected at a gauging station along a portion of the
Basic Tasks in ArcGIS 10.3.x
 Basic Tasks in ArcGIS 10.3.x This guide provides instructions for performing a few basic tasks in ArcGIS 10.3.1, such as adding data to a map document, viewing and changing coordinate system information,
Measuring Area/Length of Organisms with GIS
 Measuring Area/Length of Organisms with GIS These instructions enable you to measure the length and area of microscopic organisms in ArcGIS from digital photographs. The four-step process involves: georeferencing
ArcGIS for Geoscientists
 School of Geosciences ArcGIS for Geoscientists R. Armit & T. Carmichael GIS A geographic information system (GIS) is a system designed to capture, store, manipulate, analyze, manage, and present all types
A GIS add-in for automated measurement of sand dune migration using multi-temporal and high-resolution digital elevation models.
 A GIS add-in for automated measurement of sand dune migration using multi-temporal and high-resolution digital elevation models User s Guide Please send comments/suggestions to: Pinliang Dong 1155 Union
I. An Intro to ArcMap Version 9.3 and 10. 1) Arc Map is basically a build your own Google map
 Arc Map is basically a build your own Google map") I. An Intro to ArcMap Version 9.3 and 10 What is Arc Map? 1) Arc Map is basically a build your own Google map a. Display and manage geo-spatial data (maps, images, points that have a geographic location)
I. An Intro to ArcMap Version 9.3 and 10 What is Arc Map? 1) Arc Map is basically a build your own Google map a. Display and manage geo-spatial data (maps, images, points that have a geographic location)
DOWN PLUNGE CROSS SECTIONS
 GG303 Lab 7 10/6/10 1 DOWN PLUNGE CROSS SECTIONS I Main Topics A Cylindrical folds B Downplunge cross-section views C Apparent dip II Cylindrical folds A Surface of a cylindrical fold is parallel to a
Script for the Excel-based applet StereogramHeijn_v2.2.xls
 Script for the Excel-based applet StereogramHeijn_v2.2.xls Heijn van Gent, MSc. 25.05.2006 Aim of the applet: The aim of this applet is to plot planes and lineations in a lower Hemisphere Schmidt Net using
RVR MEANDER USER S MANUAL
 RVR MEANDER USER S MANUAL ArcGIS VERSION Roberto Fernández 1, Davide Motta 2, Jorge D. Abad 3, Eddy J. Langendoen 4, Nils Oberg 5, Marcelo H. Garcia 6 August 29, 2011 ABSTRACT This document illustrates
GEO/GY461 Applied GIS: Environmental Geology of the Cheaha Mountain, AL, 7.5' Quadrangle Project
 Figure 1: Reference points spreadsheet for Cheaha Mt. 7.5' quadrangle (LatLongCalc_24k.xls). Page -1- Figure 2: RMS statistic from the Cheaha Mountain field map georeference. Page -2- Figure 3: Appearance
3.2 TIPS FOR USING MATLAB
 3.2 TIPS FOR USING MATLAB 3.2.1 Exporting Graphics from MATLAB to WORD and Editing Details Given a graphical plot in MATLAB, say graph.fig, the following procedure allows this graph to be imported into
Lecture 21 - Chapter 8 (Raster Analysis, part2)
") GEOL 452/552 - GIS for Geoscientists I Lecture 21 - Chapter 8 (Raster Analysis, part2) Today: Digital Elevation Models (DEMs), Topographic functions (surface analysis): slope, aspect hillshade, viewshed,
GEOL 452/552 - GIS for Geoscientists I Lecture 21 - Chapter 8 (Raster Analysis, part2) Today: Digital Elevation Models (DEMs), Topographic functions (surface analysis): slope, aspect hillshade, viewshed,
A Practical Guide to Using QGIS
 A Practical Guide to Using QGIS 1.1 INTRODUCTION Quantum GIS (QGIS) is a useful mapping software that enables the compilation and displaying of spatial data in the form of a map. Gaining experience in
Creating Contours using ArcMap
 Creating Contours with ArcMap and ArcScene Digital elevation models (DEMs) are geospatial datasets that contain elevation values sampled according to a regularly spaced rectangular grid. They can be used
Creating and Editing a New Shapefile
 Creating and Editing a New Shapefile Written by Barbara Parmenter, revised October, 0 CREATING AND EDITING A NEW SHAPEFILE... CREATING THE GEOGRAPHIC FEATURE (POINT, LINE, OR POLYGON)... CREATING THE ATTRIBUTE
GEOG 487 Lesson 4: Step-by-Step Activity
 GEOG 487 Lesson 4: Step-by-Step Activity Part I: Visually Explore Trends In Part I, we will explore several tools and technique to make it easier to visually interpret patterns in your data using ArcGIS.
Creating USNG Mapbooks
 Creating USNG Mapbooks This is a basic guide for creating a map book based on the U.S. National Grid (USNG), using Data Driven Pages in ArcMap. Data Driven Pages is a feature of ArcMap that was added at
Creating a Smaller Data Set from a Larger Data Set Vector Data
 Creating a Smaller Data Set from a Larger Data Set Vector Data Written by Barbara Parmenter, revised by Carolyn Talmadge January 16, 2015 USING THE SELECTION METHOD QUICK METHOD BY CREATING A LAYER FILE...
1. Use the Add Data button to add each of the datasets you wish to convert to the map document.
 Projecting your data In order for many GIS functions to work properly, your datasets need to be stored in a common projected coordinate system. This guide will assist you with the projection process in
In this exercise, you will convert labels into geodatabase annotation so you can edit the text features.
 Instructions: Use the provided data stored in a USB. For the report: 1. Start a new word document. 2. Follow an exercise step as given below. 3. Describe what you did in that step in the word document
Exercise 1: Getting to know ArcGIS
 The Scenario You are working for the California Visitor s Commission. You have been asked to prepare a map of California for several dignitaries from out of the country. Your map will need to include enough
Raster Data Model & Analysis
 Topics: 1. Understanding Raster Data 2. Adding and displaying raster data in ArcMap 3. Converting between floating-point raster and integer raster 4. Converting Vector data to Raster 5. Querying Raster
Using ArcScan for ArcGIS
 ArcGIS 9 Using ArcScan for ArcGIS Copyright 00 005 ESRI All rights reserved. Printed in the United States of America. The information contained in this document is the exclusive property of ESRI. This
CVEN 2012 GEOMATICS LAB SPRING 2016 INTRO TO ESRI ARCGIS
 CVEN 2012 GEOMATICS LAB SPRING 2016 INTRO TO ESRI ARCGIS Objectives 1. Download and Add Data into ArcMap 2. Symbolize and Label Features 3. Navigate and Investigate the Map 4. Explore Attributes and Metadata
Basics of Using LiDAR Data
 Conservation Applications of LiDAR Basics of Using LiDAR Data Exercise #2: Raster Processing 2013 Joel Nelson, University of Minnesota Department of Soil, Water, and Climate This exercise was developed
Hot Spot / Kernel Density Analysis: Calculating the Change in Uganda Conflict Zones
 Hot Spot / Kernel Density Analysis: Calculating the Change in Uganda Conflict Zones Created by Patrick Florance. Revised on 10/22/18 for 10.6.1 OVERVIEW... 1 SETTING UP... 1 ENABLING THE SPATIAL ANALYST
Georeferencing and Digitizing
 INTRODUCTION There is a great deal of geographic data available in formats that cannot be immediately integrated with other GIS data. In order to use these types of data in GIS it is necessary to align
Lecture 7 Digitizing. Dr. Zhang Spring, 2017
 Lecture 7 Digitizing Dr. Zhang Spring, 2017 Model of the course Using and making maps Navigating GIS maps Map design Working with spatial data Geoprocessing Spatial data infrastructure Digitizing File
8. SPHERICAL PROJECTIONS (I)
") I Main Topics A What is a spherical projecgon? B Equal- angle (stereographic) projecgon of a line C Equal- angle (stereographic) projecgon of a plane D IntersecGon of two planes 9/14/16 GG303 1 Focal Mechanism,
I Main Topics A What is a spherical projecgon? B Equal- angle (stereographic) projecgon of a line C Equal- angle (stereographic) projecgon of a plane D IntersecGon of two planes 9/14/16 GG303 1 Focal Mechanism,
I.1. Digitize landslide region and micro-topography using satellite image
 I. Data Preparation At this part, it will be shown the stages of process on preparing all types of data which required in making of landslide potential and banjir bandang hazard map. I.1. Digitize landslide
Geography 281 Mapmaking with GIS Project One: Exploring the ArcMap Environment
 Geography 281 Mapmaking with GIS Project One: Exploring the ArcMap Environment This activity is designed to introduce you to the Geography Lab and to the ArcMap software within the lab environment. Before
Search & Rescue Map Specifications and Production Workflows
 Search & Rescue Map Specifications and Production Workflows About The Search & Rescue map product and production procedures discussed in this document can be utilized to support search, rescue, and relief
Lab 18c: Spatial Analysis III: Clip a raster file using a Polygon Shapefile
 Environmental GIS Prepared by Dr. Zhi Wang, CSUF EES Department Lab 18c: Spatial Analysis III: Clip a raster file using a Polygon Shapefile These instructions enable you to clip a raster layer in ArcMap
This support note will discuss several methods of creating no spray zones for Sentinel GIS>
 Reason Sentinel Adulticiding support a polygon no spray layer. Adulticiding mobile software warns the driver when they are approaching a no spray zone so they can turn off the sprayer. Because no spray
Integrating CAD Data with ArcGIS
 Integrating CAD Data with ArcGIS Agenda An Overview of CAD Drawings CAD Data Structure in ArcGIS Visualization Georeferencing Data Conversion ArcGIS for AutoCAD Q & A CAD Drawings - Overview Widely used
4. Once open, activate the ArcToolbox window (if not already visible) by clicking the red box below
 by clicking the red box below") Getting Started Downloading The latest version of the toolbox is available for download at: www.sdmtoolbox.org. This software requires ArcMap 10.1 10.5 with an active Spatial Analyst license (www.esri.com).
Getting Started Downloading The latest version of the toolbox is available for download at: www.sdmtoolbox.org. This software requires ArcMap 10.1 10.5 with an active Spatial Analyst license (www.esri.com).
Stream Network and Watershed Delineation using Spatial Analyst Hydrology Tools
 Stream Network and Watershed Delineation using Spatial Analyst Hydrology Tools Prepared by Venkatesh Merwade School of Civil Engineering, Purdue University vmerwade@purdue.edu January 2018 Objective The
Example of one enclave in the field. strike. Right hand rule convention of orientation. pitch or rake. dip
 Example of one enclave in the field strike Right hand rule convention of orientation pitch or rake dip Example of a thin section of rock Example of an upside down thin section of rock Orientation of the
Objectives Learn how to work with projections in GMS, and how to combine data from different coordinate systems into the same GMS project.
 v. 10.2 GMS 10.2 Tutorial Working with map projections in GMS Objectives Learn how to work with projections in GMS, and how to combine data from different coordinate systems into the same GMS project.
_Tutorials. Arcmap. Linking additional files outside from Geodata
 _Tutorials Arcmap Linking additional files outside from Geodata 2017 Sourcing the Data (Option 1): Extracting Data from Auckland Council GIS P1 First you want to get onto the Auckland Council GIS website
ArcGIS Extension User's Guide
 ArcGIS Extension 2010 - User's Guide Table of Contents OpenSpirit ArcGIS Extension 2010... 1 Installation ( ArcGIS 9.3 or 9.3.1)... 3 Prerequisites... 3 Installation Steps... 3 Installation ( ArcGIS 10)...
Using GIS to Site Minimal Excavation Helicopter Landings
 Using GIS to Site Minimal Excavation Helicopter Landings The objective of this analysis is to develop a suitability map for aid in locating helicopter landings in mountainous terrain. The tutorial uses
Converting AutoCAD Map 2002 Projects to ArcGIS
 Introduction This document outlines the procedures necessary for converting an AutoCAD Map drawing containing topologies to ArcGIS version 9.x and higher. This includes the export of polygon and network
GeoPlanes. Interactive Analysis of Virtual Geological Outcrops. Alpha Version January 2016
 GeoPlanes Interactive Analysis of Virtual Geological Outcrops Alpha Version January 2016 1. Introduction Geoplanes is an application for interactive structural interpretation and annotation of 3D texture
Lab.4 & Assignment 2. Lab4. Conversion of Hardcopy Map to ArcGIS Map
 EATS4400 GIS Lab.4 & Assignment 2 Lab4 Conversion of Hardcopy Map to ArcGIS Map In this lab exercise you will have chance to go through the steps to convert hardcopy map into digital map for ArcGIS. Digitizing
Priming the Pump Stage II
 Priming the Pump Stage II Modeling and mapping concentration with fire response networks By Mike Price, Entrada/San Juan, Inc. The article Priming the Pump Preparing data for concentration modeling with
ArcScan for ArcGIS Tutorial
 ArcGIS 9 ArcScan for ArcGIS Tutorial Copyright 00 008 ESRI All rights reserved. Printed in the United States of America. The information contained in this document is the exclusive property of ESRI. This
Exercise Lab: Where is the Himalaya eroding? Using GIS/DEM analysis to reconstruct surfaces, incision, and erosion
 Exercise Lab: Where is the Himalaya eroding? Using GIS/DEM analysis to reconstruct surfaces, incision, and erosion 1) Start ArcMap and ensure that the 3D Analyst and the Spatial Analyst are loaded and
GEO 465/565 Lab 6: Modeling Landslide Susceptibility
 1 GEO 465/565 Lab 6: Modeling Landslide Susceptibility This lab will give you more practice in understanding and building a GIS analysis model. Recall from class lecture that a GIS analysis model is a
Tutorial 17: Desert City Tutorial
 Tutorial 17: Desert City Tutorial Table of Contents Tutorial 17: Desert city........................................... 3 2 Tutorial 17: Desert city Download items Tutorial data Tutorial PDF Prerequisites
Introducing ArcScan for ArcGIS
 Introducing ArcScan for ArcGIS An ESRI White Paper August 2003 ESRI 380 New York St., Redlands, CA 92373-8100, USA TEL 909-793-2853 FAX 909-793-5953 E-MAIL info@esri.com WEB www.esri.com Copyright 2003
BAEN 673 Biological and Agricultural Engineering Department Texas A&M University ArcSWAT / ArcGIS 10.1 Example 2
 Before you Get Started BAEN 673 Biological and Agricultural Engineering Department Texas A&M University ArcSWAT / ArcGIS 10.1 Example 2 1. Open ArcCatalog Connect to folder button on tool bar navigate
Using LIDAR to Design Embankments in ArcGIS. Written by Scott Ralston U.S. Fish & Wildlife Service Windom Wetland Management District
 Using LIDAR to Design Embankments in ArcGIS Written by Scott Ralston U.S. Fish & Wildlife Service Windom Wetland Management District This tutorial covers the basics of how to design a dike, embankment
Create a personal geodatabase
 Create a personal geodatabase To create a personal geodatabase that corresponds to the same release as the ArcGIS for Desktop client you are using, follow these steps: 1. In ArcCatalog, right-click the
Module 7 Raster operations
 Introduction Geo-Information Science Practical Manual Module 7 Raster operations 7. INTRODUCTION 7-1 LOCAL OPERATIONS 7-2 Mathematical functions and operators 7-5 Raster overlay 7-7 FOCAL OPERATIONS 7-8
Files Used in this Tutorial
 Generate Point Clouds and DSM Tutorial This tutorial shows how to generate point clouds and a digital surface model (DSM) from IKONOS satellite stereo imagery. You will view the resulting point clouds
Gridding and Contouring in Geochemistry for ArcGIS
 Gridding and Contouring in Geochemistry for ArcGIS The Geochemsitry for ArcGIS extension includes three gridding options: Minimum Curvature Gridding, Kriging and a new Inverse Distance Weighting algorithm.
Exercise 1: An Overview of ArcMap and ArcCatalog
 Exercise 1: An Overview of ArcMap and ArcCatalog Introduction: ArcGIS is an integrated collection of GIS software products for building a complete GIS. ArcGIS enables users to deploy GIS functionality
SPATIAL DATA MODELS Introduction to GIS Winter 2015
 SPATIAL DATA MODELS Introduction to GIS Winter 2015 GIS Data Organization The basics Data can be organized in a variety of ways Spatial location, content (attributes), frequency of use Come up with a system
IF YOU SAVED THE ArcMAP PROJECT FROM LAB#2 OPEN IT!
 Lab #4 Working with Fireatlas Regions in ArcInfo and ArcGIS NR506 Advanced GIS Applications in Fire Ecology and Management Objectives Understanding the Regions concept in GIS Learn a few regions commands
INTRODUCTION TO GIS WORKSHOP EXERCISE
 111 Mulford Hall, College of Natural Resources, UC Berkeley (510) 643-4539 INTRODUCTION TO GIS WORKSHOP EXERCISE This exercise is a survey of some GIS and spatial analysis tools for ecological and natural
Feature Analyst Quick Start Guide
 Feature Analyst Quick Start Guide River Extraction River extractions are much like road extractions, in that you are trying to identify a continuous object running through other features within your image.
ArcGIS. Desktop. A Selection of Time-Saving Tips and Shortcuts
 ArcGIS Desktop A Selection of Time-Saving Tips and Shortcuts Map Navigation Refresh and redraw the display F5 9.1, Suspend the map s drawing F9 9.1, Zoom in and out Roll the mouse wheel backward and forward.
ii. From the Tools menu choose Multi-Extract
 Created By: Grant J. Firl Advisors: Paul Evangelista, Jim Graham Date: November 2010 Software: ArcGIS v9.2, TUGZip v3.5 Lesson 8: Mosaicking and Clipping Landsat Data The purpose of this tutorial is to
The ArcGIS Integration, User Guide. ArcGISv1.01_GEv4.2_UK_User_Guide, 4Ed,pdf.docNumber of pages: 26 Printed:
 The ArcGIS Integration, User Guide ArcGISv1.01_GEv4.2_UK_User_Guide, 4Ed,pdf.docNumber of pages: 26 Printed: 30-04-03 GeoEnviron 4.2 Table of Contents Table of Contents Introduction...3 Development of
Welcome to NR402 GIS Applications in Natural Resources. This course consists of 9 lessons, including Power point presentations, demonstrations,
 Welcome to NR402 GIS Applications in Natural Resources. This course consists of 9 lessons, including Power point presentations, demonstrations, readings, and hands on GIS lab exercises. Following the last
An Introduction to Geographic Information Systems (GIS) using ArcGIS 9.2
 using ArcGIS 9.2") An Introduction to Geographic Information Systems (GIS) using ArcGIS 9.2 by Marcel Fortin, GIS and Map Librarian, University of Toronto Libraries, 2009 gis.maps@utoronto.ca http://www.library.utoronto.ca/maplib/
An Introduction to Geographic Information Systems (GIS) using ArcGIS 9.2 by Marcel Fortin, GIS and Map Librarian, University of Toronto Libraries, 2009 gis.maps@utoronto.ca http://www.library.utoronto.ca/maplib/
Building 3D models with the horizons method
 ARC HYDRO GROUNDWATER TUTORIALS SUBSURFACE ANALYST Building 3D models with the horizons method Arc Hydro Groundwater (AHGW) is a geodatabase design for representing groundwater datasets within ArcGIS.
General Digital Image Utilities in ERDAS
 General Digital Image Utilities in ERDAS These instructions show you how to use the basic utilities of stacking layers, converting vectors, and sub-setting or masking data for use in ERDAS Imagine 9.x
Arcgis 10 Manually Move Labels
 Arcgis 10 Manually Move Labels The "easy custom labeling" Tool in QGIS seems to come close to the ArcGIS solution. However, after I created my custom label layer I am not able to move my labels at the
Streamlining Editing Workflows. Amber Bethell
 Streamlining Editing Workflows Amber Bethell Workflow for solving geographic problems Ask a question Create or acquire data Validate and update data Analyze data Create cartographic product Act upon knowledge
Geography 281 Mapmaking with GIS Project One: Exploring the ArcMap Environment
 Geography 281 Mapmaking with GIS Project One: Exploring the ArcMap Environment This activity is designed to introduce you to the Geography Lab and to the ArcMap software within the lab environment. Please
I CALCULATIONS WITHIN AN ATTRIBUTE TABLE
 Geology & Geophysics REU GPS/GIS 1-day workshop handout #4: Working with data in ArcGIS You will create a raster DEM by interpolating contour data, create a shaded relief image, and pull data out of the