Advance XCMS Data Processing. H. Paul Benton
|
|
|
- Augustus Jacobs
- 5 years ago
- Views:
Transcription
1 Advance XCMS Data Processing H. Paul Benton
2 Reminder of what we re trying to do Peak Detection Grouping Groups similar Peaks across replicates Retention Time Alignment Statistical Analysis of Classes
3 Total Ion Chromatograms TIC pav_ _pq AN_HILIC_Aq_tissue_pos_qc1_b01.CDF pav_ _pq AN_HILIC_Aq_tissue_pos_qc1_c01.CDF pav_ _pq AN_HILIC_Aq_tissue_pos_qc1_d01.CDF pav_ _pq AN_HILIC_Aq_tissue_pos_qc1_e01.CDF pav_ _pq AN_HILIC_Aq_tissue_pos_qc1_ee01.CDF pav_ _pq AN_HILIC_Aq_tissue_pos_qc1_f01.CDF pav_ _pq AN_HILIC_Aq_tissue_pos_qc1_g01.CDF pav_ _pq AN_HILIC_Aq_tissue_pos_qc1_h01.CDF pav_ _pq AN_HILIC_Aq_tissue_pos_qc1_i01.CDF pav_ _pq AN_HILIC_Aq_tissue_pos_qc1_j01.CDF pav_ _pq AN_HILIC_Aq_tissue_pos_qc1_k01.CDF pav_ _pq AN_HILIC_Aq_tissue_pos_qc1_L_201.CDF pav_ _pq AN_HILIC_Aq_tissue_pos_qc1_L_301.CDF pav_ _pq AN_HILIC_Aq_tissue_pos_qc1_L_401.CDF pav_ _pq AN_HILIC_Aq_tissue_pos_qc1_L01.CDF pav_ _pq AN_HILIC_Aq_tissue_pos_qc1_m01.CDF pav_ _pq AN_HILIC_Aq_tissue_pos_qc1_n01.CDF pav_ _pq AN_HILIC_Aq_tissue_pos_qc1_o01.CDF pav_ _pq AN_HILIC_Aq_tissue_pos_qc1_p01.CDF pav_ _pq AN_HILIC_Aq_tissue_pos_qc1_q01.CDF pav_ _pq AN_HILIC_Aq_tissue_pos_qc1_r01.CDF pav_ _pq AN_HILIC_Aq_tissue_pos_qc2_a01.CDF pav_ _pq AN_HILIC_Aq_tissue_pos_qc2_b01.CDF pav_ _pq AN_HILIC_Aq_tissue_pos_qc3_a01.CDF pav_ _pq AN_HILIC_Aq_tissue_pos_qc3_b01.CDF pav_ _pq AN_HILIC_Aq_tissue_pos_qc4_a01.CDF pav_ _pq AN_HILIC_Aq_tissue_pos_qc4_b01.CDF Retention Time

4 Parameters Matter! step = 1 step = 0.1
5 Peak Detection Easy!
6 Right?
7 Peak detection Data comes in two types in MS : centroid & profile Generally high resolution or low resolution ~ high mass accuracy or low mass accuracy Two main choices in XCMS MatchedFilter - profile low res CentWave - centroid high res
 A hat has to fit well so it must be")
8 Hat fitting Different hat for different heads (& faces apparently) A hat has to fit well so it must be sized
9 MatchedFilter
10 MatchedFilter : wearing hats Bin of each X m/z Apply a filter function to the data Any peak above a s/n ratio is selected Peak is selected to filter baseline
11 Matched Filter : Sizing the hats Profile Data - profmethod binlinbase - profile data bin - centroid data profstep - Bin Size Peak Width - FWHM
12 Matched Filter : Sizing the hats Profile Data - profmethod binlinbase - profile data bin - centroid data profstep - Bin Size Peak Width - FWHM

13 Missiles are like ions! Kalman filtering
14 Tracking Missiles is like tracking LC-MS traces Trace backward along the trace This will define the area of the bin
15 Tracking Missiles is like tracking LC-MS traces Trace backward along the trace This will define the area of the bin
16 CentWave - ppm
17 CentWave - ppm

18 CentWave - ppm
19 CentWave 2 Regions of Interest (ROI) Found using Kalman Filter Often over estimates
20 CentWave 2 Regions of Interest (ROI) Found using Kalman Filter Often over estimates

21 Dynamic Binning
22 Find and integrate the peak Wavelet formation are then used over the ROIs to find the peak Several passes of wavelets are used until the correction fit is found (mexican hat wavelets)
23 General Principals Peak Detection Grouping Groups similar Peaks across replicates Retention Time Alignment Statistical Analysis of Classes
24 Grouping First time using all of the files Looks for closely clustered/ dense peaks across multiple files. This is a well behaved group with a peak in each replicate for each class Once peaks are grouped they re know as a group or feature

25 This would have npeak > number of samples You could play with parameters settings Global parameters :( Use different method :-)


26 Grouping = Nearest Based on mzmine grouping/alignment algorithm Uses nearest neighbor estimation.
27
28 Group.nearest RT m/z
29 Group.nearest RT m/z
30 Group.nearest RT m/z
31
32
33 General Principals Peak Detection Grouping Groups similar Peaks across replicates Retention Time Alignment Statistical Analysis of Classes
34 Retention Time alignment XCMS finds well behaved groups These include group that have missing peaks, extra peaks or perfect groups (parameters) Missing < n/2!! Median found for each group Local regression used for each sample to find the deviation profile

35 Retention time alignment - loess median rt of each well behaved group vs rt of each file A good spread of anchors/ well behaved peak groups
36 Alignment Parameters: missing = number of peaks removed from a well behaved peak group extra = Number of additional peak in a well behaved peak group span = Amount of smoothing in regression fitting! Very sensitive! ~ smaller value more local alignment, larger more global alignment.
37 Missing = 1 4 samples each
38 Extra = 1
39 Retention time alignment obiwarp John T. Prince and Edward M. Marcotte Chromatographic Alignment of ESI-LC-MS Proteomics Data Sets by Ordered Bijective Interpolated Warping Analytical Chemistry, (17), obi-warp.sourceforge.net - original program Retention time correction based on spectra similarity Doesn t rely on detected feature ~~ sort of No initial grouping needed

40 Retention time alignment obiwarp Uses a warping technique to warp data to a median chromatogram. This acts as a mold which other spectra are warped to Uses a dynamic programming to find path of greatest similarity between median chromatogram and current chromatogram
41 FillPeaks Going back to each file to find any intensity that wasn t peak picked Peak intensity from fillpeaks
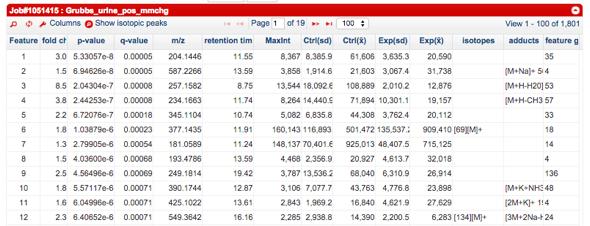
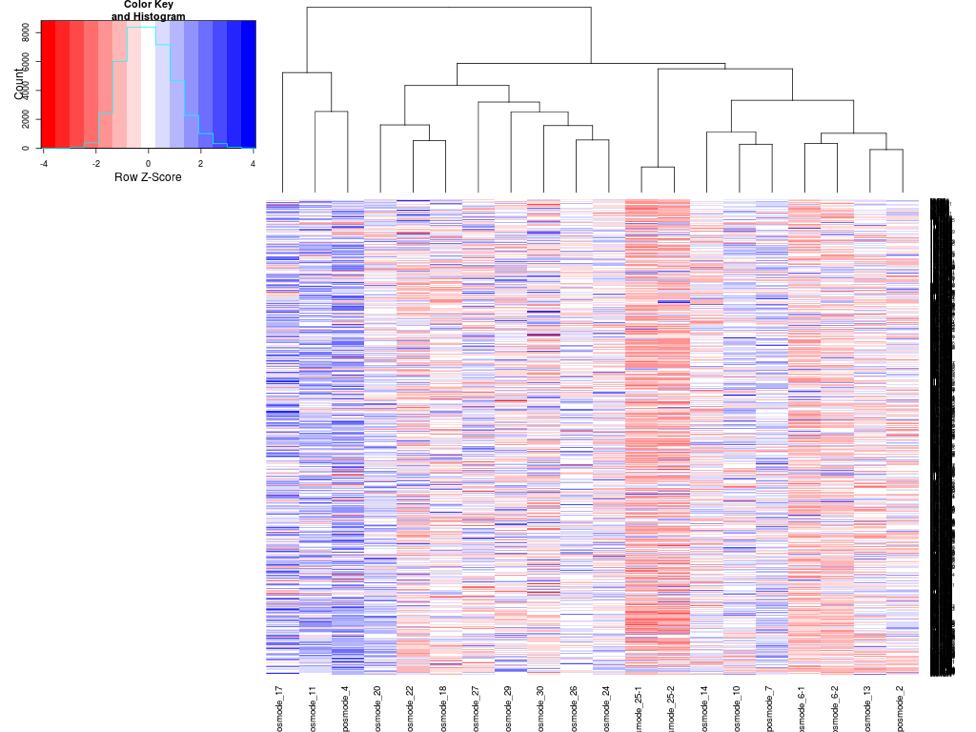
42 Finally!! We have all of our data corrected in a form we can use. Lets look at some data processing: heatmaps PCA Some Stats
43 WAIT!!!!
44 Normalisation needed?
45

46 Correlation heat map of the Bonferroni corrected ANOVA p-values
47 Summary XCMS processes LC-MS data and is complex XCMS processes LC-MS data and uses some simple algorithms. There are multiple algorithm for different jobs/data types.
48 Boxes and Foxes XCMS is all about boxes Boxes are sly and slippery and are the main problem in data analysis If you re having issues try changing alignment methods and thinking about how much deviation in m/z or RT the data has before and post alignment

49 CAMERA Same compound should be at the same retention time Same compound should have a linear relationship Using linear correlation and RT windows adducts/ isotopes are labeled

50 On-wards to biology Network maps from related metabolites


51 Thank You! Questions? Many more updates coming soon including speed and more stats Prof. Gary Siuzdak The whole xcms team Dr. Colin Smith
LC-MS Data Pre-Processing. Xiuxia Du, Ph.D. Department of Bioinformatics and Genomics University of North Carolina at Charlotte
 LC-MS Data Pre-Processing Xiuxia Du, Ph.D. Department of Bioinformatics and Genomics University of North Carolina at Charlotte Outline Raw LC-MS data - Profile and centroid data - Mass vs. retention time
Progenesis CoMet User Guide
 Progenesis CoMet User Guide Analysis workflow guidelines for version 2.0 Contents Introduction... 3 How to use this document... 3 How can I analyse my own runs using CoMet?... 3 LC-MS Data used in this
Package IPO. October 9, 2018
 Type Package Package IPO October 9, 2018 Title Automated Optimization of XCMS Data Processing parameters Version 1.6.0 Date 2017-11-22 Author , Christoph Magnes ,
Reference Manual MarkerView Software Reference Manual Revision: February, 2010
 Reference Manual MarkerView 1.2.1 Software Reference Manual - 1 - Revision: February, 2010 This document is provided to customers who have purchased AB SCIEX equipment to use in the operation of such AB
An R package to process LC/MS metabolomic data: MAIT (Metabolite Automatic Identification Toolkit)
") An R package to process LC/MS metabolomic data: MAIT (Metabolite Automatic Identification Toolkit) Francesc Fernández-Albert, Rafael Llorach, Cristina Andrés-Lacueva, Alexandre Perera June 13, 2018 1 Abstract
An R package to process LC/MS metabolomic data: MAIT (Metabolite Automatic Identification Toolkit) Francesc Fernández-Albert, Rafael Llorach, Cristina Andrés-Lacueva, Alexandre Perera June 13, 2018 1 Abstract
MRMPROBS tutorial. Hiroshi Tsugawa RIKEN Center for Sustainable Resource Science
 MRMPROBS tutorial Edited in 2014/10/6 Introduction MRMPROBS is a tool for the analysis of data from multiple reaction monitoring (MRM)- or selected reaction monitoring (SRM)-based metabolomics studies.
Progenesis CoMet User Guide
 Progenesis CoMet User Guide Analysis workflow guidelines for version 1.0 Contents Introduction... 3 How to use this document... 3 How can I analyse my own runs using CoMet?... 3 LC-MS Data used in this
Progenesis LC-MS Tutorial Including Data File Import, Alignment, Filtering, Progenesis Stats and Protein ID
 Progenesis LC-MS Tutorial Including Data File Import, Alignment, Filtering, Progenesis Stats and Protein ID 1 Introduction This tutorial takes you through a complete analysis of 9 LC-MS runs (3 replicate
OpenLynx User's Guide
 OpenLynx User s Guide OpenLynx User's Guide Version 4.0 Waters part No 715000405 Micromass Part No - 6666670 5 February, 2002 i OpenLynx User s Guide OpenLynx User s Guide The software described in this
LC-MS Peak Annotation and Identification
 LC-MS Peak Annotation and Identification with CAMERA Carsten Kuhl, Ralf Tautenhahn and Steffen Neumann October 30, 2017 1 Introduction The R-package CAMERA is a Collection of Algorithms for MEtabolite
Tutorial 2: Analysis of DIA/SWATH data in Skyline
 Tutorial 2: Analysis of DIA/SWATH data in Skyline In this tutorial we will learn how to use Skyline to perform targeted post-acquisition analysis for peptide and inferred protein detection and quantification.
Annotation of LC-MS metabolomics datasets by the metams package
 Annotation of LC-MS metabolomics datasets by the metams package Pietro Franceschi April 30, 2018 1 Introduction metams is designed to perform the analysis of LC-MS and GC-MSbased metabolomics assays. For
Retention Time Locking with the MSD Productivity ChemStation. Technical Overview. Introduction. When Should I Lock My Methods?
 Retention Time Locking with the MSD Productivity ChemStation Technical Overview Introduction A retention time is the fundamental qualitative measurement of chromatography. Most peak identification is performed
Package CorrectOverloadedPeaks
 Type Package Package CorrectOverloadedPeaks July 10, 2018 Title Correct Overloaded Peaks from GC-APCI-MS Data Version 1.2.15 Date 2018-07-10 Author Jan Lisec [aut, cre] Analyzes and modifies metabolomics
Analysis of GC-MS metabolomics data with metams
 Analysis of GC-MS metabolomics data with metams Ron Wehrens October 30, 2017 1 Introduction Many packages are available for the analysis of data from GC-MS and LC-MS experiments typically, hardware vendors
Progenesis QI for proteomics User Guide. Analysis workflow guidelines for DDA data
 Progenesis QI for proteomics User Guide Analysis workflow guidelines for DDA data Contents Introduction... 3 How to use this document... 3 How can I analyse my own runs using Progenesis QI for proteomics?...
Data processing. Filters and normalisation. Mélanie Pétéra W4M Core Team 31/05/2017 v 1.0.0
 Data processing Filters and normalisation Mélanie Pétéra W4M Core Team 31/05/2017 v 1.0.0 Presentation map 1) Processing the data W4M table format for Galaxy 2) A generic tool to filter in Galaxy a) Generic
Package HiResTEC. August 7, 2018
 Type Package Package HiResTEC August 7, 2018 Title Non-Targeted Fluxomics on High-Resolution Mass-Spectrometry Data Version 0.54 Date 2018-08-07 Maintainer Jan Lisec Identifying labeled
Package cosmiq. April 11, 2018
 Type Package Package cosmiq April 11, 2018 Title cosmiq - COmbining Single Masses Into Quantities Version 1.12.0 Author David Fischer , Christian Panse , Endre
Package xcms. April 15, 2017
 Version 1.50.1 Date 2016-12-20 Title LC/MS and GC/MS Data Analysis Package xcms April 15, 2017 Author Colin A. Smith , Ralf Tautenhahn , Steffen Neumann ,
SUPPLEMENTARY INFORMATION
 Electronic Supplementary Material (ESI) for Analytical Methods. This journal is The Royal Society of Chemistry 2015 1 SUPPLEMENTARY INFORMATION 2 3 4 5 6 7 8 9 10 11 12 13 14 15 16 17 18 19 20 21 22 23
MS data processing. Filtering and correcting data. W4M Core Team. 22/09/2015 v 1.0.0
 MS data processing Filtering and correcting data W4M Core Team 22/09/2015 v 1.0.0 Presentation map 1) Processing the data W4M table format for Galaxy 2) Filters for mass spectrometry extracted data a)
QuiC 1.0 (Owens) User Manual
 User Manual") QuiC 1.0 (Owens) User Manual 1 Contents 2 General Information... 2 2.1 Computer System Requirements... 2 2.2 Scope of QuiCSoftware... 3 2.3 QuiC... 3 2.4 QuiC Release Features... 3 2.4.1 QuiC 1.0... 3
QuiC 1.0 (Owens) User Manual 1 Contents 2 General Information... 2 2.1 Computer System Requirements... 2 2.2 Scope of QuiCSoftware... 3 2.3 QuiC... 3 2.4 QuiC Release Features... 3 2.4.1 QuiC 1.0... 3
Retention time prediction with irt for scheduled MRM and SWATH MS
 Retention time prediction with irt for scheduled MRM and SWATH MS EuPa course, 28.11.2013 Oliver Rinner, PhD CEO Biognosys Summary Why to schedule MRM acquisition? How to schedule? Prediction of retention
MRMPROBS tutorial. Hiroshi Tsugawa RIKEN Center for Sustainable Resource Science MRMPROBS screenshot
 MRMPROBS tutorial Edited in 2016/11/16 Introduction MRMPROBS is launched as a universal program for targeted metabolomics using not only multiple reaction monitoring (MRM)- or selected reaction monitoring
High-throughput Processing and Analysis of LC-MS Spectra
 High-throughput Processing and Analysis of LC-MS Spectra By Jianguo Xia (jianguox@ualberta.ca) Last update : 02/05/2012 This tutorial shows how to process and analyze LC-MS spectra using methods provided
Statistical Process Control in Proteomics SProCoP
 Statistical Process Control in Proteomics SProCoP This tutorial will guide you through the installation of SProCoP and using it to perform statistical analysis on a sample Skyline file. Getting Started
TraceFinder Analysis Quick Reference Guide
 TraceFinder Analysis Quick Reference Guide This quick reference guide describes the Analysis mode tasks assigned to the Technician role in the Thermo TraceFinder 3.0 analytical software. For detailed descriptions
Direct Infusion Mass Spectrometry Processing (DIMaSP) Instructions for use
 Instructions for use") Direct Infusion Mass Spectrometry Processing (DIMaSP) Instructions for use The following instructions assume the user has a batch of paired sample and blank spectra that have been exported to a comma-separated
Direct Infusion Mass Spectrometry Processing (DIMaSP) Instructions for use The following instructions assume the user has a batch of paired sample and blank spectra that have been exported to a comma-separated
To get started download the dataset, unzip files, start Maven, and follow steps below.
 Getting Started. This document provides basic overview of Maven functionality. For the purpose of demonstration we will use an example CMV Viral Infection time course dataset. (Dataset Download). There
Protein Deconvolution Quick Start Guide
 Protein Deconvolution Quick Start Guide The electrospray ionization (ESI) of intact peptides and proteins produces mass spectra containing a series of multiply charged ions with associated mass-to-charge
BIOINF 4399B Computational Proteomics and Metabolomics
 BIOINF 4399B Computational Proteomics and Metabolomics Sven Nahnsen WS 13/14 6. Quantification Part II Overview Label-free quantification Definition of features Feature finding on centroided data Absolute
Tutorial 7: Automated Peak Picking in Skyline
 Tutorial 7: Automated Peak Picking in Skyline Skyline now supports the ability to create custom advanced peak picking and scoring models for both selected reaction monitoring (SRM) and data-independent
Resting state network estimation in individual subjects
 Resting state network estimation in individual subjects Data 3T NIL(21,17,10), Havard-MGH(692) Young adult fmri BOLD Method Machine learning algorithm MLP DR LDA Network image Correlation Spatial Temporal
Package envipick. June 6, 2016
 Type Package Package envipick June 6, 2016 Title Peak Picking for High Resolution Mass Spectrometry Data Version 1.5 Date 2016-06-03 Author Maintainer Sequential partitioning, clustering
QuantWiz: A Parallel Software Package for LC-MS-based Label-free Protein Quantification
 2009 11th IEEE International Conference on High Performance Computing and Communications QuantWiz: A Parallel Software Package for LC-MS-based Label-free Protein Quantification Jing Wang 1, Yunquan Zhang
Thermo Xcalibur Getting Started (Quantitative Analysis)
") Thermo Xcalibur Getting Started (Quantitative Analysis) XCALI-97207 Revision B September 2010 2010 Thermo Fisher Scientific Inc. All rights reserved. Xcalibur, Surveyor, and Accela are registered trademarks
Thermo Xcalibur Getting Started (Quantitative Analysis) XCALI-97207 Revision B September 2010 2010 Thermo Fisher Scientific Inc. All rights reserved. Xcalibur, Surveyor, and Accela are registered trademarks
Adaptive Processing of LC/MS Metabolomics data
 Adaptive Processing of LC/MS Metabolomics data Tianwei Yu August 1, 2012 1. Introduction The aplcms package is designed for the processing of high resolution LC/MS data. The main characteristics include:
R-software multims-toolbox. (User Guide)
") R-software multims-toolbox (User Guide) Pavel Cejnar 1, Štěpánka Kučková 2 1 Department of Computing and Control Engineering, Institute of Chemical Technology, Technická 3, 166 28 Prague 6, Czech Republic,
R-software multims-toolbox (User Guide) Pavel Cejnar 1, Štěpánka Kučková 2 1 Department of Computing and Control Engineering, Institute of Chemical Technology, Technická 3, 166 28 Prague 6, Czech Republic,
TraceFinder Administrator Quick Reference Guide
 TraceFinder Administrator Quick Reference Guide This quick reference guide discusses the application configuration tasks assigned to the ITAdmin and LabDirector roles when user security is activated in
Labelled quantitative proteomics with MSnbase
 Labelled quantitative proteomics with MSnbase Laurent Gatto lg390@cam.ac.uk Cambridge Centre For Proteomics University of Cambridge European Bioinformatics Institute (EBI) 18 th November 2010 Plan 1 Introduction
BIOINFORMATICS. A geometric approach for the alignment of liquid chromatography mass spectrometry data
 BIOINFORMATICS Vol. 23 ISMB/ECCB 2007, pages i273 i281 doi:10.1093/bioinformatics/btm209 A geometric approach for the alignment of liquid chromatography mass spectrometry data Eva Lange 1, *, Clemens Gröpl
Data Processing for Small Molecules
 Data Processing for Small Molecules Basic Metabolomics Workflows Metabolomics: the apogee of the omics trilogy Gary J. Patti, Oscar Yanes and Gary Siuzdak Molecular Cell Biology, 2012, 13, 263-269 MATTHEW
Agilent MassHunter Qualitative Data Analysis
 Agilent MassHunter Qualitative Data Analysis Qualitative Navigator B.08.00 Presenters: Kevin Costalunga Stephen Harnos With Matt Leyden & Kevin Costalunga 1 MassHunter Webinar Series MassHunter Qualitative
User Manual MarkerView Software User Manual Revision: February, 2010
 User Manual MarkerView 1.2.1 Software User Manual - 1 - Revision: February, 2010 This document is provided to customers who have purchased AB SCIEX equipment to use in the operation of such AB SCIEX equipment.
Skyline High Resolution Metabolomics (Draft)
") Skyline High Resolution Metabolomics (Draft) The Skyline Targeted Proteomics Environment provides informative visual displays of the raw mass spectrometer data you import into your Skyline documents. Originally
Skyline High Resolution Metabolomics (Draft) The Skyline Targeted Proteomics Environment provides informative visual displays of the raw mass spectrometer data you import into your Skyline documents. Originally
Parametric time warping of peaks with the ptw package
 Parametric time warping of peaks with the ptw package Ron Wehrens Tom Bloemberg Paul Eilers May 25, 2018 1 Introduction In many fields of science one can find examples where similar events are not occuring
Improved Centroid Peak Detection and Mass Accuracy using a Novel, Fast Data Reconstruction Method
 Overview Improved Centroid Peak Detection and Mass Accuracy using a Novel, Fast Data Reconstruction Method James A. Ferguson 1, William G. Sawyers 1, Keith A. Waddell 1, Anthony G. Ferrige 2, Robert Alecio
Fmri Spatial Processing
 Educational Course: Fmri Spatial Processing Ray Razlighi Jun. 8, 2014 Spatial Processing Spatial Re-alignment Geometric distortion correction Spatial Normalization Smoothing Why, When, How, Which Why is
Guidelines for Setting Auto-Peak Width in ApexTrack Processing Methods and its Effect on USP Resolution and USP Plate Count
 TECN10008147 New Doc. No. Rev. 01 Page 1 of 6 Guidelines for Setting Auto-Peak Width in ApexTrack Processing Methods and its Effect on USP Resolution and USP Plate Count The information in this article
MS-FINDER tutorial. Last edited in Aug 10, 2018
 MS-FINDER tutorial Last edited in Aug 10, 2018 Abstract The purpose of metabolomics is to perform the comprehensive analysis for small biomolecules of living organisms. Gas chromatography coupled with
Preprocessing, Management, and Analysis of Mass Spectrometry Proteomics Data
 Preprocessing, Management, and Analysis of Mass Spectrometry Proteomics Data * Mario Cannataro University Magna Græcia of Catanzaro, Italy cannataro@unicz.it * Joint work with P. H. Guzzi, T. Mazza, P.
MassChroQ manual. Mass Chromatogram Quantication software
 MassChroQ manual Mass Chromatogram Quantication software Plateforme d'analyse Protéomique de Paris Sud-Ouest MassChroQ manual Third edition for MassChroQ version 2.0 Spectacled Caiman Author: Edlira Nano
QuiC 2.1 (Senna) User Manual
 User Manual") QuiC 2.1 (Senna) User Manual 1 Contents 2 General Information... 3 2.1 Computer System Requirements... 3 2.2 Scope of QuiC Software... 4 2.2.1 QuiC Licensing... 5 2.3 QuiC Release Features... 5 2.3.1 QuiC
QuiC 2.1 (Senna) User Manual 1 Contents 2 General Information... 3 2.1 Computer System Requirements... 3 2.2 Scope of QuiC Software... 4 2.2.1 QuiC Licensing... 5 2.3 QuiC Release Features... 5 2.3.1 QuiC
NMRProcFlow Macro-command Reference Guide
 NMRProcFlow Macro-command Reference Guide This document is the reference guide of the macro-commands Daniel Jacob UMR 1332 BFP, Metabolomics Facility CGFB Bordeaux, MetaboHUB - 2018 1 NMRProcFlow - Macro-command
Machine Learning in the Wild. Dealing with Messy Data. Rajmonda S. Caceres. SDS 293 Smith College October 30, 2017
 Machine Learning in the Wild Dealing with Messy Data Rajmonda S. Caceres SDS 293 Smith College October 30, 2017 Analytical Chain: From Data to Actions Data Collection Data Cleaning/ Preparation Analysis
What s New in Empower 3
 What s New in Empower 3 Revision A Copyright Waters Corporation 2010 All rights reserved Copyright notice 2010 WATERS CORPORATION. PRINTED IN THE UNITED STATES OF AMERICA AND IN IRELAND. ALL RIGHTS RESERVED.
Skyline irt Retention Time Prediction
 Skyline irt Retention Time Prediction Predicting peptide retention time has long been of interest in targeted proteomics. As early as version 0.2, Skyline integrated the SSRCalc hydrophobicity calculator
Package biosigner. March 6, 2019
 Type Package Title Signature discovery from omics data Version 1.10.0 Date 2018-04-15 Package biosigner March 6, 2019 Author Philippe Rinaudo , Etienne Thevenot
Package stattarget. December 5, 2017
 Type Package Title Statistical Analysis of Metabolite Profile Version 1.8.0 Author Hemi Luan Maintainer Hemi Luan Depends R (>= 3.3.0) Package stattarget December 5, 2017 Imports
Real-time Data Compression for Mass Spectrometry Jose de Corral 2015 GPU Technology Conference
 Real-time Data Compression for Mass Spectrometry Jose de Corral 2015 GPU Technology Conference 2015 Waters Corporation 1 Introduction to LC/IMS/MS LC/IMS/MS is the combination of three analytical techniques
MALDIquant: Quantitative Analysis of Mass Spectrometry Data
 MALDIquant: Quantitative Analysis of Mass Spectrometry Data Sebastian Gibb November 12, 2017 Abstract MALDIquant provides a complete analysis pipeline for MALDI- TOF and other 2D mass spectrometry data.
Skyline Targeted MS/MS
 Skyline Targeted MS/MS Skyline now supports several methods of extracting chromatography-based quantitative measurements from the raw data files of full-scan mass spectrometers, such as ion trap and Q-TOF
Metabolomic Data Analysis with MetaboAnalyst
 Metabolomic Data Analysis with MetaboAnalyst User ID: guest6522519400069885256 April 14, 2009 1 Data Processing and Normalization 1.1 Reading and Processing the Raw Data MetaboAnalyst accepts a variety
Validation of a Direct Analysis in Real Time Mass Spectrometry (DART-MS) Method for the Quantitation of Six Carbon Sugar in Saccharification Matrix
 Method for the Quantitation of Six Carbon Sugar in Saccharification Matrix") Validation of a Direct Analysis in Real Time Mass Spectrometry (DART-MS) Method for the Quantitation of Six Carbon Sugar in Saccharification Matrix Daudi Saang onyo, a,b Gary Selby b and Darrin L. Smith*
Validation of a Direct Analysis in Real Time Mass Spectrometry (DART-MS) Method for the Quantitation of Six Carbon Sugar in Saccharification Matrix Daudi Saang onyo, a,b Gary Selby b and Darrin L. Smith*
Automated AFM Image Processing User Manual
 Automated AFM Image Processing User Manual Starting The Program Open and run the GUI_run_me.m script in Matlab to start the program. The first thing to do is to select the folder that contains the images
An R package to process LC/MS metabolomic data: MAIT (Metabolite Automatic Identification Toolkit)
") An R package to process LC/MS metabolomic data: MAIT (Metabolite Automatic Identification Toolkit) Francesc Fernández-Albert Polytechnic University of Catalonia University of Barcelona Rafael Llorach University
An R package to process LC/MS metabolomic data: MAIT (Metabolite Automatic Identification Toolkit) Francesc Fernández-Albert Polytechnic University of Catalonia University of Barcelona Rafael Llorach University
Curatr: a web application for creating, curating, and sharing a mass spectral library
 Curatr: a web application for creating, curating, and sharing a mass spectral library Andrew Palmer (1), Prasad Phapale (1), Dominik Fay (1), Theodore Alexandrov (1,2) (1) European Molecular Biology Laboratory,
Package stattarget. December 23, 2018
 Type Package Title Statistical Analysis of Molecular Profiles Version 1.12.0 Author Hemi Luan Maintainer Hemi Luan Depends R (>= 3.3.0) Package stattarget December 23, 2018 Imports
To 3D or not to 3D? Why GPUs Are Critical for 3D Mass Spectrometry Imaging Eri Rubin SagivTech Ltd.
 To 3D or not to 3D? Why GPUs Are Critical for 3D Mass Spectrometry Imaging Eri Rubin SagivTech Ltd. Established in 2009 and headquartered in Israel Core domain expertise: GPU Computing and Computer Vision
Mnova Training Basics
 Mnova Training Basics Version 12.0.3 Oct. 23, 2018 Chen Peng, PhD, VP of Business Development, North America & Asia Mestrelab Research SL chen.peng@mestrelab.com 858.736.4563 Main Topics Installation and
This manual describes step-by-step instructions to perform basic operations for data analysis.
 HDXanalyzer User Manual The program HDXanalyzer is available for the analysis of the deuterium exchange mass spectrometry data obtained on high-resolution mass spectrometers. Currently, the program is
Andreas Reimann Berlin im Juli 2009
 Agilent Technologies ASMS 2009 Andreas Reimann Berlin im Juli 2009 New Triple Quad LC/MS Portfolio 6410, 6430 & 6460 Page 2 Comparison of 6400 Series QQQs 6410BA 6430 6460 Sensitivity: 1 pg reserpine S/N
Large and Sparse Mass Spectrometry Data Processing in the GPU Jose de Corral 2012 GPU Technology Conference
 Large and Sparse Mass Spectrometry Data Processing in the GPU Jose de Corral 2012 GPU Technology Conference 2012 Waters Corporation 1 Agenda Overview of LC/IMS/MS 3D Data Processing 4D Data Processing
Skyline MS1 Full Scan Filtering
 Skyline MS1 Full Scan Filtering The Skyline Targeted Proteomics Environment provides informative visual displays of the raw mass spectrometer data you import into your Skyline project. These displays allow
The organization of the human cerebral cortex estimated by intrinsic functional connectivity
 1 The organization of the human cerebral cortex estimated by intrinsic functional connectivity Journal: Journal of Neurophysiology Author: B. T. Thomas Yeo, et al Link: https://www.ncbi.nlm.nih.gov/pubmed/21653723
Chromeleon / MSQ Plus Operator s Guide Document No Revision 03 October 2009
 MSQ Plus Chromeleon / MSQ Plus Operator s Guide Document No. 065322 Revision 03 October 2009 Chromeleon / MSQ Plus Operator s Guide 2009 by Dionex Corporation All rights reserved worldwide. Printed in
1. What software do I need for itraq or TMT? : Quantitation FAQ 2009 Matrix Science
 Quantitation FAQ 1 1. What software do I need for itraq or TMT? In Mascot, the quantitation approach used for itraq and TMT is called the Reporter protocol. All of the information required to perform quantitation
Corra v2.0 User s Guide
 Corra v2.0 User s Guide Corra is an open source software Licensed under the Apache License, Version 2.0 and it s source code, demo data and this guide can be downloaded at the http://tools.proteomecenter.org/corra/corra.html.
Fusion AE LC Method Validation Module. S-Matrix Corporation 1594 Myrtle Avenue Eureka, CA USA Phone: URL:
 Fusion AE LC Method Validation Module S-Matrix Corporation 1594 Myrtle Avenue Eureka, CA 95501 USA Phone: 707-441-0404 URL: www.smatrix.com Regulatory Statements and Expectations ICH Q2A The objective
Package Metab. September 18, 2018
 Version 1.14.0 Date 2013-10-11 Package Metab September 18, 2018 Title Metab: An R Package for a High-Throughput Analysis of Metabolomics Data Generated by GC-MS. Author Raphael Aggio
Xcalibur Library Browser
 Thermo Xcalibur Library Browser User Guide Creating and Searching Spectral Libraries Software Version 3.0 XCALI-97552 Revision A June 2013 2013 Thermo Fisher Scientific Inc. All rights reserved. Xcalibur
Getting low-resolution GC-MS data on the JEOL GCMate Introduction
 Getting low-resolution GC-MS data on the JEOL GCMate Introduction GC-MS is a technique that combines gas phase separation and mass-based detection/characterization of analytes. It s a very sensitive method
UNIT 2. DATA PREPROCESSING AND ASSOCIATION RULES
 UNIT 2. DATA PREPROCESSING AND ASSOCIATION RULES Data Pre-processing-Data Cleaning, Integration, Transformation, Reduction, Discretization Concept Hierarchies-Concept Description: Data Generalization And
Agilent MSD Productivity ChemStation G1701 & G1710. Performance Report Parameters
 Agilent MSD Productivity ChemStation G1701 & G1710 Performance Report Parameters Notices Agilent Technologies, Inc. 2012 No part of this manual may be reproduced in any form or by any means (including
REVIEW. MassFinder 3. Navigation of the Chromatogram
 REVIEW MassFinder 3 Dr. Detlev H. Hochmuth, Author Hochmuth Scientific Consulting Hamburg, Germany http://www.massfinder.com Euro 1850, which includes latest version of MassFinder 3, a terpene spectral
TraceFinder Shortcut Menus Quick Reference Guide
 TraceFinder Shortcut Menus Quick Reference Guide This quick reference guide describes the right-click shortcut menus available in the Thermo TraceFinder application. Contents Acquisition Mode Analysis
EPBscore user guide. Requirements:
 EPBscore user guide Requirements: Up to Matlab 2014a. Windows-only versions (both 32- and 64-bit) were tested. Toolboxes: Control, Images, Local, Matlab, Optim, Shared, Signal, Simulink, Stats, Wavelet
Data Preprocessing Yudho Giri Sucahyo y, Ph.D , CISA
 Obj ti Objectives Motivation: Why preprocess the Data? Data Preprocessing Techniques Data Cleaning Data Integration and Transformation Data Reduction Data Preprocessing Lecture 3/DMBI/IKI83403T/MTI/UI
PRM Method Development and Data Analysis with Skyline. With
 Tutorial Webinar #17 PRM Method Development and Data Analysis with Skyline With Brendan MacLean (Principal Developer, Skyline) Eduard Sabidó, Ph.D. (Head of the UPF/CRG Proteomics Unit) Cristina Chiva,
Tackling Latency via Replication in Distributed Systems
 Tackling Latency via Replication in Distributed Systems Zhan Qiu, Imperial College London Juan F. Pe rez, University of Melbourne Peter G. Harrison, Imperial College London ACM/SPEC ICPE 2016 15 th March,
Quick Guide to the Star Bar
 Saturn View Saturn Writer Quick Guide to the Star Bar Last active Chromatogram in SaturnView Last active method in the Method Editor Click with the right mouse button on the Star Bar to get this menu Sample,
Agilent EZChrom Elite. PDA Analysis
 Agilent EZChrom Elite PDA Analysis Notices Copyright Scientific Software, Inc 1997-2003 Agilent Technologies, Inc. 2006. No part of this manual may be reproduced in any form or by any means (including
MS-FINDER tutorial. Last edited in Sep. 10, 2018
 MS-FINDER tutorial Last edited in Sep. 10, 2018 Abstract The purpose of metabolomics is to perform the comprehensive analysis for small biomolecules of living organisms. Gas chromatography coupled with
Supplementary Figure 1. Decoding results broken down for different ROIs
 Supplementary Figure 1 Decoding results broken down for different ROIs Decoding results for areas V1, V2, V3, and V1 V3 combined. (a) Decoded and presented orientations are strongly correlated in areas
Agilent G6854 MassHunter Personal Pesticide Database
 Agilent G6854 MassHunter Personal Pesticide Database Quick Start Guide What is MassHunter Personal Pesticide Database? 2 Installation 3 Main Window 4 Getting Started 11 Database operations 12 Searching
Computer Vision. Recap: Smoothing with a Gaussian. Recap: Effect of σ on derivatives. Computer Science Tripos Part II. Dr Christopher Town
 Recap: Smoothing with a Gaussian Computer Vision Computer Science Tripos Part II Dr Christopher Town Recall: parameter σ is the scale / width / spread of the Gaussian kernel, and controls the amount of
Agilent G6854AA MassHunter Personal Pesticide Database Kit Quick Start Guide
 Agilent G6854AA MassHunter Personal Pesticide Database Kit Quick Start Guide What is the MassHunter Personal Pesticide Database Kit? 1 Kit Content 2 Where to find more information 3 Before You Begin 4
RMassBank for XCMS. Erik Müller. January 4, Introduction 2. 2 Input files LC/MS data Additional Workflow-Methods 2
 RMassBank for XCMS Erik Müller January 4, 2019 Contents 1 Introduction 2 2 Input files 2 2.1 LC/MS data........................... 2 3 Additional Workflow-Methods 2 3.1 Options..............................
Public Cloud Leverage For IT/Business Alignment Business Goals Agility to speed time to market, adapt to market demands Elasticity to meet demand whil
 LHC2386BU True Costs Savings Modeling and Costing A Migration to VMware Cloud on AWS Chris Grossmeier chrisg@cloudphysics.com John Blumenthal john@cloudphysics.com #VMworld Public Cloud Leverage For IT/Business