HONORS ACTIVITY #2 EXPONENTIAL GROWTH & DEVELOPING A MODEL
|
|
|
- Jesse Melton
- 5 years ago
- Views:
Transcription
1 Name HONORS ACTIVITY #2 EXPONENTIAL GROWTH & DEVELOPING A MODEL SECTION I: A SIMPLE MODEL FOR POPULATION GROWTH Goal: This activity introduces the concept of a model using the example of a simple population growth process. It also explores the nature of exponential growth and the implications of this kind of growth for global population issues. After completing this activity, you should: understand the concept, causes, and implications of exponential growth be able to interpret the meaning of a data relationship plotted on arithmetic and semi-log graphs PART I-A: WHAT IS EXPONENTIAL GROWTH? Human populations grow exponentially. What exactly do we mean by this? Why does it happen? How can exponential growth be depicted in a figure or graph? Finally, what are the implications of exponential growth? And why should we be concerned about it? The following exercise will allow you to discover the answers to these questions. *************************** First, let's think about what it means for something to grow. "To grow" is to increase in size by assimilating material into a living organism or by adding or accreting more material to the original mass of some entity (e.g., world population). Growth takes place in time, so we can describe the amount of growth that takes place as a growth rate, or an increment of growth which takes place during a specified period of time. Growth over time can be depicted graphically by plotting the magnitude or size of whatever is growing against time on two axes of a graph. When we try to think about the size of the world's population (about 5.7 billion in mid-1995) and then try to imagine it growing even larger, it is hard for us to grasp such huge numbers. So let's start examining the concept of growth with something very familiar. Instead of looking at the growth in size of an entity composed of many organisms (like world population) we'll look at the growth of a single organism -- your own body's height and how your height has grown over time. Graphing Growth -- an Introduction In this activity you will construct a rough graph of your own growth (change in height) -- and expected growth -- from the day you were born (age 0) to your projected height at age 40. To do this you'll need to make some rough (but reasonable) guesses of about how tall you were (or will be) at different points in time: as a newborn, at 6 months, 1 year, 2 years, 5 years, 10 years, and so on. [Fill in this table with your height estimates, then plot the data in the table on the graph below and smoothly connect each data point with a line.] Age (years) 0 6 mo Height (inches)

2 Graph for plotting height / age data from table on previous page: 1. Is it possible to draw a single straight line through all 12 of the data points? 2. Some portions of the line you have drawn are more vertical and some more horizontal. What do these portions of the graph reveal about your rate of growth at these points in time? 2. The graph you have just constructed illustrates a growth process that is characterized by varying growth rates at different points in time. Your height increased in spurts during some periods of time, increased more gradually during others, and leveled off in growth during some years. In fact, as you eventually enter into your golden years, you might even find that your height begins to decrease a bit (or experience "negative" growth). Answer the following: 3. Which segments of the graph represent the fastest growth rates? 4. Which represent the slowest growth rates? 5. If you extend the graph into your future at age 80, what will the growth curve probably look like? 6. Propose some explanations for the varying shapes of the different segments of your height growth curve over time. 6.
3 Linear and Nonlinear Changes 7. If babies, children, teens, adults, and the elderly all grew at exactly the same rate for each increment of time throughout a human life cycle (e.g., 2 inches every year), describe in words how the graph would differ from the one you just drew and make a small sketch of what it would look like: 7. In humans, a constant growth rate of 2 inches per year is not realistic. However, if we assume such a rate we can easily describe in words the relationship between age and height for a constant growth rate of 2 inches per year: In words: "Your height after a specified number of years (age) is equal to your initial 'newborn' height (when age = 0), plus 2 inches for each additional year of growth." In equation form: height in inches = initial height in inches + (age in yrs x 2 inches per yr) In symbols: y = a + bx where y is height in inches x is age in years a is your initial height (in inches) as a newborn b is the growth rate in inches/years, b = 2 in our example 8. You've demonstrated in your graph that people do not grow taller continuously over time at a constant growth rate, hence our equation y = a + 2x is an unrealistic one. To illustrate how unrealistic it is, use it to calculate your height (y) at age x = 60, if you were born having an initial height of a = 12 inches. Your answer: inches = feet!! We say that growth is linear when the change in magnitude each year is directly proportional to the change in time, and we describe such a relationship between time and growth as a linear relationship. However, as seen on the graph you produced, the actual growth of a baby to adulthood cannot be depicted with a perfectly straight line or by a simple linear equation. Hence we call it a nonlinear relationship. The growth rate varies over time, making it difficult to predict future growth either graphically or by using an equation. The same cautions apply when trying to project future growth in world population. Determining the causes for different growth rates of the world's population at different times in history is even more problematic because of all of the variables that are involved. Later we will speculate on some possible causes of changing rates of world population growth, but first we need to familiarize ourselves with how a population grows and what a graph of population growth looks like. Exponential Growth (Read pp in SGC-II Hobson (second half of the SGC textbook) on "Resources Use and Exponential Growth") Some things grow, not by adding the same amount of growth over each increment of time arithmetically, but by adding an amount of growth that is based on a percentage of the entity's magnitude at each point in time. This is called exponential growth and anything that grows by a percentage of its starting amount will grow exponentially. Human populations, like savings accounts, grow exponentially. In 1995 world population was growing at a rate of about 1.5% annually, with less developed countries growing at a rate of about 2.2% and more developed countries growing at a rate of only 0.2% A two percent population growth per year doesn't sound like much, but over a period of 250 years, a human population growing at that rate will multiply its original size 141 times!
 contains a very unique and prolific type of organism that has the ability, by")
4 We'll now use a very simple example with manageable quantities to illustrate and graph how a population grows exponentially. Exponential Growth of an Imaginary Population Imagine that a glass "Critter Jar" (see it illustrated on the next page) contains a very unique and prolific type of organism that has the ability, by mating, to reproduce and generate two new mature (and ready to mate) organisms every minute. One new male and one new female critter are always produced in each mating session between a critter couple. You are part of a research team who must observe and describe the change in population of these prolific critters for a 5 minute period. Your observations will begin as soon as you introduce two ready-to-mate critters to the jar, hence the initial conditions of your experiment will be 2 critters. a) Add the appropriate number of new critters to the jar at the end of each minute, based on how many "couples" are in the jar at the beginning of the minute. (After each "minute" time step, shade in a box for each critter in the "Critter Jar" on the next page.) b) Count up the total number of individuals in the jar at the end of each "imaginary" minute. c) As the jar is filling, note when it is HALF FULL. d) Tabulate the results in the table provided below. e) Plot the data in the table on the graph provided at right. Here are the table and graph needed to record your results: Time # of New Critters (births) added to the jar each minute TOTAL Population (# of Critters) in jar at end of each minute initial state min 2 min 3 min 4 min 5 min 9. What's the ratio of the # of new births each minute to the total # of critters in the population at the end of the previous minute? (This ratio is called the BIRTH RATE) 10. By what percentage do the critters in the jar grow each minute? (express the ratio in #9 as a percentage) 11. After how many minutes into the process was the jar half full? 12. How many more minutes after this did it take the jar to get completely filled? 13. The longer something grows at an exponential growth rate, the growth over the next increment of time becomes: [ more dramatic / less dramatic ] (circle one) 14. If you obtained a larger jar and continued your observation for 5 more minutes, describe in words what the graph of critter population growth would look like after 10 minutes: 14.

5 When values increase so rapidly due to exponential growth that you run out of room on your graph, we often use logarithmic or semilogarithmic graphs to plot the data. The two graphs you've already constructed were plotted on graph paper having an arithmetic scale which shows equal amounts of change along each axis. This means that the distance between 1 and 2 along the graph's axis is the same distance that is between 2 and 3, 3 and 4, and so on. When exponential growth is plotted on such a graph we quickly run off the scale of the graph. To remedy this we can use a logarithmic scale which shows the percent of change along the axis rather than the arithmetic amount of change. A logarithmically scaled graph compresses large numbers in a systematic way. On a log scale, the distance between 1 and 10 is the same as that between 10 and 100, between 100 and 1,000, etc. The distance between 1 and 2 is also the same as between 2 and 4, between 4 and 8, between 8 and 16, etc., which means that a quantity that keeps doubling every so many years will appear to be growing as a straight line if population is graphed on a logarithmic scale and time is graphed on an arithmetic scale. We call a graph that has an arithmetic scale along one axis and a logarithmic scale along the other a semi-log graph Plot the same critter population data collected earlier on this semi-log graph with time on the arithmetic axis and population on the logarithmic axis. Draw a line through your data points. An equation can be used to describe this line, therefore we can say that the relationship between time and the logarithmically graphed critter population is linear. In other words, even exponential growth can occur as a linear relationship with time when the percent change in magnitude for each increment of time is constant. In our critter population exercise, the growth rate remained constant over each time increment because the number of critters doubled (i.e., increased by 100%) each minute. 16. If the percent change in population growth had been different from one minute to the next, how might this alter the appearance of this graph?
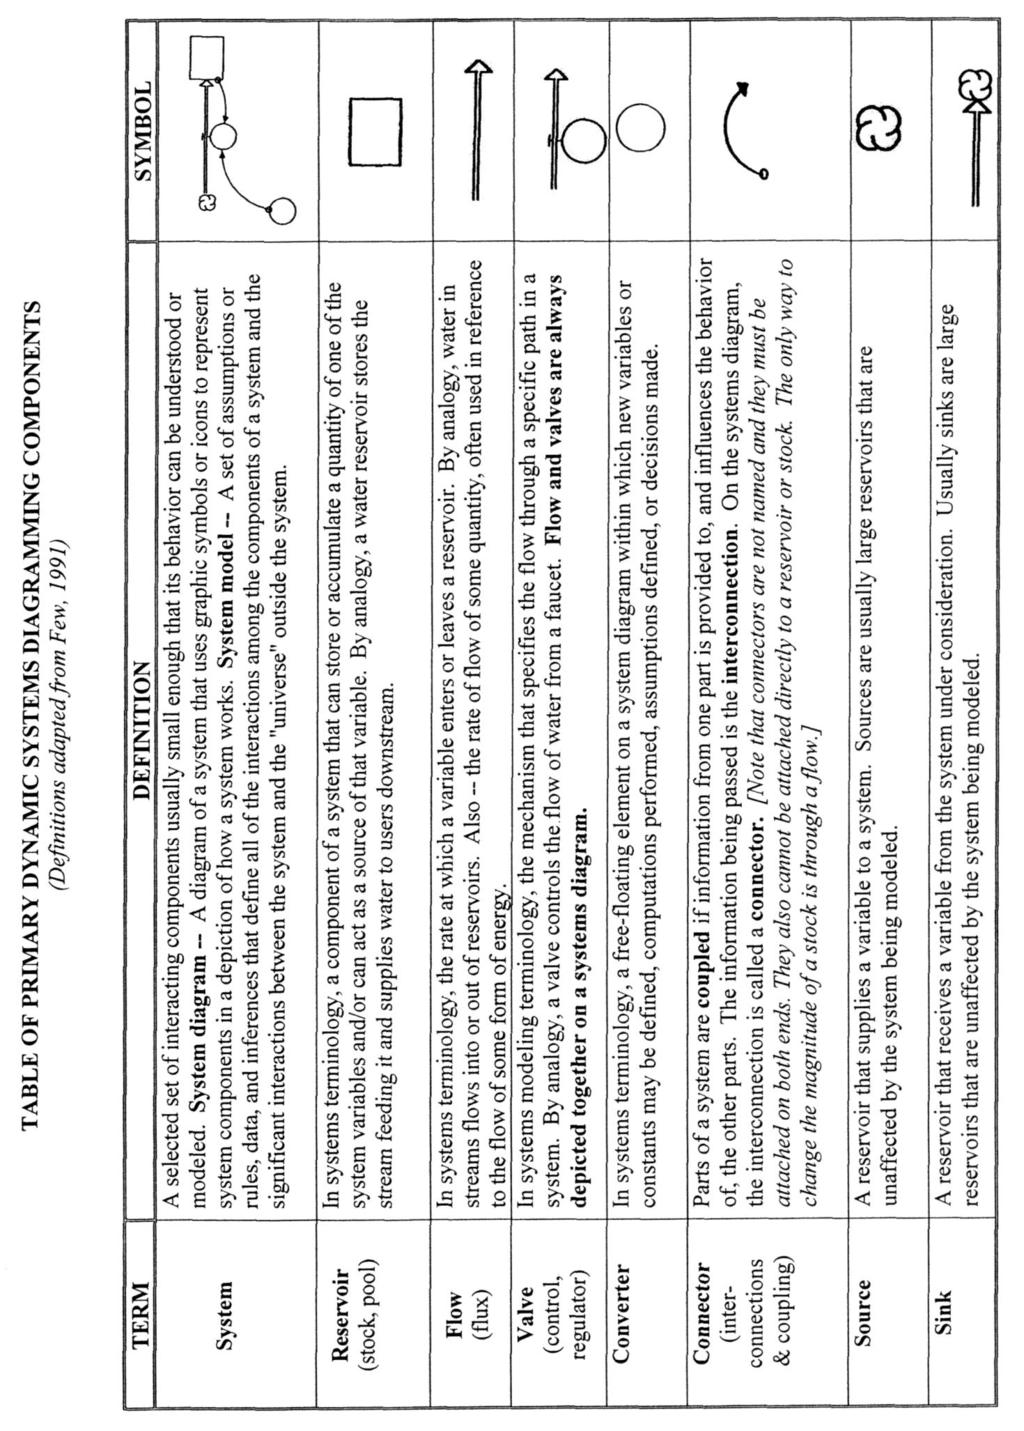
6 SECTION II: EXPLORING THE HOW AND WHY OF GLOBAL POPULATION CHANGE: SIMPLE MODELS... COMPLEX REALITY Goal: This activity introduces a simple analog model of population change using dynamic systems modeling terminology and diagrams. It can be a launching point for discovery and exploration of the complexity of variables, models, theories, and solutions that surround global population issues. Learning Outcomes: After completing this you should: understand the concept of a model and be able to critique the usefulness and limitations of modeling be able to construct and explain a simple conceptual model of population change using dynamic systems modeling diagrams (i.e., "Stella" diagrams) be familiar with the basic terminology and variables that describe population change be cognizant of, and sensitive to, the complexity of variables involved in real-world population change, and recognize the variables needed to construct more sophisticated models of population PART II-A: MAKING A "SYSTEM DIAGRAM" OF POPULATION GROWTH What is a Model? The "Critters in a Jar" exercise you did in Section I was actually a type of modeling activity. What is a model? The concept has many dictionary definitions, but the kind of model used in scientific studies is typically one that is "a description or analogy to help visualize something that cannot be directly observed," or "a system of postulates, data, and inferences presented as a mathematical description of an entity or state of affairs." The imaginary process of "reproducing critters" was represented with a jar sketched on paper, shaded-in boxes to symbolize each critter, and a time period (a minute) to represent time steps of change in the population growth process. Through this combination of symbols and steps you were able to construct an analogy, or an analogue model, of a controlled exponential population growth process. Section I also showed you that the critter's exponential growth could be represented graphically with a straight line on logarithmic paper -- another way of modeling the process. An equation for that line is also a model because it is a mathematical description of the exponential growth process. One advantage of modeling is that future growth can be predicted by either extending the line or using the equation to compute new values along the line. Another advantage of modeling is that it allows you to understand the system you are analyzing in an entirely new way, i.e., by breaking it into its component parts and figuring out how these parts of the system work together. It is here that exciting discoveries can be made. The real value of modeling is as an investigative technique. In Global Change studies in particular, models are often used to test the effects of changes in individual system components on the overall behavior of a dynamically changing system. System -- A selected set of interacting components usually small enough that its behavior can be understood or modeled. (after Few, 1991) System model -- A set of assumptions or rules, data, and inferences that define all of the interactions among the components of a system and the significant interactions between the system and the "universe" outside the system. (after Few, 1991) One other way of modeling a dynamic process -- such as population growth -- is to diagram the process or system. To do this, various symbols are used to represent different elements or components of the system, as well as the connections between these elements. System diagram -- A diagram of a system that uses graphic symbols or icons to represent system components in a depiction of how a system works. (after Few, 1991).
7 Thinking About the Components of the Model To gain an understanding of the modeling process, we will start with the very simple example of the "Critters in a Jar" and construct a model of that system using diagrams. In this activity you'll use a set of diagramming symbols that were first developed by Jay Forrester at the Massachusetts Institute of Technology. 1 First, go back and review the directions for the Critters-in-a-Jar exercise and fill in the following information which will allow you to pinpoint the main components and variables of the critter's population growth system: 17. As you did the exercise, what two components of the system changed over time (i.e., what was "added to the jar" each minute; what did you count up and graph at the end of each minute?) & 18. What was the time step of this change? (i.e. how often did you make an observation?) 19. What assumption, or "rule" was used to determine how much change occurred at each time step? What were the initial conditions of the jar? 21. What was the critter birth rate? (birth rate = ) (see # 9) 22. Did the BIRTH RATE of the critters change from minute to minute? 23. Write an equation in words to describe how you figured out the number of new critters (critter births) to add at the beginning of each new time step (e.g. "critter births = * ") 24. Write an equation in words to describe how you figured out the TOTAL number of critters (critter population) in the jar at the end of each time step (e.g. "critter population = + ") Expressing the Model Components in a SYSTEM DIAGRAM: Thinking about the basic steps and parts of the critter exercise allows you to conceptualize it in model form. The population (the number of critters in the jar at each point in time) is one main system component which changed or varied over time. This population component can be viewed as a stock or reservoir that stores or accumulates quantities of critters. We can symbolize the population stock in our exercise as a box symbol which can store or accumulate critters: POPULATION 1 These symbols have been modified and incorporated into a software program called STELLA (High Performance Systems, Inc.) so that model diagrams can be transformed easily into working computer models. See their website at:
8 The population of critters inside the jar changed over time. This part of the critter system can be viewed as a flow or flux of new critters into the jar. We can symbolize this in a diagram as a flow arrow: flow We cannot separate the flow of critters into the jar from the mechanism that specifies how that flow behaves (i.e., how many critter births occurred in a given time step). This aspect of the critter system can be viewed as a valve or regulator on the flow. It is symbolized as a circle attached to the flow arrow with a little valve on it. The flow & valve are labeled to show what is "flowing" in the system, in our case, critter births are being added to the stock or reservoir: BIRTHS Finally, to start off the whole critter population explosion process, recall that we first introduced two ready-to-mate critters into the jar. We can specify this origin for critters "outside" the jar system as a source that supplies a variable to a system. Since the nature of this source was not specified in detail, we symbolize it in a diagram as an undefined "cloud" shape -- or an aspect of the system that is somehow separate or larger and unaffected by the system being modeled: source cloud We can now piece together our diagram to show how all the components of the system work together: But wait! There's some information missing to make this model exactly like the critter-in-the-jar exercise. To make the critter population grow, a simple "rule" or assumption was made to specify how the valve on the flow of critters should work to increase the population. We assumed that a critter couple was able to mate and reproduce two new offspring every minute. We could have changed this assumption, or made a different one, so this is a varying part of the critter system model above. The assumption or guidelines that were defined to describe the way the flow and valve part of the system should behave represent a way of refining our model and converting it into a more detailed representation of the process. We symbolize this "converting" element of our model (a converter) as a circle, and give it a label that describes the thing the converter is adding to, defining, or computing for the system: BIRTH RATE To make a converter useful to the other components of the system, we need to have a way to pass the information in it to the flow & valve or to another converter. This information transfer takes place through a connector which passes information from one component of the system to another. The symbol used is a thin line with an arrow at the end pointing in the direction of the information transfer: connector
9 Now we can refine our critter population model diagram to include the assumptions about the critter birth rate through a converter and a connector: Will the model now work exactly the way the Critter-in-the-Jar exercise worked? What was the thing that determined how many new critters you added at each time step???? Yes, you first needed to know how many critter couples were in the jar in order to apply the "two births per critter couple" birth-rate formula and compute the population at each time step. In our critter exercise, the information about the number of critter couples available was obtained from counting up the critter population already in the jar. In our systems diagram, this information is obtained from the population reservoir. Connectors can be used to transfer information from a stock or reservoir to a converter or to a flow & valve. In our critter exercise, we figured out the number of new births going into the jar population (a flow) by multiplying the number of critter couples (obtained from information in the jar population) times the birth rate per critter couple (an assumption residing in our free-floating converter). Hence information transferred from both the population reservoir and the birth rate converter was used to compute the number of critter newborns at each time step. Here's how it would look in the systems diagram: If we ran this model using STELLA software (where we could also specify initial values and the length of the time step) the output of the model would look like this: Does the graph look somewhat familiar?
10 Critiquing the Simple Model As with the critters-in-the-jar analogue, there are some major problems with so simple a model. As you noted in Section I, probably the most severe critique of the model is that -- unlike the real world -- none of the critters die! How could we add deaths to the model? We could illustrate the flow out of the population reservoir with a DEATH flow & valve. This flow has to end up somewhere, so we will introduce one last systems diagramming component -- a sink. Sinks, like sources, can be represented as unspecific clouds when they represent a reservoir that receives flow from the system, but the reservoir is so large that it remains largely unaffected by the system: sink cloud PART II-B: EXPLORING WITH THE MODEL [On a separate piece of paper, type out your answers to Questions 1 through 4 below, and make a sketch for Question 5 in the box at the bottom of this page. Attach the typed page to this exercise and be sure your name is on both papers before submitting them.] 1. How could you use the model to discover more about how populations change? State what hypotheses about population growth you might test by running the model. 2. How would changing the initial conditions change the shape of the output graph? State what initial conditions you would change and how you think this would change the shape of the output graph. 3. How would changing the assumption defined in the converter change the shape of the output graph? 4. State what initial conditions or assumptions you are changing about the model and sketch a graph of the predicted change in the shape of the output graph. Do not change the model diagram or add or subtract any components of the model (e.g. stocks, converters, etc.) -- just speculate on how it would run under different kinds of conditions. 5. In the box below, make a sketch of a STELLA diagram for a new critter model that has critter DEATHS added into the process. Then in the spaces next to your diagram, give a few phrases of explanation for why you sketched your diagram the way you did.
11
CREATING & RUNNING A VERY SIMPLE MODEL
 CREATING & RUNNING A VERY SIMPLE MODEL Goal: This activity introduces a simple analog model of population change using dynamic systems modeling terminology and diagrams. It will serve as a launching point
7 Fractions. Number Sense and Numeration Measurement Geometry and Spatial Sense Patterning and Algebra Data Management and Probability
 7 Fractions GRADE 7 FRACTIONS continue to develop proficiency by using fractions in mental strategies and in selecting and justifying use; develop proficiency in adding and subtracting simple fractions;
Graphs of Exponential
 Graphs of Exponential Functions By: OpenStaxCollege As we discussed in the previous section, exponential functions are used for many realworld applications such as finance, forensics, computer science,
DOWNLOAD PDF BIG IDEAS MATH VERTICAL SHRINK OF A PARABOLA
 Chapter 1 : BioMath: Transformation of Graphs Use the results in part (a) to identify the vertex of the parabola. c. Find a vertical line on your graph paper so that when you fold the paper, the left portion
Lesson 2: Analyzing a Data Set
 Student Outcomes Students recognize linear, quadratic, and exponential functions when presented as a data set or sequence, and formulate a model based on the data. Lesson Notes This lesson asks students
Simi imilar Shapes lar Shapes Nesting Squares Poly lyhedr hedra and E a and Euler ler s Form s Formula ula
 TABLE OF CONTENTS Introduction......................................................... 5 Teacher s Notes....................................................... 6 NCTM Standards Alignment Chart......................................
Female Brown Bear Weights
 CC-20 Normal Distributions Common Core State Standards MACC.92.S-ID..4 Use the mean and standard of a data set to fit it to a normal distribution and to estimate population percentages. Recognize that
23.2 Normal Distributions
 1_ Locker LESSON 23.2 Normal Distributions Common Core Math Standards The student is expected to: S-ID.4 Use the mean and standard deviation of a data set to fit it to a normal distribution and to estimate
Overview for Families
 unit: Graphing Equations Mathematical strand: Algebra The following pages will help you to understand the mathematics that your child is currently studying as well as the type of problems (s)he will solve
Lesson 4 Exponential Functions I
 Lesson 4 Exponential Functions I Lesson 4 Exponential Functions I Exponential functions play a major role in our lives. Population growth and disease processes are real-world problems that involve exponential
Your Name: Section: INTRODUCTION TO STATISTICAL REASONING Computer Lab #4 Scatterplots and Regression
 Your Name: Section: 36-201 INTRODUCTION TO STATISTICAL REASONING Computer Lab #4 Scatterplots and Regression Objectives: 1. To learn how to interpret scatterplots. Specifically you will investigate, using
2017 Summer Review for Students Entering Pre-Algebra 7 & Pre-Algebra 8
 1. Area and Perimeter of Polygons 2. Multiple Representations of Portions 3. Multiplying Fractions and Decimals 4. Order of Operations 5. Writing and Evaluating Algebraic Expressions 6. Simplifying Expressions
CMP Book: Investigation Number Objective: PASS: 1.1 Describe data distributions and display in line and bar graphs
 Data About Us (6th Grade) (Statistics) 1.1 Describe data distributions and display in line and bar graphs. 6.5.1 1.2, 1.3, 1.4 Analyze data using range, mode, and median. 6.5.3 Display data in tables,
MPM 1D Learning Goals and Success Criteria ver1 Sept. 1, Learning Goal I will be able to: Success Criteria I can:
 MPM 1D s and ver1 Sept. 1, 2015 Strand: Number Sense and Algebra (NA) By the end of this course, students will be able to: NA1 Demonstrate an understanding of the exponent rules of multiplication and division,
Ingredients of Change: Nonlinear Models
 Chapter 2 Ingredients of Change: Nonlinear Models 2.1 Exponential Functions and Models As we begin to consider functions that are not linear, it is very important that you be able to draw scatter plots,
Big Mathematical Ideas and Understandings
 Big Mathematical Ideas and Understandings A Big Idea is a statement of an idea that is central to the learning of mathematics, one that links numerous mathematical understandings into a coherent whole.
STANDARDS OF LEARNING CONTENT REVIEW NOTES ALGEBRA II. 3 rd Nine Weeks,
 STANDARDS OF LEARNING CONTENT REVIEW NOTES ALGEBRA II 3 rd Nine Weeks, 2016-2017 1 OVERVIEW Algebra II Content Review Notes are designed by the High School Mathematics Steering Committee as a resource
Section 1.5 Transformation of Functions
 Section 1.5 Transformation of Functions 61 Section 1.5 Transformation of Functions Often when given a problem, we try to model the scenario using mathematics in the form of words, tables, graphs and equations
Section 1.5 Transformation of Functions
 6 Chapter 1 Section 1.5 Transformation of Functions Often when given a problem, we try to model the scenario using mathematics in the form of words, tables, graphs and equations in order to explain or
Age & Stage Structure: Elephant Model
 POPULATION MODELS Age & Stage Structure: Elephant Model Terri Donovan recorded: January, 2010 Today we're going to be building an age-structured model for the elephant population. And this will be the
Graphing Linear Equations and Inequalities: Graphing Linear Equations and Inequalities in One Variable *
 OpenStax-CNX module: m18877 1 Graphing Linear Equations and Inequalities: Graphing Linear Equations and Inequalities in One Variable * Wade Ellis Denny Burzynski This work is produced by OpenStax-CNX and
College and Career Readiness Practice Workbooks. Series Crosswalks. Math. Science. Social Studies Reading
 Social Studies Reading Science Writing Math College and Career Readiness Practice Workbooks Series Crosswalks Introduction McGraw-Hill Education s College and Career Readiness Practice Workbooks align
Grade 7 Mathematics Performance Level Descriptors
 Limited A student performing at the Limited Level demonstrates a minimal command of Ohio s Learning Standards for Grade 7 Mathematics. A student at this level has an emerging ability to work with expressions
Roc Model and Density Dependence, Part 1
 POPULATION MODELS Roc Model and Density Dependence, Part 1 Terri Donovan recorded: February, 2012 You ve now completed several modeling exercises dealing with the Roc population. So far, the caliph of
4. Write sets of directions for how to check for direct variation. How to check for direct variation by analyzing the graph :
 Name Direct Variations There are many relationships that two variables can have. One of these relationships is called a direct variation. Use the description and example of direct variation to help you
2.1 System Dynamics Tool: STELLA Version 10 Tutorial 1. Introduction to Computational Science: Modeling and Simulation for the Sciences, 2nd Edition
 2.1 System Dynamics Tool: STELLA Version 10 Tutorial 1 Introduction to Computational Science: Modeling and Simulation for the Sciences, 2nd Edition Angela B. Shiflet and George W. Shiflet Wofford College
Direct Variations DIRECT AND INVERSE VARIATIONS 19. Name
 DIRECT AND INVERSE VARIATIONS 19 Direct Variations Name Of the many relationships that two variables can have, one category is called a direct variation. Use the description and example of direct variation
Prentice Hall Mathematics: Course Correlated to: Colorado Model Content Standards and Grade Level Expectations (Grade 6)
") Colorado Model Content Standards and Grade Level Expectations (Grade 6) Standard 1: Students develop number sense and use numbers and number relationships in problemsolving situations and communicate the
Colorado Model Content Standards and Grade Level Expectations (Grade 6) Standard 1: Students develop number sense and use numbers and number relationships in problemsolving situations and communicate the
Montana City School GRADE 5
 Montana City School GRADE 5 Montana Standard 1: Students engage in the mathematical processes of problem solving and reasoning, estimation, communication, connections and applications, and using appropriate
Math 1020 Objectives & Exercises Calculus Concepts Spring 2019
 Section of Textbook 1.1 AND Learning Objectives/Testable Skills Identify four representations of a function. Specify input and output variables, input and output descriptions, and input and output units.
Meeting 1 Introduction to Functions. Part 1 Graphing Points on a Plane (REVIEW) Part 2 What is a function?
 Part 2 What is a function?") Meeting 1 Introduction to Functions Part 1 Graphing Points on a Plane (REVIEW) A plane is a flat, two-dimensional surface. We describe particular locations, or points, on a plane relative to two number
Meeting 1 Introduction to Functions Part 1 Graphing Points on a Plane (REVIEW) A plane is a flat, two-dimensional surface. We describe particular locations, or points, on a plane relative to two number
Chapter 5: The normal model
 Chapter 5: The normal model Objective (1) Learn how rescaling a distribution affects its summary statistics. (2) Understand the concept of normal model. (3) Learn how to analyze distributions using the
Lab 3: From Data to Models
 Lab 3: From Data to Models One of the goals of mathematics is to explain phenomena represented by data. In the business world, there is an increasing dependence on models. We may want to represent sales
Cecil Jones Academy Mathematics Fundamentals
 Year 10 Fundamentals Core Knowledge Unit 1 Unit 2 Estimate with powers and roots Calculate with powers and roots Explore the impact of rounding Investigate similar triangles Explore trigonometry in right-angled
Lesson 8 Introduction to Quadratic Functions
 Lesson 8 Introduction to Quadratic Functions We are leaving exponential and logarithmic functions behind and entering an entirely different world. As you work through this lesson, you will learn to identify
Prentice Hall Mathematics: Pre-Algebra 2004 Correlated to: Colorado Model Content Standards and Grade Level Expectations (Grade 8)
") Colorado Model Content Standards and Grade Level Expectations (Grade 8) Standard 1: Students develop number sense and use numbers and number relationships in problemsolving situations and communicate the
Colorado Model Content Standards and Grade Level Expectations (Grade 8) Standard 1: Students develop number sense and use numbers and number relationships in problemsolving situations and communicate the
Experimental Design and Graphical Analysis of Data
 Experimental Design and Graphical Analysis of Data A. Designing a controlled experiment When scientists set up experiments they often attempt to determine how a given variable affects another variable.
Voluntary State Curriculum Algebra II
 Algebra II Goal 1: Integration into Broader Knowledge The student will develop, analyze, communicate, and apply models to real-world situations using the language of mathematics and appropriate technology.
Sketching graphs of polynomials
 Sketching graphs of polynomials We want to draw the graphs of polynomial functions y = f(x). The degree of a polynomial in one variable x is the highest power of x that remains after terms have been collected.
Course of study- Algebra Introduction: Algebra 1-2 is a course offered in the Mathematics Department. The course will be primarily taken by
 Course of study- Algebra 1-2 1. Introduction: Algebra 1-2 is a course offered in the Mathematics Department. The course will be primarily taken by students in Grades 9 and 10, but since all students must
Lesson 20: Four Interesting Transformations of Functions
 Student Outcomes Students apply their understanding of transformations of functions and their graphs to piecewise functions. Lesson Notes In Lessons 17 19 students study translations and scalings of functions
AP Statistics Summer Math Packet
 NAME: AP Statistics Summer Math Packet PERIOD: Complete all sections of this packet and bring in with you to turn in on the first day of school. ABOUT THIS SUMMER PACKET: In general, AP Statistics includes
Section 10.4 Normal Distributions
 Section 10.4 Normal Distributions Random Variables Suppose a bank is interested in improving its services to customers. The manager decides to begin by finding the amount of time tellers spend on each
At the end of the chapter, you will learn to: Present data in textual form. Construct different types of table and graphs
 DATA PRESENTATION At the end of the chapter, you will learn to: Present data in textual form Construct different types of table and graphs Identify the characteristics of a good table and graph Identify
round decimals to the nearest decimal place and order negative numbers in context
 6 Numbers and the number system understand and use proportionality use the equivalence of fractions, decimals and percentages to compare proportions use understanding of place value to multiply and divide
8 th Grade Mathematics Unpacked Content For the new Common Core standards that will be effective in all North Carolina schools in the
 8 th Grade Mathematics Unpacked Content For the new Common Core standards that will be effective in all North Carolina schools in the 2012-13. This document is designed to help North Carolina educators
Objectives. Materials
 Activity 13 Objectives Understand what a slope field represents in terms of Create a slope field for a given differential equation Materials TI-84 Plus / TI-83 Plus Graph paper Introduction One of the
EXERCISE SET 10.2 MATD 0390 DUE DATE: INSTRUCTOR
 EXERCISE SET 10. STUDENT MATD 090 DUE DATE: INSTRUCTOR You have studied the method known as "completing the square" to solve quadratic equations. Another use for this method is in transforming the equation
Population Problems. To develop a model for population growth, To develop proficiency with algebraic equations
 Grade levels: 7-12 Population Problems Objectives: To develop a model for population growth, To develop proficiency with algebraic equations Topics involved: and sequences, Modeling, algebra, systems of
CHAPTER 2 Modeling Distributions of Data
 CHAPTER 2 Modeling Distributions of Data 2.2 Density Curves and Normal Distributions The Practice of Statistics, 5th Edition Starnes, Tabor, Yates, Moore Bedford Freeman Worth Publishers HW 34. Sketch
Distributions of random variables
 Chapter 3 Distributions of random variables 31 Normal distribution Among all the distributions we see in practice, one is overwhelmingly the most common The symmetric, unimodal, bell curve is ubiquitous
Chapter 6 Normal Probability Distributions
 Chapter 6 Normal Probability Distributions 6-1 Review and Preview 6-2 The Standard Normal Distribution 6-3 Applications of Normal Distributions 6-4 Sampling Distributions and Estimators 6-5 The Central
Second Edition. Concept Builders. Jana Kohout
 Second Edition Concept Builders Jana Kohout First published in Australia as an online resource in 016. Edited and printed in 017. Jana Kohout 017 Reproduction and Communication for educational purposes
Graphs of Increasing Exponential Functions
 Section 5 2A: Graphs of Increasing Exponential Functions We want to determine what the graph of an exponential function y = a x looks like for all values of a > We will select a value of a > and examine
Wisconsin. Model Academic Standards. for Mathematics
 2004 correlated to the Wisconsin Model Academic Standards for Mathematics Grade 8 3/2003 2004 McDougal Littell Middle School Math, Course 1 2004 correlated to the Wisconsin Model Academic Standards for
Graphs of Increasing Exponential Functions
 Section 5 2A: Graphs of Increasing Exponential Functions We want to determine what the graph of an exponential function y = a x looks like for all values of a > We will select a value of a > and examine
Advanced Operations Research Prof. G. Srinivasan Department of Management Studies Indian Institute of Technology, Madras
 Advanced Operations Research Prof. G. Srinivasan Department of Management Studies Indian Institute of Technology, Madras Lecture 16 Cutting Plane Algorithm We shall continue the discussion on integer programming,
Mathematics Expectations Page 1 Grade 06
 Mathematics Expectations Page 1 Grade 06 Problem Solving Mathematical Process Expectations 6m1 develop, select, and apply problem-solving strategies as they pose and solve problems and conduct investigations,
CURRICULUM UNIT MAP 1 ST QUARTER. COURSE TITLE: Mathematics GRADE: 8
 1 ST QUARTER Unit:1 DATA AND PROBABILITY WEEK 1 3 - OBJECTIVES Select, create, and use appropriate graphical representations of data Compare different representations of the same data Find, use, and interpret
Computer Graphics Prof. Sukhendu Das Dept. of Computer Science and Engineering Indian Institute of Technology, Madras Lecture - 14
 Computer Graphics Prof. Sukhendu Das Dept. of Computer Science and Engineering Indian Institute of Technology, Madras Lecture - 14 Scan Converting Lines, Circles and Ellipses Hello everybody, welcome again
Unit: Quadratic Functions
 Unit: Quadratic Functions Learning increases when you have a goal to work towards. Use this checklist as guide to track how well you are grasping the material. In the center column, rate your understand
STRAIGHT LINE GRAPHS THE COORDINATES OF A POINT. The coordinates of any point are written as an ordered pair (x, y)
") THE COORDINATES OF A POINT STRAIGHT LINE GRAPHS The coordinates of any point are written as an ordered pair (x, y) Point P in the diagram has coordinates (2, 3). Its horizontal distance along the x axis
THE COORDINATES OF A POINT STRAIGHT LINE GRAPHS The coordinates of any point are written as an ordered pair (x, y) Point P in the diagram has coordinates (2, 3). Its horizontal distance along the x axis
Use Math to Solve Problems and Communicate. Level 1 Level 2 Level 3 Level 4 Level 5 Level 6
 Number Sense M.1.1 Connect and count number words and numerals from 0-999 to the quantities they represent. M.2.1 Connect and count number words and numerals from 0-1,000,000 to the quantities they represent.
Unit 2: Linear Functions
 Unit 2: Linear Functions 2.1 Functions in General Functions Algebra is the discipline of mathematics that deals with functions. DEF. A function is, essentially, a pattern. This course deals with patterns
Integers & Absolute Value Properties of Addition Add Integers Subtract Integers. Add & Subtract Like Fractions Add & Subtract Unlike Fractions
 Unit 1: Rational Numbers & Exponents M07.A-N & M08.A-N, M08.B-E Essential Questions Standards Content Skills Vocabulary What happens when you add, subtract, multiply and divide integers? What happens when
Using the Best of Both!
 Using the Best of Both! A Guide to Using Connected Mathematics 2 with Prentice Hall Mathematics Courses 1, 2, 3 2012, and Algebra Readiness MatBro111707BestOfBothPH10&CMP2.indd 1 6/7/11 11:59 AM Using
Integrated Mathematics I Performance Level Descriptors
 Limited A student performing at the Limited Level demonstrates a minimal command of Ohio s Learning Standards for Integrated Mathematics I. A student at this level has an emerging ability to demonstrate
Modeling and Prototypes
 Modeling and Prototypes 4.4.1 Unit 4, Lesson 4 Explanation The Unit Big Idea The Engineering Design process is a systematic, iterative problem solving method which produces solutions to meet human wants
Houghton Mifflin MATHSTEPS Level 7 correlated to Chicago Academic Standards and Framework Grade 7
 State Goal 6: Demonstrate and apply a knowledge and sense of numbers, including basic arithmetic operations, number patterns, ratios and proportions. CAS A. Describe and apply concepts of real numbers,
 Specific Objectives Students will understand that that the family of equation corresponds with the shape of the graph. Students will be able to create a graph of an equation by plotting points. In lesson
Precalculus and Calculus
 4 Precalculus and Calculus You have permission to make copies of this document for your classroom use only. You may not distribute, copy or otherwise reproduce any part of this document or the lessons
Sample: Do Not Reproduce QUAD4 STUDENT PAGES. QUADRATIC FUNCTIONS AND EQUATIONS Student Pages for Packet 4: Quadratic Functions and Applications
 Name Period Date QUADRATIC FUNCTIONS AND EQUATIONS Student Pages for Packet 4: Quadratic Functions and Applications QUAD 4.1 Vertex Form of a Quadratic Function 1 Explore how changing the values of h and
Year 8 Set 2 : Unit 1 : Number 1
 Year 8 Set 2 : Unit 1 : Number 1 Learning Objectives: Level 5 I can order positive and negative numbers I know the meaning of the following words: multiple, factor, LCM, HCF, prime, square, square root,
Houghton Mifflin MATHEMATICS Level 1 correlated to NCTM Standard
 Number and Operations Standard Understand numbers, ways of representing numbers, relationships among numbers, and number systems count with understanding and recognize TE: 191A 195B, 191 195, 201B, 201
Prentice Hall Mathematics: Course Correlated to: Colorado Model Content Standards and Grade Level Expectations (Grade 8)
") Colorado Model Content Standards and Grade Level Expectations (Grade 8) Standard 1: Students develop number sense and use numbers and number relationships in problemsolving situations and communicate the
Colorado Model Content Standards and Grade Level Expectations (Grade 8) Standard 1: Students develop number sense and use numbers and number relationships in problemsolving situations and communicate the
Downloaded from
 UNIT 2 WHAT IS STATISTICS? Researchers deal with a large amount of data and have to draw dependable conclusions on the basis of data collected for the purpose. Statistics help the researchers in making
Linear, Quadratic, and Exponential Models Attendance Problems 1. Find the slope and y-intercept of the line that passes through (4, 20) and (20, 24).
 and (20, 24).") Page 1 of 13 Linear, Quadratic, and Exponential Models Attendance Problems 1. Find the slope and y-intercept of the line that passes through (4, 20) and (20, 24). The population of a town is decreasing
Page 1 of 13 Linear, Quadratic, and Exponential Models Attendance Problems 1. Find the slope and y-intercept of the line that passes through (4, 20) and (20, 24). The population of a town is decreasing
Week 7: The normal distribution and sample means
 Week 7: The normal distribution and sample means Goals Visualize properties of the normal distribution. Learning the Tools Understand the Central Limit Theorem. Calculate sampling properties of sample
JUST THE MATHS UNIT NUMBER STATISTICS 1 (The presentation of data) A.J.Hobson
 A.J.Hobson") JUST THE MATHS UNIT NUMBER 18.1 STATISTICS 1 (The presentation of data) by A.J.Hobson 18.1.1 Introduction 18.1.2 The tabulation of data 18.1.3 The graphical representation of data 18.1.4 Exercises 18.1.5
JUST THE MATHS UNIT NUMBER 18.1 STATISTICS 1 (The presentation of data) by A.J.Hobson 18.1.1 Introduction 18.1.2 The tabulation of data 18.1.3 The graphical representation of data 18.1.4 Exercises 18.1.5
AP Statistics Summer Review Packet
 60 NAME: PERIOD: AP Statistics Summer Review Packet Teacher(s): Ryan Oben Teacher(s) Contact Information: Ryan_Oben@mcpsmd.org Course: Purpose of the Summer Assignment: In general, AP Statistics includes
Measures of Dispersion
 Lesson 7.6 Objectives Find the variance of a set of data. Calculate standard deviation for a set of data. Read data from a normal curve. Estimate the area under a curve. Variance Measures of Dispersion
8 th Grade Pre Algebra Pacing Guide 1 st Nine Weeks
 8 th Grade Pre Algebra Pacing Guide 1 st Nine Weeks MS Objective CCSS Standard I Can Statements Included in MS Framework + Included in Phase 1 infusion Included in Phase 2 infusion 1a. Define, classify,
Scott Foresman Investigations in Number, Data, and Space Content Scope & Sequence Correlated to Academic Language Notebooks The Language of Math
 Scott Foresman Investigations in Number, Data, and Space Content Scope & Sequence Correlated to Academic Language Notebooks The Language of Math Grade 5 Content Scope & Sequence Unit 1: Number Puzzles
AQA GCSE Maths - Higher Self-Assessment Checklist
 AQA GCSE Maths - Higher Self-Assessment Checklist Number 1 Use place value when calculating with decimals. 1 Order positive and negative integers and decimals using the symbols =,, , and. 1 Round to
CEE 3510 ENVIRONMENTAL QUALITY ENGINEERING. STELLA Exercise #1
 CEE 3510 ENVIRONMENTAL QUALITY ENGINEERING STELLA Exercise #1 This exercise will help you, step-by-step, build a simple model with STELLA. You will then use your model to answer questions which will demonstrate
Curriculum Map: Mathematics
 Curriculum Map: Mathematics Course: Honors Advanced Precalculus and Trigonometry Grade(s): 11-12 Unit 1: Functions and Their Graphs This chapter will develop a more complete, thorough understanding of
Building Concepts: Moving from Proportional Relationships to Linear Equations
 Lesson Overview In this TI-Nspire lesson, students use previous experience with proportional relationships of the form y = kx to consider relationships of the form y = mx and eventually y = mx + b. Proportional
MEI GeoGebra Tasks for AS Pure
 Task 1: Coordinate Geometry Intersection of a line and a curve 1. Add a quadratic curve, e.g. y = x 2 4x + 1 2. Add a line, e.g. y = x 3 3. Use the Intersect tool to find the points of intersection of
Velocity: A Bat s Eye View of Velocity
 Name School Date Purpose Velocity: A Bat s Eye View of Velocity There are a number of ways of representing motion that we ll find useful. Graphing position, velocity, and acceleration vs. time is often
TIPS4Math Grades 4 to 6 Overview Grade 4 Grade 5 Grade 6 Collect, Organize, and Display Primary Data (4+ days)
") Collect, Organize, and Display Primary Data (4+ days) Collect, Organize, Display and Interpret Categorical Data (5+ days) 4m88 Collect data by conducting a survey or an experiment to do with the 4m89 Collect
Collect, Organize, and Display Primary Data (4+ days) Collect, Organize, Display and Interpret Categorical Data (5+ days) 4m88 Collect data by conducting a survey or an experiment to do with the 4m89 Collect
Carnegie LearningÒ Middle School Math Solution Correlations Course 3 NCSCoS: Grade 8
 MATHEMATICAL PRACTICES - 1 - Make sense of problems and persevere in solving them. Explain the meaning of a problem and look for entry points to its solution. Analyze givens, constraints, relationships,
Middle School Math Course 2
 Middle School Math Course 2 Correlation of the ALEKS course Middle School Math Course 2 to the Indiana Academic Standards for Mathematics Grade 7 (2014) 1: NUMBER SENSE = ALEKS course topic that addresses
Name: Date: Period: Chapter 2. Section 1: Describing Location in a Distribution
 Name: Date: Period: Chapter 2 Section 1: Describing Location in a Distribution Suppose you earned an 86 on a statistics quiz. The question is: should you be satisfied with this score? What if it is the
CHAPTER 6. The Normal Probability Distribution
 The Normal Probability Distribution CHAPTER 6 The normal probability distribution is the most widely used distribution in statistics as many statistical procedures are built around it. The central limit
Grade 4. Massachusetts Curriculum Framework for Mathematics 42
 Grade 4 Introduction In grade 4, instructional time should focus on three critical areas: (1) developing understanding and fluency with multi-digit multiplication, and developing understanding of dividing
Area rectangles & parallelograms
 Area rectangles & parallelograms Rectangles One way to describe the size of a room is by naming its dimensions. So a room that measures 12 ft. by 10 ft. could be described by saying its a 12 by 10 foot
Whole Numbers and Integers. Angles and Bearings
 Whole Numbers and Integers Multiply two 2-digit whole numbers without a calculator Know the meaning of square number Add and subtract two integers without a calculator Multiply an integer by a single digit
New Jersey Core Curriculum Content Standards for Mathematics Grade 7 Alignment to Acellus
 New Jersey Core Curriculum Content Standards for Mathematics http://www.nj.gov/education/aps/cccs/math/ Standard 4.1.7: Number And Numerical Operations A. Number Sense 1. Extend understanding of the number
3.1. 3x 4y = 12 3(0) 4y = 12. 3x 4y = 12 3x 4(0) = y = x 0 = 12. 4y = 12 y = 3. 3x = 12 x = 4. The Rectangular Coordinate System
 4y = 12. 3x 4y = 12 3x 4(0) = y = x 0 = 12. 4y = 12 y = 3. 3x = 12 x = 4. The Rectangular Coordinate System") 3. The Rectangular Coordinate System Interpret a line graph. Objectives Interpret a line graph. Plot ordered pairs. 3 Find ordered pairs that satisfy a given equation. 4 Graph lines. 5 Find x- and y-intercepts.
3. The Rectangular Coordinate System Interpret a line graph. Objectives Interpret a line graph. Plot ordered pairs. 3 Find ordered pairs that satisfy a given equation. 4 Graph lines. 5 Find x- and y-intercepts.
Preview Notes. Systems of Equations. Linear Functions. Let y = y. Solve for x then solve for y
 Preview Notes Linear Functions A linear function is a straight line that has a slope (m) and a y-intercept (b). Systems of Equations 1. Comparison Method Let y = y x1 y1 x2 y2 Solve for x then solve for