Raman Images. Jeremy M. Shaver 1, Eunah Lee 2, Andrew Whitley 2, R. Scott Koch. 1. Eigenvector Research, Inc. 2. HORIBA Jobin Yvon, Inc.
|
|
|
- Nickolas Allison
- 5 years ago
- Views:
Transcription
1 Analyzing and Visualizing Large Raman Images Jeremy M. Shaver 1, Eunah Lee 2, Andrew Whitley 2, R. Scott Koch 1 1. Eigenvector Research, Inc. 2. HORIBA Jobin Yvon, Inc.

2 What is a Large Image? Gone from hundreds of spectra to tens of thousands of spectra complicated DOE or time series = 5 spectra 256 pixels x 256 pixels = spectra x 5 "slabs" (depth profile) = 3.2 million spectra!
3 5 samples (height ht =.2 inches = ½ cm) x 5 slabs = 3.2 million samples (131 inches = 19 feet = 1 story building = 33 meters) x256 = samples (26.2 inches = 66.5 cm)
4 Factor Based Image Analysis Techniques Principal Component Analysis (PCA) Provides good concise summary of correlated samples and variables Multivariate Curve Resolution (MCR) Provides physically significant significant representation of underlying spectra and where they show up Partial Least Squares (PLS) Provides "targeted" analysis of concentrations or spectral patterns
 scores = 1 columns loadings = 1 rows X = 5.2 52GB Scores & Loadings = 6 MB >65, samples for 256 x 256 image (or 4 x 4 x 41 image) >1, variables at.")
5 PCA On Entire Image Raman Shift (cm 1 ) Raman Shift (cm 1 ) P ixels in the image (sam mples) P ixels in the image (sam mples) If model contains 1 principal components (k=1) scores = 1 columns loadings = 1 rows X = GB Scores & Loadings = 6 MB >65, samples for 256 x 256 image (or 4 x 4 x 41 image) >1, variables at.3 cm 1 resolution
6 Principal Component Analysis on Images (the math, graphically speaking) variables (size = n) Step 1. calculate one of these two matrices s (size = m) sample n by n matrix m by m matrix ( m 2 elements) m >65, samples for 256 x 256 image (or 4 x 4 x 41 image) n >1, variables at.3 cm 1 resolution (or when combined with another spectroscopy!!)
7 Avoiding Memory Problems Do X T X"peacemeal" (segments e of spectra) may still not have enough memory for X T X must read file a second time to get scores! Spatial or Spectral compression Wavelets, binning (co adding, averaging, etc) Must choose filter carefully to avoid artifacts PCA results must be converted back to original variables/pixels throughfilter Sequential PCA With Model Updating Read file ONCE, get (close to true) scores and loadings


8 Sequential PCA with Updating Step 1: Segmenting the data X X


9 Sequential PCA with Updating Step 2: Analysis of first block λ 1 = eigenvalues (magnitude of factors) Directly related to how much of these spectral patterns we saw in X 1
10 Sequential PCA with Updating Step 3: Analysis of subsequent blocks
11 Sequential PCA with Updating Step 3: Analysis of subsequent blocks P x is an approximation of the loadings calculated if X was analyzed as a whole!
12 Sequential PCA with Updating Step 4: Correction of Scores Use Rotation matrices (R 1 and R 2 ) to rotate T 1, T 2, T 3 into T x (approximation of scores for X)
13 How Close an Approximation? 2 (or 3) Influences Sufficient Factors if the eentire eimage can be accurately modeled with k factors, then any subregion will require no more than k factors (in practice, use 2k factors) Correlated Noise Noise captured in each factor will vary. Low S/N ratio factors are more approximate. Sizeof the sub regions For low S/N factors, larger sub regions will improve the approximation.
14 Polystyrene Beads 51 x 51 x 51 spatial p dimension 124 spectral points (15 18 cm 1) Raman Shift (cm-1) 14 First Principal Component Loading 152 Raman Shift frequencies (variables) 16 18
15 Full vs. Sequential PCA on Reduced dspectral Range 1 6 le) ues (log scal Eigenval significant components green = full PCA blue = sequential PCA Basically identical for Principal Component Number
16 Loadings for Full and Sequential PCA PC 1 green = full llpca blue = sequential PCA R 2 = PC 2 R 2 = PC 3 R 2 = Raman Shift (cm-1)
17 Score Images for Sequential PCA (Unfolded 3D Images) R 2 = R 2 = R 2 = NoVisualDifferences (onlyshowing sequential here)
18 Difference between "True" Scores and Sequential Scores 1 5 PC Sample PC 2 x Sample 1 PC 3 x Sample PC 4 x Sample x 1 4
19 Sequential PCA on Full Spectrum significant components Eigenva alues (log scale e) x 51 x 51 pixels = spectra 124 Raman Shift frequencies (variables) Sequential PCA ONLY Principal Component Number
20 Loadings on PCs 1 and 2.25 Loadings on PC 1 Loadings on PC 2 Loadings on PC 1, Loading gs on PC Raman Shift (cm-1)


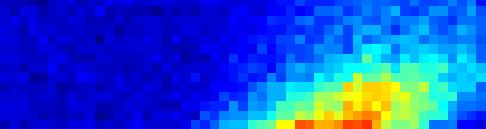
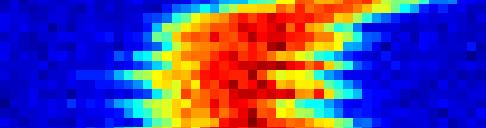
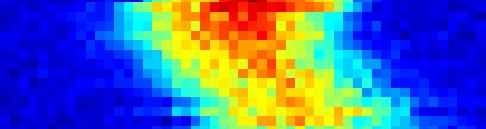
21 Scores on PC 1 5 Slice at z = x Image of PC y


22 Scores on PC 2 More Raman Less Baseline Slice at z = x Image of PC y


23 Scores on PC 2 Less Raman More Baseline Slice at z = x Image of PC y
24 MCR or PLS without X? MCR from PCA? PCA: X = TP T MCR: X = CS T = TRP T (where R is a rotation matrix and T and P capture sufficient variance) PLS from PCA? PCA: X = TP T perform PLS on T or P (again assuming T and P capture sufficient variance)
The latest trend of hybrid instrumentation
 Multivariate Data Processing of Spectral Images: The Ugly, the Bad, and the True The results of various multivariate data-processing methods of Raman maps recorded with a dispersive Raman microscope are
Hyperspectral Chemical Imaging: principles and Chemometrics.
 Hyperspectral Chemical Imaging: principles and Chemometrics aoife.gowen@ucd.ie University College Dublin University College Dublin 1,596 PhD students 6,17 international students 8,54 graduate students
Spectral Classification
 Spectral Classification Spectral Classification Supervised versus Unsupervised Classification n Unsupervised Classes are determined by the computer. Also referred to as clustering n Supervised Classes
Multivariate Calibration Quick Guide
 Last Updated: 06.06.2007 Table Of Contents 1. HOW TO CREATE CALIBRATION MODELS...1 1.1. Introduction into Multivariate Calibration Modelling... 1 1.1.1. Preparing Data... 1 1.2. Step 1: Calibration Wizard
Introduction to Multivariate Image Analysis (MIA) Table of Contents
 Table of Contents") Introduction to Multivariate Image Analysis (MIA) Copyright 1996-2013 Eigenvector Research, Inc. No part of this material may be photocopied or reproduced in any form without prior written consent from
Introduction to Multivariate Image Analysis (MIA) Copyright 1996-2013 Eigenvector Research, Inc. No part of this material may be photocopied or reproduced in any form without prior written consent from
Lecture 8 Object Descriptors
 Lecture 8 Object Descriptors Azadeh Fakhrzadeh Centre for Image Analysis Swedish University of Agricultural Sciences Uppsala University 2 Reading instructions Chapter 11.1 11.4 in G-W Azadeh Fakhrzadeh
Lecture 3: Camera Calibration, DLT, SVD
 Computer Vision Lecture 3 23--28 Lecture 3: Camera Calibration, DL, SVD he Inner Parameters In this section we will introduce the inner parameters of the cameras Recall from the camera equations λx = P
Image and Multidimensional Signal Processing
 Image and Multidimensional Signal Processing Professor William Hoff Dept of Electrical Engineering &Computer Science http://inside.mines.edu/~whoff/ Representation and Description 2 Representation and
Image Transformation Techniques Dr. Rajeev Srivastava Dept. of Computer Engineering, ITBHU, Varanasi
 Image Transformation Techniques Dr. Rajeev Srivastava Dept. of Computer Engineering, ITBHU, Varanasi 1. Introduction The choice of a particular transform in a given application depends on the amount of
IMAGE ANALYSIS, CLASSIFICATION, and CHANGE DETECTION in REMOTE SENSING
 SECOND EDITION IMAGE ANALYSIS, CLASSIFICATION, and CHANGE DETECTION in REMOTE SENSING ith Algorithms for ENVI/IDL Morton J. Canty с*' Q\ CRC Press Taylor &. Francis Group Boca Raton London New York CRC
Edge and corner detection
 Edge and corner detection Prof. Stricker Doz. G. Bleser Computer Vision: Object and People Tracking Goals Where is the information in an image? How is an object characterized? How can I find measurements
Local Linear Embedding. Katelyn Stringer ASTR 689 December 1, 2015
 Local Linear Embedding Katelyn Stringer ASTR 689 December 1, 2015 Idea Behind LLE Good at making nonlinear high-dimensional data easier for computers to analyze Example: A high-dimensional surface Think
Data Preprocessing. D.N. Rutledge, AgroParisTech
 Data Preprocessing D.N. Rutledge, AgroParisTech 12 Rencontres Héliospir / 30 septembre 2011 Outline Zone selection Examining raw data The importance of pre-treatment of data Common pre-treatment methods
Image Analysis, Classification and Change Detection in Remote Sensing
 Image Analysis, Classification and Change Detection in Remote Sensing WITH ALGORITHMS FOR ENVI/IDL Morton J. Canty Taylor &. Francis Taylor & Francis Group Boca Raton London New York CRC is an imprint
Singular Value Decomposition, and Application to Recommender Systems
 Singular Value Decomposition, and Application to Recommender Systems CSE 6363 Machine Learning Vassilis Athitsos Computer Science and Engineering Department University of Texas at Arlington 1 Recommendation
( ) =cov X Y = W PRINCIPAL COMPONENT ANALYSIS. Eigenvectors of the covariance matrix are the principal components
 =cov X Y = W PRINCIPAL COMPONENT ANALYSIS. Eigenvectors of the covariance matrix are the principal components") Review Lecture 14 ! PRINCIPAL COMPONENT ANALYSIS Eigenvectors of the covariance matrix are the principal components 1. =cov X Top K principal components are the eigenvectors with K largest eigenvalues
Review Lecture 14 ! PRINCIPAL COMPONENT ANALYSIS Eigenvectors of the covariance matrix are the principal components 1. =cov X Top K principal components are the eigenvectors with K largest eigenvalues
3D Geometry and Camera Calibration
 3D Geometry and Camera Calibration 3D Coordinate Systems Right-handed vs. left-handed x x y z z y 2D Coordinate Systems 3D Geometry Basics y axis up vs. y axis down Origin at center vs. corner Will often
Recognition, SVD, and PCA
 Recognition, SVD, and PCA Recognition Suppose you want to find a face in an image One possibility: look for something that looks sort of like a face (oval, dark band near top, dark band near bottom) Another
Classification of Hyperspectral Breast Images for Cancer Detection. Sander Parawira December 4, 2009
 1 Introduction Classification of Hyperspectral Breast Images for Cancer Detection Sander Parawira December 4, 2009 parawira@stanford.edu In 2009 approximately one out of eight women has breast cancer.
Dimension Reduction CS534
 Dimension Reduction CS534 Why dimension reduction? High dimensionality large number of features E.g., documents represented by thousands of words, millions of bigrams Images represented by thousands of
Using Spin Images for Efficient Object Recognition in Cluttered 3D Scenes
 Using Spin Images for Efficient Object Recognition in Cluttered 3D Scenes TDT 03 - Advanced Topics in Computer Graphics Presentation by Ruben H. Fagerli Paper to be summarized Using Spin Images for Efficient
Statistics of Natural Image Categories
 Statistics of Natural Image Categories Authors: Antonio Torralba and Aude Oliva Presented by: Sebastian Scherer Experiment Please estimate the average depth from the camera viewpoint to all locations(pixels)
CV: 3D to 2D mathematics. Perspective transformation; camera calibration; stereo computation; and more
 CV: 3D to 2D mathematics Perspective transformation; camera calibration; stereo computation; and more Roadmap of topics n Review perspective transformation n Camera calibration n Stereo methods n Structured
Statistics for Engineering
 Statistics for Engineering Section 6: Latent variable modelling Kevin Dunn Copyright, and all rights reserved, Kevin Dunn, 2011 kevin.dunn@connectmv.com April 2011 1 What we will cover What is a latent
LabSpec 6. Spectroscopy Suite. Simply Powerful Software
 LabSpec 6 Spectroscopy Suite Simply Powerful Software The LabSpec 6 spectroscopy suite offers an intuitive platform for Raman, photoluminescence (PL) and cathodoluminescence (CL) spectroscopy. The sixth
Image matching. Announcements. Harder case. Even harder case. Project 1 Out today Help session at the end of class. by Diva Sian.
 Announcements Project 1 Out today Help session at the end of class Image matching by Diva Sian by swashford Harder case Even harder case How the Afghan Girl was Identified by Her Iris Patterns Read the
CLASSIFICATION AND CHANGE DETECTION
 IMAGE ANALYSIS, CLASSIFICATION AND CHANGE DETECTION IN REMOTE SENSING With Algorithms for ENVI/IDL and Python THIRD EDITION Morton J. Canty CRC Press Taylor & Francis Group Boca Raton London NewYork CRC
Improvement of the correlative AFM and ToF-SIMS approach using an empirical sputter model for 3D chemical characterization
 Improvement of the correlative AFM and ToF-SIMS approach using an empirical sputter model for 3D chemical characterization T. Terlier 1, J. Lee 1, K. Lee 2, and Y. Lee 1 * 1 Advanced Analysis Center, Korea
Dimension reduction for hyperspectral imaging using laplacian eigenmaps and randomized principal component analysis
 Dimension reduction for hyperspectral imaging using laplacian eigenmaps and randomized principal component analysis Yiran Li yl534@math.umd.edu Advisor: Wojtek Czaja wojtek@math.umd.edu 10/17/2014 Abstract
Volumetric Classification: Program pca3d
 Volumetric principle component analysis for 3D SEISMIC FACIES ANALYSIS PROGRAM pca3d Overview Principal component analysis (PCA) is widely used to reduce the redundancy and excess dimensionality of the
ECG782: Multidimensional Digital Signal Processing
 Professor Brendan Morris, SEB 3216, brendan.morris@unlv.edu ECG782: Multidimensional Digital Signal Processing Spring 2014 TTh 14:30-15:45 CBC C313 Lecture 06 Image Structures 13/02/06 http://www.ee.unlv.edu/~b1morris/ecg782/
CCD Report Radial Basis Function Modeling of CARS Data
 CCD Report 2011-5 Radial Basis Function Modeling of CARS Data March 28, 2011 Doyle Knight Center for Computational Design Dept Mechanical and Aerospace Engineering Rutgers University 98 Brett Road Piscataway,
FACE RECOGNITION USING INDEPENDENT COMPONENT
 Chapter 5 FACE RECOGNITION USING INDEPENDENT COMPONENT ANALYSIS OF GABORJET (GABORJET-ICA) 5.1 INTRODUCTION PCA is probably the most widely used subspace projection technique for face recognition. A major
Visual Analytics. Visualizing multivariate data:
 Visual Analytics 1 Visualizing multivariate data: High density time-series plots Scatterplot matrices Parallel coordinate plots Temporal and spectral correlation plots Box plots Wavelets Radar and /or
CS 4495 Computer Vision A. Bobick. CS 4495 Computer Vision. Features 2 SIFT descriptor. Aaron Bobick School of Interactive Computing
 CS 4495 Computer Vision Features 2 SIFT descriptor Aaron Bobick School of Interactive Computing Administrivia PS 3: Out due Oct 6 th. Features recap: Goal is to find corresponding locations in two images.
Metabolomic Data Analysis with MetaboAnalyst
 Metabolomic Data Analysis with MetaboAnalyst User ID: guest6522519400069885256 April 14, 2009 1 Data Processing and Normalization 1.1 Reading and Processing the Raw Data MetaboAnalyst accepts a variety
Training-Free, Generic Object Detection Using Locally Adaptive Regression Kernels
 Training-Free, Generic Object Detection Using Locally Adaptive Regression Kernels IEEE TRANSACTIONS ON PATTERN ANALYSIS AND MACHINE INTELLIENCE, VOL.32, NO.9, SEPTEMBER 2010 Hae Jong Seo, Student Member,
Harder case. Image matching. Even harder case. Harder still? by Diva Sian. by swashford
 Image matching Harder case by Diva Sian by Diva Sian by scgbt by swashford Even harder case Harder still? How the Afghan Girl was Identified by Her Iris Patterns Read the story NASA Mars Rover images Answer
Anno accademico 2006/2007. Davide Migliore
 Robotica Anno accademico 6/7 Davide Migliore migliore@elet.polimi.it Today What is a feature? Some useful information The world of features: Detectors Edges detection Corners/Points detection Descriptors?!?!?
Using the DATAMINE Program
 6 Using the DATAMINE Program 304 Using the DATAMINE Program This chapter serves as a user s manual for the DATAMINE program, which demonstrates the algorithms presented in this book. Each menu selection
Basics of Multivariate Modelling and Data Analysis
 Basics of Multivariate Modelling and Data Analysis Kurt-Erik Häggblom 9. Linear regression with latent variables 9.1 Principal component regression (PCR) 9.2 Partial least-squares regression (PLS) [ mostly
Feature descriptors and matching
 Feature descriptors and matching Detections at multiple scales Invariance of MOPS Intensity Scale Rotation Color and Lighting Out-of-plane rotation Out-of-plane rotation Better representation than color:
Scott Foresman Investigations in Number, Data, and Space Content Scope & Sequence Correlated to Academic Language Notebooks The Language of Math
 Scott Foresman Investigations in Number, Data, and Space Content Scope & Sequence Correlated to Academic Language Notebooks The Language of Math Grade 5 Content Scope & Sequence Unit 1: Number Puzzles
Harder case. Image matching. Even harder case. Harder still? by Diva Sian. by swashford
 Image matching Harder case by Diva Sian by Diva Sian by scgbt by swashford Even harder case Harder still? How the Afghan Girl was Identified by Her Iris Patterns Read the story NASA Mars Rover images Answer
DEEP LEARNING OF COMPRESSED SENSING OPERATORS WITH STRUCTURAL SIMILARITY (SSIM) LOSS
 LOSS") DEEP LEARNING OF COMPRESSED SENSING OPERATORS WITH STRUCTURAL SIMILARITY (SSIM) LOSS ABSTRACT Compressed sensing (CS) is a signal processing framework for efficiently reconstructing a signal from a small
DEEP LEARNING OF COMPRESSED SENSING OPERATORS WITH STRUCTURAL SIMILARITY (SSIM) LOSS ABSTRACT Compressed sensing (CS) is a signal processing framework for efficiently reconstructing a signal from a small
Assignment 2. Classification and Regression using Linear Networks, Multilayer Perceptron Networks, and Radial Basis Functions
 ENEE 739Q: STATISTICAL AND NEURAL PATTERN RECOGNITION Spring 2002 Assignment 2 Classification and Regression using Linear Networks, Multilayer Perceptron Networks, and Radial Basis Functions Aravind Sundaresan
Practice Exam Sample Solutions
 CS 675 Computer Vision Instructor: Marc Pomplun Practice Exam Sample Solutions Note that in the actual exam, no calculators, no books, and no notes allowed. Question 1: out of points Question 2: out of
CPSC 340: Machine Learning and Data Mining. Outlier Detection Fall 2018
 CPSC 340: Machine Learning and Data Mining Outlier Detection Fall 2018 Admin Assignment 2 is due Friday. Assignment 1 grades available? Midterm rooms are now booked. October 18 th at 6:30pm (BUCH A102
The Artifact Subspace Reconstruction method. Christian A Kothe SCCN / INC / UCSD January 2013
 The Artifact Subspace Reconstruction method Christian A Kothe SCCN / INC / UCSD January 2013 Artifact Subspace Reconstruction New algorithm to remove non-stationary highvariance signals from EEG Reconstructs
Discriminate Analysis
 Discriminate Analysis Outline Introduction Linear Discriminant Analysis Examples 1 Introduction What is Discriminant Analysis? Statistical technique to classify objects into mutually exclusive and exhaustive
SELECTION OF A MULTIVARIATE CALIBRATION METHOD
 SELECTION OF A MULTIVARIATE CALIBRATION METHOD 0. Aim of this document Different types of multivariate calibration methods are available. The aim of this document is to help the user select the proper
Multi-focus image fusion using de-noising and sharpness criterion
 Multi-focus image fusion using de-noising and sharpness criterion Sukhdip Kaur, M.Tech (research student) Department of Computer Science Guru Nanak Dev Engg. College Ludhiana, Punjab, INDIA deep.sept23@gmail.com
FMRI data: Independent Component Analysis (GIFT) & Connectivity Analysis (FNC)
 & Connectivity Analysis (FNC)") FMRI data: Independent Component Analysis (GIFT) & Connectivity Analysis (FNC) Software: Matlab Toolbox: GIFT & FNC Yingying Wang, Ph.D. in Biomedical Engineering 10 16 th, 2014 PI: Dr. Nadine Gaab Outline
FMRI data: Independent Component Analysis (GIFT) & Connectivity Analysis (FNC) Software: Matlab Toolbox: GIFT & FNC Yingying Wang, Ph.D. in Biomedical Engineering 10 16 th, 2014 PI: Dr. Nadine Gaab Outline
Dimension reduction for hyperspectral imaging using laplacian eigenmaps and randomized principal component analysis:midyear Report
 Dimension reduction for hyperspectral imaging using laplacian eigenmaps and randomized principal component analysis:midyear Report Yiran Li yl534@math.umd.edu Advisor: Wojtek Czaja wojtek@math.umd.edu
Evaluation of texture features for image segmentation
 RIT Scholar Works Articles 9-14-2001 Evaluation of texture features for image segmentation Navid Serrano Jiebo Luo Andreas Savakis Follow this and additional works at: http://scholarworks.rit.edu/article
Raman Spectra of Chondrocytes in Cartilage: hyperspec s chondro data set
 Raman Spectra of Chondrocytes in Cartilage: hyperspec s chondro data set Claudia Beleites CENMAT and DI3, University of Trieste Spectroscopy Imaging, IPHT Jena e.v. February 13,
Multi-Phase Analysis Framework for Handling Batch Process Data
 Multi-Phase Analysis for Handling Batch Process Data J. Camacho, J. Picó Department of Systems Engineering and Control. A. Ferrer Department of Applied Statistics, Operations Research and Quality. Technical
CS 229: Machine Learning Final Report Identifying Driving Behavior from Data
 CS 9: Machine Learning Final Report Identifying Driving Behavior from Data Robert F. Karol Project Suggester: Danny Goodman from MetroMile December 3th 3 Problem Description For my project, I am looking
 PCOMP http://127.0.0.1:55825/help/topic/com.rsi.idl.doc.core/pcomp... IDL API Reference Guides > IDL Reference Guide > Part I: IDL Command Reference > Routines: P PCOMP Syntax Return Value Arguments Keywords
The Raster Data Model
 The Raster Data Model 2 2 2 2 8 8 2 2 8 8 2 2 2 2 2 2 8 8 2 2 2 2 2 2 2 2 2 Llano River, Mason Co., TX 1 Rasters are: Regular square tessellations Matrices of values distributed among equal-sized, square
COSC160: Detection and Classification. Jeremy Bolton, PhD Assistant Teaching Professor
 COSC160: Detection and Classification Jeremy Bolton, PhD Assistant Teaching Professor Outline I. Problem I. Strategies II. Features for training III. Using spatial information? IV. Reducing dimensionality
Introduction to machine learning, pattern recognition and statistical data modelling Coryn Bailer-Jones
 Introduction to machine learning, pattern recognition and statistical data modelling Coryn Bailer-Jones What is machine learning? Data interpretation describing relationship between predictors and responses
Pre-processing method minimizing the need for reference analyses
 JOURNAL OF CHEMOMETRICS J. Chemometrics 2001; 15: 123 131 Pre-processing method minimizing the need for reference analyses Per Waaben Hansen* Foss Electric A/S, Slangerupgade 69, DK-3400 Hillerød, Denmark
Computer Vision I - Filtering and Feature detection
 Computer Vision I - Filtering and Feature detection Carsten Rother 30/10/2015 Computer Vision I: Basics of Image Processing Roadmap: Basics of Digital Image Processing Computer Vision I: Basics of Image
Feature Selection. CE-725: Statistical Pattern Recognition Sharif University of Technology Spring Soleymani
 Feature Selection CE-725: Statistical Pattern Recognition Sharif University of Technology Spring 2013 Soleymani Outline Dimensionality reduction Feature selection vs. feature extraction Filter univariate
Rasters are: The Raster Data Model. Cell location specified by: Why squares? Raster Data Models 9/25/2014. GEO327G/386G, UT Austin 1
 5 5 5 5 5 5 5 5 5 5 5 5 2 2 5 5 2 2 2 2 2 2 8 8 2 2 5 5 5 5 5 5 2 2 2 2 5 5 5 5 5 2 2 2 5 5 5 5 The Raster Data Model Rasters are: Regular square tessellations Matrices of values distributed among equalsized,
Raster Data Models 9/18/2018
 Raster Data Models The Raster Data Model Rasters are: Regular square tessellations Matrices of values distributed among equal-sized, square cells 5 5 5 5 5 5 5 5 2 2 5 5 5 5 5 5 2 2 2 2 5 5 5 5 5 2 2 2
The Raster Data Model
 The Raster Data Model 2 2 2 2 8 8 2 2 8 8 2 2 2 2 2 2 8 8 2 2 2 2 2 2 2 2 2 Llano River, Mason Co., TX 9/24/201 GEO327G/386G, UT Austin 1 Rasters are: Regular square tessellations Matrices of values distributed
Introduction to Raman spectroscopy measurement data processing using Igor Pro
 Introduction to Raman spectroscopy measurement data processing using Igor Pro This introduction is intended to minimally guide beginners to processing Raman spectroscopy measurement data, which includes
Spectral Compression: Weighted Principal Component Analysis versus Weighted Least Squares
 Spectral Compression: Weighted Principal Component Analysis versus Weighted Least Squares Farnaz Agahian a*, Brian Funt a, Seyed Hossein Amirshahi b a Simon Fraser University, 8888 University Dr. V5A 1S6,
ECONOMIC DESIGN OF STATISTICAL PROCESS CONTROL USING PRINCIPAL COMPONENTS ANALYSIS AND THE SIMPLICIAL DEPTH RANK CONTROL CHART
 ECONOMIC DESIGN OF STATISTICAL PROCESS CONTROL USING PRINCIPAL COMPONENTS ANALYSIS AND THE SIMPLICIAL DEPTH RANK CONTROL CHART Vadhana Jayathavaj Rangsit University, Thailand vadhana.j@rsu.ac.th Adisak
Image Processing. Image Features
 Image Processing Image Features Preliminaries 2 What are Image Features? Anything. What they are used for? Some statements about image fragments (patches) recognition Search for similar patches matching
Principal Component Image Interpretation A Logical and Statistical Approach
 Principal Component Image Interpretation A Logical and Statistical Approach Md Shahid Latif M.Tech Student, Department of Remote Sensing, Birla Institute of Technology, Mesra Ranchi, Jharkhand-835215 Abstract
Dimensionality Reduction, including by Feature Selection.
 Dimensionality Reduction, including by Feature Selection www.cs.wisc.edu/~dpage/cs760 Goals for the lecture you should understand the following concepts filtering-based feature selection information gain
Reconstruction of Images Distorted by Water Waves
 Reconstruction of Images Distorted by Water Waves Arturo Donate and Eraldo Ribeiro Computer Vision Group Outline of the talk Introduction Analysis Background Method Experiments Conclusions Future Work
Dimension reduction : PCA and Clustering
 Dimension reduction : PCA and Clustering By Hanne Jarmer Slides by Christopher Workman Center for Biological Sequence Analysis DTU The DNA Array Analysis Pipeline Array design Probe design Question Experimental
Chemical Characterization of Diverse Pharmaceutical Samples by Confocal Raman Microscopy
 Whitepaper Chemical Characterization of Diverse Pharmaceutical Samples by Confocal Raman Microscopy WITec GmbH, Lise-Meitner-Str. 6, 89081 Ulm, Germany, www.witec.de Introduction The development and production
Principal Component Analysis
 Copyright 2004, Casa Software Ltd. All Rights Reserved. 1 of 16 Principal Component Analysis Introduction XPS is a technique that provides chemical information about a sample that sets it apart from other
Robotics Programming Laboratory
 Chair of Software Engineering Robotics Programming Laboratory Bertrand Meyer Jiwon Shin Lecture 8: Robot Perception Perception http://pascallin.ecs.soton.ac.uk/challenges/voc/databases.html#caltech car
Chemometrics. Description of Pirouette Algorithms. Technical Note. Abstract
 19-1214 Chemometrics Technical Note Description of Pirouette Algorithms Abstract This discussion introduces the three analysis realms available in Pirouette and briefly describes each of the algorithms
Clustering. CS294 Practical Machine Learning Junming Yin 10/09/06
 Clustering CS294 Practical Machine Learning Junming Yin 10/09/06 Outline Introduction Unsupervised learning What is clustering? Application Dissimilarity (similarity) of objects Clustering algorithm K-means,
Measurement and Geometry
 Name Date Class Review for Mastery: Converting Customary Units You can use the table below to convert customary units. Length 1 foot = 1 inches 1 yard = 36 inches 1 yard = 3 feet 1 mile = 5,80 feet 1 mile
Adaptive Learning of an Accurate Skin-Color Model
 Adaptive Learning of an Accurate Skin-Color Model Q. Zhu K.T. Cheng C. T. Wu Y. L. Wu Electrical & Computer Engineering University of California, Santa Barbara Presented by: H.T Wang Outline Generic Skin
Visual Representations for Machine Learning
 Visual Representations for Machine Learning Spectral Clustering and Channel Representations Lecture 1 Spectral Clustering: introduction and confusion Michael Felsberg Klas Nordberg The Spectral Clustering
Clustering and Visualisation of Data
 Clustering and Visualisation of Data Hiroshi Shimodaira January-March 28 Cluster analysis aims to partition a data set into meaningful or useful groups, based on distances between data points. In some
Week 7 Picturing Network. Vahe and Bethany
 Week 7 Picturing Network Vahe and Bethany Freeman (2005) - Graphic Techniques for Exploring Social Network Data The two main goals of analyzing social network data are identification of cohesive groups
An Intelligent Clustering Algorithm for High Dimensional and Highly Overlapped Photo-Thermal Infrared Imaging Data
 An Intelligent Clustering Algorithm for High Dimensional and Highly Overlapped Photo-Thermal Infrared Imaging Data Nian Zhang and Lara Thompson Department of Electrical and Computer Engineering, University
CIE L*a*b* color model
 CIE L*a*b* color model To further strengthen the correlation between the color model and human perception, we apply the following non-linear transformation: with where (X n,y n,z n ) are the tristimulus
Indirect Pairwise Comparison Method
 Indirect Pairwise Comparison Method An AHP-based Procedure for Sensory Data Collection and Analysis in Quality and Reliability Applications FLAVIO S. FOGLIATTO Federal University of Rio Grande do Sul Porto
Low-Open Area Endpoint Detection using a PCA based T 2 Statistic and Q Statistic on Optical Emission Spectroscopy Measurements
 Low-Open Area Endpoint Detection using a PCA based T 2 Statistic and Q Statistic on Optical Emission Spectroscopy Measurements Abstract David White, Brian Goodlin, Aaron Gower, Duane Boning, Han Chen,
Announcements. Recognition I. Gradient Space (p,q) What is the reflectance map?
 What is the reflectance map?") Announcements I HW 3 due 12 noon, tomorrow. HW 4 to be posted soon recognition Lecture plan recognition for next two lectures, then video and motion. Introduction to Computer Vision CSE 152 Lecture 17
Announcements I HW 3 due 12 noon, tomorrow. HW 4 to be posted soon recognition Lecture plan recognition for next two lectures, then video and motion. Introduction to Computer Vision CSE 152 Lecture 17
Schedule for Rest of Semester
 Schedule for Rest of Semester Date Lecture Topic 11/20 24 Texture 11/27 25 Review of Statistics & Linear Algebra, Eigenvectors 11/29 26 Eigenvector expansions, Pattern Recognition 12/4 27 Cameras & calibration
Data Fusion. Merging data from multiple sources to optimize data or create value added data
 Data Fusion Jeffrey S. Evans - Landscape Ecologist USDA Forest Service Rocky Mountain Research Station Forestry Sciences Lab - Moscow, Idaho Data Fusion Data Fusion is a formal framework in which are expressed
Expectations from 2D NIRS
 Expectations from 2D NIRS Sven-Olof Lundqvist, Thomas Grahn Innventia Presentation at Trees4Future Final Conference Brussels, 4-6th April, 2016 Example of application of 2D NIRS in tree breeding Expansion
Scott Smith Advanced Image Processing March 15, Speeded-Up Robust Features SURF
 Scott Smith Advanced Image Processing March 15, 2011 Speeded-Up Robust Features SURF Overview Why SURF? How SURF works Feature detection Scale Space Rotational invariance Feature vectors SURF vs Sift Assumptions
MULTIVARIATE TEXTURE DISCRIMINATION USING A PRINCIPAL GEODESIC CLASSIFIER
 MULTIVARIATE TEXTURE DISCRIMINATION USING A PRINCIPAL GEODESIC CLASSIFIER A.Shabbir 1, 2 and G.Verdoolaege 1, 3 1 Department of Applied Physics, Ghent University, B-9000 Ghent, Belgium 2 Max Planck Institute
Haar Wavelet Image Compression
 Math 57 Haar Wavelet Image Compression. Preliminaries Haar wavelet compression is an efficient way to perform both lossless and lossy image compression. It relies on averaging and differencing the values
Challenges in data compression for current and future imagers and hyperspectral sounders
 Challenges in data compression for current and future imagers and hyperspectral sounders Nigel Atkinson (Met Office) ITSC-19, Jeju, 28 March 2014 or How to store your satellite data without needing too
A MAXIMUM NOISE FRACTION TRANSFORM BASED ON A SENSOR NOISE MODEL FOR HYPERSPECTRAL DATA. Naoto Yokoya 1 and Akira Iwasaki 2
 A MAXIMUM NOISE FRACTION TRANSFORM BASED ON A SENSOR NOISE MODEL FOR HYPERSPECTRAL DATA Naoto Yokoya 1 and Akira Iwasaki 1 Graduate Student, Department of Aeronautics and Astronautics, The University of
Hyperspectral Remote Sensing
 Hyperspectral Remote Sensing Multi-spectral: Several comparatively wide spectral bands Hyperspectral: Many (could be hundreds) very narrow spectral bands GEOG 4110/5100 30 AVIRIS: Airborne Visible/Infrared