Department of Electrical Engineering, Technion IIT Signal and Image Processing Laboratory. Yair Moshe
|
|
|
- Emily Moore
- 6 years ago
- Views:
Transcription


1 Department of Electrical Engineering, Technion IIT Signal and Image Processing Laboratory Advanced MATLAB Part I: Graphics and GUI Yair Moshe March, 2010
2 Outline Graphics Animation Image and Video Handle Graphics Objects Creating GUI using GUIDE 2
; plot(x,y) grid on hold on plot(x, exp(-x),")
!['r:*') hold off axis([0 2*pi 0 1]) title('2-d Plot')](/docs-images/76/73099778/images/3-1.jpg "xlabel('time') ylabel('f(t)') text(pi/3, sin(pi/3),")
3 2-D Plotting x=0:.1:2*pi; y=sin(x); plot(x,y) grid on hold on plot(x, exp(-x), 'r:*') hold off axis([0 2*pi 0 1]) title('2-d Plot') xlabel('time') ylabel('f(t)') text(pi/3, sin(pi/3), '<--sin(\pi/3) ') legend('sine Wave', 'Decaying Exponential') 3
4 Line Specification Specifier Line Color Specifier Marker r red. point g green o circle b blue x cross c cyan + plus m magenta * asterix y yellow s square k black d diamond w white v triangle down Specifier Line Style ^ triangle up - solid < triangle left -- dashed > triangle right : dotted p pentagram :. dash-dot h hexagram 4
5 The Figure Window The figure window contains useful actions in its menu and toolbars: Zooming in and out Panning Rotating 3-D axes (and other camera actions) Copying & pasting Plot Edit Mode Plot tools (interactive plotting) Figure Palette Plot Browser Property Inspector Data Cursor Mode Data brushing and linking 5
6 The Figure Window Generate M-Code to reproduce the figure Saving & exporting Figures can be saved in a binary.fig file format Figures can be exported to many standard graphics file formats etc., EPS (recommended),tiff, JPEG, GIF, PNG, BMP, EMF. Printing 6
) subplot(2,2,2) semilogy(x, exp(-x))")
; z2 = sin(0.")
7 Subplots & Scales for Axes subplot(2,2,1) x=0:.1:2*pi; plot(x, exp(-x)) subplot(2,2,2) semilogy(x, exp(-x)) subplot(2,2,3) t = 0:900; z1 = 1000*exp(-0.005*t); z2 = sin(0.005*t); plotyy(t,z1,t,z2,'semilogy','plot'); subplot(2,2,4) plot(peaks) 7
8 Interactive Plotting 8
9 Data Brushing and Linking Data Brushing Manually select observations on an interactive data display Can select, remove, and replace individual data values Data Linking Linked plots visibly respond to changes in the current workspace variables they display and vice versa Each one of these tools is useful by itself but when used together they are very powerful 9
10 Data Statistics & Curve Fitting Data Statistics Tool Calculates basic statistics about the central tendency and variability of data plotted in a graph Plots any of the statistics the a graph Basic Fitting Interface Fits data using a spline interpolant, a shape-preserving interpolant, or a polynomial up to degree 10 Plots multiple fits simultaneously for a given data set Examines the numerical results of a fit Annotates the plot with the numerical fit results and the norm of residuals 10
.")
; plot3(x,y,z,'linewidth',2)")
11 3-D Plotting z = 0:0.1:10*pi; x = exp(-z/20).*cos(z); y = exp(-z/20).*sin(z); plot3(x,y,z,'linewidth',2) grid on xlabel('x') ylabel('y') zlabel('z') 11

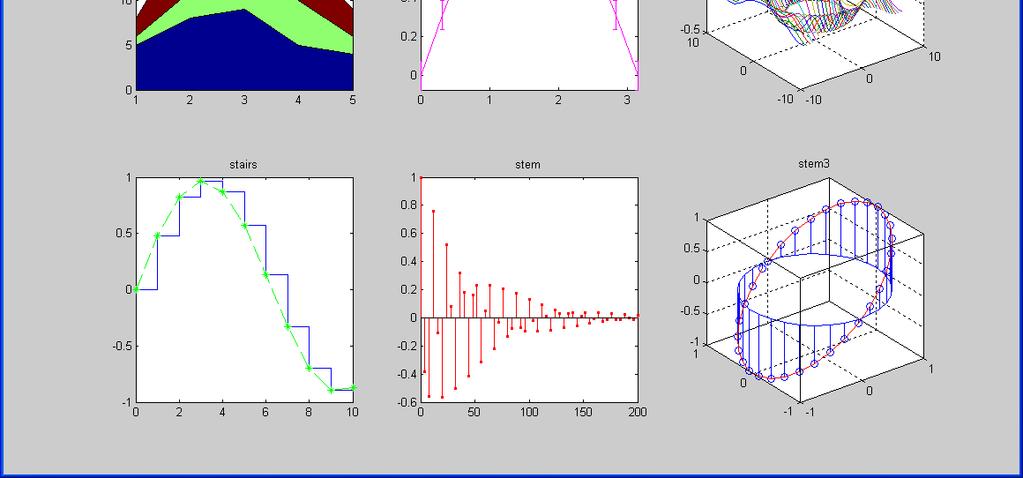
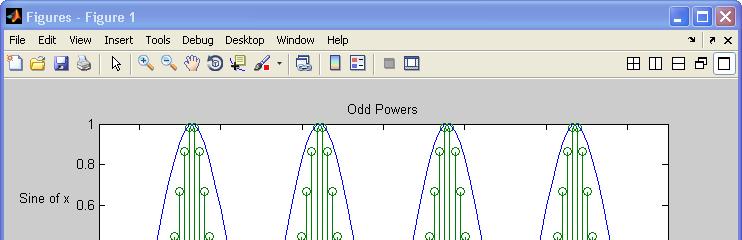
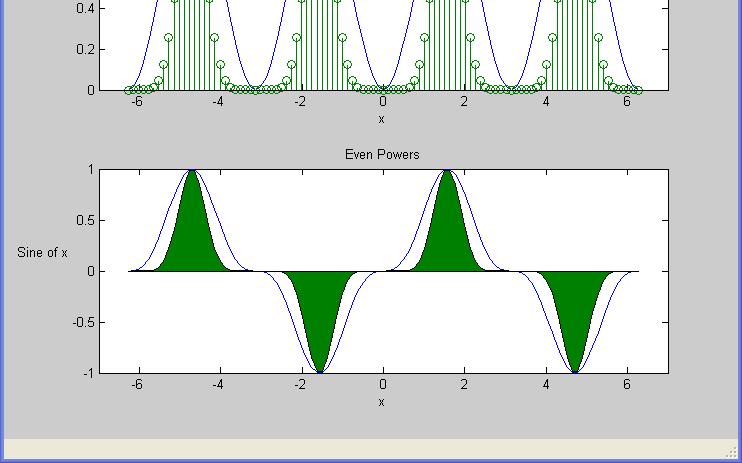
12 Specialized Plotting Routines 12


13 3-D Meshes and Surfaces 13


14 3-D Meshes and Surfaces 14


15 3-D Meshes and Surfaces 15
16 Outline Graphics Animation Image and Video Handle Graphics Objects Creating GUI using GUIDE 16
17 Animation MATLAB provides two ways of generating moving, animated graphics: 1. On the fly - Continually erase and then redraw the objects on the screen, making incremental changes with each redraw 2. Frame by frame capture and playback - Save a number of different pictures and then play them back as a movie 17
18 On the Fly Animation, 1 st example % initialize surface object x = -pi:0.1:pi; xsize = size(x,2); f = zeros(xsize); for y = 1:xsize f(:,y) = cos(y/xsize*pi) + sin(x); end % draw surface first time hsurface = surface(f, 'LineStyle', 'none'); view(3); % set the default 3D view 18
19 On the Fly Animation, 1 st example % function drawing loop for j=0:0.3:10 % update surface function for y = 1:xsize f(:,y) = cos(y/xsize*pi+j) + sin(x+j); end % update surface ZData set(hsurface, 'ZData', f); drawnow; end 19
20 On the Fly Animation, 2 nd example t = 0:pi/20:2*pi; y = exp(sin(t)); h = plot(t,y,'ydatasource','y'); for k = 1:.1:10 y = exp(sin(t.*k)); refreshdata(h,'caller') drawnow; pause(.1) end % Evaluate y in the function workspace 20
21 Frame by Frame Animation Example of frame by frame movie creation and playing: [x,y] = meshgrid([-10:0.5:10]); for j = 1:15 z = bessel(0, (j-1)*0.2 + sqrt(x.^2 +y.^2)); surf(x,y,z) axis([ ]) M(j) = getframe; end frame_order = [1:15 14:-1:1]; number_repeats = 5; movie(m, [number_repeats frame_order]); 21
22 Outline Graphics Animation Image and Video Handle Graphics Objects Creating GUI using GUIDE 22
![Images [x,map]=... imread('peppers.](/docs-images/76/73099778/images/23-0.jpg "png'); image(x) colormap(map) Image")

23 Images [x,map]=... imread('peppers.png'); image(x) colormap(map) Image I/O imread, imwrite, iminfo Image display image Display imagesc Scale and display 23
;")
;")
24 Images a = magic(4); image(a); map = hsv(16); colormap(map) colorbar 24
25 Image Processing Toolbox Image display imshow Display subimage Display multiple images in a single figure even if they have different colormaps Image exploration imtool Provides tools for pixel information, pixel region, distance, image information, adjust contrast, crop image, and display range Movie Player implay Play movie, video, or image sequence Multi-frame to movie immovie - Make MATLAB movie from a multiframe image 25
26 Video AVI aviread, avifile, addframe, close, aviinfo Allows frame-byframe manipulation of AVI files movie2avi Make AVI file from MATLAB movie Multimedia reader mmreader, read, mmfileinfo - Allows frame-by-frame manipulation of video files Newer and better than counterpart AVI functions Supports many formats using installed Windows video codecs Media Player mplay - View video from MATLAB workspace, multimedia file, or Simulink model 26
27 Related Toolboxes Image Acquisition Toolbox Acquire images and video Support for a large range of imaging devices Video and Image Processing Blockset Multimedia I/O, video viewer, and display blocks Can work in real-time Can read from / write to MATLAB workspace 27
28 Outline Graphics Animation Image and Video Handle Graphics Objects Creating GUI using GUIDE 28
29 Handle Graphics Objects Handle Graphics is an object-oriented structure for creating, manipulating and displaying graphics Graphics objects are the basic drawing elements used in MATLAB Every graphics object has: A unique identifier, called a handle A set of characteristics, called properties 29
30 Graphics Objects Hierarchy Objects are organized into a hierarchy: 30

 Image Axes")
31 Core Graphics Objects Line Figure Text Surface Axes (3-D) Image Axes (2-D) Patch 31
32 Composite Graphics Objects Composite Objects are core objects that have been grouped together to provide a more convenient interface Plot objects areaseries, barseries, contourgroup, errorbarseries, lineseries, quivergroup, scattergroup, stairseries, stemseries, surfaceplot Group objects hggroup Enables to control visibility or selectability of a group of objects hgtransform Enables to transform (etc., rotate, translate, scale) a group of objects Annotation objects Created in a hidden axes that extends the full size of the figure Enables to specify the locations anywhere in the figure using normalized coordinates 32
33 Obtaining an Object s Handle Upon creation, for example: h = plot(x_data, y_data, ) Using utility functions: 0 - root object handle (the screen) gcf returns the handle of the current figure gca - returns the handle of the current axis in the current figure gco - returns the handle of the current object in the current figure gcbo - returns the handle of the object whose callback is currently executing gcbf - returns the handle of the figure that contains the object whose callback is currently executing findobj(handles, PropertyName,PropertyValue) return objects with specific properties 33
34 Setting and Getting Properties Return a list of all object properties and their current values: get(handle) Return current value of an object property: get(handle, PropertyName ) Example: get(gcf, 'Color') Return a list of all user-settable object properties and their current values: set(handle) Return a list of all possible values for an object property: set(handle, PropertyName ) Example: set(gca, 'XDir') Set an object property to a new value: set(handle, PropertyName, NewPropertyValue ) Example: set(gca, 'XDir', 'Reverse') All the above can also be done (but not at runtime) using the Property Editor 34
35 Example Specifying Figure Position space = 5; top_space = 80; scn_size = get(0,'screensize'); pos1 = [space, 2/3*scn_size(4) + space,... scn_size(3)/2-2*space, scn_size(4)/3 - (top_space + space)]; pos2 = [pos1(1) + scn_size(3)/2, pos1(2),... pos1(3), pos1(4)]; h1 = figure(1); peaks; h2 = figure(2); membrane; set(h1, 'Position', pos1) set(h2, 'Position', pos2) 35
36 Example Background Image % Create background axes and move them to the background hback = axes('units','normalized','position',[ ]); uistack(hback,'bottom'); % Load background image and display it [back map]=imread('sipl.gif'); image(back) colormap(map) % Turn the handlevisibility off so that we don't inadvertently plot into % the axes again. Also, make the axes invisible set(hback,'handlevisibility','off','visible','off') % Now we can use the figure as required axes('position',[0.1,0.1,0.85,0.35]) plot(rand(10)) 36
37 Outline Graphics Animation Image and Video Handle Graphics Objects Creating GUI using GUIDE 37
38 What is GUIDE? GUIDE is MATLAB s Graphical User Interface (GUI) Development Environment GUIDE stores GUIs in two files:.fig file - Contains a complete description of the GUI figure layout and the GUI components Changes to this file are made in the Layout Editor.m file - Contains the code that controls the GUI Initialization code and callbacks You can program the behavior of the GUI in this file using the M-file Editor 38
39 Creating a GUI Typical stages of creating a GUI are: 1. Designing the GUI 2. Laying out the GUI Using the Layout Editor 3. Programming the GUI Writing callbacks in the M-file Editor 4. Saving and Running the GUI It is also possible to create a GUI programmatically 39


40 The Layout Editor Align Objects Menu Editor Tab Order Editor Toolbar Editor Run GUI Component Palette Object Browser Property Inspector M-file Editor Layout Area Resize Box 40


41 Hands-On GUIDE Example 41
42 Callbacks A callback is a function that executes when a specific event occurs on a graphics object Also called event handler in some programming languages A property of a graphics object All objects: ButtonDownFnc, CreateFnc, DeleteFnc User interface controls: Callback, KeyPressFcn, Figure: CloseRequestFcn, KeyPressFcn, KeyReleaseFcn, ResizeFcn, WindowButtonDownFcn, WindowButtonMotionFcn, WindowButtonUpFcn, WindowKeyPressFcn, WindowKeyReleaseFcn, WindowScrollWheelFcn Stored in the GUI s M-file 42
43 Writing Callbacks A callback is usually made of the following stages: 1. Getting the handle of the object initiating the action (the object provides event / information / values) 2. Getting the handles of the objects being affected (the object whose properties are to be changed) 3. Getting necessary information / values 4. Doing some calculations and processing 5. Setting relevant object properties to effect action 6. Save any changes that have been made to the handles structure by using guidata(hobject, handles) hobject is the handle to the component object that executes the callback 43
44 Writing Callbacks Callback from example: % --- Executes on button press in plot_button. function plot_button_callback(hobject, eventdata, handles) % hobject handle to plot_button (see GCBO) % eventdata reserved - to be defined in a future version of MATLAB % handles structure with handles and user data (see GUIDATA) % Get user input from GUI f1 = str2double(get(handles.f1_input,'string')); f2 = str2double(get(handles.f2_input,'string')); t = eval(get(handles.t_input,'string')); % Calculate data % Create frequency plot axes(handles.frequency_axes) % Select the proper axes plot(f,m(1:257)) xlabel('frequency'); set(handles.frequency_axes,'xminortick','on') grid on 44
45 Managing Data Most GUIs generate or use data specific to the application GUI components often need to communicate data to one another Several basic mechanism serve this need: UserData property Application data (getappdata, setappdata, isappdata, rmappdata) Using the handles structure (guidata) Nested functions It is also possible to make several different GUIs work together Communicate by setting each other s properties or by returning outputs 45
46 Image Processing Modular Tools Many of the interactive tools of the Image Processing Toolbox are modular and can be combined into your custom GUI For image processing applications imcontrast, imcolormaptool, imcrop, imdisplayrange, imdistline, imageinfo, immagbox, imoverview, impixelinfo, impixelregion, impixelregionpanel, imsave, imscrollpane 46
47 More Information MATLAB user manuals Graphics, 3-D Visualization, Creating Graphical User Interfaces, Image Processing Toolbox, Image Acquisition Toolbox, Video and Image Processing Blockset, Marchand P., Holland T. O., Graphics and GUIs with MATLAB, 3 ed, 2003, CRC Press Smith T. S., MATLAB Advanced GUI Development, 2006, Dog Ear Publishing Documents from Mathworks can be found at: Most of this info can also be found in MATLAB Help 47
48 48
Mechanical Engineering Department Second Year (2015)
") Lecture 7: Graphs Basic Plotting MATLAB has extensive facilities for displaying vectors and matrices as graphs, as well as annotating and printing these graphs. This section describes a few of the most
Lecture 7: Graphs Basic Plotting MATLAB has extensive facilities for displaying vectors and matrices as graphs, as well as annotating and printing these graphs. This section describes a few of the most
PROGRAMMING WITH MATLAB WEEK 6
 PROGRAMMING WITH MATLAB WEEK 6 Plot: Syntax: plot(x, y, r.- ) Color Marker Linestyle The line color, marker style and line style can be changed by adding a string argument. to select and delete lines
Logical Subscripting: This kind of subscripting can be done in one step by specifying the logical operation as the subscripting expression.
 What is the answer? >> Logical Subscripting: This kind of subscripting can be done in one step by specifying the logical operation as the subscripting expression. The finite(x)is true for all finite numerical
GRAPHICS AND VISUALISATION WITH MATLAB Part 2
 GRAPHICS AND VISUALISATION WITH MATLAB Part 2 UNIVERSITY OF SHEFFIELD CiCS DEPARTMENT Deniz Savas & Mike Griffiths March 2012 Topics Handle Graphics Animations Images in Matlab Handle Graphics All Matlab
fplot Syntax Description Examples Plot Symbolic Expression Plot symbolic expression or function fplot(f) fplot(f,[xmin xmax])
![fplot Syntax Description Examples Plot Symbolic Expression Plot symbolic expression or function fplot(f) fplot(f,[xmin xmax])](/thumbs/73/69317189.jpg "fplot Syntax Description Examples Plot Symbolic Expression Plot symbolic expression or function fplot(f) fplot(f,[xmin xmax])") fplot Plot symbolic expression or function Syntax fplot(f) fplot(f,[xmin xmax]) fplot(xt,yt) fplot(xt,yt,[tmin tmax]) fplot(,linespec) fplot(,name,value) fplot(ax, ) fp = fplot( ) Description fplot(f)
fplot Plot symbolic expression or function Syntax fplot(f) fplot(f,[xmin xmax]) fplot(xt,yt) fplot(xt,yt,[tmin tmax]) fplot(,linespec) fplot(,name,value) fplot(ax, ) fp = fplot( ) Description fplot(f)
Part #10. AE0B17MTB Matlab. Miloslav Čapek Viktor Adler, Pavel Valtr, Filip Kozák
 AE0B17MTB Matlab Part #10 Miloslav Čapek miloslav.capek@fel.cvut.cz Viktor Adler, Pavel Valtr, Filip Kozák Department of Electromagnetic Field B2-634, Prague Learning how to GUI #2 user? GUI function3
More on Plots. Dmitry Adamskiy 30 Nov 2011
 More on Plots Dmitry Adamskiy adamskiy@cs.rhul.ac.uk 3 Nov 211 1 plot3 (1) Recall that plot(x,y), plots vector Y versus vector X. plot3(x,y,z), where x, y and z are three vectors of the same length, plots
Introduction to MATLAB
 Introduction to MATLAB Violeta Ivanova, Ph.D. MIT Academic Computing violeta@mit.edu http://web.mit.edu/violeta/www/iap2006 Topics MATLAB Interface and Basics Linear Algebra and Calculus Graphics Programming
Matlab Tutorial 1: Working with variables, arrays, and plotting
 Matlab Tutorial 1: Working with variables, arrays, and plotting Setting up Matlab First of all, let's make sure we all have the same layout of the different windows in Matlab. Go to Home Layout Default.
Graphics Example a final product:
 Basic 2D Graphics 1 Graphics Example a final product: TITLE LEGEND YLABEL TEXT or GTEXT CURVES XLABEL 2 2-D Plotting Specify x-data and/or y-data Specify color, line style and marker symbol (Default values
GUI Alternatives. Syntax. Description. MATLAB Function Reference plot. 2-D line plot
 MATLAB Function Reference plot 2-D line plot GUI Alternatives Use the Plot Selector to graph selected variables in the Workspace Browser and the Plot Catalog, accessed from the Figure Palette. Directly
Special Topics II: Graphical User Interfaces (GUIs)
") Special Topics II: Graphical User Interfaces (GUIs) December 8, 2011 Structures Structures (structs, for short) are a way of managing and storing data in most programming languages, including MATLAB. Assuming
Special Topics II: Graphical User Interfaces (GUIs) December 8, 2011 Structures Structures (structs, for short) are a way of managing and storing data in most programming languages, including MATLAB. Assuming
INTRODUCTION TO MATLAB PLOTTING WITH MATLAB
 1 INTRODUCTION TO MATLAB PLOTTING WITH MATLAB Plotting with MATLAB x-y plot Plotting with MATLAB MATLAB contains many powerful functions for easily creating plots of several different types. Command plot(x,y)
Data Analysis in Geophysics ESCI Class 17. Bob Smalley. More Matlab.
 Data Analysis in Geophysics ESCI 7205 Class 17 Bob Smalley More Matlab. Final project selection due soon. Saving & Exporting Graphics The default graphics file is a Matlab Figure or.fig formatted file.
Basic plotting commands Types of plots Customizing plots graphically Specifying color Customizing plots programmatically Exporting figures
 Basic plotting commands Types of plots Customizing plots graphically Specifying color Customizing plots programmatically Exporting figures Matlab is flexible enough to let you quickly visualize data, and
What is Matlab? A software environment for interactive numerical computations
 What is Matlab? A software environment for interactive numerical computations Examples: Matrix computations and linear algebra Solving nonlinear equations Numerical solution of differential equations Mathematical
Introduction to MATLAB
 Introduction to MATLAB Violeta Ivanova, Ph.D. Office for Educational Innovation & Technology violeta@mit.edu http://web.mit.edu/violeta/www Topics MATLAB Interface and Basics Calculus, Linear Algebra,
QUICK INTRODUCTION TO MATLAB PART I
 QUICK INTRODUCTION TO MATLAB PART I Department of Mathematics University of Colorado at Colorado Springs General Remarks This worksheet is designed for use with MATLAB version 6.5 or later. Once you have
Computer Programming in MATLAB
 Computer Programming in MATLAB Prof. Dr. İrfan KAYMAZ Engineering Faculty Department of Mechanical Engineering Arrays in MATLAB; Vectors and Matrices Graphing Vector Generation Before graphing plots in
MATLAB. Creating Graphical User Interfaces Version 7. The Language of Technical Computing
 MATLAB The Language of Technical Computing Note This revision of Creating Graphical User Interfaces, issued May 2006, adds three new chapters that provide more information for creating GUIs programmatically.
Introduction to MATLAB: Graphics
 Introduction to MATLAB: Graphics Eduardo Rossi University of Pavia erossi@eco.unipv.it September 2014 Rossi Introduction to MATLAB Financial Econometrics - 2014 1 / 14 2-D Plot The command plot provides
Introduction to Matlab
 Introduction to Matlab Matlab (MATrix LABoratory) will be the programming environment of choice for the numerical solutions developed in this textbook due to its wide availability and its ease of use.
MATLAB Introduction to MATLAB Programming
 MATLAB Introduction to MATLAB Programming MATLAB Scripts So far we have typed all the commands in the Command Window which were executed when we hit Enter. Although every MATLAB command can be executed
Computational Methods of Scientific Programming. Matlab Lecture 3 Lecturers Thomas A Herring Chris Hill
 12.010 Computational Methods of Scientific Programming Matlab Lecture 3 Lecturers Thomas A Herring Chris Hill Summary of last class Continued examining Matlab operations path and addpath commands Variables
Lecture 3 for Math 398 Section 952: Graphics in Matlab
 Lecture 3 for Math 398 Section 952: Graphics in Matlab Thomas Shores Department of Math/Stat University of Nebraska Fall 2002 A good deal of this material comes from the text by Desmond Higman and Nicholas
PyPlot. The plotting library must be imported, and we will assume in these examples an import statement similar to those for numpy and math as
 Geog 271 Geographic Data Analysis Fall 2015 PyPlot Graphicscanbeproducedin Pythonviaavarietyofpackages. We willuseapythonplotting package that is part of MatPlotLib, for which documentation can be found
Table of Contents. Introduction.*.. 7. Part /: Getting Started With MATLAB 5. Chapter 1: Introducing MATLAB and Its Many Uses 7
 MATLAB Table of Contents Introduction.*.. 7 About This Book 1 Foolish Assumptions 2 Icons Used in This Book 3 Beyond the Book 3 Where to Go from Here 4 Part /: Getting Started With MATLAB 5 Chapter 1:
EXERCISES Introduction to MATLAB: Graphics
 I. Class Materials 1. Download Graphics.tar EXERCISES Introduction to MATLAB: Graphics From a web browser: Open your browser and go to http://web.mit.edu/acmath/matlab/intromatlab. Download the file Graphics.tar
Computational Methods of Scientific Programming
 12.010 Computational Methods of Scientific Programming Lecturers Thomas A Herring, Jim Elliot, Chris Hill, Summary of last class Continued examining Matlab operations path and addpath commands Variables
A General Introduction to Matlab
 Master Degree Course in ELECTRONICS ENGINEERING http://www.dii.unimore.it/~lbiagiotti/systemscontroltheory.html A General Introduction to Matlab e-mail: luigi.biagiotti@unimore.it http://www.dii.unimore.it/~lbiagiotti
Getting Started. Chapter 1. How to Get Matlab. 1.1 Before We Begin Matlab to Accompany Lay s Linear Algebra Text
 Chapter 1 Getting Started How to Get Matlab Matlab physically resides on each of the computers in the Olin Hall labs. See your instructor if you need an account on these machines. If you are going to go
DSP Laboratory (EELE 4110) Lab#1 Introduction to Matlab
 Lab#1 Introduction to Matlab") Islamic University of Gaza Faculty of Engineering Electrical Engineering Department 2012 DSP Laboratory (EELE 4110) Lab#1 Introduction to Matlab Goals for this Lab Assignment: In this lab we would have
Islamic University of Gaza Faculty of Engineering Electrical Engineering Department 2012 DSP Laboratory (EELE 4110) Lab#1 Introduction to Matlab Goals for this Lab Assignment: In this lab we would have
Introduction to Matlab
 What is Matlab? Introduction to Matlab Matlab is software written by a company called The Mathworks (mathworks.com), and was first created in 1984 to be a nice front end to the numerical routines created
m-files Matlab offers this feature through m-files, which are ascii text files containing a set of Matlab commands.
 m-files As we have seen before, it is generally convenient to save programs in some sort of file (script, macro, batch, etc.) for program development and reuse. Matlab offers this feature through m-files,
Dr. Iyad Jafar. Adapted from the publisher slides
 Computer Applications Lab Lab 6 Plotting Chapter 5 Sections 1,2,3,8 Dr. Iyad Jafar Adapted from the publisher slides Outline xy Plotting Functions Subplots Special Plot Types Three-Dimensional Plotting
Additional Plot Types and Plot Formatting
 Additional Plot Types and Plot Formatting The xy plot is the most commonly used plot type in MAT- LAB Engineers frequently plot either a measured or calculated dependent variable, say y, versus an independent
Introduction to Matlab to Accompany Linear Algebra. Douglas Hundley Department of Mathematics and Statistics Whitman College
 Introduction to Matlab to Accompany Linear Algebra Douglas Hundley Department of Mathematics and Statistics Whitman College August 27, 2018 2 Contents 1 Getting Started 5 1.1 Before We Begin........................................
Department of Chemical Engineering ChE-101: Approaches to Chemical Engineering Problem Solving MATLAB Tutorial Vb
 Department of Chemical Engineering ChE-101: Approaches to Chemical Engineering Problem Solving MATLAB Tutorial Vb Making Plots with Matlab (last updated 5/29/05 by GGB) Objectives: These tutorials are
GUI Building for Test & Measurement Applications
 by: Ahmed Abdalla, The MathWorks GUI Building for Test & Measurement Applications This article demonstrates how you can utilize the below-listed products to create a custom test and measurement GUI application
SGN Introduction to Matlab
 SGN-84007 Introduction to Matlab Lecture 4: Data Visualization Heikki Huttunen Alessandro Foi October 10, 2016 Outline Basics: figure, axes, handles, properties; Plotting univariate and multivariate data;
What is MATLAB? It is a high-level programming language. for numerical computations for symbolic computations for scientific visualizations
 What is MATLAB? It stands for MATrix LABoratory It is developed by The Mathworks, Inc (http://www.mathworks.com) It is an interactive, integrated, environment for numerical computations for symbolic computations
The Department of Engineering Science The University of Auckland Welcome to ENGGEN 131 Engineering Computation and Software Development
 The Department of Engineering Science The University of Auckland Welcome to ENGGEN 131 Engineering Computation and Software Development Chapter 7 Graphics Learning outcomes Label your plots Create different
PyPlot. The plotting library must be imported, and we will assume in these examples an import statement similar to those for numpy and math as
 Geog 271 Geographic Data Analysis Fall 2017 PyPlot Graphicscanbeproducedin Pythonviaavarietyofpackages. We willuseapythonplotting package that is part of MatPlotLib, for which documentation can be found
UNIVERSITI TEKNIKAL MALAYSIA MELAKA FAKULTI KEJURUTERAAN ELEKTRONIK DAN KEJURUTERAAN KOMPUTER
 UNIVERSITI TEKNIKAL MALAYSIA MELAKA FAKULTI KEJURUTERAAN ELEKTRONIK DAN KEJURUTERAAN KOMPUTER FAKULTI KEJURUTERAAN ELEKTRONIK DAN KEJURUTERAAN KOMPUTER BENC 2113 DENC ECADD 2532 ECADD LAB SESSION 6/7 LAB
MATLAB 7. The Language of Technical Computing KEY FEATURES
 MATLAB 7 The Language of Technical Computing MATLAB is a high-level technical computing language and interactive environment for algorithm development, data visualization, data analysis, and numerical
2D LINE PLOTS... 1 The plot() Command... 1 Labeling and Annotating Figures... 5 The subplot() Command... 7 The polarplot() Command...
 Command... 1 Labeling and Annotating Figures... 5 The subplot() Command... 7 The polarplot() Command...") Contents 2D LINE PLOTS... 1 The plot() Command... 1 Labeling and Annotating Figures... 5 The subplot() Command... 7 The polarplot() Command... 9 2D LINE PLOTS One of the benefits of programming in MATLAB
Contents 2D LINE PLOTS... 1 The plot() Command... 1 Labeling and Annotating Figures... 5 The subplot() Command... 7 The polarplot() Command... 9 2D LINE PLOTS One of the benefits of programming in MATLAB
Contents. Implementing the QR factorization The algebraic eigenvalue problem. Applied Linear Algebra in Geoscience Using MATLAB
 Applied Linear Algebra in Geoscience Using MATLAB Contents Getting Started Creating Arrays Mathematical Operations with Arrays Using Script Files and Managing Data Two-Dimensional Plots Programming in
OPEN-SANKORE MANUAL. (Start) button and type Open-Sankoré in the search box, and then click on the Open Sankoré icon as displayed in
 button and type Open-Sankoré in the search box, and then click on the Open Sankoré icon as displayed in") 2015 TABLE OF CONTENTS Sankoré Interface 2 Menu Bar.3 Floating toolbar.. 6 Textbox....8 Drawing shapes and arrows... 11 Capture screen.. 22 Library.. 23 1. Videos...25 2. Pictures. 27 Copying pictures
2015 TABLE OF CONTENTS Sankoré Interface 2 Menu Bar.3 Floating toolbar.. 6 Textbox....8 Drawing shapes and arrows... 11 Capture screen.. 22 Library.. 23 1. Videos...25 2. Pictures. 27 Copying pictures
Computational Methods of Scientific Programming Fall 2008
 MIT OpenCourseWare http://ocw.mit.edu 12.010 Computational Methods of Scientific Programming Fall 2008 For information about citing these materials or our Terms of Use, visit: http://ocw.mit.edu/terms.
L E S S O N 2 Background
 Flight, Naperville Central High School, Naperville, Ill. No hard hat needed in the InDesign work area Once you learn the concepts of good page design, and you learn how to use InDesign, you are limited
Spring 2010 Instructor: Michele Merler.
 Spring 2010 Instructor: Michele Merler http://www1.cs.columbia.edu/~mmerler/comsw3101-2.html Images are matrices (for MATLAB) Grayscale images are [nxm] matrices Color images are [nxmx3] matrices R G B
GIMP ANIMATION EFFECTS
 GIMP ANIMATION EFFECTS Animation: Text Word by Word ANIMATION: TEXT WORD BY WORD GIMP is all about IT (Images and Text) BACKGROUND IMAGE Before you begin the text animation, you will download a public
Basic MATLAB Intro III
 Basic MATLAB Intro III Plotting Here is a short example to carry out: >x=[0:.1:pi] >y1=sin(x); y2=sqrt(x); y3 = sin(x).*sqrt(x) >plot(x,y1); At this point, you should see a graph of sine. (If not, go to
What is MATLAB? What is MATLAB? Programming Environment MATLAB PROGRAMMING. Stands for MATrix LABoratory. A programming environment
 What is MATLAB? MATLAB PROGRAMMING Stands for MATrix LABoratory A software built around vectors and matrices A great tool for numerical computation of mathematical problems, such as Calculus Has powerful
BD CellQuest Pro Analysis Tutorial
 BD CellQuest Pro Analysis Tutorial Introduction This tutorial guides you through a CellQuest Pro Analysis run like the one demonstrated in the CellQuest Pro Analysis Movie on the BD FACStation Software
Overview. Lecture 13: Graphics and Visualisation. Graphics & Visualisation 2D plotting. Graphics and visualisation of data in Matlab
 Overview Lecture 13: Graphics and Visualisation Graphics & Visualisation 2D plotting 1. Plots for one or multiple sets of data, logarithmic scale plots 2. Axis control & Annotation 3. Other forms of 2D
This module aims to introduce Precalculus high school students to the basic capabilities of Matlab by using functions. Matlab will be used in
 This module aims to introduce Precalculus high school students to the basic capabilities of Matlab by using functions. Matlab will be used in subsequent modules to help to teach research related concepts
GRAPHICS AND VISUALISATION WITH MATLAB
 GRAPHICS AND VISUALISATION WITH MATLAB UNIVERSITY OF SHEFFIELD CiCS DEPARTMENT Des Ryan & Mike Griffiths September 2017 Topics 2D Graphics 3D Graphics Displaying Bit-Mapped Images Graphics with Matlab
Graphics and plotting techniques
 Davies: Computer Vision, 5 th edition, online materials Matlab Tutorial 5 1 Graphics and plotting techniques 1. Introduction The purpose of this tutorial is to outline the basics of graphics and plotting
Computational Methods of Scientific Programming. Matlab Lecture 4 Lecturers Thomas A Herring Chris Hill
 12.010 Computational Methods of Scientific Programming Matlab Lecture 4 Lecturers Thomas A Herring Chris Hill Review of Last Lecture Analysis of the some of the functions needed for the GUI development
INC151 Electrical Engineering Software Practice. MATLAB Graphics. Dr.Wanchak Lenwari :Control System and Instrumentation Engineering, KMUTT 1
 INC151 Electrical Engineering Software Practice MATLAB Graphics Dr.Wanchak Lenwari :Control System and Instrumentation Engineering, KMUTT 1 Graphical display is one of MATLAB s greatest strengths and most
Interactive Computing with Matlab. Gerald W. Recktenwald Department of Mechanical Engineering Portland State University
 Interactive Computing with Matlab Gerald W. Recktenwald Department of Mechanical Engineering Portland State University gerry@me.pdx.edu Starting Matlab Double click on the Matlab icon, or on unix systems
1 Introduction to Matlab
 1 Introduction to Matlab 1. What is Matlab? Matlab is a computer program designed to do mathematics. You might think of it as a super-calculator. That is, once Matlab has been started, you can enter computations,
1 >> Lecture 4 2 >> 3 >> -- Graphics 4 >> Zheng-Liang Lu 184 / 243
 1 >> Lecture 4 >> 3 >> -- Graphics 4 >> Zheng-Liang Lu 184 / 43 Introduction ˆ Engineers use graphic techniques to make the information easier to understand. ˆ With graphs, it is easy to identify trends,
Adobe Illustrator CS Design Professional GETTING STARTED WITH ILLUSTRATOR
 Adobe Illustrator CS Design Professional GETTING STARTED WITH ILLUSTRATOR Chapter Lessons Create a new document Explore the Illustrator window Create basic shapes Apply fill and stroke colors to objects
Adding Objects Creating Shapes Adding. Text Printing and Exporting Getting Started Creating a. Creating Shapes Adding Text Printing and Exporting
 Getting Started Creating a Workspace Pages, Masters and Guides Adding Objects Creating Shapes Adding Text Printing and Exporting Getting Started Creating a Workspace Pages, Masters and Guides Adding Objects
MATH 2221A Mathematics Laboratory II
 MATH A Mathematics Laboratory II Lab Assignment 4 Name: Student ID.: In this assignment, you are asked to run MATLAB demos to see MATLAB at work. The color version of this assignment can be found in your
ezimagex2 User s Guide Version 1.0
 ezimagex2 User s Guide Version 1.0 Copyright and Trademark Information The products described in this document are copyrighted works of AVEN, Inc. 2015 AVEN, Inc. 4595 Platt Rd Ann Arbor, MI 48108 All
Introduction to MATLAB Practical 1
 Introduction to MATLAB Practical 1 Daniel Carrera November 2016 1 Introduction I believe that the best way to learn Matlab is hands on, and I tried to design this practical that way. I assume no prior
1. Register an account on: using your Oxford address
 1P10a MATLAB 1.1 Introduction MATLAB stands for Matrix Laboratories. It is a tool that provides a graphical interface for numerical and symbolic computation along with a number of data analysis, simulation
Appendix A. Introduction to MATLAB. A.1 What Is MATLAB?
 Appendix A Introduction to MATLAB A.1 What Is MATLAB? MATLAB is a technical computing environment developed by The Math- Works, Inc. for computation and data visualization. It is both an interactive system
CSE 123. Plots in MATLAB
 CSE 123 Plots in MATLAB Easiest way to plot Syntax: ezplot(fun) ezplot(fun,[min,max]) ezplot(fun2) ezplot(fun2,[xmin,xmax,ymin,ymax]) ezplot(fun) plots the expression fun(x) over the default domain -2pi
MATLAB Tutorial. 1. The MATLAB Windows. 2. The Command Windows. 3. Simple scalar or number operations
 MATLAB Tutorial The following tutorial has been compiled from several resources including the online Help menu of MATLAB. It contains a list of commands that will be directly helpful for understanding
Purpose of the lecture MATLAB MATLAB
 Purpose of the lecture MATLAB Harri Saarnisaari, Part of Simulations and Tools for Telecommunication Course This lecture contains a short introduction to the MATLAB For further details see other sources
Basic Graphs. Dmitry Adamskiy 16 November 2011
 Basic Graphs Dmitry Adamskiy adamskiy@cs.rhul.ac.uk 16 November 211 1 Plot Function plot(x,y): plots vector Y versus vector X X and Y must have the same size: X = [x1, x2 xn] and Y = [y1, y2,, yn] Broken
MAT 343 Laboratory 4 Plotting and computer animation in MATLAB
 MAT 4 Laboratory 4 Plotting and computer animation in MATLAB In this laboratory session we will learn how to. Plot in MATLAB. The geometric properties of special types of matrices (rotations, dilations,
INTRODUCTION TO MATLAB INTERACTIVE GRAPHICS EXERCISES
 INTRODUCTION TO MATLAB INTERACTIVE GRAPHICS EXERCISES Eric Peasley, Department of Engineering Science, University of Oxford version 3.0, 2017 MATLAB Interactive Graphics Exercises In these exercises you
Scientific Functions Complex Numbers
 CNBC Matlab Mini-Course Inf and NaN 3/0 returns Inf David S. Touretzky October 2017 Day 2: More Stuff 0/0 returns NaN 3+Inf Inf/Inf 1 -Inf, -NaN 4 Scientific Functions Complex Numbers Trig: Rounding: Modular:
12 whereas if I terminate the expression with a semicolon, the printed output is suppressed.
 Example 4 Printing and Plotting Matlab provides numerous print and plot options. This example illustrates the basics and provides enough detail that you can use it for typical classroom work and assignments.
Lab of COMP 406 Introduction of Matlab (II) Graphics and Visualization
 Graphics and Visualization") Lab of COMP 406 Introduction of Matlab (II) Graphics and Visualization Teaching Assistant: Pei-Yuan Zhou Contact: cspyzhou@comp.polyu.edu.hk Lab 2: 19 Sep., 2014 1 Review Find the Matlab under the folder
Lab of COMP 406 Introduction of Matlab (II) Graphics and Visualization Teaching Assistant: Pei-Yuan Zhou Contact: cspyzhou@comp.polyu.edu.hk Lab 2: 19 Sep., 2014 1 Review Find the Matlab under the folder
INTRODUCTION TO MATLAB
 1 of 18 BEFORE YOU BEGIN PREREQUISITE LABS None EXPECTED KNOWLEDGE Algebra and fundamentals of linear algebra. EQUIPMENT None MATERIALS None OBJECTIVES INTRODUCTION TO MATLAB After completing this lab
Camtasia Studio 5.0 PART I. The Basics
 Camtasia Studio 5.0 Techsmith s Camtasia Studio software is a video screenshot creation utility that makes it easy to create video tutorials of an on screen action. This handout is designed to get you
Customisation and production of Badges. Getting started with I-Color System Basic Light
 Customisation and production of Badges Getting started with I-Color System Basic Light Table of contents 1 Creating a Badge Model 1.1 Configuration of Badge Format 1.2 Designing your Badge Model 1.2.1
Programming 1. Script files. help cd Example:
 Programming Until now we worked with Matlab interactively, executing simple statements line by line, often reentering the same sequences of commands. Alternatively, we can store the Matlab input commands
v Annotation Tools GMS 10.4 Tutorial Use scale bars, North arrows, floating images, text boxes, lines, arrows, circles/ovals, and rectangles.
 v. 10.4 GMS 10.4 Tutorial Use scale bars, North arrows, floating images, text boxes, lines, arrows, circles/ovals, and rectangles. Objectives GMS includes a number of annotation tools that can be used
IDL Tutorial. Working with Images. Copyright 2008 ITT Visual Information Solutions All Rights Reserved
 IDL Tutorial Working with Images Copyright 2008 ITT Visual Information Solutions All Rights Reserved http://www.ittvis.com/ IDL is a registered trademark of ITT Visual Information Solutions for the computer
Introduction to Matlab. WIAA Technical Workshop #2 10/20/2015
 Introduction to Matlab WIAA Technical Workshop #2 10/20/2015 * This presentation is merely an introduction to some of the functions of MATLAB and is not a comprehensive review of their capabilities. **
How to...create a Video VBOX Gauge in Inkscape. So you want to create your own gauge? How about a transparent background for those text elements?
 BASIC GAUGE CREATION The Video VBox setup software is capable of using many different image formats for gauge backgrounds, static images, or logos, including Bitmaps, JPEGs, or PNG s. When the software
The Language of Technical Computing. Computation. Visualization. Programming. Creating Graphical User Interfaces Version 1
 MATLAB The Language of Technical Computing Computation Visualization Programming Creating Graphical User Interfaces Version 1 How to Contact The MathWorks: 508-647-7000 Phone 508-647-7001 Fax The MathWorks,
MINT Interactive User s Guide
 MINT Interactive User s Guide MINT Interactive is very powerful board software including rich functions and gallery software, which are very useful for lecture environment. It will be continuously upgraded
Introduction to version Instruction date
 Introduction to version 1.1.0 Instruction date 16.5.2008 Windows and Files Start by creating the window Open FCS data file By right-clicking the axis the list of available parameters appear. Right-click
Following a tour is the easiest way to learn Prism.
 Page 1 of 25 A tour of Prism Following a tour is the easiest way to learn Prism. View a movie Watch and listen to a ten minute introductory movie from Prism's Welcome dialog. Or view it on the web. Read
Advanced Programming in MATLAB
 Advanced Programming in MATLAB Aaron Ponti September 3, 2010 Abstract In the first session of this course, we introduced some of the basic concepts of MATLAB programming. In this lecture, we want to explore
There are two ways to launch Graphical User Interface (GUI). You can either
. You can either") How to get started? There are two ways to launch Graphical User Interface (GUI). You can either 1. Click on the Guide icon 2. Type guide at the prompt Just follow the instruction below: To start GUI we
How to get started? There are two ways to launch Graphical User Interface (GUI). You can either 1. Click on the Guide icon 2. Type guide at the prompt Just follow the instruction below: To start GUI we
Graphics in MATLAB. Responsible teacher: Anatoliy Malyarenko. November 10, Abstract. Basic Plotting Commands
 Graphics in MATLAB Responsible teacher: Anatoliy Malyarenko November 10, 2003 Contents of the lecture: Two-dimensional graphics. Formatting graphs. Three-dimensional graphics. Specialised plots. Abstract
Working with Plan Production ObjectsChapter1:
 Chapter 1 Working with Plan Production ObjectsChapter1: The lessons in this chapter guide you through the processes of creating and working with plan production objects. Plan production objects include
Introduction to MATLAB
 ELG 3125 - Lab 1 Introduction to MATLAB TA: Chao Wang (cwang103@site.uottawa.ca) 2008 Fall ELG 3125 Signal and System Analysis P. 1 Do You Speak MATLAB? MATLAB - The Language of Technical Computing ELG
GIMP TEXT EFFECTS. Text Effects: Outline Completed Project
 GIMP TEXT EFFECTS ADD AN OUTLINE TO TEXT Text Effects: Outline Completed Project GIMP is all about IT (Images and Text) OPEN GIMP Step 1: To begin a new GIMP project, from the Menu Bar, select File New.
How to create an animated face
 Adobe Flash CS4 Activity 5.1 guide How to create an animated face This activity walks you step by step through the process of creating a simple animation by using Adobe Flash CS4. You use drawing tools
Math Sciences Computing Center. University ofwashington. September, Fundamentals Making Plots Printing and Saving Graphs...
 Introduction to Plotting with Matlab Math Sciences Computing Center University ofwashington September, 1996 Contents Fundamentals........................................... 1 Making Plots...........................................