Spatial data. Spatial data in R
|
|
|
- Chloe Malone
- 6 years ago
- Views:
Transcription

1 Spatial data Spatial data in R
2 What do we want to do?
3 What do we want to do?
4 What do we want to do?
5 Today s plan Geographic data types in R Projections Important large-scale data sources

6 Geographic Data Two major data types Vector Raster
7 Simple vector data - Point data Just spatial coordinates with spatial information (projection, datum) In R, SpatialPoints or SpatialPointsDataFrame Additional attributes X Y X Y Projection Datum Projection Datum
8 Polygon data a bit more complicated! Features Polygons X Y China Denmark USA UK... Each polygon gets a set of coordinates Each country is a feature Each island gets a polygon
9 SpatialPolygons and SpatialPolygonDataFrame SpatialPolygonDataFrame adds information on each feature Features China Denmark USA UK... Additional attributes
10 Navigating a SPDF Uses slots mymap@data gets the attribute table mymap@polygons gets the polygon data mymap@polygons[[5]] gets the data for the 5 th feature mymap@polygons[[5]]@polygons pulls out just the polygons mymap@polygons[[5]]@polygons[[3]] gets the third island mymap@polygons[[5]]@polygons[[3]]@coords
11 Vector data - shapefiles az@polygons[[1]]@polygons[[1]]@coords [,1] [,2] [1,] [2,] [3,] [4,] [5,] [6,]
12 Vector data - shapefiles plot(az@polygons[[1]]@polygons[[1]]@coords)
13 Vector data - shapefiles Associated attributes Depends on your file Might include names, lengths, areas etc. Use str(object_name) to find out what you have
14 Contents of a SpatialPolygonsDataFrame > str(az) Formal class 'SpatialPolygonsDataFrame' [package "sp"] with 5 slots..@ data :'data.frame': 1 obs. of 16 variables:....$ ID_0 : int $ ISO : Factor w/ 1 level "USA": 1....$ NAME_0 : Factor w/ 1 level "United States": 1....$ ID_1 : int $ NAME_1 : Factor w/ 51 levels "Alabama","Alaska",..: 3....$ VARNAME_1 : Factor w/ 51 levels "AK Alaska","AL Ala.",..: 4....$ NL_NAME_1 : Factor w/ 0 levels: NA....$ HASC_1 : Factor w/ 51 levels "US.AK","US.AL",..: 4....$ CC_1 : Factor w/ 0 levels: NA....$ TYPE_1 : Factor w/ 2 levels "Federal District",..: 2....$ ENGTYPE_1 : Factor w/ 2 levels "Federal District",..: 2....$ VALIDFR_1 : Factor w/ 35 levels " "," ",..: $ VALIDTO_1 : Factor w/ 1 level "Present": 1....$ REMARKS_1 : Factor w/ 0 levels: NA....$ Shape_Leng: num $ Shape_Area: num 28.9
15 polygons :List of 1....$ :Formal class 'Polygons' [package "sp"] with 5 slots @ Polygons :List of $ :Formal class 'Polygon' [package "sp"] with 5 slots @ labpt : num [1:2] @ area : num @ hole : logi FALSE @ ringdir: int @ coords : num [1:1655, 1:2] @ plotorder: int @ labpt : num [1:2] @ ID : chr "2" @ area : num @ plotorder : int 1..@ bbox : num [1:2, 1:2] attr(*, "dimnames")=list of $ : chr [1:2] "x" "y"......$ : chr [1:2] "min" "max"..@ proj4string:formal class 'CRS' [package "sp"] with 1 slots......@ projargs: chr " +proj=longlat +datum=nad27 +ellps=clrk66 +nadgrids=@conus,@alaska,@ntv2_0.gsb,@ntv1_can.dat" plot(az@polygons[[1]]@polygons[[1]]@coords)
16 What is a raster? A raster is a pixel-based (grid) format with spatial information
17 What is a raster? A raster is a pixel-based (grid) format with spatial information
18 What is a raster? A raster is a pixel-based (grid) format with spatial information Extent
19 What is a raster? A raster is a pixel-based (grid) format with spatial information Resolution Extent
20 What is a raster? A raster is a pixel-based (grid) format with spatial information Origin Resolution Extent
21 What is a raster? A raster is a pixel-based (grid) format with spatial information Origin Resolution Projection, datum Extent
22 What is a raster object? An R raster object contains A vector of values A size (nrow, ncol) Spatial information (extent, projection, datum) A raster can have some of these things missing (for example, no data values, or no projection)
23 What is a raster object? > mat = raster( MAT.tif ) > mat class : RasterLayer dimensions : 2882, 2880, (nrow, ncol, ncell) resolution : , (x, y) extent : 0, 12, 48, (xmin, xmax, ymin, ymax) projection : +proj=longlat +ellps=wgs84 +datum=wgs84 +no_defs +towgs84=0,0,0 values : C:/Users/brody/Documents/Teaching/R for Macroecology/Week 4/MAT.tif min :? max :? Where s the data?
24 Raster objects are different! Normal objects are stored in memory, for fast access Raster objects are not always When you define a raster object R looks at the summary information and remembers the hard drive locations Small rasters often do reside in memory Advantages and disadvantages
25 The structure of a raster object Stored as a big vector n ncol = n
26 Create a new raster > newraster = raster(nrows = 10,ncols = 6,xmn = 0,xmx = 6,ymn = 50,ymx = 60,crs = "+proj=longlat +datum=wgs84") > newraster class : RasterLayer dimensions : 10, 6, 60 (nrow, ncol, ncell) resolution : 1, 1 (x, y) extent : 0, 6, 50, 60 (xmin, xmax, ymin, ymax) projection : +proj=longlat +datum=wgs84 +ellps=wgs84 +towgs84=0,0,0 values : none
27 Create a new raster > newraster = setvalues(newraster,1:60) > plot(newraster)
28 Getting values from a raster > newraster[22] [1] 22 > newraster[2,4] [1] 10 > getvalues(newraster)[12] [1] 12
29 Plotting a raster plot() xlim and ylim control plotting window (just like usual) col specifies the color palette (this works a bit differently) subsample (defaults to TRUE) determines whether or not to plot every pixel (if TRUE, only plots at most maxpixel pixels) colors rbg(), rainbow(), heat.colors(), terrain.colors(), topo.colors() I also like the colors in fbasics package Can also use image() Similar, but no scale bar
,0.5,0.")
,ylim =")
30 Plotting examples plot(newraster,col = rgb(seq(0,1,0.2),0.5,0.5)) plot(newraster,maxpixels = 7) plot(newraster,xlim = c(2,5),ylim = c(52,59),col = rainbow(50))
31 A few useful ways to explore rasters zoom() Opens a new active plotting window with the selected region click() Queries a value, if xy = TRUE, also returns the x and y coordinates
32 Polygon -> Raster rasterize(polygon, raster)
33 Polygon -> Raster rasterize(polygon, raster)
34 Polygon -> Raster rasterize(polygon, raster)
35 Raster -> Polygon rastertopolygons() in raster package Conceptually much simpler!

36 Extracting values from rasters
37 Extraction extract() function in raster package extract(raster, points) Gives the raster value at those points extract(raster,polygons) Gives a list back of all raster values within all feature If you give it a function (like fun = mean) it will instead return the mean within each feature
38 Handling giant rasters Huge rasters can be a pain to work with They can regularly be larger than your RAM R solves this by not reading into RAM But if you are doing lots of queries on a raster, it can be much faster to convert it to a matrix first Do what you want to do, and then use rm() to free up the memory that the matrix was using
39 Raster data in different formats Raster Slow access Little RAM usage Matrix Fast access Heavy RAM usage Rows and columns match raster Vector Fast access Heavy RAM usage Entries in same order as raster
40 Raster data in different formats as.matrix() getvalues()
41 Raster data in different formats as.matrix() getvalues() raster() setvalues()
42 Raster data in different formats as.matrix() getvalues() raster() setvalues() as.matrix(,by.row = T) as.vector(t())
43 Spatial data types wrap-up We have seen the major data types raster and vector type Transforming from one to the other Extracting rasters according to vector data Handling very large files Any questions?
44 On to projections!
45 What is a projection? A representation of the spherical world on the plane They always produce some distortion (of shape, area or direction) Projection, datum, ellipse Projection describes how the spherical coordinates are flattened Datum describes how the Earth ellipsoid is modeled projinfo( proj ) and projinfo( datum ) show you the options available More info here:


46 Projections Cylindrical projections Lambert CEA


47 Behrmann EA Latitude of true scale = 30
 Area (equal area) Distance from a point (equidistant) Directions should be strait lines (gnomonic) Minimize distortion Cylindrical, conic, azimuthal")
48 Choosing a projection What properties are important? Angles (conformal) Area (equal area) Distance from a point (equidistant) Directions should be strait lines (gnomonic) Minimize distortion Cylindrical, conic, azimuthal
49 Projections in R Projections in R use the proj.4 library This is a system of codes to describe the projection +proj=longlat +datum=wgs84 +proj=cea +datum=nad83 +lat_ts=30 +lon_0=45
50 Projecting points project() function in the rgdal package is good sptransform() (in rgdal) works for SpatialPoints, SpatialLines, SpatialPolygons... Can also handle transformations from one datum to another
51 Projecting points > lat = rep(seq(-90,90,by = 5),(72+1)) > long = rep(seq(-180,180,by = 5),each = (36+1)) > xy = project(cbind(long,lat),"+proj=cea +datum=wgs84 +lat_ts=30") > par(mfrow = c(1,2)) > plot(long,lat) > plot(xy)
52 Projecting points > lat = rep(seq(-90,90,by = 5),(72+1)) > long = rep(seq(-180,180,by = 5),each = (36+1)) > xy = project(cbind(long,lat),"+proj=cea +datum=wgs84 +lat_ts=30") > par(mfrow = c(1,2)) > plot(long,lat) > plot(xy) project() assumes that the starting coordinates are in lat/long, and that you want to project into another coordinate system. If instead, your points are in another system and you want to go to lat/long, that is called an inverse projection, and you use inv=t
53 Projecting a shape sptransform() in the rgdal package az2 = sptransform(az,crs("+proj=aea +lat_1=22 +lat_2=45")) plot(az2)
54 Some examples plot(sptransform(wm,crs("+proj=aea +lat1=-20 +lat2=20")))
55 Some examples plot(sptransform(wm,crs("+proj=rpoly")))
56 Projecting a grid Projecting a grid is conceptually harder The approach is basically: Create a new grid in the new coordinate system Fill that grid with values by interpolating (or just sampling) from the old grid
57 Projecting a grid > mat = raster("mat.tif") > mat = aggregate(mat,10) > bea = projectextent(mat,"+proj=cea +datum=wgs84 +lat_ts=30") > mat class : RasterLayer dimensions : 289, 288, (nrow, ncol, ncell) resolution : , (x, y) extent : 0, 12, , (xmin, xmax, ymin, ymax) projection : +proj=longlat +ellps=wgs84 +datum=wgs84 +no_defs +towgs84=0,0,0 values : in memory min value : max value : > bea class : RasterLayer dimensions : 289, 288, (nrow, ncol, ncell) resolution : , (x, y) extent : 0, , , (xmin, xmax, ymin, ymax) projection : +proj=cea +datum=wgs84 +lat_ts=30 +ellps=wgs84 +towgs84=0,0,0 values : none
58 Projecting a grid > bea = projectextent(mat,"+proj=cea +datum=wgs84 +lat_ts=30") > res(bea) = xres(bea) > matbea = projectraster(mat,bea) > mat class : RasterLayer dimensions : 289, 288, (nrow, ncol, ncell) resolution : , (x, y) extent : 0, 12, , (xmin, xmax, ymin, ymax) projection : +proj=longlat +ellps=wgs84 +datum=wgs84 +no_defs +towgs84=0,0,0 values : in memory min value : max value : > matbea class : RasterLayer dimensions : 169, 288, (nrow, ncol, ncell) resolution : , (x, y) extent : 0, , , (xmin, xmax, ymin, ymax) projection : +proj=cea +datum=wgs84 +ellps=wgs84 +towgs84=0,0,0 +lat_ts=30 values : in memory min value : max value :


59 How does it look?
60 What happened? x = xfromcell(bea,1:ncell(bea)) y = yfromcell(bea,1:ncell(bea)) plot(x,y,pch = ".") xyll = project(cbind(x,y), "+proj=cea +datum=wgs84 +latts=30,inverse = T) plot(xyll,pch = ".")

 Identical spacing in x")
61 Different spacing in y direction What happened Grid of points in lat-long (where each point corresponds with a BEA grid cell) Sample original raster at those points (with interpolation) Identical spacing in x direction

 extent : 0, 1335834, 4721690, 5505565 (xmin, xmax,")

62 What are the units? > matbea class : RasterLayer dimensions : 169, 288, (nrow, ncol, ncell) resolution : , (x, y) extent : 0, , , (xmin, xmax, ymin, ymax) projection : +proj=cea +datum=wgs84 +ellps=wgs84 +towgs84=0,0,0 +lat_ts=30 values : in memory min value : max value : Meters, along the latitude of true scale (30N and 30S)
63 Important spatial data sources World climate data (worldclim.org) Digital elevation models (Shuttle Radar Topography Mission (SRTM), Species range maps ( Biodiversity observations (gbif.org)

64 Worldclim Interpolated from weather station data Includes 19 bioclimate variables intended to be physiologically important climate descriptors


65 SRTM DEM 90 m resolution, nearly complete coverage


66 IUCN Distribution maps for more than 6000 amphibians, 5488 mammals Bird maps from

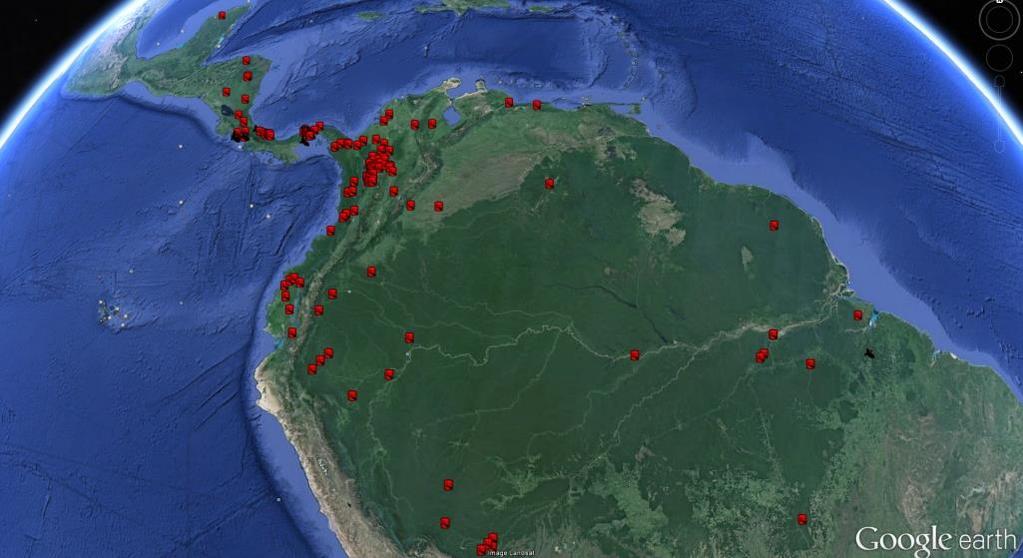
67 GBIF Points observations for 375 million records
Working with Geospatial Data in R. Introducing sp objects
 Introducing sp objects Data frames aren t a great way to store spatial data > head(ward_sales) ward lon lat group order num_sales avg_price 1 1-123.3128 44.56531 0.1 1 159 311626.9 2 1-123.3122 44.56531
Spatial data analysis with
 Spatial data analysis with Spatial is special Complex: geometry and attributes The earth is not flat Size: lots and lots of it, multivariate, time series Special plots: maps First Law of Geography: nearby
Spatial data with R. some applications to weather and agriculture. Joe Wheatley. Dublin R 21 Feb Biospherica Risk
 Spatial data with R some applications to weather and agriculture Joe Wheatley Biospherica Risk Dublin R 21 Feb 2013 mm 30 20 10 0 Packages sp vector data raster grid data rgdal input/output, coordinate
Zev Ross President, ZevRoss Spatial Analysis
 SPATIAL ANALYSIS IN R WITH SF AND RASTER Welcome! Zev Ross President, ZevRoss Spatial Analysis Packages we will use in this course Two key packages sf for vectors raster for grids Additional packages discussed
Spatial Data in R. Release 1.0. Robert Hijmans
 Spatial Data in R Release 1.0 Robert Hijmans Sep 16, 2018 CONTENTS 1 1. Introduction 1 2 2. Spatial data 3 2.1 2.1 Introduction............................................. 3 2.2 2.2 Vector data..............................................
Spatial Data Analysis with R
 Spatial Data Analysis with R Release 0.1 Robert Hijmans April 12, 2018 CONTENTS 1 1. Introduction 1 2 2. Spatial data 3 2.1 2.1 Introduction............................................. 3 2.2 2.2 Vector
Zev Ross President, ZevRoss Spatial Analysis
 SPATIAL ANALYSIS IN R WITH SF AND RASTER A quick refresher on the coordinate Zev Ross President, ZevRoss Spatial Analysis reference system Coordinate reference system A place on the earth is specified
Analysing Spatial Data in R: Representing Spatial Data
 Analysing Spatial Data in R: Representing Spatial Data Roger Bivand Department of Economics Norwegian School of Economics and Business Administration Bergen, Norway 31 August 2007 Object framework To begin
Package Grid2Polygons
 Package Grid2Polygons February 15, 2013 Version 0.1-2 Date 2013-01-28 Title Convert Spatial Grids to Polygons Author Jason C. Fisher Maintainer Jason C. Fisher Depends R (>= 2.15.0),
Package velox. R topics documented: December 1, 2017
 Type Package Title Fast Raster Manipulation and Extraction Version 0.2.0 Date 2017-11-30 Author Philipp Hunziker Package velox December 1, 2017 Maintainer Philipp Hunziker BugReports
Writing functions with the raster package
 Writing functions with the raster package Robert J. Hijmans November 12, 2017 1 Introduction The raster package has a number of low-level functions (e.g. to read and write files) that allow you to write
Introduction to the raster package (version 2.6-7)
") Introduction to the raster package (version 2.6-7) Robert J. Hijmans November 12, 2017 1 Introduction This vignette describes the R package raster. A raster is a spatial (geographic) data structure that
Introduction to the raster package (version 2.6-7) Robert J. Hijmans November 12, 2017 1 Introduction This vignette describes the R package raster. A raster is a spatial (geographic) data structure that
Using R as a GIS. Alan R. Pearse. 31 July 2017
 Using R as a GIS Alan R. Pearse 31 July 2017 Contact Email: ar.pearse@qut.edu.au Contents Data sources A note on syntax What is R? Why do GIS in R? Must-have R packages Overview of spatial data types in
Package redlistr. May 11, 2018
 Package redlistr May 11, 2018 Title Tools for the IUCN Red List of Ecosystems and Species Version 1.0.1 A toolbox created by members of the International Union for Conservation of Nature (IUCN) Red List
Some methods for the quantification of prediction uncertainties for digital soil mapping: Universal kriging prediction variance.
 Some methods for the quantification of prediction uncertainties for digital soil mapping: Universal kriging prediction variance. Soil Security Laboratory 2018 1 Universal kriging prediction variance In
Calculate Burn Severity Patch Sizes with SDMtools in R Anna Talucci 19 May 2017
 Calculate Burn Severity Patch Sizes with SDMtools in R Anna Talucci 19 May 2017 Overview This analysis is focused on generating some descriptive statisitcs about patch size for burn severity classes across
Package angstroms. May 1, 2017
 Package angstroms May 1, 2017 Title Tools for 'ROMS' the Regional Ocean Modeling System Version 0.0.1 Helper functions for working with Regional Ocean Modeling System 'ROMS' output. See
Zev Ross President, ZevRoss Spatial Analysis
 SPATIAL ANALYSIS IN R WITH SF AND RASTER Buffers and centroids Zev Ross President, ZevRoss Spatial Analysis Use a projected coordinate reference system for spatial analysis As a general rule your layers
Geometric Correction of Imagery
 Geometric Correction of Imagery Geometric Correction of Imagery Present by: Dr.Weerakaset Suanpaga D.Eng(RS&GIS) The intent is to compensate for the distortions introduced by a variety of factors, so that
Geoapplications development Control work 1 (2017, Fall)
") Page 1 Geoapplications development Control work 1 (2017, Fall) Author: Antonio Rodriges, Oct. 2017 http://rgeo.wikience.org/ Surname, name, patronymic: Group: Date: Signature: Select all correct statements.
Page 1 Geoapplications development Control work 1 (2017, Fall) Author: Antonio Rodriges, Oct. 2017 http://rgeo.wikience.org/ Surname, name, patronymic: Group: Date: Signature: Select all correct statements.
Tinn-R - [C:\Users\admin2\Documents\Enseignements\IRSAE-2014\Course\R-script spatial data in ecology.r]
![Tinn-R - [C:\Users\admin2\Documents\Enseignements\IRSAE-2014\Course\R-script spatial data in ecology.r]](/thumbs/84/90595048.jpg "Tinn-R - [C:\Users\admin2\Documents\Enseignements\IRSAE-2014\Course\R-script spatial data in ecology.r]") 1/5 # Set the working directory (change the path to locate your files) setwd("c:/users/admin2/documents/enseignements/irsae-2014") # Load the maptools package library(maptools) # Load the dataset "wrld_simpl"
1/5 # Set the working directory (change the path to locate your files) setwd("c:/users/admin2/documents/enseignements/irsae-2014") # Load the maptools package library(maptools) # Load the dataset "wrld_simpl"
LECTURE TWO Representations, Projections and Coordinates
 LECTURE TWO Representations, Projections and Coordinates GEOGRAPHIC COORDINATE SYSTEMS Why project? What is the difference between a Geographic and Projected coordinate system? PROJECTED COORDINATE SYSTEMS
Package shadow. November 5, 2017
 Type Package Title Geometric Shadow Calculations Version 0.4.0 Package shadow November 5, 2017 Functions for calculating (1 shadow heights; (2 shadow footprint on ground polygons; and (3 Sky View Factor
Package meteoforecast
 Type Package Title Numerical Weather Predictions Version 0.51 Date 2017-04-01 Package meteoforecast April 2, 2017 Access to several Numerical Weather Prediction services both in raster format and as a
Objectives for Terrain Week
 The Terrain Correction Chuck Connor, Laura Connor Potential Fields Geophysics: Terrain Week for Terrain Week Learn about the terrain correction The inner terrain correction Learn about The outer terrain
Geographic Information Systems. using QGIS
 Geographic Information Systems using QGIS 1 - INTRODUCTION Generalities A GIS (Geographic Information System) consists of: -Computer hardware -Computer software - Digital Data Generalities GIS softwares
Final project: Lecture 21 - Chapter 8 (Raster Analysis, part2) GEOL 452/552 - GIS for Geoscientists I
 GEOL 452/552 - GIS for Geoscientists I") GEOL 452/552 - GIS for Geoscientists I Lecture 21 - Chapter 8 (Raster Analysis, part2) Talk about class project (copy follow_along_data\ch8a_class_ex into U:\ArcGIS\ if needed) Catch up with lecture 20
GEOL 452/552 - GIS for Geoscientists I Lecture 21 - Chapter 8 (Raster Analysis, part2) Talk about class project (copy follow_along_data\ch8a_class_ex into U:\ArcGIS\ if needed) Catch up with lecture 20
Spatial Data Analysis: Introduction to Raster Processing: Part-3
 Spatial Data Analysis: Introduction to Raster Processing: Part-3 Background Geospatial data is becoming increasingly used to solve numerous real-life problems (check out some examples here.) In turn, R
Smart GIS Course. Developed By. Mohamed Elsayed Elshayal. Elshayal Smart GIS Map Editor and Surface Analysis. First Arabian GIS Software
 Smart GIS Course Developed By Mohamed Elsayed Elshayal Elshayal Smart GIS Map Editor and Surface Analysis First Arabian GIS Software http://www.freesmartgis.blogspot.com/ http://tech.groups.yahoo.com/group/elshayalsmartgis/
Lab 2. Vector and raster data.
 Lab 2. Vector and raster data. The goal: To learn about the structure of the vector and raster data types. Objective: Create vector and raster datasets and visualize them. Software for the lab: ARCINFO,
Lecture 21 - Chapter 8 (Raster Analysis, part2)
") GEOL 452/552 - GIS for Geoscientists I Lecture 21 - Chapter 8 (Raster Analysis, part2) Today: Digital Elevation Models (DEMs), Topographic functions (surface analysis): slope, aspect hillshade, viewshed,
GEOL 452/552 - GIS for Geoscientists I Lecture 21 - Chapter 8 (Raster Analysis, part2) Today: Digital Elevation Models (DEMs), Topographic functions (surface analysis): slope, aspect hillshade, viewshed,
Package seg. February 15, 2013
 Package seg February 15, 2013 Version 0.2-4 Date 2013-01-21 Title A set of tools for residential segregation research Author Seong-Yun Hong, David O Sullivan Maintainer Seong-Yun Hong
Package rangebuilder
 Type Package Package rangebuilder May 31, 2017 Title Occurrence Filtering, Geographic and Taxonomic Standardization and Generation of Species Range Polygons Version 1.4 Date 2017-05-31 Author Maintainer
Making Maps: Salamander Species in US. Read in the Data
 Anything Arc can do, R can do better OR How to lose Arc in 10 days (part 1/n) UA Summer R Workshop: Week 3 Nicholas M. Caruso Christina L. Staudhammer 14 June 2016 Making Maps: Salamander Species in US
In this lab, you will create two maps. One map will show two different projections of the same data.
 Projection Exercise Part 2 of 1.963 Lab for 9/27/04 Introduction In this exercise, you will work with projections, by re-projecting a grid dataset from one projection into another. You will create a map
Package seg. September 8, 2013
 Package seg September 8, 2013 Version 0.3-2 Date 2013-09-08 Title A set of tools for measuring spatial segregation Author Seong-Yun Hong, David O Sullivan Maintainer Seong-Yun Hong
Package osrm. November 13, 2017
 Package osrm November 13, 2017 Type Package Title Interface Between R and the OpenStreetMap-Based Routing Service OSRM Version 3.1.0 Date 2017-11-13 An interface between R and the OSRM API. OSRM is a routing
CHAPTER 5 3D STL PART FROM SURFER GRID DEM DATA
 CHAPTER 5 3D STL PART FROM SURFER GRID DEM DATA The Surfer Grid is another widely used DEM file format and found to be suitable for the direct conversion to faceted formats. The chapter begins with an
Kriging Peter Claussen 9/5/2017
 Kriging Peter Claussen 9/5/2017 Libraries automap : Automatic interpolation package library(automap) ## Loading required package: sp ## Warning: package 'sp' was built under R version 3.3.2 library(gstat)
COORDINATE TRANSFORMATION. Lecture 6
 COORDINATE TRANSFORMATION Lecture 6 SGU 1053 SURVEY COMPUTATION 1 Introduction Geomatic professional are mostly confronted in their work with transformations from one two/three-dimensional coordinate system
Spatial Ecology Lab 6: Landscape Pattern Analysis
 Spatial Ecology Lab 6: Landscape Pattern Analysis Damian Maddalena Spring 2015 1 Introduction This week in lab we will begin to explore basic landscape metrics. We will simply calculate percent of total
Terrain Analysis. Using QGIS and SAGA
 Terrain Analysis Using QGIS and SAGA Tutorial ID: IGET_RS_010 This tutorial has been developed by BVIEER as part of the IGET web portal intended to provide easy access to geospatial education. This tutorial
APoLUS User guide version 1.4 (November 26th 2015)
") APoLUS User guide version 1.4 (November 26th 2015) 1. Most important advances from previous versions 1. Renamed to APoLUS (Actor, Policy and Land Use Simulator) to take into account what we are trying
APoLUS User guide version 1.4 (November 26th 2015) 1. Most important advances from previous versions 1. Renamed to APoLUS (Actor, Policy and Land Use Simulator) to take into account what we are trying
Objectives Learn how GMS uses rasters to support all kinds of digital elevation models and how rasters can be used for interpolation in GMS.
 v. 9.1 GMS 9.1 Tutorial Using rasters for interpolation and visualization in GMS Objectives Learn how GMS uses rasters to support all kinds of digital elevation models and how rasters can be used for interpolation
GEOGRAPHIC INFORMATION SYSTEMS Lecture 25: 3D Analyst
 GEOGRAPHIC INFORMATION SYSTEMS Lecture 25: 3D Analyst 3D Analyst - 3D Analyst is an ArcGIS extension designed to work with TIN data (triangulated irregular network) - many of the tools in 3D Analyst also
Tutorial 1: Downloading elevation data
 Tutorial 1: Downloading elevation data Objectives In this exercise you will learn how to acquire elevation data from the website OpenTopography.org, project the dataset into a UTM coordinate system, and
Spatio-temporal overlay and aggregation. Edzer Pebesma. April 24, 2015
 1. Das neue IfGI-Logo 1.6 Logovarianten Spatio-temporal overlay and aggregation Logo für den Einsatz in internationalen bzw. englischsprachigen Präsentationen. Einsatzbereiche: Briefbogen, Visitenkarte,
I. An Intro to ArcMap Version 9.3 and 10. 1) Arc Map is basically a build your own Google map
 Arc Map is basically a build your own Google map") I. An Intro to ArcMap Version 9.3 and 10 What is Arc Map? 1) Arc Map is basically a build your own Google map a. Display and manage geo-spatial data (maps, images, points that have a geographic location)
I. An Intro to ArcMap Version 9.3 and 10 What is Arc Map? 1) Arc Map is basically a build your own Google map a. Display and manage geo-spatial data (maps, images, points that have a geographic location)
Review of Cartographic Data Types and Data Models
 Review of Cartographic Data Types and Data Models GIS Data Models Raster Versus Vector in GIS Analysis Fundamental element used to represent spatial features: Raster: pixel or grid cell. Vector: x,y coordinate
Technical Specifications
 1 Contents INTRODUCTION...3 ABOUT THIS LAB...3 IMPORTANCE OF THIS MODULE...3 EXPORTING AND IMPORTING DATA...4 VIEWING PROJECTION INFORMATION...5...6 Assigning Projection...6 Reprojecting Data...7 CLIPPING/SUBSETTING...7
Package mapr. April 11, 2017
 Title Visualize Species Occurrence Data Package mapr April 11, 2017 Utilities for visualizing species occurrence data. Includes functions to visualize occurrence data from 'spocc', 'rgbif', and other packages.
Definition of Basic Polar Data Product
 Definition of Basic Polar Data Product OPERA project 1d3: working document WD 02 03 Iwan Holleman and Gianmario Galli Date: September 22, 2003 1 1 Introduction During the OPERA project an additional deliverable
Package spatial.tools
 Package spatial.tools February 20, 2015 Maintainer Jonathan Asher Greenberg License GPL (>= 2) Title R functions for working with spatial data. Type Package LazyLoad yes Author
Projections for use in the Merced River basin
 Instructions to download Downscaled CMIP3 and CMIP5 Climate and Hydrology Projections for use in the Merced River basin Go to the Downscaled CMIP3 and CMIP5 Climate and Hydrology Projections website. 1.
Package mapr. March 21, 2018
 Title Visualize Species Occurrence Data Package mapr March 21, 2018 Utilities for visualizing species occurrence data. Includes functions to visualize occurrence data from 'spocc', 'rgbif', and other packages.
Package gfcanalysis. August 29, 2016
 Package gfcanalysis August 29, 2016 Version 1.4 Date 2015-11-20 Title Tools for Working with Hansen et al. Global Forest Change Dataset Maintainer Alex Zvoleff Depends R (>=
Package trajectories
 Version 0.1-4 Date 2015-08-19 Title Classes and Methods for Trajectory Data Depends R (>= 3.0.0) Package trajectories August 29, 2016 Imports stats, utils, graphics, methods, lattice, sp (>= 1.1-0), spacetime
Understanding and Using Geometry, Projections, and Spatial Reference Systems in ArcGIS Annette Locke, Rob Juergens
 Understanding and Using Geometry, Projections, and Spatial Reference Systems in ArcGIS Annette Locke, Rob Juergens Introduction We present fundamental concepts necessary for the correct and efficient use
Combine Yield Data From Combine to Contour Map Ag Leader
 Combine Yield Data From Combine to Contour Map Ag Leader Exporting the Yield Data Using SMS Program 1. Data format On Hard Drive. 2. Start program SMS Basic. a. In the File menu choose Open. b. Click on
Terms and definitions * keep definitions of processes and terms that may be useful for tests, assignments
 Lecture 1 Core of GIS Thematic layers Terms and definitions * keep definitions of processes and terms that may be useful for tests, assignments Lecture 2 What is GIS? Info: value added data Data to solve
CALPUFF View. Graphical Interface for the US EPA Approved Long Range Transport Model - CALPUFF
 CALPUFF View Graphical Interface for the US EPA Approved Long Range Transport Model - CALPUFF These release notes cover CALPUFF View Version 3.0.0. They provide: New Features Resolved Issues Tel: (519)
Lecture 22 - Chapter 8 (Raster Analysis, part 3)
") GEOL 452/552 - GIS for Geoscientists I Lecture 22 - Chapter 8 (Raster Analysis, part 3) Today: Zonal Analysis (statistics) for polygons, lines, points, interpolation (IDW), Effects Toolbar, analysis masks
GEOL 452/552 - GIS for Geoscientists I Lecture 22 - Chapter 8 (Raster Analysis, part 3) Today: Zonal Analysis (statistics) for polygons, lines, points, interpolation (IDW), Effects Toolbar, analysis masks
The Traditional Graphics Pipeline
 Last Time? The Traditional Graphics Pipeline Participating Media Measuring BRDFs 3D Digitizing & Scattering BSSRDFs Monte Carlo Simulation Dipole Approximation Today Ray Casting / Tracing Advantages? Ray
Report: Comparison of Methods to Produce Digital Terrain Models
 Report: Comparison of Methods to Produce Digital Terrain Models Evan J Fedorko West Virginia GIS Technical Center 27 April 2005 Introduction This report compares Digital Terrain Models (DTM) created through
Exercise 6-1 Image Georegistration Using RESAMPLE
 Exercise 6-1 Image Georegistration Using RESAMPLE Resampling is a procedure for spatially georeferencing an image to its known position on the ground. Often, this procedure is used to register an image
3. Map Overlay and Digitizing
 3. Map Overlay and Digitizing 3.1 Opening Map Files NavviewW/SprayView supports digital map files in ShapeFile format from ArcView, DXF format from AutoCAD, MRK format from AG-NAV, Bitmap and JPEG formats
Package waver. January 29, 2018
 Type Package Title Calculate Fetch and Wave Energy Version 0.2.1 Package waver January 29, 2018 Description Functions for calculating the fetch (length of open water distance along given directions) and
The Traditional Graphics Pipeline
 Last Time? The Traditional Graphics Pipeline Reading for Today A Practical Model for Subsurface Light Transport, Jensen, Marschner, Levoy, & Hanrahan, SIGGRAPH 2001 Participating Media Measuring BRDFs
Monitoring Vegetation in a Changing Climate [D5P3a] Gregory Duveiller August 3, 2018
![Monitoring Vegetation in a Changing Climate [D5P3a] Gregory Duveiller August 3, 2018](/thumbs/93/111377864.jpg "Monitoring Vegetation in a Changing Climate [D5P3a] Gregory Duveiller August 3, 2018") Monitoring Vegetation in a Changing Climate [D5P3a] Gregory Duveiller August 3, 218 Introduction This document outlines the steps that will be taken in the practicals of Monitoring Vegetation in a Changing
Monitoring Vegetation in a Changing Climate [D5P3a] Gregory Duveiller August 3, 218 Introduction This document outlines the steps that will be taken in the practicals of Monitoring Vegetation in a Changing
Spatial Data Models. Raster uses individual cells in a matrix, or grid, format to represent real world entities
 Spatial Data Models Raster uses individual cells in a matrix, or grid, format to represent real world entities Vector uses coordinates to store the shape of spatial data objects David Tenenbaum GEOG 7
Alberta-wide ALOS DSM "ALOS_DSM15.tif", "ALOS_DSM15_c6.tif"
 Alberta-wide ALOS DSM "ALOS_DSM15.tif", "ALOS_DSM15_c6.tif" Alberta Biodiversity Monitoring Institute Geospatial Centre May 2017 Contents 1. Overview... 2 1.1. Summary... 2 1.2 Description... 2 1.3 Credits...
Downscaling species occupancy: an introduction and tutorial
 Downscaling species occupancy: an introduction and tutorial Charles J. Marsh August 25, 2017 Contents 1 Introduction to downscaling 2 2 Using the downscale package 4 3 Package tutorial 6 3.1 A quick example...................................
NEXTMap World 30 Digital Surface Model
 NEXTMap World 30 Digital Surface Model Intermap Technologies, Inc. 8310 South Valley Highway, Suite 400 Englewood, CO 80112 083013v3 NEXTMap World 30 (top) provides an improvement in vertical accuracy
Objectives Learn how to work with projections in GMS, and how to combine data from different coordinate systems into the same GMS project.
 v. 10.2 GMS 10.2 Tutorial Working with map projections in GMS Objectives Learn how to work with projections in GMS, and how to combine data from different coordinate systems into the same GMS project.
Math 7 Elementary Linear Algebra PLOTS and ROTATIONS
 Spring 2007 PLOTTING LINE SEGMENTS Math 7 Elementary Linear Algebra PLOTS and ROTATIONS Example 1: Suppose you wish to use MatLab to plot a line segment connecting two points in the xy-plane. Recall that
Species Distribution Modeling - Part 2 Michael L. Treglia Material for Lab 8 - Part 2 - of Landscape Analysis and Modeling, Spring 2016
 Species Distribution Modeling - Part 2 Michael L. Treglia Material for Lab 8 - Part 2 - of Landscape Analysis and Modeling, Spring 2016 This document, with active hyperlinks, is available online at: http://
THE FUTURE OF STATE PLANE COORDINATES AT ODOT
 THE FUTURE OF STATE PLANE COORDINATES AT ODOT BY: RAY FOOS P.S. AND BRIAN MEADE P.S. THE OHIO DEPARTMENT OF TRANSPORTATION WORKING WITH STATE PLANE COORDINATES OR HOW TO MAKE THE EARTH FLAT SURVEYORS AND
How to convert coordinate system in R
 How to convert coordinate system in R Dasapta Erwin Irawan 17 June 2014 Affiliation: Applied Geology Research Division, Faculty of Earth Sciences and Technology, Institut Teknologi Bandung Faculty of Agriculture
Basic Tasks in ArcGIS 10.3.x
 Basic Tasks in ArcGIS 10.3.x This guide provides instructions for performing a few basic tasks in ArcGIS 10.3.1, such as adding data to a map document, viewing and changing coordinate system information,
Digital Elevation Models
 Digital Elevation Models National Elevation Dataset 1 Data Sets US DEM series 7.5, 30, 1 o for conterminous US 7.5, 15 for Alaska US National Elevation Data (NED) GTOPO30 Global Land One-kilometer Base
GIS in agriculture scale farm level - used in agricultural applications - managing crop yields, monitoring crop rotation techniques, and estimate
 Types of Input GIS in agriculture scale farm level - used in agricultural applications - managing crop yields, monitoring crop rotation techniques, and estimate soil loss from individual farms or agricultural
plot(seq(0,10,1), seq(0,10,1), main = "the Title", xlim=c(1,20), ylim=c(1,20), col="darkblue");
, seq(0,10,1), main = the Title, xlim=c(1,20), ylim=c(1,20), col=darkblue);") R for Biologists Day 3 Graphing and Making Maps with Your Data Graphing is a pretty convenient use for R, especially in Rstudio. plot() is the most generalized graphing function. If you give it all numeric
R for Biologists Day 3 Graphing and Making Maps with Your Data Graphing is a pretty convenient use for R, especially in Rstudio. plot() is the most generalized graphing function. If you give it all numeric
Creating Digital Elevation Model Using a Mobile Device
 Name : Ali Ihsan Durmaz UnitID : aidurmaz Creating Digital Elevation Model Using a Mobile Device ABSTRACT DEM (Digital Elevation Models) is the best way to interpret topography on the ground. In recent
Assembling Datasets for Species Distribution Models. GIS Cyberinfrastructure Course Day 3
 Assembling Datasets for Species Distribution Models GIS Cyberinfrastructure Course Day 3 Objectives Assemble specimen-level data and associated covariate information for use in a species distribution model
Ray Tracing Acceleration. CS 4620 Lecture 22
 Ray Tracing Acceleration CS 4620 Lecture 22 2014 Steve Marschner 1 Topics Transformations in ray tracing Transforming objects Transformation hierarchies Ray tracing acceleration structures Bounding volumes
Analysis of species distribution data with R
 Analysis of species distribution data with R Robert J. Hijmans March 28, 2013 1 Introduction In this vignette I show some techniques that can be used to analyze species distribution data with R. Before
sp sf library(rgdal) library(sp) iris_paris_sp <- readogr("data/parisiris2017.shp", stringsasfactors = FALSE)
 library(sp) iris_paris_sp <- readogr(data/parisiris2017.shp, stringsasfactors = FALSE)") sp sf library(rgdal) library(sp) iris_paris_sp
sp sf library(rgdal) library(sp) iris_paris_sp
INTRODUCTION TO GIS WORKSHOP EXERCISE
 111 Mulford Hall, College of Natural Resources, UC Berkeley (510) 643-4539 INTRODUCTION TO GIS WORKSHOP EXERCISE This exercise is a survey of some GIS and spatial analysis tools for ecological and natural
Georeferencing & Spatial Adjustment
 Georeferencing & Spatial Adjustment Aligning Raster and Vector Data to the Real World Rotation Differential Scaling Distortion Skew Translation 1 The Problem How are geographically unregistered data, either
Making Yield Contour Maps Using John Deere Data
 Making Yield Contour Maps Using John Deere Data Exporting the Yield Data Using JDOffice 1. Data Format On Hard Drive 2. Start program JD Office. a. From the PC Card menu on the left of the screen choose
v Importing Rasters SMS 11.2 Tutorial Requirements Raster Module Map Module Mesh Module Time minutes Prerequisites Overview Tutorial
 v. 11.2 SMS 11.2 Tutorial Objectives This tutorial teaches how to import a Raster, view elevations at individual points, change display options for multiple views of the data, show the 2D profile plots,
Using rasters for interpolation and visualization in GMS
 v. 10.3 GMS 10.3 Tutorial Using rasters for interpolation and visualization in GMS Objectives This tutorial teaches how GMS uses rasters to support all kinds of digital elevation models and how rasters
v SMS Tutorials Working with Rasters Prerequisites Requirements Time Objectives
 v. 12.2 SMS 12.2 Tutorial Objectives Learn how to import a Raster, view elevations at individual points, change display options for multiple views of the data, show the 2D profile plots, and interpolate
v Working with Rasters SMS 12.1 Tutorial Requirements Raster Module Map Module Mesh Module Time minutes Prerequisites Overview Tutorial
 v. 12.1 SMS 12.1 Tutorial Objectives This tutorial teaches how to import a Raster, view elevations at individual points, change display options for multiple views of the data, show the 2D profile plots,
Introduction to idistance Data Structures.
 Introduction to idistance Data Structures. idistance Workshop CREEM, University of St Andrews March 18, 2016 Contents 1 Introduction 2 2 Load the Package 3 3 Data Assessment 3 3.1 Checking the data......................................
GEOGRAPHIC INFORMATION SYSTEMS Lecture 02: Feature Types and Data Models
 GEOGRAPHIC INFORMATION SYSTEMS Lecture 02: Feature Types and Data Models Feature Types and Data Models How Does a GIS Work? - a GIS operates on the premise that all of the features in the real world can
Raster Data. James Frew ESM 263 Winter
 Raster Data 1 Vector Data Review discrete objects geometry = points by themselves connected lines closed polygons attributes linked to feature ID explicit location every point has coordinates 2 Fields
CS602 MCQ,s for midterm paper with reference solved by Shahid
 #1 Rotating a point requires The coordinates for the point The rotation angles Both of above Page No 175 None of above #2 In Trimetric the direction of projection makes unequal angle with the three principal
The Traditional Graphics Pipeline
 Final Projects Proposals due Thursday 4/8 Proposed project summary At least 3 related papers (read & summarized) Description of series of test cases Timeline & initial task assignment The Traditional Graphics
Three-dimensional Analyses
 Chapter 6 Three-dimensional Analyses Contents Figures 6.1 Three-dimensional home range......................... 110 6.2 Three-dimensional exploration of digital elevation models (DEMs)... 115 6.1 Example