Raster Data. James Frew ESM 263 Winter
|
|
|
- Denis Maxwell
- 6 years ago
- Views:
Transcription
1 Raster Data 1
2 Vector Data Review discrete objects geometry = points by themselves connected lines closed polygons attributes linked to feature ID explicit location every point has coordinates 2
3 Fields in GIS continuous f(x, y) so how represent geometry? attributes? location? 3
4 Approximating Fields Point set regular irregular Grid Polygons TIN Contours 4
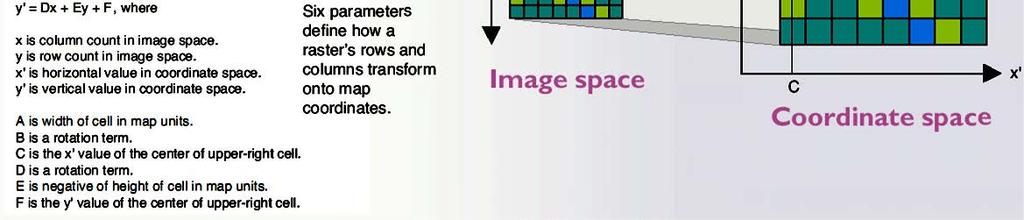
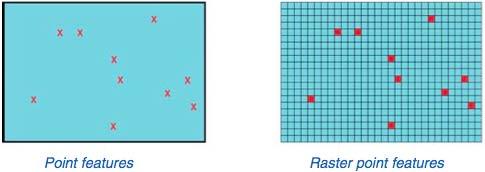
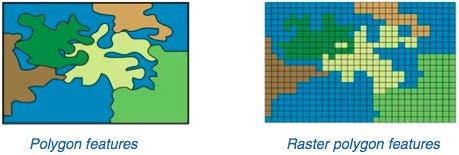
5 Sampled Fields: Rasters Divide (part of) the world into square cells Register the corners to the Earth Represent discrete objects as collections of one or more cells Represent fields by assigning attribute values to cells More commonly used to represent fields than discrete objects 5
6 Characteristics of Rasters Cell size defines level of spatial detail all variation within cells is lost for given area: cell size #cells data volume Cell value characteristic of spatial phenomenon at cell location ArcGIS: integer or floating-point assignment scheme average over cell total within cell commonest value in cell value at cell s central point 6
7 Characteristics of Rasters (cont d) Bands (channels) single multiple bands e.g. red,green,blue color image Implicit geometry location of any cell can be calculated from grid location cell size Spatial reference map implicit external coordinates e.g. in a map projection 7

8 Raster Datasets Name Structure cells aka pixels columns rows Value attribute key zone NoData ignored or propagated 8
 anything else")
9 Raster Attributes Cell value attribute table row count (always) anything else 9
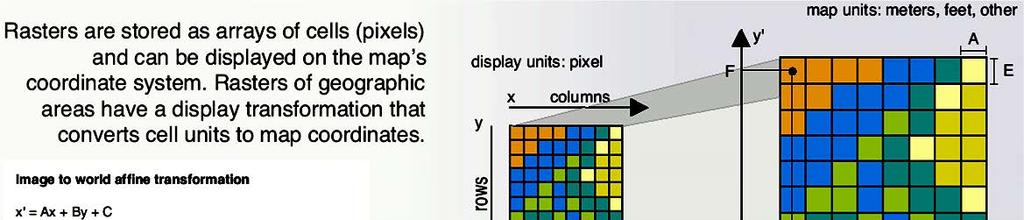
10 Raster Coordinates left left 10


11 Raster Examples USGS 1-meter DOQ digital orthophoto quadrangle USGS 1:24000 DRG digital raster graphic scanned from 7.5 topo 11

12 Vector Raster Conversion Rasterize = cells that intersect feature Vectorize = outline contiguous region 12


13 Note: Distance vs Buffering Buffer: discrete Distance: continuous 13
14 Feature Representation in Rasters: Sub-pixel Features Coarsened 14

15 Feature Representation in Rasters: Large Features Blurred Tree represented as varying values of treeness, instead of as a crisp feature 15
16 Raster Operations in order of increasing #input cells contributing to 1 output cell Local Focal aka neighborhood Zonal Global 16

17 Local Operations out(xi, yj) = f(in(xi, yj)) Neighbors don't influence Examples reclassify select min/max Think of as: Solve for all unique cell values; then reclassify 17


18 Local Operation Example: 1 Input Reclassify (change values using lookup table) IN OUT
19 Local Operation Example: d = mean(a, b, c) shaded = NoData NB: NoData in any input NoData in output Multiple Inputs 19
 implicit: dataset bounding box 20")
20 Extent restrict processing to rectangular subset explicit: (xmin, ymin, xmax, ymax) implicit: dataset bounding box 20

21 works with features, too 21

22 Mask Restrict processing to coincident defined cells i.e. anything except NoData 22


23 Extract extract by polygon extract by mask 23
24 Focal (Neighborhood) Operations out(xi, yj) = f(in(xk, ym) k,m near i,j) single cell and its neighbors Examples smooth sharpen noise suppresion Think of as weighted sum or sort and pick 24
")
25 Neighborhood Types Four common neighborhood types rectangle circle annulus wedge (x = focal cell) 25
 e.g. 2.11 = (2+2+2+2+1+3+2+2+3) / 9 26")
26 Focal Operation Example: Mean b = 3x3 mean (a) e.g = ( ) / 9 26

27 Zones Zone = all cells with same value 27

28 Regions Region = contiguous cells with same value 28

29 Zonal Operations out(xi, yj) = f(in(xk, ym) k,m zone(xk, ym) = zone(xi, yj)) like focal, but uses zone for neighborhood replace cell value with some property of its neighbors in zone it overlaps 29
30 Zonal Operations (cont'd) ArcGIS supports majority, median, minority maximum, range, minimum sum, mean, standard deviation variety (# distinct values) Examples forest zone species variety elevation zone mean snow depth 30
 e.g. 2.")
31 Zonal Operation Example: Zonal Mean c = zonal mean (a, zone b) e.g = mean(zone 1: {1, 1, 2, 2, 4, 3}) 31
32 Global Operations out(xi, yj) = f(in(xk, ym) k,m) each output cell depends on all input cells can be computationally intensive Examples distance variogram 32

33 Global Operation Example: Re: nearest source cell: value distance direction Euclidean Allocation 33
34 Figure Credits Introduction to Geographic Information Systems, 4 th ed. ISBN ArcMap Help Modeling Our World. ISBN Geographic Information Systems and Science, 2nd ed. ISBN ArcGIS 9: Using ArcGIS Spatial Analyst 34
Raster Data. James Frew ESM 263 Winter
 Raster Data 1 Vector Data Review discrete objects geometry = points by themselves connected lines closed polygons agributes linked to feature ID explicit localon every point has coordinates 2 Fields in
Cell based GIS. Introduction to rasters
 Week 9 Cell based GIS Introduction to rasters topics of the week Spatial Problems Modeling Raster basics Application functions Analysis environment, the mask Application functions Spatial Analyst in ArcGIS
Module 7 Raster operations
 Introduction Geo-Information Science Practical Manual Module 7 Raster operations 7. INTRODUCTION 7-1 LOCAL OPERATIONS 7-2 Mathematical functions and operators 7-5 Raster overlay 7-7 FOCAL OPERATIONS 7-8
Copyright The McGraw-Hill Companies, Inc. Permission required for reproduction or display.
 CHAPTER 12 RASTER DATA ANALYSIS 12.1 Data Analysis Environment Box 12.1 How to Make an Analysis Mask 12.2 Local Operations 12.2.1 Local Operations with a Single Raster 12.2.2 Reclassification 12.2.3 Local
RASTER ANALYSIS S H A W N L. P E N M A N E A R T H D A T A A N A LY S I S C E N T E R U N I V E R S I T Y O F N E W M E X I C O
 RASTER ANALYSIS S H A W N L. P E N M A N E A R T H D A T A A N A LY S I S C E N T E R U N I V E R S I T Y O F N E W M E X I C O TOPICS COVERED Spatial Analyst basics Raster / Vector conversion Raster data
ENGRG Introduction to GIS
 ENGRG 59910 Introduction to GIS Michael Piasecki April 3, 2014 Lecture 11: Raster Analysis GIS Related? 4/3/2014 ENGRG 59910 Intro to GIS 2 1 Why we use Raster GIS In our previous discussion of data models,
Geographic Information Systems (GIS) Spatial Analyst [10] Dr. Mohammad N. Almasri. [10] Spring 2018 GIS Dr. Mohammad N. Almasri Spatial Analyst
![Geographic Information Systems (GIS) Spatial Analyst [10] Dr. Mohammad N. Almasri. [10] Spring 2018 GIS Dr. Mohammad N. Almasri Spatial Analyst](/thumbs/80/81171101.jpg "Geographic Information Systems (GIS) Spatial Analyst [10] Dr. Mohammad N. Almasri. [10] Spring 2018 GIS Dr. Mohammad N. Almasri Spatial Analyst") Geographic Information Systems (GIS) Spatial Analyst [10] Dr. Mohammad N. Almasri 1 Preface POINTS, LINES, and POLYGONS are good at representing geographic objects with distinct shapes They are less good
Geographic Information Systems (GIS) Spatial Analyst [10] Dr. Mohammad N. Almasri 1 Preface POINTS, LINES, and POLYGONS are good at representing geographic objects with distinct shapes They are less good
RASTER ANALYSIS GIS Analysis Fall 2013
 RASTER ANALYSIS GIS Analysis Fall 2013 Raster Data The Basics Raster Data Format Matrix of cells (pixels) organized into rows and columns (grid); each cell contains a value representing information. What
Lecture 9. Raster Data Analysis. Tomislav Sapic GIS Technologist Faculty of Natural Resources Management Lakehead University
 Lecture 9 Raster Data Analysis Tomislav Sapic GIS Technologist Faculty of Natural Resources Management Lakehead University Raster Data Model The GIS raster data model represents datasets in which square
RASTER ANALYSIS GIS Analysis Winter 2016
 RASTER ANALYSIS GIS Analysis Winter 2016 Raster Data The Basics Raster Data Format Matrix of cells (pixels) organized into rows and columns (grid); each cell contains a value representing information.
Spatial Analysis with Raster Datasets
 Spatial Analysis with Raster Datasets Francisco Olivera, Ph.D., P.E. Srikanth Koka Lauren Walker Aishwarya Vijaykumar Keri Clary Department of Civil Engineering April 21, 2014 Contents Brief Overview of
Lecture 06. Raster and Vector Data Models. Part (1) Common Data Models. Raster. Vector. Points. Points. ( x,y ) Area. Area Line.
 Common Data Models. Raster. Vector. Points. Points. ( x,y ) Area. Area Line.") Lecture 06 Raster and Vector Data Models Part (1) 1 Common Data Models Vector Raster Y Points Points ( x,y ) Line Area Line Area 2 X 1 3 Raster uses a grid cell structure Vector is more like a drawn map
Lecture 06 Raster and Vector Data Models Part (1) 1 Common Data Models Vector Raster Y Points Points ( x,y ) Line Area Line Area 2 X 1 3 Raster uses a grid cell structure Vector is more like a drawn map
Watershed Sciences 4930 & 6920 GEOGRAPHIC INFORMATION SYSTEMS
 HOUSEKEEPING Watershed Sciences 4930 & 6920 GEOGRAPHIC INFORMATION SYSTEMS CONTOURS! Self-Paced Lab Due Friday! WEEK SIX Lecture RASTER ANALYSES Joe Wheaton YOUR EXCERCISE Integer Elevations Rounded up
Raster Analysis and Functions. David Tenenbaum EEOS 465 / 627 UMass Boston
 Raster Analysis and Functions Local Functions By-cell operations Operated on by individual operators or by coregistered grid cells from other themes Begin with each target cell, manipulate through available
Lab 12: Sampling and Interpolation
 Lab 12: Sampling and Interpolation What You ll Learn: -Systematic and random sampling -Majority filtering -Stratified sampling -A few basic interpolation methods Videos that show how to copy/paste data
Data Assembly, Part II. GIS Cyberinfrastructure Module Day 4
 Data Assembly, Part II GIS Cyberinfrastructure Module Day 4 Objectives Continuation of effective troubleshooting Create shapefiles for analysis with buffers, union, and dissolve functions Calculate polygon
GEOGRAPHIC INFORMATION SYSTEMS Lecture 25: 3D Analyst
 GEOGRAPHIC INFORMATION SYSTEMS Lecture 25: 3D Analyst 3D Analyst - 3D Analyst is an ArcGIS extension designed to work with TIN data (triangulated irregular network) - many of the tools in 3D Analyst also
Working with Map Algebra
 Working with Map Algebra While you can accomplish much with the Spatial Analyst user interface, you can do even more with Map Algebra, the analysis language of Spatial Analyst. Map Algebra expressions
Getting Started with Spatial Analyst. Steve Kopp Elizabeth Graham
 Getting Started with Spatial Analyst Steve Kopp Elizabeth Graham Spatial Analyst Overview Over 100 geoprocessing tools plus raster functions Raster and vector analysis Construct workflows with ModelBuilder,
Getting Started with Spatial Analyst. Steve Kopp Elizabeth Graham
 Getting Started with Spatial Analyst Steve Kopp Elizabeth Graham Workshop Overview Fundamentals of using Spatial Analyst What analysis capabilities exist and where to find them How to build a simple site
Masking Lidar Cliff-Edge Artifacts
 Masking Lidar Cliff-Edge Artifacts Methods 6/12/2014 Authors: Abigail Schaaf is a Remote Sensing Specialist at RedCastle Resources, Inc., working on site at the Remote Sensing Applications Center in Salt
Mapping Distance and Density
 Mapping Distance and Density Distance functions allow you to determine the nearest location of something or the least-cost path to a particular destination. Density functions, on the other hand, allow
Contents of Lecture. Surface (Terrain) Data Models. Terrain Surface Representation. Sampling in Surface Model DEM
 Data Models. Terrain Surface Representation. Sampling in Surface Model DEM") Lecture 13: Advanced Data Models: Terrain mapping and Analysis Contents of Lecture Surface Data Models DEM GRID Model TIN Model Visibility Analysis Geography 373 Spring, 2006 Changjoo Kim 11/29/2006 1
Lecture 13: Advanced Data Models: Terrain mapping and Analysis Contents of Lecture Surface Data Models DEM GRID Model TIN Model Visibility Analysis Geography 373 Spring, 2006 Changjoo Kim 11/29/2006 1
Representing Geography
 Data models and axioms Chapters 3 and 7 Representing Geography Road map Representing the real world Conceptual models: objects vs fields Implementation models: vector vs raster Vector topological model
17/07/2013 RASTER DATA STRUCTURE GIS LECTURE 4 GIS DATA MODELS AND STRUCTURES RASTER DATA MODEL& STRUCTURE TIN- TRIANGULAR IRREGULAR NETWORK
 RASTER DATA STRUCTURE GIS LECTURE 4 GIS DATA MODELS AND STRUCTURES Space is subdivided into regular grids of square grid cells or other forms of polygonal meshes known as picture elements (pixels) the
Lesson 5 overview. Concepts. Interpolators. Assessing accuracy Exercise 5
 Interpolation Tools Lesson 5 overview Concepts Sampling methods Creating continuous surfaces Interpolation Density surfaces in GIS Interpolators IDW, Spline,Trend, Kriging,Natural neighbors TopoToRaster
How does Map Algebra work?
 Map Algebra How does Map Algebra work? Map Algebra uses math-like expressions containing operators and functions with raster data. Map Algebra operators, which are relational, Boolean, logical, combinatorial,
Geol 588. GIS for Geoscientists II. Zonal functions. Feb 22, Zonal statistics. Interpolation. Zonal statistics Sp. Analyst Tools - Zonal.
 Zonal functions Geol 588 GIS for Geoscientists II Feb 22, 2011 Zonal statistics Interpolation Zonal statistics Sp. Analyst Tools - Zonal Choose correct attribute for zones (usually: must be unique ID for
Lecture 6: GIS Spatial Analysis. GE 118: INTRODUCTION TO GIS Engr. Meriam M. Santillan Caraga State University
 Lecture 6: GIS Spatial Analysis GE 118: INTRODUCTION TO GIS Engr. Meriam M. Santillan Caraga State University 1 Spatial Data It can be most simply defined as information that describes the distribution
GEOG 487 Lesson 7: Step- by- Step Activity
 GEOG 487 Lesson 7: Step- by- Step Activity Part I: Review the Relevant Data Layers and Organize the Map Document In Part I, we will review the data and organize the map document for analysis. 1. Unzip
Your Prioritized List. Priority 1 Faulted gridding and contouring. Priority 2 Geoprocessing. Priority 3 Raster format
 Your Prioritized List Priority 1 Faulted gridding and contouring Priority 2 Geoprocessing Priority 3 Raster format Priority 4 Raster Catalogs and SDE Priority 5 Expanded 3D Functionality Priority 1 Faulted
Watershed Sciences 4930 & 6920 GEOGRAPHIC INFORMATION SYSTEMS
 HOUSEKEEPING Watershed Sciences 4930 & 6920 GEOGRAPHIC INFORMATION SYSTEMS Quizzes Lab 8? WEEK EIGHT Lecture INTERPOLATION & SPATIAL ESTIMATION Joe Wheaton READING FOR TODAY WHAT CAN WE COLLECT AT POINTS?
Creating Surfaces. Steve Kopp Steve Lynch
 Steve Kopp Steve Lynch Overview Learn the types of surfaces and the data structures used to store them Emphasis on surface interpolation Learn the interpolation workflow Understand how interpolators work
NV CCS USER S GUIDE V1.1 ADDENDUM
 NV CCS USER S GUIDE V1.1 ADDENDUM PAGE 1 FOR CREDIT PROJECTS THAT PROPOSE TO MODIFY CONIFER COVER Released 5/19/2016 This addendum provides instructions for evaluating credit projects that propose to treat
Welcome to NR402 GIS Applications in Natural Resources. This course consists of 9 lessons, including Power point presentations, demonstrations,
 Welcome to NR402 GIS Applications in Natural Resources. This course consists of 9 lessons, including Power point presentations, demonstrations, readings, and hands on GIS lab exercises. Following the last
Raster Data Model & Analysis
 Topics: 1. Understanding Raster Data 2. Adding and displaying raster data in ArcMap 3. Converting between floating-point raster and integer raster 4. Converting Vector data to Raster 5. Querying Raster
Raster GIS applications Columns
 Raster GIS applications Columns Rows Image: cell value = amount of reflection from surface Thematic layer: cell value = category or measured value - In both cases, there is only one value per cell (in
Raster GIS applications
 Raster GIS applications Columns Rows Image: cell value = amount of reflection from surface DEM: cell value = elevation (also slope/aspect/hillshade/curvature) Thematic layer: cell value = category or measured
Steps for Modeling a Proposed New Reservoir in GIS
 Steps for Modeling a Proposed New Reservoir in GIS Requirements: ArcGIS ArcMap, ArcScene, Spatial Analyst, and 3D Analyst There s a new reservoir proposed for Right Hand Fork in Logan Canyon. I wanted
SPATIAL DATA MODELS Introduction to GIS Winter 2015
 SPATIAL DATA MODELS Introduction to GIS Winter 2015 GIS Data Organization The basics Data can be organized in a variety of ways Spatial location, content (attributes), frequency of use Come up with a system
Module 10 Data-action models
 Introduction Geo-Information Science Practical Manual Module 10 Data-action models 10. INTRODUCTION 10-1 DESIGNING A DATA-ACTION MODEL 10-2 REPETITION EXERCISES 10-6 10. Introduction Until now you have
Exercise 5. Height above Nearest Drainage Flood Inundation Analysis
 Exercise 5. Height above Nearest Drainage Flood Inundation Analysis GIS in Water Resources, Fall 2018 Prepared by David G Tarboton Purpose The purpose of this exercise is to learn how to calculation the
The Raster Data Model
 The Raster Data Model 2 2 2 2 8 8 2 2 8 8 2 2 2 2 2 2 8 8 2 2 2 2 2 2 2 2 2 Llano River, Mason Co., TX 1 Rasters are: Regular square tessellations Matrices of values distributed among equal-sized, square
Purpose: To explore the raster grid and vector map element concepts in GIS.
 GIS INTRODUCTION TO RASTER GRIDS AND VECTOR MAP ELEMENTS c:wou:nssi:vecrasex.wpd Purpose: To explore the raster grid and vector map element concepts in GIS. PART A. RASTER GRID NETWORKS Task A- Examine
PART 1. Answers module 6: 'Transformations'
 Answers module 6: 'Transformations' PART 1 1 a A nominal measure scale refers to data that are in named categories. There is no order among these categories. That is, no category is better or more than
The Traditional Graphics Pipeline
 Last Time? The Traditional Graphics Pipeline Participating Media Measuring BRDFs 3D Digitizing & Scattering BSSRDFs Monte Carlo Simulation Dipole Approximation Today Ray Casting / Tracing Advantages? Ray
Geometric Rectification of Remote Sensing Images
 Geometric Rectification of Remote Sensing Images Airborne TerrestriaL Applications Sensor (ATLAS) Nine flight paths were recorded over the city of Providence. 1 True color ATLAS image (bands 4, 2, 1 in
Raster Data Models 9/18/2018
 Raster Data Models The Raster Data Model Rasters are: Regular square tessellations Matrices of values distributed among equal-sized, square cells 5 5 5 5 5 5 5 5 2 2 5 5 5 5 5 5 2 2 2 2 5 5 5 5 5 2 2 2
Rasters are: The Raster Data Model. Cell location specified by: Why squares? Raster Data Models 9/25/2014. GEO327G/386G, UT Austin 1
 5 5 5 5 5 5 5 5 5 5 5 5 2 2 5 5 2 2 2 2 2 2 8 8 2 2 5 5 5 5 5 5 2 2 2 2 5 5 5 5 5 2 2 2 5 5 5 5 The Raster Data Model Rasters are: Regular square tessellations Matrices of values distributed among equalsized,
The Raster Data Model
 The Raster Data Model 2 2 2 2 8 8 2 2 8 8 2 2 2 2 2 2 8 8 2 2 2 2 2 2 2 2 2 Llano River, Mason Co., TX 9/24/201 GEO327G/386G, UT Austin 1 Rasters are: Regular square tessellations Matrices of values distributed
Glacier Mapping and Monitoring
 Glacier Mapping and Monitoring Exercises Tobias Bolch Universität Zürich TU Dresden tobias.bolch@geo.uzh.ch Exercise 1: Visualizing multi-spectral images with Erdas Imagine 2011 a) View raster data: Open
GEOGRAPHIC INFORMATION SYSTEMS Lecture 02: Feature Types and Data Models
 GEOGRAPHIC INFORMATION SYSTEMS Lecture 02: Feature Types and Data Models Feature Types and Data Models How Does a GIS Work? - a GIS operates on the premise that all of the features in the real world can
Lab 12: Sampling and Interpolation
 Lab 12: Sampling and Interpolation What You ll Learn: -Systematic and random sampling -Majority filtering -Stratified sampling -A few basic interpolation methods Data for the exercise are in the L12 subdirectory.
Lecture 22 - Chapter 8 (Raster Analysis, part 3)
") GEOL 452/552 - GIS for Geoscientists I Lecture 22 - Chapter 8 (Raster Analysis, part 3) Today: Zonal Analysis (statistics) for polygons, lines, points, interpolation (IDW), Effects Toolbar, analysis masks
GEOL 452/552 - GIS for Geoscientists I Lecture 22 - Chapter 8 (Raster Analysis, part 3) Today: Zonal Analysis (statistics) for polygons, lines, points, interpolation (IDW), Effects Toolbar, analysis masks
LECTURE 2 SPATIAL DATA MODELS
 LECTURE 2 SPATIAL DATA MODELS Computers and GIS cannot directly be applied to the real world: a data gathering step comes first. Digital computers operate in numbers and characters held internally as binary
Ex. 4: Locational Editing of The BARC
 Ex. 4: Locational Editing of The BARC Using the BARC for BAER Support Document Updated: April 2010 These exercises are written for ArcGIS 9.x. Some steps may vary slightly if you are working in ArcGIS
Raster model. Raster model. Resolution. Value and data types. Structure and storage. Cell. Values. Data
 Raster model. Resolution. Values and data types 3. Storage. Fitting rasters 5. Map algebra 6. Interpolation 7. Conversion vectorraster 8. Vector vs. raster Raster model Divides the space into a regular
Maps as Numbers: Data Models
 Maps as Numbers: Data Models vertices E Reality S E S arcs S E Conceptual Models nodes E Logical Models S Start node E End node S Physical Models 1 The Task An accurate, registered, digital map that can
The Reference Library Generating Low Confidence Polygons
 GeoCue Support Team In the new ASPRS Positional Accuracy Standards for Digital Geospatial Data, low confidence areas within LIDAR data are defined to be where the bare earth model might not meet the overall
Field-Scale Watershed Analysis
 Conservation Applications of LiDAR Field-Scale Watershed Analysis A Supplemental Exercise for the Hydrologic Applications Module Andy Jenks, University of Minnesota Department of Forest Resources 2013
1 Introduction to Graphics
 1 1.1 Raster Displays The screen is represented by a 2D array of locations called pixels. Zooming in on an image made up of pixels The convention in these notes will follow that of OpenGL, placing the
Raster model. Alexandre Gonçalves, DECivil, IST
 Raster model 1. Resolution 2. Values and data types 3. Storage 4. Fitting rasters 5. Map algebra 6. Interpolation 7. Conversion vector raster 8. Vector vs. raster 1 Raster model Divides the space into
Lab 2. Vector and raster data.
 Lab 2. Vector and raster data. The goal: To learn about the structure of the vector and raster data types. Objective: Create vector and raster datasets and visualize them. Software for the lab: ARCINFO,
Terms and definitions * keep definitions of processes and terms that may be useful for tests, assignments
 Lecture 1 Core of GIS Thematic layers Terms and definitions * keep definitions of processes and terms that may be useful for tests, assignments Lecture 2 What is GIS? Info: value added data Data to solve
The Traditional Graphics Pipeline
 Last Time? The Traditional Graphics Pipeline Reading for Today A Practical Model for Subsurface Light Transport, Jensen, Marschner, Levoy, & Hanrahan, SIGGRAPH 2001 Participating Media Measuring BRDFs
The Traditional Graphics Pipeline
 Final Projects Proposals due Thursday 4/8 Proposed project summary At least 3 related papers (read & summarized) Description of series of test cases Timeline & initial task assignment The Traditional Graphics
GIS IN ECOLOGY: MORE RASTER ANALYSES
 GIS IN ECOLOGY: MORE RASTER ANALYSES Contents Introduction... 2 More Raster Application Functions... 2 Data Sources... 3 Tasks... 4 Raster Recap... 4 Viewshed Determining Visibility... 5 Hydrology Modeling
Lecture 20 - Chapter 8 (Raster Analysis, part1)
") GEOL 452/552 - GIS for Geoscientists I Lecture 20 - Chapter 8 (Raster Analysis, part) 4 lectures on rasters - but won t cover everything (Raster GIS course: Geol 588: GIS II (Spring 20) Today: Raster data,
GEOL 452/552 - GIS for Geoscientists I Lecture 20 - Chapter 8 (Raster Analysis, part) 4 lectures on rasters - but won t cover everything (Raster GIS course: Geol 588: GIS II (Spring 20) Today: Raster data,
VECTOR ANALYSIS: QUERIES, MEASUREMENTS & TRANSFORMATIONS
 VECTOR ANALYSIS: QUERIES, MEASUREMENTS & TRANSFORMATIONS GIS Analysis Winter 2016 Spatial Analysis Operations performed on spatial data that add value Can reveal things that might otherwise be invisible
Using LiDAR (Light Distancing And Ranging) data to more accurately describe avalanche terrain
 data to more accurately describe avalanche terrain") International Snow Science Workshop, Davos 009, Proceedings Using LiDAR (Light Distancing And Ranging) data to more accurately describe avalanche terrain Christopher M. McCollister, and Robert H. Comey,
International Snow Science Workshop, Davos 009, Proceedings Using LiDAR (Light Distancing And Ranging) data to more accurately describe avalanche terrain Christopher M. McCollister, and Robert H. Comey,
Lecture 21 - Chapter 8 (Raster Analysis, part2)
") GEOL 452/552 - GIS for Geoscientists I Lecture 21 - Chapter 8 (Raster Analysis, part2) Today: Digital Elevation Models (DEMs), Topographic functions (surface analysis): slope, aspect hillshade, viewshed,
GEOL 452/552 - GIS for Geoscientists I Lecture 21 - Chapter 8 (Raster Analysis, part2) Today: Digital Elevation Models (DEMs), Topographic functions (surface analysis): slope, aspect hillshade, viewshed,
DATA MODELS IN GIS. Prachi Misra Sahoo I.A.S.R.I., New Delhi
 DATA MODELS IN GIS Prachi Misra Sahoo I.A.S.R.I., New Delhi -110012 1. Introduction GIS depicts the real world through models involving geometry, attributes, relations, and data quality. Here the realization
Using GIS to Site Minimal Excavation Helicopter Landings
 Using GIS to Site Minimal Excavation Helicopter Landings The objective of this analysis is to develop a suitability map for aid in locating helicopter landings in mountainous terrain. The tutorial uses
Esri International User Conference. San Diego, California. Technical Workshops. July Creating Surfaces. Steve Kopp and Steve Lynch
 Esri International User Conference San Diego, California Technical Workshops July 2011 Creating Surfaces Steve Kopp and Steve Lynch Overview Learn the types of surfaces and the data structures used to
Making ArcGIS Work for You. Elizabeth Cook USDA-NRCS GIS Specialist Columbia, MO
 Making ArcGIS Work for You Elizabeth Cook USDA-NRCS GIS Specialist Columbia, MO 1 Topics Using ArcMap beyond the Toolkit buttons GIS data formats Attributes and what you can do with them Calculating Acres
Lesson 4A overview. Introduction to Map Algebra (4A) Map Algebra functions (4B)
 Map Algebra functions (4B)") Map Algebra Lesson 4A overview Introduction to Map Algebra (4A) Language components Syntax and rules Objects Operators Commands Exercise 5A Map Algebra functions (4B) Function syntax Local functions Focal
Map Algebra Lesson 4A overview Introduction to Map Algebra (4A) Language components Syntax and rules Objects Operators Commands Exercise 5A Map Algebra functions (4B) Function syntax Local functions Focal
Unpacking Instructions
 DNR Data Deli II Unpacking and User Instructions May 2004 Now that you ve successfully downloaded a bundle of GIS data from the Minnesota Dept. of Natural Resources, GIS Data Deli II there are a couple
Making Yield Contour Maps Using John Deere Data
 Making Yield Contour Maps Using John Deere Data Exporting the Yield Data Using JDOffice 1. Data Format On Hard Drive 2. Start program JD Office. a. From the PC Card menu on the left of the screen choose
Combine Yield Data From Combine to Contour Map Ag Leader
 Combine Yield Data From Combine to Contour Map Ag Leader Exporting the Yield Data Using SMS Program 1. Data format On Hard Drive. 2. Start program SMS Basic. a. In the File menu choose Open. b. Click on
Geographic Surfaces. David Tenenbaum EEOS 383 UMass Boston
 Geographic Surfaces Up to this point, we have talked about spatial data models that operate in two dimensions How about the rd dimension? Surface the continuous variation in space of a third dimension
Spatial Analysis (Vector) II
 II") Spatial Analysis (Vector) II GEOG 300, Lecture 9 Dr. Anthony Jjumba 1 A Spatial Network is a set of geographic locations interconnected in a system by a number of routes is a system of linear features
Spatial Analysis (Vector) II GEOG 300, Lecture 9 Dr. Anthony Jjumba 1 A Spatial Network is a set of geographic locations interconnected in a system by a number of routes is a system of linear features
Review of Cartographic Data Types and Data Models
 Review of Cartographic Data Types and Data Models GIS Data Models Raster Versus Vector in GIS Analysis Fundamental element used to represent spatial features: Raster: pixel or grid cell. Vector: x,y coordinate
Computer Graphics Geometry and Transform
 ! Computer Graphics 2014! 5. Geometry and Transform Hongxin Zhang State Key Lab of CAD&CG, Zhejiang University 2014-10-11! Today outline Triangle rasterization Basic vector algebra ~ geometry! Antialiasing
Introducing ArcScan for ArcGIS
 Introducing ArcScan for ArcGIS An ESRI White Paper August 2003 ESRI 380 New York St., Redlands, CA 92373-8100, USA TEL 909-793-2853 FAX 909-793-5953 E-MAIL info@esri.com WEB www.esri.com Copyright 2003
CHAPTER 5 3D STL PART FROM SURFER GRID DEM DATA
 CHAPTER 5 3D STL PART FROM SURFER GRID DEM DATA The Surfer Grid is another widely used DEM file format and found to be suitable for the direct conversion to faceted formats. The chapter begins with an
Blacksburg, VA July 24 th 30 th, 2010 Georeferencing images and scanned maps Page 1. Georeference
 George McLeod Prepared by: With support from: NSF DUE-0903270 in partnership with: Geospatial Technician Education Through Virginia s Community Colleges (GTEVCC) Georeference The process of defining how
Soil texture: based on percentage of sand in the soil, partially determines the rate of percolation of water into the groundwater.
 Overview: In this week's lab you will identify areas within Webster Township that are most vulnerable to surface and groundwater contamination by conducting a risk analysis with raster data. You will create
Lab 18c: Spatial Analysis III: Clip a raster file using a Polygon Shapefile
 Environmental GIS Prepared by Dr. Zhi Wang, CSUF EES Department Lab 18c: Spatial Analysis III: Clip a raster file using a Polygon Shapefile These instructions enable you to clip a raster layer in ArcMap
Surface Creation & Analysis with 3D Analyst
 Esri International User Conference July 23 27 San Diego Convention Center Surface Creation & Analysis with 3D Analyst Khalid Duri Surface Basics Defining the surface Representation of any continuous measurement
GEOGRAPHIC INFORMATION SYSTEMS Lecture 24: Spatial Analyst Continued
 GEOGRAPHIC INFORMATION SYSTEMS Lecture 24: Spatial Analyst Continued Spatial Analyst - Spatial Analyst is an ArcGIS extension designed to work with raster data - in lecture I went through a series of demonstrations
Class #2. Data Models: maps as models of reality, geographical and attribute measurement & vector and raster (and other) data structures
 data structures") Class #2 Data Models: maps as models of reality, geographical and attribute measurement & vector and raster (and other) data structures Role of a Data Model Levels of Data Model Abstraction GIS as Digital
Class #2 Data Models: maps as models of reality, geographical and attribute measurement & vector and raster (and other) data structures Role of a Data Model Levels of Data Model Abstraction GIS as Digital
Watershed Sciences 4930 & 6920 ADVANCED GIS
 Slides by Wheaton et al. (2009-2014) are licensed under a Creative Commons Attribution-NonCommercial-ShareAlike 3.0 Unported License Watershed Sciences 4930 & 6920 ADVANCED GIS VECTOR ANALYSES Joe Wheaton
ii. From the Tools menu choose Multi-Extract
 Created By: Grant J. Firl Advisors: Paul Evangelista, Jim Graham Date: November 2010 Software: ArcGIS v9.2, TUGZip v3.5 Lesson 8: Mosaicking and Clipping Landsat Data The purpose of this tutorial is to
Digital Image Processing COSC 6380/4393
 Digital Image Processing COSC 6380/4393 Lecture 4 Jan. 24 th, 2019 Slides from Dr. Shishir K Shah and Frank (Qingzhong) Liu Digital Image Processing COSC 6380/4393 TA - Office: PGH 231 (Update) Shikha
Objectives Learn how GMS uses rasters to support all kinds of digital elevation models and how rasters can be used for interpolation in GMS.
 v. 9.1 GMS 9.1 Tutorial Using rasters for interpolation and visualization in GMS Objectives Learn how GMS uses rasters to support all kinds of digital elevation models and how rasters can be used for interpolation
Tutorial 1: Downloading elevation data
 Tutorial 1: Downloading elevation data Objectives In this exercise you will learn how to acquire elevation data from the website OpenTopography.org, project the dataset into a UTM coordinate system, and
The GIS Spatial Data Model
 The GIS Spatial Data Model Introduction: Spatial data are what drive a GIS. Every piece of functionality that makes a GIS separate from another analytical environment is rooted in the spatially explicit
Stream network delineation and scaling issues with high resolution data
 Stream network delineation and scaling issues with high resolution data Roman DiBiase, Arizona State University, May 1, 2008 Abstract: In this tutorial, we will go through the process of extracting a stream
Using GIS To Estimate Changes in Runoff and Urban Surface Cover In Part of the Waller Creek Watershed Austin, Texas
 Using GIS To Estimate Changes in Runoff and Urban Surface Cover In Part of the Waller Creek Watershed Austin, Texas Jordan Thomas 12-6-2009 Introduction The goal of this project is to understand runoff
INTRODUCTION TO GIS WORKSHOP EXERCISE
 111 Mulford Hall, College of Natural Resources, UC Berkeley (510) 643-4539 INTRODUCTION TO GIS WORKSHOP EXERCISE This exercise is a survey of some GIS and spatial analysis tools for ecological and natural