LiDAR Remote Sensing Data Collection: Salmon River Study Area, Oregon
|
|
|
- Leo Lambert
- 5 years ago
- Views:
Transcription


1 LiDAR Remote Sensing Data Collection: Salmon River Study Area, Oregon Submitted to: Barbara Ellis-Sugai USDA Forest Service Siuslaw National Forest 4077 SW Research Way Corvallis, Oregon Submitted by: Watershed Sciences, Inc. 215 SE Ninth Avenue, #106 Portland, Oregon January 10, 2008
2
3 LIDAR REMOTE SENSING DATA COLLECTION: SALMON RIVER STUDY AREA, OREGON TABLE OF CONTENTS 1. Overview Acquisition Airborne Survey Instrumentation and Methods Ground Survey Instrumentation and Methods LiDAR Data Processing Applications and Work Flow Overview Aircraft Kinematic GPS and IMU Data Laser Point Processing LiDAR Accuracy and Resolution Overview Laser Point Accuracy Relative Accuracy Absolute Accuracy Data Density/Resolution Data Specifications Projection/Datum and Units Deliverables Selected Images Glossary Citations... 23
4
 collected Light Detection and")


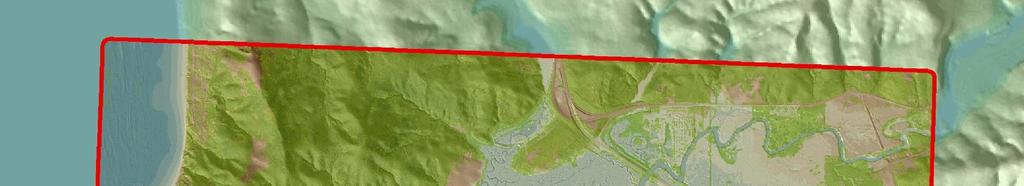
5 1. Overview Watershed Sciences, Inc. (WS) collected Light Detection and Ranging (LiDAR) data for the USDA Forest Service on August 25, The Area of Interest (AOI) includes ~5,799 acres (~9.1 mi 2 ) covering portions of the lower Salmon River watershed in northwestern Oregon, just north of Lincoln City. Figure 1 shows the extent of the area surveyed. Figure 1. Area of Interest (5,799 acres) 5
6 2. Acquisition 2.1 Airborne Survey Instrumentation and Methods The full survey was conducted on August 25, The LiDAR survey utilized a Leica ALS50 Phase II laser mounted in a Cessna Caravan 208B which was set to acquire =105,000 laser pulses per second (i.e. 105 khz pulse rate). The scan angle was ±14 o from nadir 1. These settings are designed to yield an average native density (number of pulses emitted by the laser system) of 8 points per square meter over terrestrial surfaces. Some types of surfaces (e.g. dense vegetation or water) may return fewer pulses than the laser originally emitted. Therefore, the delivered density can be less than the native density and vary according to distributions of terrain, land cover and water bodies. The Leica ALS50 Phase II system allows up to four range measurements per pulse, and all discernable laser returns were processed for the output dataset. To solve for laser point position, it is vital to have an accurate description of aircraft position and attitude. Aircraft position is described as x, y and z and measured twice per second (2 Hz) by an onboard differential GPS unit. Aircraft attitude is measured 200 times per second (200 Hz) as pitch, roll and yaw (heading) from an onboard inertial measurement unit (IMU). 2.2 Ground Survey Instrumentation and Methods During the LiDAR survey of the study area, a static (1 Hz recording frequency) ground survey was conducted over monuments with known coordinates (Table 1, Figure 2). After the airborne survey, the static GPS data are processed using triangulation with CORS stations and checked against the Online Positioning User Service (OPUS 2 ) to quantify daily variance. Multiple sessions are processed over the same monument to confirm antenna height measurements and reported position accuracy. Table 1. Base Station Surveyed Coordinates. Base Station ID Latitude (North) Datum NAD83 (HARN) Longitude (West) GRS80 Ellipsoid Height (m) #1 45 o o #2 45 o o Multiple DGPS units are used for the ground real-time kinematic (RTK) portion of the survey. To collect accurate ground surveyed points, a GPS base unit is set up over monuments to broadcast a kinematic correction to a roving GPS unit. The ground crew uses a roving unit to receive radio-relayed kinematic corrected positions from the base unit. This method is referred to as real-time kinematic (RTK) surveying and allows precise location measurement ( = 1.5 cm ~ 0.6 in). 501 RTK ground points were collected throughout the study area and compared to LiDAR data for accuracy assessment (Figure 2). 1 Nadir refers to the perpendicular vector to the ground directly below the aircraft. Nadir is commonly used to measure the angle from the vector and is referred to a degrees from nadir. 2 Online Positioning User Service (OPUS) is run by the National Geodetic Survey to process corrected monument positions. 6


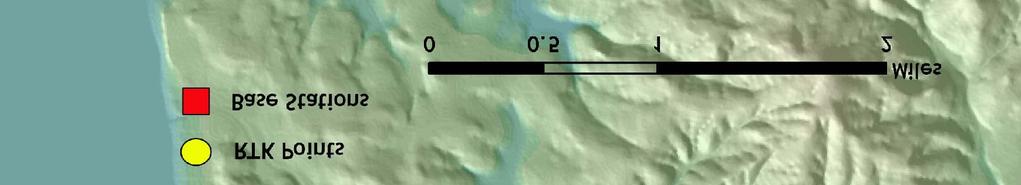
7 Figure 2. RTK and base station locations for study area. 7
8 3. LiDAR Data Processing 3.1 Applications and Work Flow Overview 1. Resolve kinematic corrections for aircraft position data using kinematic aircraft GPS and static ground GPS data. Software: Waypoint GPS v Develop a smoothed best estimate of trajectory (SBET) file that blends postprocessed aircraft position with attitude data. Sensor heading, position, and attitude are calculated throughout the survey. Software: IPAS v Calculate laser point position by associating SBET position to each laser point return time, scan angle, intensity, etc. Creates raw laser point cloud data for the entire survey in *.las (ASPRS v1.1) format. Software: ALS Post Processing Software 4. Import raw laser points into subset bins (less than 500 MB, to accommodate file size constraints in processing software). Perform manual relative accuracy calibration and filter for pits/birds. Ground points are then classified for individual flight lines (to be used for relative accuracy testing and calibration). Software: TerraScan v Test relative accuracy using ground classified points per each flight line. Perform automated line-to-line calibrations for system attitude parameters (pitch, roll, heading), mirror flex (scale) and GPS/IMU drift. Calibrations are performed on ground classified points from paired flight lines. Every flight line is used for relative accuracy calibration. Software: TerraMatch v Import position and attitude data. Classify ground and non-ground points. Assess statistical absolute accuracy via direct comparisons of ground classified points to ground RTK survey data. Convert data to orthometric elevations (NAVD88) by applying a Geoid03 correction. Create ground model as a triangulated surface and export as ArcInfo ASCII grids at the specified pixel resolution. Software: TerraScan v.6.009, ArcMap v Aircraft Kinematic GPS and IMU Data LiDAR survey datasets are referenced to 1 Hz static ground GPS data collected over pre-surveyed monuments with known coordinates. While surveying, the aircraft collects 2 Hz kinematic GPS data. The onboard inertial measurement unit (IMU) collects 200 Hz aircraft attitude data. Waypoint GPS v.7.60 is used to process the kinematic corrections for the aircraft. The static and kinematic GPS data are then post-processed after the survey to obtain an accurate GPS solution and aircraft positions. IPAS v.1.0 is used to develop a trajectory file that includes corrected aircraft position and attitude information. The trajectory data for the entire flight survey session are incorporated into a final smoothed best estimated trajectory (SBET) file that contains accurate and continuous aircraft positions and attitudes. 8
9 3.3 Laser Point Processing Laser point coordinates are computed using the IPAS and ALS Post Processor software suites based on independent data from the LiDAR system (pulse time, scan angle), and aircraft trajectory data (SBET). Laser point returns (first through fourth) are assigned an associated (x, y, z) coordinate along with unique intensity values (0-255). The data are output into large LAS v. 1.1 files; each point maintains the corresponding scan angle, return number (echo), intensity, and x, y, z (easting, northing, and elevation) information. These initial laser point files are too large for subsequent processing. To facilitate laser point processing, bins (polygons) are created to divide the dataset into manageable sizes (< 500 MB). Flightlines and LiDAR data are then reviewed to ensure complete coverage of the study area and positional accuracy of the laser points. Laser point data are imported into processing bins in TerraScan, and manual calibration is performed to assess the system offsets for pitch, roll, heading and scale (mirror flex). Using a geometric relationship developed by Watershed Sciences, each of these offsets is resolved and corrected if necessary. LiDAR points are then filtered for noise, pits (artificial low points) and birds (true birds as well as erroneously high points) by screening for absolute elevation limits, isolated points and height above ground. Each bin is then manually inspected for remaining pits and birds and spurious points are removed. In a bin containing approximately million points, an average of points are typically found to be artificially low or high. Common sources of non-terrestrial returns are clouds, birds, vapor, and haze. Internal calibration is refined using TerraMatch. Points from overlapping lines are tested for internal consistency and final adjustments are made for system misalignments (i.e., pitch, roll, heading offsets and scale). Automated sensor attitude and scale corrections yield 3-5 cm improvements in the relative accuracy. Once system misalignments are corrected, vertical GPS drift is then resolved and removed per flight line, yielding a slight improvement (<1 cm) in relative accuracy. The TerraScan software suite is designed specifically for classifying near-ground points (Soininen, 2004). The processing sequence begins by removing all points that are not near the earth based on geometric constraints used to evaluate multi-return points. The resulting bare earth (ground) model is visually inspected and additional ground point modeling is performed in site-specific areas to improve ground detail. (This manual editing of grounds occurs in areas with known ground modeling deficiencies, such as: bedrock outcrops, cliffs, deeply incised stream banks, and dense vegetation.) In some cases, automated ground point classification includes known vegetation (i.e., understory, low/dense shrubs, etc.). These points are manually reclassified as nongrounds. Ground surface rasters are developed from triangulated irregular networks (TINs) of ground points. 9
10 4. LiDAR Accuracy and Resolution 4.1 Overview Quality assurance for LiDAR datasets includes a real-time kinematic (RTK) survey located in the study area. The accuracy of the LiDAR data is described as standard deviations of divergence (sigma ~ ) from RTK ground survey points and root mean square error (RMSE), which considers bias (upward or downward). These statistics are calculated cumulatively. Statements of statistical accuracy apply to fixed terrestrial surfaces only. 4.2 Laser Point Accuracy Laser point absolute accuracy is largely a function of laser noise and internal consistency (measured as relative accuracy): Laser Noise: For any given target, laser noise is the breadth of the data cloud per laser return (i.e., last, first, etc.). Lower intensity surfaces (roads, rooftops, still/calm water) experience higher laser noise. The laser noise range for this study is approximately 0.02 meters. Relative Accuracy: Internal consistency refers to the ability to place a laser point in the same location over multiple flight lines, GPS conditions, and aircraft attitudes. Table 2. LiDAR accuracy error sources and solutions. Type of Error Source Post Processing Solution Long Base Lines None GPS Poor Satellite Constellation None (Static/Kinematic) Poor Antenna Visibility Reduce Visibility Mask Relative Accuracy Laser Noise Poor System Calibration Inaccurate System Poor Laser Timing Poor Laser Reception Poor Laser Power Irregular Laser Shape Recalibrate IMU and sensor offsets/settings None None None None None 4.3 Relative Accuracy Relative accuracy refers to the internal consistency of the data set and is measured as the divergence between points from different flight lines within an overlapping area. Divergence is most apparent when flight lines are opposing. When the LiDAR system is well calibrated, the line to line divergence is low (<10 cm). Internal consistency is affected by system attitude offsets, scale, and GPS/IMU drift. 10
11 Operational measures taken to improve relative accuracy: 1. Low Flight Altitude: Terrain following is employed to maintain a constant above ground level (AGL). Laser horizontal errors are a function of flight altitude above ground (i.e., ~ 1/4500 th AGL flight altitude). 2. Focus Laser Power at narrow beam footprint: A laser return must be received by the system above a power threshold to accurately record a measurement. The strength of the laser return is a function of laser emission power, laser footprint, flight altitude and the reflectivity of the target. While surface reflectivity cannot be controlled, laser power can be increased and low flight altitudes can be maintained. 3. Reduced Scan Angle: Edge-of-scan data can become inaccurate. The scan angle was reduced to a maximum of ±14 o from nadir, creating a narrow swath width and greatly reducing laser shadows from trees and buildings. 4. Quality GPS: Flights took place during optimal GPS conditions (e.g., 6 or more satellites and PDOP [Position Dilution of Precision] less than 3.0). Before each flight, the PDOP was determined for the survey day. During all flight times, a dual frequency DGPS base station recording at 1 second epochs was utilized and a maximum baseline length between the aircraft and the control points was less than 19 km (11.5 miles) at all times. 5. Ground Survey: Ground survey point accuracy (i.e. <1.5 cm RMSE) occurs during optimal PDOP ranges and targets a minimal baseline distance of 4 miles between GPS rover and base. Robust statistics are, in part, a function of sample size (n) and distribution. Ground survey RTK points are distributed to the extent possible throughout multiple flight lines and across the study area % Side-Lap (100% Overlap): Overlapping areas are optimized for relative accuracy testing. Laser shadowing is minimized to help increase target acquisition from multiple scan angles. Ideally, with a 50% side-lap, the most nadir portion of one flight line coincides with the edge (least nadir) portion of overlapping flight lines. A minimum of 50% side-lap with terrain-followed acquisition prevents data gaps. 7. Opposing Flight Lines: All overlapping flight lines are opposing. Pitch, roll and heading errors are amplified by a factor of two relative to the adjacent flight line(s), making misalignments easier to detect and resolve. Relative Accuracy Calibration Methodology 1. Manual System Calibration: Calibration procedures for each mission require solving geometric relationships that relate measured swath-to-swath deviations to misalignments of system attitude parameters. Corrected scale, pitch, roll and heading offsets are calculated and applied to resolve misalignments. The raw divergence between lines is computed after the manual calibration is completed and reported for each study area. 2. Automated Attitude Calibration: All data are tested and calibrated using TerraMatch automated sampling routines. Ground points are classified for each individual flight line and used for line-to-line testing. System misalignment offsets (pitch, roll and heading) and scale are solved for each individual mission and applied to respective mission datasets. The data from each mission are then blended when imported together to form the entire area of interest. 3. Automated Z Calibration: Ground points per line are utilized to calculate the vertical divergence between lines caused by vertical GPS drift. Automated Z calibration is the final step employed for relative accuracy calibration. 11
12 Relative Accuracy Calibration Results Relative accuracies have been determined for the study area: o Project Average = 0.09 m o Median Relative Accuracy = 0.09 m o 1 Relative Accuracy = 0.10 m o 2 Relative Accuracy = 0.11 m Figure 3. Distribution of relative accuracies per flight line, non slope-adjusted. 30% 25% 20% Distribution 15% 10% 5% 0% Relative Accuracy (m) Total Compared Points (n = 123,084,345) Figure 4. Statistical relative accuracies, non slope-adjusted Relative Accuracy (m) Average Median 1 Sigma 2 Sigma Total Compared Points (n = 123,084,345) 12
13 4.4 Absolute Accuracy The final quality control measure is a statistical accuracy assessment that compares known RTK ground survey points to the closest laser point. Table 3. Absolute Accuracy Deviation between laser points and RTK survey points. RTK Survey Sample Size (n): 501 Root Mean Square Error (RMSE) = 0.03 m Minimum z = m Standard Deviations Maximum z = 0.07 m 1 sigma (s) = 0.03 m 2 sigma (s): 0.07 m Average z = 0.00 ft Figure 5. Absolute Accuracy Histogram Statistics Distribution 30% 25% 20% 15% 10% 5% 0% Deviation ~ Laser Point to Nearest Ground Survey Point (m) Figure 6. Absolute Accuracy Absolute Deviation % 90% 80% 70% 60% 50% 40% 30% 20% 10% 0% Cumulative Distribution Deviation ~ Laser Point to Nearest Ground Survey Point (m) s 1s Median Ground Survey Point 13
14 4.5 Data Density/Resolution Some types of surfaces (i.e., dense vegetation or water) may return fewer pulses than the laser originally emitted. Therefore, the delivered density can be less than the native density and slightly variable according to distributions of terrain, land cover and water bodies. Ground classifications are derived from ground surface modeling. Supervised classifications were performed by reseeding of the ground model where it is determined that the ground model has failed, usually under dense vegetation and/or at breaks in terrain, steep slopes and at bin boundaries. Project Specific Data Resolution: Average Pulse Density = 8.72 points per square meter Average Ground Density = 1.07 points per square meter Figure 7. First return laser point data density. 35% 30% 25% Distribution 20% 15% 10% 5% 0% 4 to 5 5 to 6 6 to 7 7 to 8 8 to 9 9 to to 11 Pulse Density (points per square meter) 11 to 12 Figure 8. Ground-classified laser point data density. 30% 25% 20% 15% 10% 5% 0% 0 to to to to to 1.5 Distribution 1.5 to to 2.1 Ground Point Density (points per square meter) 14
15 Figure 9. First return laser point data density in the study area, per processing bin. Figure 10. Ground-classified laser point data density per processing bin. 15
16 5. Data Specifications Table 4. Resolution and Accuracy Specifications Targeted Achieved Resolution: >8 points/m points/m 2 Vertical Accuracy (1 ) <15 cm 3 cm 6. Projection/Datum and Units Table 5. Resolution and Accuracy Specifications Datum Projection: UTM Zone 10 Vertical: NAVD88 Geoid03 Horizontal: NAD83 Units: meters 7. Deliverables Point Data: ~ASCII Format All Returns ~ASCII Format Ground-Classified Returns ~las Format All Returns Vector Data: ~Shapefile for data delivery tile delineation Raster Data: Entire Study Area: ~1 m Pixel Bare Earth ESRI GRID ~1 m Pixel Highest Hit ESRI GRID ~0.5 m Pixel Intensity TIFF Data Report: ~Full Report containing introduction, methodology, and accuracy 16


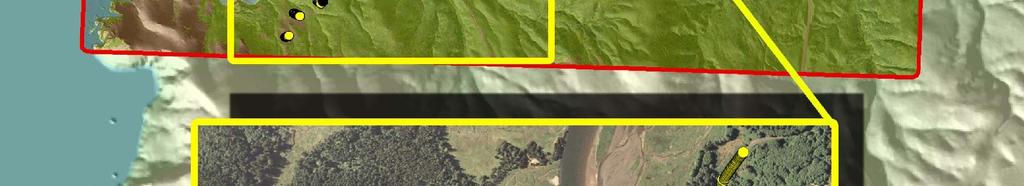
17 8. Selected Images Figure d oblique view of the entire Salmon River study area, looking northward (top image is derived from highest hit LiDAR points and bottom image is derived from ground-classified LiDAR points). 17


. 18")
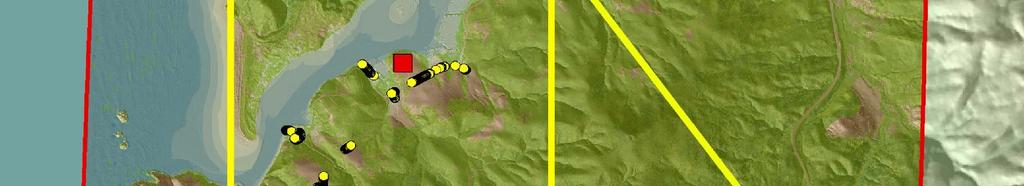
18 Figure d oblique view near the mouth of the Salmon River, looking northward (top image is NAIP orthophoto draped over highest hit LiDAR, middle image is derived from highest hit classified LiDAR points, and bottom image is derived from groundclassified LiDAR points). 18


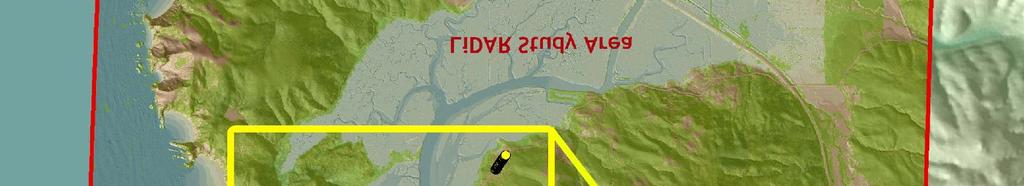
19 Figure d oblique view of the Salmon River mouth, looking southward (top image is NAIP orthophoto draped over highest hit LiDAR, middle image is derived from highest hit classified LiDAR points, and bottom image is derived from ground-classified LiDAR points). 19


. 20")
20 Figure 14. Detail view of the central part of the study area, showing tidal flats and surrounding hills (top image is derived from highest hit classified LiDAR points and bottom image is derived from ground-classified LiDAR points). 20


21 Figure 15. Detail view of the Salmon River just upstream of Highway 101 (top image is NAIP orthophoto, middle image is derived from highest hit classified LiDAR points, and bottom image is derived from ground-classified LiDAR points). 21
22 9. Glossary 1-sigma (s) Absolute Deviation: Value for which the data are within one standard deviation (approximately 68 th percentile) of a normally distributed data set. 2-sigma (s) Absolute Deviation: Value for which the data are within two standard deviations (approximately 95 th percentile) of a normally distributed data set. Root Mean Square Error (RMSE): A statistic used to approximate the difference between realworld points and the LiDAR points. It is calculated by squaring all the values, then taking the average of the squares and taking the square root of the average. Pulse Rate (PR): The rate at which laser pulses are emitted from the sensor; typically measured as thousands of pulses per second (khz). Pulse Returns: For every laser pulse emitted, the Leica ALS 50 Phase II system can record up to four wave forms reflected back to the sensor. Portions of the wave form that return earliest are the highest element in multi-tiered surfaces such as vegetation. Portions of the wave form that return last are the lowest element in multi-tiered surfaces. Accuracy: The statistical comparison between known (surveyed) points and laser points. Typically measured as the standard deviation (sigma, ) and root mean square error (RMSE). Intensity Values: The peak power ratio of the laser return to the emitted laser. It is a function of surface reflectivity. Data Density: A common measure of LiDAR resolution, measured as points per square meter. Spot Spacing: Also a measure of LiDAR resolution, measured as the average distance between laser points. Nadir: A single point or locus of points on the surface of the earth directly below a sensor as it progresses along its flight line. Scan Angle: The angle from nadir to the edge of the scan, measured in degrees. Laser point accuracy typically decreases as scan angles increase. Overlap: The area shared between flight lines, typically measured in percents; 100% overlap is essential to ensure complete coverage and reduce laser shadows. DTM / DEM: These often-interchanged terms refer to models made from laser points. The digital elevation model (DEM) refers to all surfaces, including bare ground and vegetation, while the digital terrain model (DTM) refers only to those points classified as ground. Real-Time Kinematic (RTK) Survey: GPS surveying is conducted with a GPS base station deployed over a known monument with a radio connection to a GPS rover. Both the base station and rover receive differential GPS data and the baseline correction is solved between the two. This type of ground survey is accurate to 1.5 cm or less. 22
23 10. Citations Soininen, A TerraScan User s Guide. Terrasolid. Flood, M ASPRS Guidelines: Vertical accuracy reporting for LiDAR data. Version 1.0. ASPRS LiDAR Committee. pp FEMA LiDAR specifications for flood hazard mapping. 23
LiDAR REMOTE SENSING DATA COLLECTION BISCUIT FIRE STUDY AREA, OREGON
 LiDAR REMOTE SENSING DATA COLLECTION BISCUIT FIRE STUDY AREA, OREGON Oblique view in the Biscuit Fire Study Area: Above Ground ESRI Grid (1-meter resolution) derived from all LiDAR points Submitted to:
LIDAR REMOTE SENSING DATA COLLECTION: DOGAMI, CAMP CREEK PROJECT AREA
 LIDAR REMOTE SENSING DATA COLLECTION DEPARTMENT OF GEOLOGY AND MINERAL INDUSTRIES CAMP CREEK, OREGON NOVEMBER 26, 2008 Submitted to: Department of Geology and Mineral Industries 800 NE Oregon Street, Suite
LiDAR Remote Sensing Data Collection: Yaquina and Elk Creek Watershed, Leaf-On Acquisition
 LiDAR Remote Sensing Data Collection: Yaquina and Elk Creek Watershed, Leaf-On Acquisition Submitted by: 4605 NE Fremont, Suite 211 Portland, Oregon 97213 April, 2006 Table of Contents LIGHT DETECTION
Table of Contents. 1. Overview... 1
 LIDAR REMOTE SENSING DATA COLLECTION: Diiabllo Canyon,, CA Prreparred by: : Prreparred fforr: : WSII Corrval lliss Offffi ice 5117 SW 2 nndd Stt,, Suitte 400 Corrval lliss,, OR 97333 Updaatteed Maayy 33,,,
TABLE OF CONTENTS. 1. Overview Acquisition... 2
 LiDAR Remote Sensing Data Collection: Wenas Valley, WA Delivery 2 st O Occttoobbeerr 11st,, 22001100 SSuubbm miitttteedd ttoo:: SSuubbm miitttteedd bbyy:: DDiiaannaa M Maarrttiinneezz PPuuggeett SSoouunndd
3-d rendering of LiDAR points with RGB color assigned from ortho-photos, view of Lostine River looking south
 LIDAR AND TRUE-COLOR ORTHOPHOTOGRAPHS AIRBORNE DATA ACQUISITION AND PROCESSING: GRANDE RONDE AND LEMHI RIVER BASINS Submitted to: Lanie Paquin; Susan Fraser U.S. Bureau of Reclamation 1150 N. Curtis Road
OLC Wasco County: Delivery One.
 OLC Wasco County: Delivery One www.quantumspatial.com January 2, 2014 Trimble R7 Receiver set up over GPS monument WASCO_02. Data collected for: Oregon Department of Geology and Mineral Industries 800
PSLC King County LiDAR
 June 23, 2017 PSLC King County 2016-2017 LiDAR Final Technical Data Report Andy Norton Puget Sound LiDAR Consortium 1011 Western Avenue, Suite 500 Seattle, WA 98104 PH: 206-971-3283 QSI Corvallis 517 SW
PSLC King County LiDAR. July 18, Technical Data Report.
 July 18, 2016 PSLC King County LiDAR Technical Data Report Andy Norton Puget Sound LiDAR Consortium 1011 Western Avenue, Suite 500 Seattle, WA 98104 PH: 206-971-3283 QSI Corvallis 517 SW 2 nd St., Suite
2017 OLC Silver Creek
 2017 OLC Silver Creek December 15, 2017 www.quantumspatial.com Data collected for: Oregon Department of Geology and Mineral Industries 800 NE Oregon Street Suite 965 Portland, OR 97232 Prepared by: Quantum
PSLC King County Delivery 1 LiDAR
 May 27, 2016 PSLC King County Delivery 1 LiDAR Technical Data Report Andy Norton Puget Sound LiDAR Consortium 1011 Western Avenue, Suite 500 Seattle, WA 98104 PH: 206-971-3283 QSI Corvallis 517 SW 2 nd
Saddle Mountain LiDAR. March 25, Technical Data Report.
 March 25, 2014 Saddle Mountain LiDAR Technical Data Report Diana Martinez 1011 Western Avenue, Suite 500 Seattle, WA 98104 PH: 206-971-3052 QSI Corvallis Office 517 SW 2 nd St., Suite 400 Corvallis, OR
Whittier, Alaska LiDAR
 January 17, 2013 Whittier, Alaska LiDAR Technical Data Report Revision 3 Rod Combellick Alaska DNR Division of Geological & Geophysical Surveys 3354 College Road Fairbanks, Alaska 99709 Phone 907-451-5007
Coeur d Alene Puget Sound LiDAR Consortium
 May 29, 2015 Coeur d Alene Puget Sound LiDAR Consortium Technical Data Report Puget Sound LiDAR Consortium (PSLC) Attn: Christy Lam 1011 Western Ave., Suite 500 Seattle, WA 98104 QSI Environmental 517
PSLC Walla Walla, Washington LiDAR
 May 22, 2017 PSLC Walla Walla, Washington LiDAR Technical Data Report Andy Norton Puget Sound LiDAR Consortium 1011 Western Avenue, Suite 500 Seattle, WA 98104 PH: 206-971-3283 QSI Corvallis 517 SW 2 nd
Nooksack River Basin LiDAR
 July 26, 2013 Nooksack River Basin LiDAR Technical Data Report Delivery 2 Treva Coe Nooksack Indian Tribe P.O. Box 157 5016 Deming Rd. Demming, WA 98244 PH: 360.592.5176 Diana Martinez PSRC 1011 Western
2017 OLC Siskiyou. September 27,
 2017 OLC Siskiyou September 27, 2017 www.quantumspatial.com Data collected for: Oregon Department of Geology and Mineral Industries 800 NE Oregon Street Suite 965 Portland, OR 97232 Prepared by: Quantum
1. LiDAR System Description and Specifications
 High Point Density LiDAR Survey of Mayapan, MX PI: Timothy S. Hare, Ph.D. Timothy S. Hare, Ph.D. Associate Professor of Anthropology Institute for Regional Analysis and Public Policy Morehead State University
Teanaway Streams Topobathymetric LiDAR
 November 23, 2015 Teanaway Streams Topobathymetric LiDAR Technical Data Report Andrew Norton Puget Sound LiDAR Consortium 1011 Western Avenue, Suite 500 Seattle, WA 98104 PH: 206-971-3283 QSI Corvallis
Central Coast LIDAR Project, 2011 Delivery 1 QC Analysis LIDAR QC Report February 17 th, 2012
 O R E G O N D E P A R T M E N T O F G E O L O G Y A N D M I N E R A L I N D U S T R I E S OLC Central Coast Delivery 1 Acceptance Report. Department of Geology & Mineral Industries 800 NE Oregon St, Suite
Rogue River LIDAR Project, 2012 Delivery 1 QC Analysis LIDAR QC Report September 6 th, 2012
 O R E G O N D E P A R T M E N T O F G E O L O G Y A N D M I N E R A L I N D U S T R I E S OLC Rogue River Delivery 1 Acceptance Report. Department of Geology & Mineral Industries 800 NE Oregon St, Suite
HAWAII KAUAI Survey Report. LIDAR System Description and Specifications
 HAWAII KAUAI Survey Report LIDAR System Description and Specifications This survey used an Optech GEMINI Airborne Laser Terrain Mapper (ALTM) serial number 06SEN195 mounted in a twin-engine Navajo Piper
LiDAR & Orthophoto Data Report
 LiDAR & Orthophoto Data Report Tofino Flood Plain Mapping Data collected and prepared for: District of Tofino, BC 121 3 rd Street Tofino, BC V0R 2Z0 Eagle Mapping Ltd. #201 2071 Kingsway Ave Port Coquitlam,
Delivery 1 : June 14 th, 2011
 Delivery 1 : June 14 th, 2011 LIDAR REMOTE SENSING DATA COLLECTION: QUINAULT RIVER BASIN, WASHINGTON DELIVERY 1 TABLE OF CONTENTS 1. Overview... 1 2. Acquisition... 2 2.1 Airborne Survey Instrumentation
Phone: Fax: Table of Contents
 Geomorphic Characterization of Precarious Rock Zones LIDAR Mapping Project Report Principal Investigator: David E. Haddad Arizona State University ASU School of Earth and Space
Phone: (603) Fax: (603) Table of Contents
 Fax: (603) Table of Contents") Hydrologic and topographic controls on the distribution of organic carbon in forest Soils LIDAR Mapping Project Report Principal Investigator: Adam Finkelman Plumouth State University Plymouth State University,
Hydrologic and topographic controls on the distribution of organic carbon in forest Soils LIDAR Mapping Project Report Principal Investigator: Adam Finkelman Plumouth State University Plymouth State University,
Sandy River, OR Bathymetric Lidar Project, 2012 Delivery QC Analysis Lidar QC Report March 26 th, 2013
 O R E G O N D E P A R T M E N T O F G E O L O G Y A N D M I N E R A L I N D U S T R I E S OLC Sandy River, OR Bathymetric Lidar Project Delivery Acceptance Report. Department of Geology & Mineral Industries
Quantifying the Geomorphic and Sedimentological Responses to Dam Removal. Mapping Project Report
 Quantifying the Geomorphic and Sedimentological Responses to Dam Removal. Mapping Project Report January 21, 2011 Principal Investigator: John Gartner Dartmouth College Department of Earth Sciences Hanover,
Mapping Project Report Table of Contents
 LiDAR Estimation of Forest Leaf Structure, Terrain, and Hydrophysiology Airborne Mapping Project Report Principal Investigator: Katherine Windfeldt University of Minnesota-Twin cities 115 Green Hall 1530
BLM Fire Project, 2013 QC Analysis Lidar and Orthophoto QC Report November 25th, 2013
 O R E G O N D E P A R T M E N T O F G E O L O G Y 1937 A N D M I N E R A L I N D U S T R I E S Department of Geology & Mineral Industries 800 NE Oregon St, Suite 965 Portland, OR 97232 BLM Fire Project,
LiDAR Technical Report NE Washington LiDAR Production 2017
 LiDAR Technical Report NE Washington LiDAR Production 2017 Presented to: Washington DNR 1111 Washington Street SE Olympia, Washington 98504 Submitted by: 860 McKinley St Eugene, OR 97402 July 26, 2017
Lidar Technical Report
 Lidar Technical Report Oregon Department of Forestry Sites Presented to: Oregon Department of Forestry 2600 State Street, Building E Salem, OR 97310 Submitted by: 3410 West 11st Ave. Eugene, OR 97402 April
Simulating Dynamic Hydrological Processes in Archaeological Contexts Mapping Project Report
 Simulating Dynamic Hydrological Processes in Archaeological Contexts Mapping Project Report Principal Investigator: Wetherbee Dorshow University of New Mexico 15 Palacio Road Santa Fe, NM 87508 e-mail:
TABLE OF CONTENTS. 1. Overview Acquisition... 2
 LIIDAR REMOTE SENSIING DATA COLLECTIION: Maiinstem, North, & South Fork Nooksack Riivers, WA Aprriill 24,, 2009 Reviissed June 17,, 2009 Submiitttted tto:: Diana Marrtti inezz Pugett SSound Regionall Councill
Yosemite National Park LiDAR Mapping Project Report
 Yosemite National Park LiDAR Mapping Project Report Feb 1, 2011 Principal Investigator: Greg Stock, PhD, PG Resources Management and Science Yosemite National Park 5083 Foresta Road, PO Box 700 El Portal,
Project Report Nooksack South Fork Lummi Indian Nation. Report Presented to:
 June 5, 2005 Project Report Nooksack South Fork Lummi Indian Nation Contract #2291-H Report Presented to: Lummi Indian Nation Natural Resources Department 2616 Kwina Road Bellingham, WA 98226 Point of
Airborne LiDAR Data Acquisition for Forestry Applications. Mischa Hey WSI (Corvallis, OR)
") Airborne LiDAR Data Acquisition for Forestry Applications Mischa Hey WSI (Corvallis, OR) WSI Services Corvallis, OR Airborne Mapping: Light Detection and Ranging (LiDAR) Thermal Infrared Imagery 4-Band
Airborne LiDAR Data Acquisition for Forestry Applications Mischa Hey WSI (Corvallis, OR) WSI Services Corvallis, OR Airborne Mapping: Light Detection and Ranging (LiDAR) Thermal Infrared Imagery 4-Band
An Introduction to Lidar & Forestry May 2013
 An Introduction to Lidar & Forestry May 2013 Introduction to Lidar & Forestry Lidar technology Derivatives from point clouds Applied to forestry Publish & Share Futures Lidar Light Detection And Ranging
Quinnipiac Post Flight Aerial Acquisition Report
 Quinnipiac Post Flight Aerial Acquisition Report August 2011 Post-Flight Aerial Acquisition and Calibration Report FEMA REGION 1 Quinnipiac Watershed, Connecticut, Massachusesetts FEDERAL EMERGENCY MANAGEMENT
Mapping Project Report Table of Contents
 Beavers as geomorphic agents in small, Rocky Mountain streams. Mapping Project Report Jan 27, 2011 Principal Investigator: Rebekah Levine Department of Earth and Planetary Sciences, MSCO3-2040,1 University
Up to 4 range measurements per pulse, including last 4 Intensity readings with 12-bit dynamic range for each measurement
 Project PI: Hugo A. Gutierrez Jurado 1. ALTM Specifications This survey used an Optech GEMINI Airborne Laser Terrain Mapper (ALTM) serial number 06SEN195 mounted in a twin-engine Cessna Skymaster (Tail
Project Report Lower Columbia River. Report Presented to:
 December 29, 2005 Project Report Lower Columbia River Contract #2265-H Report Presented to: Puget Sound Lidar Consortium 1011 Western Avenue, Suite 500 Seattle, WA 98104 Phone: (206) 464-7090 Fax: (206)
Burns, OR LIDAR Project, 2011 Delivery QC Analysis LIDAR QC Report February 13th, 2012
 O R E G O N D E P A R T M E N T O F G E O L O G Y A N D M I N E R A L I N D U S T R I E S OLC Burns, OR Delivery Acceptance Report. Department of Geology & Mineral Industries 800 NE Oregon St, Suite 965
William E. Dietrich Professor 313 McCone Phone Fax (fax)
") February 13, 2007. Contact information William E. Dietrich Professor 313 McCone Phone 510-642-2633 Fax 510-643-9980 (fax) bill@eps.berkeley.edu Project location: Northwest of the Golden Gate Bridge, San
February 13, 2007. Contact information William E. Dietrich Professor 313 McCone Phone 510-642-2633 Fax 510-643-9980 (fax) bill@eps.berkeley.edu Project location: Northwest of the Golden Gate Bridge, San
Light Detection and Ranging (LiDAR)
") Light Detection and Ranging (LiDAR) http://code.google.com/creative/radiohead/ Types of aerial sensors passive active 1 Active sensors for mapping terrain Radar transmits microwaves in pulses determines
Light Detection and Ranging (LiDAR) http://code.google.com/creative/radiohead/ Types of aerial sensors passive active 1 Active sensors for mapping terrain Radar transmits microwaves in pulses determines
Lewis County Public Works Department (County) GIS Mapping Division 350 N. Market Blvd. Chehalis, WA Phone: Fax:
 GIS Mapping Division 350 N. Market Blvd. Chehalis, WA Phone: Fax:") March 31, 2005 Project Report Lewis County, WA Contract #2262-H Report Presented to: Lewis County Public Works Department (County) GIS Mapping Division 350 N. Market Blvd. Chehalis, WA 98532-2626 Phone:
March 31, 2005 Project Report Lewis County, WA Contract #2262-H Report Presented to: Lewis County Public Works Department (County) GIS Mapping Division 350 N. Market Blvd. Chehalis, WA 98532-2626 Phone:
W D-0049/004 EN
 September 21, 2011 Contact Ground Survey Report, Lidar Accuracy Report, & Project Report New Madrid Seismic Zone Northeast of Memphis, Tennessee Contract Number: W91278-09D-0049/004 EN Project: C-10-026
AIRBORNE LIDAR TASK ORDER REPORT SHELBY COUNTY TN 1M NPS LIDAR/FEATURE EXTRACT TASK ORDER UNITED STATES GEOLOGICAL SURVEY (USGS)
") AIRBORNE LIDAR TASK ORDER REPORT SHELBY COUNTY TN 1M NPS LIDAR/FEATURE EXTRACT TASK ORDER UNITED STATES GEOLOGICAL SURVEY (USGS) CONTRACT NUMBER: G10PC00057 TASK ORDER NUMBER: G12PD00127 Woolpert Project
AIRBORNE LIDAR TASK ORDER REPORT SHELBY COUNTY TN 1M NPS LIDAR/FEATURE EXTRACT TASK ORDER UNITED STATES GEOLOGICAL SURVEY (USGS) CONTRACT NUMBER: G10PC00057 TASK ORDER NUMBER: G12PD00127 Woolpert Project
Project Report Snohomish County Floodplains LiDAR Survey. Report Presented to:
 August 22, 2005 Project Report Snohomish County Floodplains LiDAR Survey Contract #2295-H Report Presented to: David Evans and Associates, Inc. (DEA) 1620 W. Marine View Drive, Suite 200 Everett, WA 98201
Project Report Sauk-Suiattle Indian Tribe. Report Presented to:
 July 28, 2005 Project Report Sauk-Suiattle Indian Tribe Contract #2294-H Report Presented to: Sauk-Suiattle Indian Tribe 5318 Chief Brown Lane Darrington, WA 98241 Phone: (360) 436-0738 Fax: (360) 436-1092
Studies. Reno, NV USA
 Data Collection and Processing Report forr 2015 Mapping Project of the Walker Fault System in Nevadaa PI: Steven G. Wesnousky Steven G. Wesnousky Professor of Geology and Seismology Director Center for
Municipal Projects in Cambridge Using a LiDAR Dataset. NEURISA Day 2012 Sturbridge, MA
 Municipal Projects in Cambridge Using a LiDAR Dataset NEURISA Day 2012 Sturbridge, MA October 15, 2012 Jeff Amero, GIS Manager, City of Cambridge Presentation Overview Background on the LiDAR dataset Solar
Title: Understanding Hyporheic Zone Extent and Exchange in a Coastal New Hampshire Stream Using Heat as A Tracer
 Contact information Danna Truslow d.truslow@comcast.net Phone: 603-498-2916 Fax: 603-430-9102 Address: 1065 Washington Road Rye, NH 03970 Advisor: Jennifer Jacobs Advisor's email: jennifer.jacobs@unh.edu
LIDAR MAPPING FACT SHEET
 1. LIDAR THEORY What is lidar? Lidar is an acronym for light detection and ranging. In the mapping industry, this term is used to describe an airborne laser profiling system that produces location and
Orthophotography and LiDAR Terrain Data Collection Rogue River, Oregon Final Report
 Orthophotography and LiDAR Terrain Data Collection Rogue River, Oregon Final Report Prepared by Sky Research, Inc. 445 Dead Indian Memorial Road Ashland, OR 97520 Prepared for Rogue Valley Council of Governments
Adrian Cosmin Ghimbaşan 1 Cornel Cristian Tereşneu 1 Iosif Vorovencii 1
 Adrian Cosmin Ghimbaşan 1 Cornel Cristian Tereşneu 1 Iosif Vorovencii 1 1 Forest Management Planning and Terrestrial Measurements Department, Faculty of Silviculture and Forest Engineering, Transilvania
LiDAR data pre-processing for Ghanaian forests biomass estimation. Arbonaut, REDD+ Unit, Joensuu, Finland
 LiDAR data pre-processing for Ghanaian forests biomass estimation Arbonaut, REDD+ Unit, Joensuu, Finland Airborne Laser Scanning principle Objectives of the research Prepare the laser scanning data for
Third Rock from the Sun
 Geodesy 101 AHD LiDAR Best Practice The Mystery of LiDAR Best Practice Glenn Jones SSSi GIS in the Coastal Environment Batemans Bay November 9, 2010 Light Detection and Ranging (LiDAR) Basic principles
MISSISSIPPI AND ALABAMA COASTAL MAPPING
 LIDAR REPORT MISSISSIPPI AND ALABAMA COASTAL MAPPING U.S. ARMY CORPS OF ENGINEERS MOBILE DISTRICT CONTRACTOR: R&M CONSULTANTS, INC. CONTRACT NO. W91278-04-D-0001/0003 EN PROJECT NO. C-05-054 Prepared By:
Up to 4 range measurements per pulse, including last 4 Intensity readings with 12-bit dynamic range for each measurement
 Contact information Greg Tucker Cooperative Institute for Research in Environmental Sciences (CIRES) Dept. of Geological Sciences University of Colorado Boulder, CO 80309-0399 303-492-6985 gtucker@cires.colorado.edu
LiDAR Derived Contours
 LiDAR Derived Contours Final Delivery June 10, 2009 Prepared for: Prepared by: Metro 600 NE Grand Avenue Portland, OR 97232 Watershed Sciences, Inc. 529 SW Third Avenue, Suite 300 Portland, OR 97204 Metro
Terrestrial GPS setup Fundamentals of Airborne LiDAR Systems, Collection and Calibration. JAMIE YOUNG Senior Manager LiDAR Solutions
 Terrestrial GPS setup Fundamentals of Airborne LiDAR Systems, Collection and Calibration JAMIE YOUNG Senior Manager LiDAR Solutions Topics Terrestrial GPS reference Planning and Collection Considerations
N.J.P.L.S. An Introduction to LiDAR Concepts and Applications
 N.J.P.L.S. An Introduction to LiDAR Concepts and Applications Presentation Outline LIDAR Data Capture Advantages of Lidar Technology Basics Intensity and Multiple Returns Lidar Accuracy Airborne Laser
APPENDIX E2. Vernal Pool Watershed Mapping
 APPENDIX E2 Vernal Pool Watershed Mapping MEMORANDUM To: U.S. Fish and Wildlife Service From: Tyler Friesen, Dudek Subject: SSHCP Vernal Pool Watershed Analysis Using LIDAR Data Date: February 6, 2014
Reality Check: Processing LiDAR Data. A story of data, more data and some more data
 Reality Check: Processing LiDAR Data A story of data, more data and some more data Red River of the North Red River of the North Red River of the North Red River of the North Introduction and Background
Light Detection and Ranging (LiDAR) Radiohead House of Cards
 Radiohead House of Cards") Light Detection and Ranging (LiDAR) Radiohead House of Cards http://the-moni-blog.blogspot.com/2009/03/lidar-is-going-mainstream-mtv-baby.html h =? Laser Vision GPS + IMU θ H X a h Types of aerial sensors
Light Detection and Ranging (LiDAR) Radiohead House of Cards http://the-moni-blog.blogspot.com/2009/03/lidar-is-going-mainstream-mtv-baby.html h =? Laser Vision GPS + IMU θ H X a h Types of aerial sensors
SPAR, ELMF 2013, Amsterdam. Laser Scanning on the UK Highways Agency Network. Hamish Grierson Blom Uk
 SPAR, ELMF 2013, Amsterdam Laser Scanning on the UK Highways Agency Network Hamish Grierson Blom Uk www.blomasa.com www.blom-uk.co.uk Blom UK Part of the Blom Group Blom Group - Europe s largest aerial
Terrain Modeling and Mapping for Telecom Network Installation Using Scanning Technology. Maziana Muhamad
 Terrain Modeling and Mapping for Telecom Network Installation Using Scanning Technology Maziana Muhamad Summarising LiDAR (Airborne Laser Scanning) LiDAR is a reliable survey technique, capable of: acquiring
The YellowScan Surveyor: 5cm Accuracy Demonstrated
 The YellowScan Surveyor: 5cm Accuracy Demonstrated Pierre Chaponnière1 and Tristan Allouis2 1 Application Engineer, YellowScan 2 CTO, YellowScan Introduction YellowScan Surveyor, the very latest lightweight
Aerial and Mobile LiDAR Data Fusion
 Creating Value Delivering Solutions Aerial and Mobile LiDAR Data Fusion Dr. Srini Dharmapuri, CP, PMP What You Will Learn About LiDAR Fusion Mobile and Aerial LiDAR Technology Components & Parameters Project
Windstorm Simulation & Modeling Project
 Windstorm Simulation & Modeling Project Airborne LIDAR Data and Digital Elevation Models in Broward County, Florida Data Quality Report and Description of Deliverable Datasets Prepared for: The Broward
CLASSIFICATION OF NONPHOTOGRAPHIC REMOTE SENSORS
 CLASSIFICATION OF NONPHOTOGRAPHIC REMOTE SENSORS PASSIVE ACTIVE DIGITAL CAMERA THERMAL (e.g. TIMS) VIDEO CAMERA MULTI- SPECTRAL SCANNERS VISIBLE & NIR MICROWAVE HYPERSPECTRAL (e.g. AVIRIS) SLAR Real Aperture
High resolution survey and orthophoto project of the Dosso-Gaya region in the Republic of Niger. by Tim Leary, Woolpert Inc.
 High resolution survey and orthophoto project of the Dosso-Gaya region in the Republic of Niger by Tim Leary, Woolpert Inc. Geospatial Solutions Photogrammetry & Remote Sensing LiDAR Professional Surveying
WADDENZEE SPRING SURVEY
 Report Lidar Survey WADDENZEE SPRING SURVEY 2016 Datum: 6th of June 2016 Client: Nederlandse Aardolie Maatschappij : Author: W. Velthoven Reviewer: F. de Boeck Project number: N605 Version: v1 page 1 van
Airborne discrete return LiDAR data was collected on September 3-4, 2007 by
 SUPPLEMENTAL MATERIAL 2 LiDAR Specifications Airborne discrete return LiDAR data was collected on September 3-4, 2007 by Watershed Sciences, Inc. (Corvallis, Oregon USA). LiDAR was collected approximately
Airborne Laser Scanning: Remote Sensing with LiDAR
 Airborne Laser Scanning: Remote Sensing with LiDAR ALS / LIDAR OUTLINE Laser remote sensing background Basic components of an ALS/LIDAR system Two distinct families of ALS systems Waveform Discrete Return
LIDAR Workshop IPSRS Commission 1
 LIDAR Workshop IPSRS Commission 1 2-Jul-2007, Ljubliana, Slovenia Arthur Rohrbach, Leica Geosystems, Switzerland Presentation topics 1. Basics of Airborne LIDAR Sensing Technology 2. Typical Applications
Performance Evaluation of Optech's ALTM 3100: Study on Geo-Referencing Accuracy
 Performance Evaluation of Optech's ALTM 3100: Study on Geo-Referencing Accuracy R. Valerie Ussyshkin, Brent Smith, Artur Fidera, Optech Incorporated BIOGRAPHIES Dr. R. Valerie Ussyshkin obtained a Ph.D.
The Applanix Approach to GPS/INS Integration
 Lithopoulos 53 The Applanix Approach to GPS/INS Integration ERIK LITHOPOULOS, Markham ABSTRACT The Position and Orientation System for Direct Georeferencing (POS/DG) is an off-the-shelf integrated GPS/inertial
Technical Data Report. San Simeon & Cambria Faults. LiDAR & Orthoimagery Survey. March 21, Prepared for:
 March 21, 2013 Technical Data Report San Simeon & Cambria Faults LiDAR & Orthoimagery Survey Prepared for: Scot Wilson, PLS PG&E Land Surveying & Engineering Support 2730 Gateway Oaks Drive, Suite 220
Lidar and GIS: Applications and Examples. Dan Hedges Clayton Crawford
 Lidar and GIS: Applications and Examples Dan Hedges Clayton Crawford Outline Data structures, tools, and workflows Assessing lidar point coverage and sample density Creating raster DEMs and DSMs Data area
Topographic Lidar Data Employed to Map, Preserve U.S. History
 OCTOBER 11, 2016 Topographic Lidar Data Employed to Map, Preserve U.S. History In August 2015, the National Park Service (NPS) contracted Woolpert for the Little Bighorn National Monument Mapping Project
ALS40 Airborne Laser Scanner
 ALS40 Airborne Laser Scanner Airborne LIDAR for Professionals High Performance Laser Scanning Direct Measurement of Ground Surface from the Air The ALS40 Airborne Laser Scanner measures the topography
Iowa Department of Transportation Office of Design. Photogrammetric Mapping Specifications
 Iowa Department of Transportation Office of Design Photogrammetric Mapping Specifications March 2015 1 Purpose of Manual These Specifications for Photogrammetric Mapping define the standards and general
NATIONWIDE POINT CLOUDS AND 3D GEO- INFORMATION: CREATION AND MAINTENANCE GEORGE VOSSELMAN
 NATIONWIDE POINT CLOUDS AND 3D GEO- INFORMATION: CREATION AND MAINTENANCE GEORGE VOSSELMAN OVERVIEW National point clouds Airborne laser scanning in the Netherlands Quality control Developments in lidar
NEXTMap World 30 Digital Surface Model
 NEXTMap World 30 Digital Surface Model Intermap Technologies, Inc. 8310 South Valley Highway, Suite 400 Englewood, CO 80112 083013v3 NEXTMap World 30 (top) provides an improvement in vertical accuracy
LIDAR an Introduction and Overview
 LIDAR an Introduction and Overview Rooster Rock State Park & Crown Point. Oregon DOGAMI Lidar Project Presented by Keith Marcoe GEOG581, Fall 2007. Portland State University. Light Detection And Ranging
Technical Considerations and Best Practices in Imagery and LiDAR Project Procurement
 Technical Considerations and Best Practices in Imagery and LiDAR Project Procurement Presented to the 2014 WV GIS Conference By Brad Arshat, CP, EIT Date: June 4, 2014 Project Accuracy A critical decision
The Reference Library Generating Low Confidence Polygons
 GeoCue Support Team In the new ASPRS Positional Accuracy Standards for Digital Geospatial Data, low confidence areas within LIDAR data are defined to be where the bare earth model might not meet the overall
Alaska Department of Transportation Roads to Resources Project LiDAR & Imagery Quality Assurance Report Juneau Access South Corridor
 Alaska Department of Transportation Roads to Resources Project LiDAR & Imagery Quality Assurance Report Juneau Access South Corridor Written by Rick Guritz Alaska Satellite Facility Nov. 24, 2015 Contents
Geometric Rectification of Remote Sensing Images
 Geometric Rectification of Remote Sensing Images Airborne TerrestriaL Applications Sensor (ATLAS) Nine flight paths were recorded over the city of Providence. 1 True color ATLAS image (bands 4, 2, 1 in
ENY-C2005 Geoinformation in Environmental Modeling Lecture 4b: Laser scanning
 1 ENY-C2005 Geoinformation in Environmental Modeling Lecture 4b: Laser scanning Petri Rönnholm Aalto University 2 Learning objectives To recognize applications of laser scanning To understand principles
PROJECT REPORT. Allegany County Acquisition and Classification for FEMA Region 3 FY 12 VA LiDAR. USGS Contract: G12PD00040.
 PROJECT REPORT For the Allegany County Acquisition and Classification for FEMA Region 3 FY 12 VA LiDAR USGS Contract: G12PD00040 Prepared for: United States Geological Survey & Federal Emergency Management
Assimilation of Break line and LiDAR Data within ESRI s Terrain Data Structure (TDS) for creating a Multi-Resolution Terrain Model
 for creating a Multi-Resolution Terrain Model") Assimilation of Break line and LiDAR Data within ESRI s Terrain Data Structure (TDS) for creating a Multi-Resolution Terrain Model Tarig A. Ali Department of Civil Engineering American University of Sharjah,
Assimilation of Break line and LiDAR Data within ESRI s Terrain Data Structure (TDS) for creating a Multi-Resolution Terrain Model Tarig A. Ali Department of Civil Engineering American University of Sharjah,
TerraMatch. Introduction
 TerraMatch Introduction Error sources Interior in LRF Why TerraMatch? Errors in laser distance measurement Scanning mirror errors Exterior in trajectories Errors in position (GPS) Errors in orientation
2010 LiDAR Project. GIS User Group Meeting June 30, 2010
 2010 LiDAR Project GIS User Group Meeting June 30, 2010 LiDAR = Light Detection and Ranging Technology that utilizes lasers to determine the distance to an object or surface Measures the time delay between
Course Outline (1) #6 Data Acquisition for Built Environment. Fumio YAMAZAKI
 #6 Data Acquisition for Built Environment. Fumio YAMAZAKI") AT09.98 Applied GIS and Remote Sensing for Disaster Mitigation #6 Data Acquisition for Built Environment 9 October, 2002 Fumio YAMAZAKI yamazaki@ait.ac.th http://www.star.ait.ac.th/~yamazaki/ Course Outline
AT09.98 Applied GIS and Remote Sensing for Disaster Mitigation #6 Data Acquisition for Built Environment 9 October, 2002 Fumio YAMAZAKI yamazaki@ait.ac.th http://www.star.ait.ac.th/~yamazaki/ Course Outline
Tools, Tips and Workflows Geiger-Mode LIDAR Workflow Review GeoCue, TerraScan, versions and above
 GeoCue, TerraScan, versions 015.005 and above Martin Flood August 8, 2016 Geiger-mode lidar data is getting a lot of press lately as the next big thing in airborne data collection. Unlike traditional lidar
Hamilton County Enhances GIS Base Mapping with 1-foot Contours
 Hamilton County Enhances GIS Base Mapping with 1-foot Contours Presented by Larry Stout, Hamilton County GIS Manager Brad Fugate, Woolpert Inc. Today s Presentation Hamilton County s 2004 Base Mapping
QUESTIONS & ANSWERS FOR. ORTHOPHOTO & LiDAR AOT
 QUESTIONS & ANSWERS FOR ORTHOPHOTO & LiDAR AOT Question# 1. Section 3.2 Will the imagery be clipped to the 1000m boundary? If so, what color will be used for null valued pixels? Yes, the imagery will be