Tutorial 1. Getting Started
|
|
|
- Ralph Skinner
- 5 years ago
- Views:
Transcription
1 Tutorial 1 Getting Started Table of Contents Objective 2 Step-by-Step Procedure... 2 Section 1 Input Data Preparation and Main Menu Options. 2 Step 1: Create New Project... 2 Step 2: Define Base Grid Size and Dimensions... 3 Step 3: Edit Base Grid.. 5 Step 4: Assign Porous Media Zones. 8 Step 5: Define Initial Hydraulic Head Distribution.. 12 Step 6: Define Initial Solute Concentration Distribution.. 12 Step 7: Define Hydraulic Head and Solute Concentration Boundary Conditions 16 Step 8: Wells. 21 Step 9: Groundwater Pathlines.. 21 Step 10: Monitoring Points. 22 Step 11: Review Input. 23 Step 12: View.. 25 Step 13: Base Map.. 27 Step 14: Simulation. 31 Step 15: Output 35 Step 16: Help System.. 36 Section 2 Simulation Results Visualization. 37 Step 1: View Two-Dimensional Hydraulic Head Contour (Lines) Map.. 37 Step 2: View Groundwater Pathline. 39 Step 3: View 2D Solute Concentration Contour (Flood) Map. 40 Step 4: Select and View Monitoring Point Simulation Results 42 Step 5: Develop Cross-Section View of Plume 43 Step 6: View 3D Surface Plot of Concentration Contours 43 1
2 Objective Provide an overview of the main menu options for Adaptive Groundwater (AGW) (e.g., grid design, basic boundary condition specification, time step control, etc.) and create an input data file for a basic example solute transport problem: three-dimensional advection-dispersion of a Gaussian plume in a uniform groundwater flow field. For additional information regarding menu options please refer to the Program Overview section of the AGW help documentation. The completed Adaptive Groundwater input files for this tutorial are included in the Tutorial_1 subdirectory of the tutorials directory under the Adaptive_Groundwater program folder: C:\Adaptive_Groundwater\Tutorials\Tutorial_1\Tutorial_1_Completed.agw These project files are provided to you as a reference (you can check the completed input data if you have questions while working through the tutorial). Many output times are also provided so that you can view the variations of hydraulic heads and solute concentrations over a long time period. As discussed below, you will work with a separate set of project files. This tutorial is divided into two sections. The first part is a step-by-step demonstration of the input data preparation for the example problem. Since this is the first tutorial, all main menu options are discussed. However, several menu options and program capabilities are covered in more detail in the remaining Tutorials 2-9. Section 2 illustrates the generation of various twoand three-dimensional visualizations of the simulation results for this tutorial. Step-by-Step Procedure Section 1 Example Problem Input Data Preparation and Review of Main Menu Options Step 1 Create New Project In the main menu select File > New to create a new AGW "project" (Figure 1). A project is all of the input data and output files for a flow and transport model of a site. As shown in Figure 1, save the file with the name Tutorial_1_Start under the Tutorial_1 subdirectory: C:\Adaptive_Groundwater\Tutorials\Tutorial_1\Tutorial_1_Start.agw The New Base Grid dialog appears (Figure 2), in which you establish the Level 1 (coarse grid) dimensions and select whether you want a homogenous (User-defined material zones) or heterogeneous (correlated random K field) aquifer. 2

3 Figure 1 Step 2 Define Base Grid Size and Dimensions As shown in Figure 2, enter these Base Grid dimensions: X max = 5100 m (34 columns); Y max = 1500 m (10 rows); Z max = 50 m (10 layers). These values produce Base Grid cells with horizontal dimensions of 150 m and a vertical thickness of 5 m. For the hydraulic conductivity distribution select the Homogeneous Zones radio button. This selection can later be changed using the Simulation Control Parameters dialog (see discussion below). As discussed below in the Porous Media Zones section, transport parameter zones must be specified for both hydraulic conductivity options (i.e., even if K is randomly distributed). Click on the Create button to generate the starting Base Grid (Figure 3). On the main menu select File > Save to save your input data. 3


4 Figure 2 Figure 3 4
5 Additional Notes on the File Menu Option [ NOTE: These File options are inactive when other menu options are selected (e.g., while defining boundary conditions or viewing output)]: Open (Figure 1) an existing Adaptive Groundwater (.agw) project ; Save the current project files using the same name; Save As prompts the User to save the current project files using a different name; Print/Export a hardcopy of your results, create a graphics file, or export to an ASCII file; or Exit the program. Additional Notes on Base Grid Dimensions: A minimum of three Base Grid columns, rows, and layers must be used; In most cases, the Base Grid mesh spacing can be uniform in a given direction and rows or columns and 5-10 layers are adequate; Two exceptions to this general guidance are inflow and outflow boundaries (e.g., the upgradient and downgradient boundaries of the Base Grid for this tutorial) where we recommend placing two narrow columns to ensure more consistent flux computation on different levels (i.e., contrasting cell sizes) of grid refinement; Grid refinement [i.e., higher levels of the AMR (Adaptive Mesh Refinement) grid] is automatically added based on the number of AMR levels and the "mesh refinement factor (IREFINE = 2 or 4; refer to the discussion of the Simulation Control Parameters dialog below). Step 3 Edit Base Grid In the main menu select Grid > Edit Base Grid Mesh, which pops up the Base Grid Mesh Spacing dialog in Figure 4. As shown, all of the current column widths [DX(I), where I = column no.] are 150 m. Make the following column-width changes to improve the multi-level boundary flux computation. Use the +/- buttons and enter these new DX(I) sizes near the left-hand side grid boundary: DX(1) = DX(2) = 1.5 m; DX(3) = 147 m. Make the same mirror-image changes at the right-hand boundary: DX(32) = 147 m; DX(33) = DX(34) = 1.5 m. Figure 5 shows the new column widths for columns 1-3. Click OK on the Base Grid Mesh Spacing dialog to generate the modified Base Grid (Figure 6). The x-direction limits of the modified grid are now m. 5


6 Figure 4 Figure 5 6
; Grid > Edit Columns > Refine by 2 allows the user to highlight a column and either create two columns from one (push any key) or exit from")
7 Figure 6 Additional Notes on Base Grid Editing: The Grid option also provides standard mesh refining or coarsening tools for editing the row, column, or layer sizes in the Base Grid mesh (e.g., Figure 7; Edit Layers, Edit Rows, or Edit Layers options); Grid > Edit Columns > Refine by 2 allows the user to highlight a column and either create two columns from one (push any key) or exit from this menu option (without changing the Base Grid) by pushing the esc key; Grid > Edit Columns > Merge 2 Columns combines two columns into one; Grid > Edit Columns > Add a Column allows the User to subdivide a column at a specific x-coordinate; The same options are available for editing rows (y-direction) and layers (z-direction). 7
8 Figure 7 Step 4 Assign Porous Media Zones Three options are available in Adaptive Groundwater for defining material properties (Figure 8): (i) standard delineation of material zones (by window, polygon, or Base Grid cell) based on a User-defined material property database; (ii) generation of a three-dimensional correlated random permeability field in all or part of the simulation domain (refer to Tutorial 3); and (iii) delineation of layered hydrogeologic units by interpolating stratigraphic contact elevation ASCII data (see Tutorials 7 and 8). Inactive when hydraulic conductivity type is Homogeneous Zones (Figure 2) Figure 8 8

9 By default, one homogeneous material zone is assigned to the entire domain when a new AGW project is created. You can view and edit the material-zone database by selecting Porous Media Zones > Edit/View Database on the main menu, which pops us the following dialog. Select the help button in this dialog for more information. For example, on the main menu select Porous Media Zones > Inspect/Edit to view the single material zone (Zone 1) for this tutorial (Figure 9). 9
 or the +/-")
10 Figure 9 The layer in the current plan (x-y) view is changed by selecting either the layer number Go To button (Figure 10) or the +/- buttons. 10
 or by making the appropriate selection under View in the")
11 Figure 10 Per the message box at the bottom of the screen, click on a cell to view (or change via the +/- buttons) the assigned material property. In all plots you can Zoom In, Zoom Last, or Translate the view by clicking one of the icons in the upper-left corner of the display (Figure 9) or by making the appropriate selection under View in the main menu. To display x-z or y-z cross-sectional views click on either the X-Z Slice (Row; ) or Y-Z Slice (Column; ) buttons, respectively, in the lower left hand corner (red circle in Figure 9). (You can also select View > Change View Plane in the main menu). Then, move the mouse cursor to highlight the Base Grid row or column that you would like to view and left click on the row/column. Push the Esc key to abort this operation. 11

12 When you first switch to the cross-section view, you will want to add vertical exaggeration (e.g., VE = 10-20) by going to View > Vertical Exaggeration in the main menu. If you would like to view more information regarding material zones click on the Help button on any of the dialogs under the Porous Media Zones option. Step 5 Define Initial Hydraulic Head Distribution Two options are available for defining the t = 0 hydraulic head distribution (H o ) in the aquifer: a uniform hydraulic head or a program-computed, 3D starting hydraulic head solution (select this option under Simulation > Simulation Control Parameters > Flow; see dialog discussion below). NOTE: In either case, H o should be entered as a realistic field-scale value (e.g., average of updradient/downgradient head B.C. values) in order to accelerate the flow solution convergence (Picard iterations). On the main menu select Initial Head to pop up the Assign Initial Uniform Head dialog (Figure 11). Enter H o = m (average of aquifer boundary head B.C. s) and click OK. This value is automatically saved with the project files. Figure 11 Step 6 Define Initial Solute Concentration Distribution Four options are provided for defining the initial (t = 0) solute concentration, C o, distribution (Figure 12): (i) User-defined zones (select values from the database and assign by window, polygon, or cell); (ii) program kriged 3D interpolation of imported concentration measurements; (iii) program-generated, three-dimensional plumes based on superposition of Gaussian puffs (Tutorials 1 and 2); or (iv) Gaussian puffs added to concentration zones (Tutorial 2). 12
 to the entire domain when a new AGW project is created.")
13 Figure 12 This tutorial uses a simple Gaussian plume as the initial condition. - Concentration Zones - By default, C o = 0 is assigned (as one concentration zone) to the entire domain when a new AGW project is created. For example, on the main menu select Initial Concentration > Inspect/Edit C Zones to view the single initial concentration zone (Zone 1) for this tutorial (Figure 13a). The layer in the current plan (x-y) view is changed by selecting either the select layer Go To button (Figure 13b) or the +/- buttons. Per the message box at the bottom of the screen, click on a cell to view (or change via the +/- buttons) the assigned initial solute concentration (zero in this case). Select Cancel in the Inspect/Edit dialog and proceed to the next step (Gaussian puffs). 13


14 Figure 13a Figure 13b 14
 use the Select Layer No.")
15 - Gaussian Puff Superposition - On the main menu select Initial Concentration >3D Gaussian Plumes + C Zones to view the single 3D Gaussian plume defined as the initial solute concentration distribution for this tutorial. In the Initial Concentration Distribution dialog (Figure 14a) use the Select Layer No. field to change the plan view to Base Grid layer 6; zoom in to generate the x-z slice view through the plume center in Figure 14b (C max = 1.0 mg/l). You can change some of the values in the Initial Concentration Distribution dialog (Figure 14a) and view the results by selecting Redraw Contours. If you make changes, remember to click on Save Parameters to save your updated Gaussian puff values. Please refer to Tutorial 2 for a detailed illustration of generating realistic field-scale plumes (t = 0) using this Gaussian puff superposition option. If you would like to view more information regarding specification of the initial conditions for solute concentration click on the Help button on any of the dialogs under the Initial Concentration option. Figure 14a 15


16 Figure 14b Step 7 Define Hydraulic Head and Solute Concentration Boundary Conditions As discussed in more detail in the help documentation for the various boundary condition dialogs, B.C. s are assigned as three-dimensional specified head or concentration zones due to the contrasting cell sizes on the different AMR mesh levels. Depending on the final multi-level mesh configuration each time step, the program automatically assigns specific cell B.C. s on each level of refinement based on the User-defined B.C. zones. This approach also adds a large degree of numerical flexibility to Adaptive Groundwater because boundary conditions do not need to be redefined when the grid resolution changes (e.g., see Tutorial 9). 16
17 The boundary condition options for the groundwater flow solution are: hydraulic heads [linearly-varying or uniform (e.g., Tutorial 4); time-dependent or constant; aquifer boundaries (e.g., assign uniform fixed head B.C. s throughout the upgradient and downgradient faces to establish a regional flow field)]; leaky-type B.C. s (rivers or lakes; Tutorials 5 and 6); and recharge zones (recharge rate and concentration; Tutorial 6). The Aquifer Boundaries B.C. option is illustrated in this tutorial. If solute transport is simulated, inflow concentrations for rivers and lakes are also defined in these dialogs or via the Default Inflow Concentrations dialog (discussed below). As with hydraulic heads, solute concentration B.C. s can also be assigned to cells by specifying threedimensional B.C. regions [linearly-varying or uniform; time-dependent or constant; aquifer boundaries (e.g., assign uniform fixed concentration B.C. s throughout the upgradient face to establish solute concentrations for regional groundwater inflow)]. Alternatively, the program will automatically assign (each time step based on the updated velocity distribution) different concentration B.C. s to any cell where groundwater enters the aquifer from either an aquifer boundary, river or lakes, or injection wells (based on the values specified in the Default Inflow Concentrations dialog). - Hydraulic Head - For this tutorial, we establish a uniform flow field in the x direction by defining fixed-head boundary conditions across the upgradient and downgradient grid boundaries. In the main menu select Boundary Conditions > Hydraulic Head > Aquifer Boundaries (Figure 15). The Hydraulic Head B.C. s for Aquifer Boundary Faces dialog box pops up (Figure 16). Click the checkboxes for Face 1 (upgradient) and Face 2 (downgradient). Enter heads of m and m for Faces 1 and 2, respectively. Select the Assign Head B.C. s to Faces button to generate the boundary conditions on each face. Click OK to close the dialog and answer yes when you are asked to save the B.C. data. 17
.")
18 Figure 15 Figure 16 The Aquifer Boundaries B.C. option creates Linear Head boundary conditions. To view these B.C. s select Boundary Conditions > Hydraulic Head >Linear > Inspect/Edit on the main menu, and the dialog in Figure 17 is loaded. As shown in Figure 18, left click on one of the boundary columns to view the assigned fixed hydraulic head (e.g., the updgradient boundary column in Base Grid layer 5, as shown in Figure 18). Notice that one linear B.C. is assigned to the complete thickness of each layer (using a single segment) and that the assigned head is the same at each end of the B.C. segment. 18


19 Figure 17 Figure 18 19

20 Additional Notes on Head B.C. s: As Figure 18 illustrates, the width of the linear B.C. zone, W BC, assigned by the Aquifer Boundaries option is very narrow. This is by design to ensure that only the boundary cell on any level of grid refinement is specified as a fixed-head cell. In this example, W BC = m (W BC = 1.5 m / 16, where 1.5 m is the Base Grid column width at the boundary and 16 is the ratio of the Base Grid cell width to the Level 5 cell width). Tutorial 4 provides a different example of using the Linear Head B.C. option to delineate a horizontal drain in the middle of an aquifer. - Groundwater Recharge - On the main menu select Boundary Conditions > Recharge Rate and Concentration > Inspect/Edit to load the Inspect/Edit Recharge zones dialog (Figure 19). Notice that all of the cells are assigned the default recharge rate of 0.0 (i.e., Zone 1). Keep these default values by clicking Cancel on the recharge dialog. Note: Tutorial 6 illustrates a nonzero recharge rate specification. Figure 19 - Solute Concentration - On the main menu select Boundary Conditions > Default Inflow Concentrations to load Assign Default Inflow Concentrations dialog (Figure 20). If the concentration of groundwater entering the aquifer is not otherwise specified (by a User-defined B.C.) at aquifer (inflow) boundaries, injection wells, or leaky-type boundaries (i.e., rivers or lakes) the program automatically assigns 20

21 fixed-concentration boundary conditions to those cells based on the values in the Default Inflow Concentrations dialog. Figure 20 This tutorial does not include pumping wells, rivers, lakes, or recharge. Therefore, the upgradient boundary is the only location where groundwater enters the aquifer. To characterize the solute concentration at the inflow boundary set the Aquifer Boundaries concentration in the dialog to 0.0 mg/l (Figure 20). Click on OK and the data are automatically saved. Note: All inflow concentrations are assigned values of 0.0 when any new AGW project is created. Step 8 Wells Refer to Tutorials 6 and 8 for pumping-well examples. On the main menu the Wells selection provides options for creating and storing well screen designs (single- or multi-screened) and assigning/inspecting vertical or horizontal pumping wells. Well pumping rates can be constant or variable. Step 9 Groundwater Pathlines Tutorial 6 provides a detailed illustration of groundwater pathline starting point assignment. Please refer to that tutorial for step-by-step instructions for pathline starting point assignment. In addition, most of the tutorials incorporate pathline results. On the main menu the Pathlines selection provides options for assigning/inspecting pathline starting coordinates. Pathline tracking can be forward (i.e., with groundwater flow) or backward and optional stop times can be assigned to terminate the pathline before the end of the simulation. At the completion of a model run computed pathline trajectories can be viewed with or without the effects of chemical retardation. On the main menu select Pathlines > Inspect/Delete to load the Inspect/Delete Pathlines dialog (Figure 21). Change the current layer to Layer 6 to view the pathline starting point already 21

22 defined in Base Grid layer 6 for this tutorial (red circle in Figure 21). Left-click on the pathline symbol to view the pathline parameter values. The pathline starts in the middle of the initial Gaussian plume defined above. Figure 21 Step 10 Monitoring Points Tutorial 6 provides a detailed illustration of monitoring point assignment. Please refer to that tutorial for step-by-step instructions for monitoring point assignment. In addition, most of the tutorials incorporate monitoring point results. Select Monitoring Points on the main menu for options to assign/inspect head and concentration observation points. While viewing twodimensional contour plots of the simulation results you can click on different monitoring points to pop up a separate dialog box containing hydraulic head or solute concentration versus time graphs. On the main menu select Monitoring Points > Inspect/Delete to load the Inspect/Delete Monitoring Points dialog (Figure 22). Change the current layer to Layer 6 to view the four 22

23 monitoring points that are already defined in Base Grid layer 6 for this tutorial (Figure 22). Leftclick on any monitoring-point symbol to view the monitoring point information. These points are located so as to be in the path of the Gaussian plume centerline. Figure 22 Step 11 Review Input You can review the model input data and boundary conditions at any time by selecting Review Input on the main menu, which pops up the dialog box in Figure 23. Push Show Selection to inspect an input data type or boundary condition from the drop-down menu (left click on a B.C. or material zone to view the input values). Use the checkboxes to add desired B.C. overlays to each plot. 23

24 Figure 23 In this example (Figure 24), we show Hydraulic Conductivity (one uniform K zone) with overlays of the hydraulic head boundary conditions (linear head B.C. s at the left- and right-hand side aquifer boundaries). The solute concentration B.C. s checkbox is not activated in Figure 23 because inflow concentrations at aquifer boundaries are set to the default value of 0.0 (Boundary Conditions > Default Inflow Concentrations). Click Cancel on the Inspect/Edit Porous Media Properties dialog to return control to the Model Input Data and Boundary/Initial Conditions dialog. Click close in this dialog before proceeding to Step
 by drawing a window around the desired viewing area; Zoom Last (F2 or ) to go back to previous views; Fit to Full")
 in an x-y plan view plot, the current row ( ) in an x-z plot, or the current column ( ) in")
25 Figure 24 Step 12 View You can change the current view (Figure 25) as follows: Zoom In (can also use the Function key F1 or the toolbar in the left-hand window: ) by drawing a window around the desired viewing area; Zoom Last (F2 or ) to go back to previous views; Fit to Full Size (F3) to zoom out to the maximum extents of the grid; Translate (F4 or ) to shift a two-dimensional plot left/right or up/down; and Change View Plane to change the current layer ( ) in an x-y plan view plot, the current row ( ) in an x-z plot, or the current column ( ) in a y-z plot. 25


26 Most program dialogs also provide menus for changing the current layer/row/column. Figure 25 The Vertical Exaggeration menu brings up a dialog that allows the User to stretch all plots vertically (Figure 26). Figure 26 26

27 Step 13 Base Map - Introduction - The Base Map option on the main menu provides the capability of importing (and scale and/or translate) a base map drawing in Windows metafile format and Turn On/Off an imported map while working on input/output tasks. To assist you in converting base map files saved in other graphics formats, the graphics file conversion utility plotconv.exe is provided in the Adaptive Groundwater directory. Please refer to the help menu for the Base Map dialog for further details. - Example - As an illustration, select Base Map > Import Base Map on the main menu to pop up the Load Windows Metafile dialog (Figure 27). Select the Tutorial_1_BaseMap.wmf file in the Tutorial_1 subdirectory and click Open. Figure 27 After importing the base map.wmf file, the base map coordinates dialog (Figure 28a) is loaded. In this dialog you define the window (based on model grid coordinates) where the base map is initially placed (you will have the opportunity of scaling and translating the map after initial placement). When this dialog first appears the maximum and minimum coordinates of the window (i.e., Xmin/Xmax and Ymin/Ymax) correspond to the model grid coordinates at full zoom (i.e., the axes ranges when the model grid view are at maximum zoom). 27


28 Figure 28a In this example we will use the default base map coordinates. Therefore, click on the OK button in the Base Map Coordinates dialog and the base map is imported and automatically scaled and translated to fit your specified base map window (Figure 28b). Figure 28b 28

29 Note that the program does not supporting scaling your base map to a size that extends outside of the model domain (i.e., Xmin/Ymin less than the starting values in Figure 28a; or Xmax/Ymax greater than the starting values). Therefore, make sure that your starting base map maximum coordinates do not extend outside of the maximum model domain axes ranges before you export the map from your CAD program. Now, we will manually reduce the map size and translate it to the left and downward. Increase or decrease the x- or y-scale factors to change the map size in either coordinate direction. Increase/decrease the base map translation factor, Tr fac [ -1 < Tr fac < 1 ], to shift the map left/right. In the Translate and/or Scale Base Map dialog (Figure 29) enter 0.5 for the x- and y-direction map scales. Also, enter a x-direction translation of (shift left) and a y-translation of (shift down). Click the Redraw Draft Map button to view the revised map location. The Base Map now looks like Figure 30. Figure 29 Push Finish and Save Map and the modified base map is saved with the project files and is displayed on the screen. Further modifications to this base map cannot be made once the Finish button has been selected; the base map would have to be re-imported. 29
 to show or hide the map. You can zoom in to get a close-up view of the map (Figure 31).")
30 Figure 30 While working on other input data tasks and viewing simulation output, select Base Map > Turn On/Off Base Map in the main menu (active only in plan view) to show or hide the map. You can zoom in to get a close-up view of the map (Figure 31). 30
.")

31 Figure 31 Step 14 Simulation The Simulation option in the main menu contains selections for accessing the Simulation Control Parameters dialog (discussed below) and starting simulations ( Simulation > Start Simulation ). Before changing parameter values in the Simulation Control Parameters dialog you should click on the Help button and carefully review the parameter definitions. The following is an overview of this dialog. The Simulation Control Parameters Dialog contains these parameter groups organized as dialog tabs (Figures 32 a-h show these tabs and the parameter values used for this tutorial): Threads: Parallel Processing [number of processors, or threads, used by the code (maximum = number of processors on your computer)]; 31
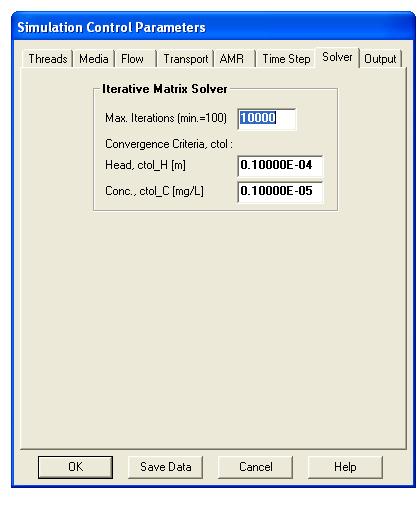
32 Media: Hydraulic Conductivity (homogeneous zones or correlated random permeability field); Flow: Flow Solution parameters (initial head type, Picard iteration tolerance and maximum number of iterations); Note: If the Compute Initial Heads box is checked (Figure 32c) a spatially-variable Initial Head Solution is computed based on material properties and boundary conditions (and H o is used as the starting hydraulic head for the iterative Initial Head Solution); if this box is unchecked, H o is assigned uniformly to all cells throughout the simulation domain; Transport: ELA Transport Solution (degree of interpolation polynomial, Picard tolerance and allowable number of iterations); AMR: Grid parameters [number of levels, cell refinement factor, minimum subgrid size, head and concentration gradients for locating subgrids, User-requested maximum total number of cells (NCELL max ) in AMR mesh (program will adjust gradient parameters and subgrid placement to satisfy NCELL max )]; Time Step: Time Stepping (total simulation time and time step size, DT, based on optional automatic control of DT based on maximum Courant numbers); Solver: Iterative Matrix Solver parameters (tolerance for head and concentration solutions, and maximum solver iterations); and Output: Saved Output Times (enter list of User-requested output times for which results will be saved during the simulation). 32
 (b)")
 (f)")


33 Figure 32 (a) (b) (c) (d) (e) (f) (g) (h) 33
34 Here are some further suggestions regarding these parameters: AMR mesh: To get a quick view of how the flow and concentration fields will look for your scenario, you can run several time steps with 2 or 3 AMR levels and a mesh refinement factor (IREFINE) = 2. Check out the Output and add more AMR levels, or change IREFINE to 4, if necessary. A very useful parameter to keep the total number of cells in the entire AMR mesh "under control" is NCELL_max. The default is 10 million cells, but you may want to reduce this to, say, 1-3 million cells as you are becoming familiar with the program. The program will automatically adjust (i.e., increase) dh_mesh and dc_mesh (see Help discussion), if needed, to keep the no. of cells less than or equal to NCELL_max. The subgrid sizes are controlled by Nsubcell_hor and Nsubcell_min. The default values in the dialog are a good starting point. Smaller values allow the AMR mesh to more closely add refinement (i.e, more efficiently place finer cells) in high-gradient areas (hydraulic head and/or concentration). However, in general small values lead to more subgrids, more Picard iterations, and more simulation effort. IGradient_Logic=3 is good in most cases: this controls whether both head & concentration gradients are used to refine the AMR mesh (IGradient_Logic=3) or if just concentration gradients are used (IGradient_Logic=2). Once you gain experience, you will find that IGradient_Logic=2 will work well in many cases (i.e, the plume advection drives the AMR mesh design) because grid refinement will automatically be added, for example, around an extraction well when it "is needed" (i.e, when the plume is drawn into the well field). Time Step: The program automatically controls the time step for the User and changes it as needed (with some general guidance). You need to define the Max. Simulation Time (i.e., how long is your simulation). The User can stop the simulation at any time, and all results up to that point are saved. NT_river =2 is good for most cases (this parameter is only used if the model contains rivers and/or lakes). In most cases, simulations run efficiently with the time step (DT) based on the maximum horizontal/vertical Courant numbers, Cu (Adaptive Groundwater adjusts DT throughout the simulation as the flow and transport dynamics change, such as when a plume enters the capture zone of a well). Cu = 4 to 8 is a good range of values in many cases [e.g., start with Cu=4, then try larger Cu (e.g, 6 to 10) for simpler flow fields and when plumes are not near a pumping well]. However, sensitivity analyses should always be performed with a smaller Cu (e.g., Cu=1-2) to make sure that the numerical accuracy of the transport equation solution is adequate (i.e., make sure that a smaller Courant number does not significantly change the simulated solute distribution). In some cases you may want to override the program's computed DT by setting DTMAX to a "smaller value" (the program will keep DT.LE. DTMAX). The program always tries to increase DT by a factor of DT_Increase (but DT is reduced if Cu criteria are exceeded) and reduces DT by DT_reduce if a Picard iteration does not converge. The default values work well in many cases (DT_Increase = 1.5; DT_reduce = 2). Please click on the Help button for this dialog for more details. 34
35 Step 15 Output Output viewing options (Figure 33) include hydraulic head, solute concentration, head or concentration (C) difference (e.g., drawdown), pore velocity vectors, hydraulic conductivity, groundwater pathlines (with optional travel-time markers), and monitoring point graphs of head and concentration versus time. Note: Section 2 below illustrates the generation of various two- and three-dimensional visualizations of the simulation results for this tutorial. Plot and Contour Types include: two-dimensional line or filled (flood maps) contour plots ( rainbow or User-selected single or two-color contours); three-dimensional surface plots of x- y, x-z, and y-z slices; three-dimensional fence diagrams with blanking (multiple combinations of I-, J-, and K- slices in a single plot); and three-dimensional volume plots with advanced blanking options based on logical (.and. /.or.) operators (e.g., blank regions with C < C1 and x < X1). Animation capabilities are provided for many output types (e.g., concentration or head vs. time in 2D and 3D plots; I-, J-, or K-slice plane in 2D or 3D fence diagrams; horizontal or vertical view angle for 3D plots). Refer to Tutorials 2-8 for many additional output examples. Select results for this tutorial are presented below. Figure 33 35


36 Step 16 Help System The Help option on the main menu launches the searchable program documentation and help system (Figure 34). Figure 34 36

37 Section 2 Simulation Results Visualization In this section we show how to create various two- dimensional plots of the simulation results for Tutorial 1. Tutorials 2-8 provide many examples of three-dimensional plots. You can use either the supplied Tutorial_1_Completed project files or your working copy of the Adaptive Groundwater files for this tutorial: Tutorial_1_Start.agw. It does not matter if you have made new runs with shorter simulation times than those shown here; select whatever output time that you want. Step 1 View Two-Dimensional Hydraulic Head Contour (Lines) Map In the main menu select Output > Hydraulic Head and the View Simulation Results dialog appears (Figure 35). A plan-view flood map through the bottom layer of the aquifer is automatically generated (Figure 36). Click the Go To button at the top of the dialog to pop up a child dialog with available output times; click on any output time you want and select OK in the Go to Output Time dialog. You may also use the + / - buttons to toggle through the output times. Figure 35 37
 coordinate of z = 2.5 m.")
38 Figure 36 Under Plot and Contour Types you see that 2D (i.e., two-dimensional) plots are the default. Use the radio button to change the Contour Type to lines (Figure 35). Notice that Base Grid layer 1 with a slice plane (x-y) coordinate of z = 2.5 m. Note: the layer number refers to the Adaptive Mesh Refinement (AMR) mesh associated with the multi-level AMR grid created during the simulation. In highly-refined mesh areas the vertical discretization is equal to the grid spacing in the highest-level subgrid (e.g, Level 5 in this example which utilizes five AMR levels). In less-refined areas the grid layer thickness for the output is equal to the grid spacing in the most-refined subgrid (e.g., Level 1, 2, 3, or 4). Click on the Contour Options button (Figure 35) to load the Contour Parameters and Overlays dialog (Figure 37). Select the Contouring Options tab and notice that 20 contour intervals have been generated in the range 100 to 105 m. 38
 and check the Show Pathlines box.")
 or by making the appropriate selection under View in the")
39 Figure 37 Step 2 - View Groundwater Pathline View the computed groundwater pathline that started in the center of the plume by selecting the Pathlines tab (Figure 38) and check the Show Pathlines box. Figure 38 In all plots you can Zoom In, Zoom Last, or Translate the view by clicking one of the icons in the upper-left corner of the display (Figure 9) or by making the appropriate selection under View in the main menu. 39
40 The mesh overlay can be turned off by un-checking the Mesh box in the Contour Options dialog (under the Overlays tab; Figure 38). If you wish to use any of these display options later, click on the Save Plot Format button at the bottom of the View Simulation Results dialog (Figure 35). Step 3 View 2D Solute Concentration Contour (Flood) Map Close the View Simulation Results dialog for hydraulic head output and on the main menu select Output > Solute Concentration to generate a plan-view flood map of the plume (Figure 39). Make sure the Contour Type (Figure 35) is re-set to filled. By default the program initially selects an x-y slice through the highest concentration zone and the last simulation time (e.g., t = 60,000 days; z = m in Figure 39). Use the Select Layer no. buttons ( +/- and Go To ) to change the view plane elevation (Figure 35). Further, you can view an animation of the different plan-view slices by changing the Animation Type to Layer (K-plane) and clicking the Start Animation button. Note that the solute concentration contours range from 0 to 0.2 mg/l (Figure 40). You can change the precision and font size of the contour legend labels by selecting the Contour Formats tab (Figure 41). 40


41 Figure 39 Figure 40 41

 of the simulated")
42 Figure 41 Step 4 Select and View Monitoring Point Simulation Results Zoom In to obtain the view in Figure 39. While in a plan or cross-section view, single click on any, or all, of the four monitoring point symbols to pop up a separate dialog containing graph(s) of the simulated concentration or hydraulic head versus time at these locations (Figure 42). Figure 42 42
 that cuts through the center of the plume (or select View > Change View Plane in the main menu).")
43 Step 5 Develop Cross-Section View of Plume To display the cross-sectional view in Figure 43, click on the X-Z Slice (Row) button in the lower left hand corner (red circle in Figure 25), and then select the row of cells (i.e., x-z slice) that cuts through the center of the plume (or select View > Change View Plane in the main menu). When you first switch to the cross-section view, you will want to add vertical exaggeration (e.g., VE = 10-20) by going to View > Vertical Exaggeration in the main menu. Figure 43 Step 6 View 3D Surface Plot of Concentration Contours While in x-z view mode (Figure 43), change back to an x-y plan view through the plane z = m. Generate the 3D surface plot in Figure 44 by selecting the 3D Surface radio button in the View Simulation Results dialog (Figure 35). 43


44 Figure 44 44
Tutorial 6. Pumping Well and River
 Tutorial 6 Pumping Well and River Table of Contents Objective. 1 Step-by-Step Procedure... 2 Section 1 Data Input. 2 Step 1: Open Adaptive Groundwater Input (.agw) File. 2 Step 2: Pumping Well Design Database
Tutorial 7. Water Table and Bedrock Surface
 Tutorial 7 Water Table and Bedrock Surface Table of Contents Objective. 1 Step-by-Step Procedure... 2 Section 1 Data Input. 2 Step 1: Open Adaptive Groundwater Input (.agw) File. 2 Step 2: Assign Material
Tutorial 3. Correlated Random Hydraulic Conductivity Field
 Tutorial 3 Correlated Random Hydraulic Conductivity Field Table of Contents Objective. 1 Step-by-Step Procedure... 2 Section 1 Generation of Correlated Random Hydraulic Conductivity Field 2 Step 1: Open
Tutorial 9. Changing the Global Grid Resolution
 Tutorial 9 Changing the Global Grid Resolution Table of Contents Objective and Overview 1 Step-by-Step Procedure... 2 Section 1 Changing the Global Grid Resolution.. 2 Step 1: Open Adaptive Groundwater
Objectives Build a 3D mesh and a FEMWATER flow model using the conceptual model approach. Run the model and examine the results.
 v. 10.0 GMS 10.0 Tutorial Build a FEMWATER model to simulate flow Objectives Build a 3D mesh and a FEMWATER flow model using the conceptual model approach. Run the model and examine the results. Prerequisite
GMS 9.1 Tutorial MODFLOW Conceptual Model Approach I Build a basic MODFLOW model using the conceptual model approach
 v. 9.1 GMS 9.1 Tutorial Build a basic MODFLOW model using the conceptual model approach Objectives The conceptual model approach involves using the GIS tools in the Map module to develop a conceptual model
v. 9.2 GMS 9.2 Tutorial MODFLOW MNW2 Package Use the MNW2 package with the sample problem and a conceptual model Prerequisite Tutorials
 v. 9.2 GMS 9.2 Tutorial Use the MNW2 package with the sample problem and a conceptual model Objectives Learn how to use the MNW2 package in GMS and compare it to the WEL package. Both packages can be used
v Prerequisite Tutorials Required Components Time
 v. 10.0 GMS 10.0 Tutorial MODFLOW Stochastic Modeling, Parameter Randomization Run MODFLOW in Stochastic (Monte Carlo) Mode by Randomly Varying Parameters Objectives Learn how to develop a stochastic (Monte
GMS 10.0 Tutorial MODFLOW Conceptual Model Approach I Build a basic MODFLOW model using the conceptual model approach
 v. 10.0 GMS 10.0 Tutorial Build a basic MODFLOW model using the conceptual model approach Objectives The conceptual model approach involves using the GIS tools in the Map module to develop a conceptual
MODFLOW - Conceptual Model Approach
 GMS 7.0 TUTORIALS MODFLOW - Conceptual Model Approach 1 Introduction Two approaches can be used to construct a MODFLOW simulation in GMS: the grid approach or the conceptual model approach. The grid approach
v MODFLOW Grid Approach Build a MODFLOW model on a 3D grid GMS Tutorials Time minutes Prerequisite Tutorials None
 v. 10.2 GMS 10.2 Tutorial Build a MODFLOW model on a 3D grid Objectives The grid approach to MODFLOW pre-processing is described in this tutorial. In most cases, the conceptual model approach is more powerful
v Overview SMS Tutorials Prerequisites Requirements Time Objectives
 v. 12.2 SMS 12.2 Tutorial Overview Objectives This tutorial describes the major components of the SMS interface and gives a brief introduction to the different SMS modules. Ideally, this tutorial should
v SMS 11.1 Tutorial Overview Time minutes
 v. 11.1 SMS 11.1 Tutorial Overview Objectives This tutorial describes the major components of the SMS interface and gives a brief introduction to the different SMS modules. It is suggested that this tutorial
Airport Tutorial - Contaminant Transport Modeling. Visual MODFLOW Flex. Integrated Conceptual & Numerical Groundwater Modeling
 Airport Tutorial - Contaminant Transport Modeling Visual MODFLOW Flex Integrated Conceptual & Numerical Groundwater Modeling Airport Tutorial: Numerical Modeling with Transport The following example is
v MODFLOW Stochastic Modeling, Parameter Randomization GMS 10.3 Tutorial
 v. 10.3 GMS 10.3 Tutorial MODFLOW Stochastic Modeling, Parameter Randomization Run MODFLOW in Stochastic (Monte Carlo) Mode by Randomly Varying Parameters Objectives Learn how to develop a stochastic (Monte
Learn the various 3D interpolation methods available in GMS
 v. 10.4 GMS 10.4 Tutorial Learn the various 3D interpolation methods available in GMS Objectives Explore the various 3D interpolation algorithms available in GMS, including IDW and kriging. Visualize the
v GMS 10.0 Tutorial MODFLOW Grid Approach Build a MODFLOW model on a 3D grid Prerequisite Tutorials None Time minutes
 v. 10.0 GMS 10.0 Tutorial Build a MODFLOW model on a 3D grid Objectives The grid approach to MODFLOW pre-processing is described in this tutorial. In most cases, the conceptual model approach is more powerful
MT3DMS Grid Approach GMS 7.0 TUTORIALS. 1 Introduction. 1.1 Contents
 GMS 7.0 TUTORIALS 1 Introduction This tutorial describes how to perform an MT3DMS simulation within GMS. An MT3DMS model can be constructed in GMS using one of two approaches: the conceptual model approach
Tutorial: Airport Numerical Model with Transport
 Tutorial: Visual MODFLOW Flex 5.0 Integrated Conceptual & Numerical Groundwater Modeling Software 1 1 Visual MODFLOW Flex 5.0 The following example walks through creating a numerical model with groundwater
1. Open a MODFLOW simulation and run MODFLOW. 2. Initialize MT3D and enter the data for several MT3D packages. 3. Run MT3D and read the solution.
 GMS TUTORIALS This tutorial describes how to perform an MT3DMS simulation within GMS. An MT3DMS model can be constructed in GMS using one of two approaches: the conceptual model approach or the grid approach.
First AnAqSim Tutorial Building a single-layer heterogeneous, anisotropic model with various boundary conditions
 First AnAqSim Tutorial Building a single-layer heterogeneous, anisotropic model with various boundary conditions Contents Introduction... 2 Starting AnAqSim... 2 Interface Overview... 2 Setting up a Basemap...
v SMS 11.2 Tutorial Overview Prerequisites Requirements Time Objectives
 v. 11.2 SMS 11.2 Tutorial Overview Objectives This tutorial describes the major components of the SMS interface and gives a brief introduction to the different SMS modules. Ideally, this tutorial should
RT3D Instantaneous Aerobic Degradation
 GMS TUTORIALS RT3D Instantaneous Aerobic Degradation This tutorial illustrates the steps involved in performing a reactive transport simulation using the RT3D model. Several types of contaminant reactions
Geostatistics 3D GMS 7.0 TUTORIALS. 1 Introduction. 1.1 Contents
 GMS 7.0 TUTORIALS Geostatistics 3D 1 Introduction Three-dimensional geostatistics (interpolation) can be performed in GMS using the 3D Scatter Point module. The module is used to interpolate from sets
Tutorial 7 Finite Element Groundwater Seepage. Steady state seepage analysis Groundwater analysis mode Slope stability analysis
 Tutorial 7 Finite Element Groundwater Seepage Steady state seepage analysis Groundwater analysis mode Slope stability analysis Introduction Within the Slide program, Slide has the capability to carry out
Tutorial: MODFLOW-USG Tutorial
 Tutorial: Visual MODFLOW Flex 5.0 Integrated Conceptual & Numerical Groundwater Modeling Software 1 1 Visual MODFLOW Flex 5.0 The following example is a walk through of creating a MODFLOW-USG groundwater
v MODPATH GMS 10.3 Tutorial The MODPATH Interface in GMS Prerequisite Tutorials MODFLOW Conceptual Model Approach I
 v. 10.3 GMS 10.3 Tutorial The Interface in GMS Objectives Setup a simulation in GMS and view the results. Learn about assigning porosity, creating starting locations, displaying pathlines in different
MODFLOW Lake Package GMS TUTORIALS
 GMS TUTORIALS MODFLOW Lake Package This tutorial illustrates the steps involved in using the Lake (LAK3) Package as part of a MODFLOW simulation. The Lake Package is a more sophisticated alternative to
GMS 8.3 Tutorial MODFLOW LAK Package Use the MODFLOW Lake (LAK3) package to simulate mine dewatering
 package to simulate mine dewatering") v. 8.3 GMS 8.3 Tutorial Use the MODFLOW Lake (LAK3) package to simulate mine dewatering Objectives Learn the steps involved in using the MODFLOW Lake (LAK3) package interface in GMS. Use the LAK3 package
v. 8.3 GMS 8.3 Tutorial Use the MODFLOW Lake (LAK3) package to simulate mine dewatering Objectives Learn the steps involved in using the MODFLOW Lake (LAK3) package interface in GMS. Use the LAK3 package
GMS 10.0 Tutorial MODFLOW Conceptual Model Approach II Build a multi-layer MODFLOW model using advanced conceptual model techniques
 v. 10.0 GMS 10.0 Tutorial Build a multi-layer MODFLOW model using advanced conceptual model techniques 00 Objectives The conceptual model approach involves using the GIS tools in the Map Module to develop
Geostatistics 2D GMS 7.0 TUTORIALS. 1 Introduction. 1.1 Contents
 GMS 7.0 TUTORIALS 1 Introduction Two-dimensional geostatistics (interpolation) can be performed in GMS using the 2D Scatter Point module. The module is used to interpolate from sets of 2D scatter points
Importing VMOD Classic Projects. Visual MODFLOW Flex. Integrated Conceptual & Numerical Groundwater Modeling
 Importing VMOD Classic Projects Visual MODFLOW Flex Integrated Conceptual & Numerical Groundwater Modeling Importing Visual MODFLOW Classic Models Tutorial The following example is a quick walk through
v. 9.0 GMS 9.0 Tutorial MODPATH The MODPATH Interface in GMS Prerequisite Tutorials None Time minutes
 v. 9.0 GMS 9.0 Tutorial The Interface in GMS Objectives Setup a simulation in GMS and view the results. Learn about assigning porosity, creating starting locations, different ways to display pathlines,
Tutorial: Importing VMOD/MODFLOW Models
 Tutorial: Visual MODFLOW Flex 5.0 Integrated Conceptual & Numerical Groundwater Modeling Software 1 1 Visual MODFLOW Flex 5.0 The following example is a quick walk-through of the basics of importing an
MODFLOW Conceptual Model Approach I Build a basic MODFLOW model using the conceptual model approach
 v. 10.1 GMS 10.1 Tutorial Build a basic MODFLOW model using the conceptual model approach Objectives The conceptual model approach involves using the GIS tools in the Map module to develop a conceptual
MODFLOW Conceptual Model Approach II Build a multi-layer MODFLOW model using advanced conceptual model techniques
 v. 10.2 GMS 10.2 Tutorial Build a multi-layer MODFLOW model using advanced conceptual model techniques 00 Objectives The conceptual model approach involves using the GIS tools in the Map module to develop
Tutorial: Conceptual Modeling Tutorial. Integrated Conceptual & Numerical Groundwater Modeling Software by Waterloo Hydrogeologic
 Tutorial: Visual MODFLOW Flex 5.1 Integrated Conceptual & Numerical Groundwater Modeling Software 1 1 Visual MODFLOW Flex 5.1 The following example is a quick walk-through of the basics of building a conceptual
MODFLOW - SWI2 Package, Two-Aquifer System. A Simple Example Using the MODFLOW SWI2 (Seawater Intrusion) Package
 Package") v. 10.3 GMS 10.3 Tutorial A Simple Example Using the MODFLOW SWI2 (Seawater Intrusion) Package Objectives Become familiar with the interface to the MODFLOW SWI2 package in GMS. Prerequisite Tutorials MODFLOW
v. 10.3 GMS 10.3 Tutorial A Simple Example Using the MODFLOW SWI2 (Seawater Intrusion) Package Objectives Become familiar with the interface to the MODFLOW SWI2 package in GMS. Prerequisite Tutorials MODFLOW
MODFLOW Regional to Local Model Conversion,
 v. 10.2 GMS 10.2 Tutorial MODFLOW Regional to Local Model Conversion, Steady State Create a local model from a regional model using convenient tools provided in GMS Objectives Use the convenient tools
Tutorial 01 Quick Start Tutorial
 Tutorial 01 Quick Start Tutorial Homogeneous single material slope No water pressure (dry) Circular slip surface search (Grid Search) Intro to multi scenario modeling Introduction Model This quick start
GMS 9.1 Tutorial MODFLOW Conceptual Model Approach II Build a multi-layer MODFLOW model using advanced conceptual model techniques
 v. 9.1 GMS 9.1 Tutorial Build a multi-layer MODFLOW model using advanced conceptual model techniques 00 Objectives The conceptual model approach involves using the GIS tools in the Map module to develop
SEAWAT 4 Tutorial - Example Problem
 SEAWAT 4 Tutorial - Example Problem Introduction About SEAWAT-4 SEAWAT-4 is the latest release of SEAWAT computer program for simulation of threedimensional, variable-density, transient ground-water flow
TUFLOW 1D/2D SURFACE WATER MODELING SYSTEM. 1 Introduction. 2 Background Data
 SURFACE WATER MODELING SYSTEM TUFLOW 1D/2D 1 Introduction This tutorial describes the generation of a 1D TUFLOW project using the SMS interface. It is recommended that the TUFLOW 2D tutorial be done before
Objectives This tutorial shows how to build a Sedimentation and River Hydraulics Two-Dimensional (SRH-2D) simulation.
 simulation.") v. 12.1 SMS 12.1 Tutorial Objectives This tutorial shows how to build a Sedimentation and River Hydraulics Two-Dimensional () simulation. Prerequisites SMS Overview tutorial Requirements Model Map Module
v. 12.1 SMS 12.1 Tutorial Objectives This tutorial shows how to build a Sedimentation and River Hydraulics Two-Dimensional () simulation. Prerequisites SMS Overview tutorial Requirements Model Map Module
This is the script for the SEEP/W tutorial movie. Please follow along with the movie, SEEP/W Getting Started.
 SEEP/W Tutorial This is the script for the SEEP/W tutorial movie. Please follow along with the movie, SEEP/W Getting Started. Introduction Here are some results obtained by using SEEP/W to analyze unconfined
lecture 8 Groundwater Modelling -1
 The Islamic University of Gaza Faculty of Engineering Civil Engineering Department Water Resources Msc. Groundwater Hydrology- ENGC 6301 lecture 8 Groundwater Modelling -1 Instructor: Dr. Yunes Mogheir
MODFLOW Automated Parameter Estimation
 GMS 7.0 TUTORIALS MODFLOW Automated Parameter Estimation 1 Introduction The MODFLOW-Model Calibration tutorial describes the basic calibration tools provided in GMS. It illustrates how head levels from
GMS 10.4 Tutorial RT3D Instantaneous Aerobic Degradation
 v. 10.4 GMS 10.4 Tutorial Objectives Simulate the reaction for instantaneous aerobic degradation of hydrocarbons using a predefined user reaction package. Prerequisite Tutorials MT2DMS Grid Approach Required
3.1 Conceptual Modeling
 Quick Start Tutorials 35 3.1 Conceptual Modeling Conceptual Modeling Tutorial The following example is a quick walk through of the basics of building a conceptual model and converting this to a numerical
GMS Tutorials MODFLOW Conceptual Model Approach 2 Adding drains, wells, and recharge to MODFLOW using the conceptual model approach
 GMS Tutorials MODFLOW Conceptual Model Approach I GMS 10.4 Tutorial MODFLOW Conceptual Model Approach 2 Adding drains, wells, and recharge to MODFLOW using the conceptual model approach v. 10.4 Objectives
v SMS Tutorials SRH-2D Prerequisites Requirements SRH-2D Model Map Module Mesh Module Data files Time
 v. 11.2 SMS 11.2 Tutorial Objectives This tutorial shows how to build a Sedimentation and River Hydraulics Two-Dimensional () simulation using SMS version 11.2 or later. Prerequisites SMS Overview tutorial
GMS 9.0 Tutorial MODFLOW Conceptual Model Approach II Build a multi-layer MODFLOW model using advanced conceptual model techniques
 v. 9.0 GMS 9.0 Tutorial Build a multi-layer MODFLOW model using advanced conceptual model techniques 00 Objectives The conceptual model approach involves using the GIS tools in the Map module to develop
v TUFLOW-2D Hydrodynamics SMS Tutorials Time minutes Prerequisites Overview Tutorial
 v. 12.2 SMS 12.2 Tutorial TUFLOW-2D Hydrodynamics Objectives This tutorial describes the generation of a TUFLOW project using the SMS interface. This project utilizes only the two dimensional flow calculation
Chapter 4 Determining Cell Size
 Chapter 4 Determining Cell Size Chapter 4 Determining Cell Size The third tutorial is designed to give you a demonstration in using the Cell Size Calculator to obtain the optimal cell size for your circuit
v SMS 11.1 Tutorial SRH-2D Prerequisites None Time minutes Requirements Map Module Mesh Module Scatter Module Generic Model SRH-2D
 v. 11.1 SMS 11.1 Tutorial SRH-2D Objectives This lesson will teach you how to prepare an unstructured mesh, run the SRH-2D numerical engine and view the results all within SMS. You will start by reading
Groundwater Modeling System
 THE DEPARTMENT OF DEFENSE Groundwater Modeling System GMS v3.0 TUTORIALS GMS 3.0 Tutorials Copyright 1999 Brigham Young University Environmental Modeling Research Laboratory All Rights Reserved Unauthorized
Lesson 1 Parametric Modeling Fundamentals
 1-1 Lesson 1 Parametric Modeling Fundamentals Create Simple Parametric Models. Understand the Basic Parametric Modeling Process. Create and Profile Rough Sketches. Understand the "Shape before size" approach.
SEAWAT Tutorial - Elder Model
 SEAWAT Tutorial - Elder Model Introduction Saltwater intrusion is a common occurrence along coastlines throughout the world. Saltwater is denser than freshwater, and consequently will tend to migrate inland
iric Software Changing River Science River2D Tutorials
 iric Software Changing River Science River2D Tutorials iric Software Changing River Science Confluence of the Colorado River, Blue River and Indian Creek, Colorado, USA 1 TUTORIAL 1: RIVER2D STEADY SOLUTION
FOUNDATION IN OVERCONSOLIDATED CLAY
 1 FOUNDATION IN OVERCONSOLIDATED CLAY In this chapter a first application of PLAXIS 3D is considered, namely the settlement of a foundation in clay. This is the first step in becoming familiar with the
MODFLOW-USG Complex Stratigraphy Create a MODFLOW-USG model of a site with complex 3D stratigraphy using GMS
 v. 10.1 GMS 10.1 Tutorial MODFLOW-USG Complex Stratigraphy Create a MODFLOW-USG model of a site with complex 3D stratigraphy using GMS Objectives GMS supports building MODFLOW-USG models with multiple
Rubis (NUM) Tutorial #1
 Tutorial #1") Rubis (NUM) Tutorial #1 1. Introduction This example is an introduction to the basic features of Rubis. The exercise is by no means intended to reproduce a realistic scenario. It is assumed that the user
Rubis (NUM) Tutorial #1 1. Introduction This example is an introduction to the basic features of Rubis. The exercise is by no means intended to reproduce a realistic scenario. It is assumed that the user
MODFLOW Model Calibration
 GMS 7.0 TUTORIALS MODFLOW Model Calibration 1 Introduction An important part of any groundwater modeling exercise is the model calibration process. In order for a groundwater model to be used in any type
GMS 8.3 Tutorial MODFLOW Stochastic Modeling, Inverse Use PEST to calibrate multiple MODFLOW simulations using material sets
 v. 8.3 GMS 8.3 Tutorial Use PEST to calibrate multiple MODFLOW simulations using material sets Objectives The Stochastic inverse modeling option for MODFLOW is described. Multiple MODFLOW models with equally
v TUFLOW 1D/2D SMS 11.2 Tutorial Time minutes Prerequisites TUFLOW 2D Tutorial
 v. 11.2 SMS 11.2 Tutorial Objectives This tutorial describes the generation of a 1D TUFLOW project using the SMS interface. It is strongly recommended that the TUFLOW 2D tutorial be completed before doing
Tutorial - Importing VMOD Classic Projects. Visual MODFLOW Flex. Integrated Conceptual & Numerical Groundwater Modeling
 Tutorial - Importing VMOD Classic Projects Visual MODFLOW Flex Integrated Conceptual & Numerical Groundwater Modeling Importing Visual MODFLOW Classic Models Tutorial The following example is a quick walk
MODFLOW Conceptual Model Approach 1 Build a basic MODFLOW model using the conceptual model approach
 GMS Tutorials v. 10.4 MODFLOW Conceptual Model Approach I GMS 10.4 Tutorial MODFLOW Conceptual Model Approach 1 Build a basic MODFLOW model using the conceptual model approach Objectives The conceptual
v Getting Started An introduction to GMS GMS Tutorials Time minutes Prerequisite Tutorials None
 v. 10.3 GMS 10.3 Tutorial An introduction to GMS Objectives This tutorial introduces GMS and covers the basic elements of the user interface. It is the first tutorial that new users should complete. Prerequisite
Lab Practical - Limit Equilibrium Analysis of Engineered Slopes
 Lab Practical - Limit Equilibrium Analysis of Engineered Slopes Part 1: Planar Analysis A Deterministic Analysis This exercise will demonstrate the basics of a deterministic limit equilibrium planar analysis
Visual MODFLOW Premium with MODFLOW SURFACT
 Visual MODFLOW Premium with MODFLOW SURFACT A Step-by-Step Tutorial for the MODFLOW-SURFACT Trial Version Waterloo Hydrogeologic TABLE OF CONTENTS Introduction..............................................
Cross Sections, Profiles, and Rating Curves. Viewing Results From The River System Schematic. Viewing Data Contained in an HEC-DSS File
 C H A P T E R 9 Viewing Results After the model has finished the steady or unsteady flow computations the user can begin to view the output. Output is available in a graphical and tabular format. The current
TexGraf4 GRAPHICS PROGRAM FOR UTEXAS4. Stephen G. Wright. May Shinoak Software Austin, Texas
 TexGraf4 GRAPHICS PROGRAM FOR UTEXAS4 By Stephen G. Wright May 1999 Shinoak Software Austin, Texas Copyright 1999, 2007 by Stephen G. Wright - All Rights Reserved i TABLE OF CONTENTS Page LIST OF TABLES...v
v GMS 10.0 Tutorial MODFLOW Advanced PEST Pilot Points, SVD-Assist, Parallel PEST Prerequisite Tutorials MODFLOW PEST Pilot Points
 v. 10.0 GMS 10.0 Tutorial Pilot Points, SVD-Assist, Parallel PEST Objectives Learn how to parameterize a MODFLOW model and run PEST to obtain optimal parameter values. Experiment with truncated singular
Excel 2003 Tutorial II
 This tutorial was adapted from a tutorial by see its complete version at http://www.fgcu.edu/support/office2000/excel/index.html Excel 2003 Tutorial II Charts Chart Wizard Chart toolbar Resizing a chart
v MT3DMS Conceptual Model Approach GMS 10.3 Tutorial Using MT3DMS with a conceptual model
 v. 10.3 GMS 10.3 Tutorial Using MT3DMS with a conceptual model Objectives Learn how to use a conceptual model when using MT3DMS. Perform two transport simulations, analyzing the long-term potential for
v Map Module Operations SMS Tutorials Prerequisites Requirements Time Objectives
 v. 12.3 SMS 12.3 Tutorial Objectives This tutorial describes the fundamental tools in the Map module of the SMS. This tutorial provides information that is useful when constructing any type of geometric
v SRH-2D Post-Processing SMS 12.3 Tutorial Prerequisites Requirements Time Objectives
 v. 12.3 SMS 12.3 Tutorial SRH-2D Post-Processing Objectives This tutorial illustrates some techniques for manipulating the solution generated by the Sedimentation and River Hydraulics Two-Dimensional (SRH-2D)
FLUENT Secondary flow in a teacup Author: John M. Cimbala, Penn State University Latest revision: 26 January 2016
 FLUENT Secondary flow in a teacup Author: John M. Cimbala, Penn State University Latest revision: 26 January 2016 Note: These instructions are based on an older version of FLUENT, and some of the instructions
v Importing Rasters SMS 11.2 Tutorial Requirements Raster Module Map Module Mesh Module Time minutes Prerequisites Overview Tutorial
 v. 11.2 SMS 11.2 Tutorial Objectives This tutorial teaches how to import a Raster, view elevations at individual points, change display options for multiple views of the data, show the 2D profile plots,
v SMS 12.2 Tutorial Observation Prerequisites Requirements Time minutes
 v. 12.2 SMS 12.2 Tutorial Observation Objectives This tutorial will give an overview of using the observation coverage in SMS. Observation points will be created to measure the numerical analysis with
What is new in GFLOW 2.1.0?
 What is new in GFLOW 2.1.0? Users that are upgrading from an earlier version of GFLOW (previously named GFLOW 2000) should read this document, since some paradigms of the earlier versions have been modified.
2002, Waterloo Hydrogeologic Inc.
 9LVXDO02')/2:3UR 9HUVLRQ7XWRULDO*XLGH,QOXGHV'9LVXDOL]DWLRQ8VLQJ 9LVXDO02')/2:'([SORUHU 2002, Waterloo Hydrogeologic Inc. Visual MODLOW Tutorial Table of Contents Introduction to Visual MODLOW 3.0 1 About
v. 9.0 GMS 9.0 Tutorial UTEXAS Dam with Seepage Use SEEP2D and UTEXAS to model seepage and slope stability of a earth dam Prerequisite Tutorials None
 v. 9.0 GMS 9.0 Tutorial Use SEEP2D and UTEXAS to model seepage and slope stability of a earth dam Objectives Learn how to build an integrated SEEP2D/UTEXAS model in GMS. Prerequisite Tutorials None Required
MODFLOW PEST Transient Pump Test Calibration Tools for calibrating transient MODFLOW models
 v. 10.2 GMS 10.2 Tutorial Tools for calibrating transient MODFLOW models Objectives Learn how to setup a transient simulation, import transient observation data, and use PEST to calibrate the model. Prerequisite
MGO Tutorial - Dewatering Scenario
 MGO Tutorial - Dewatering Scenario Introduction 1.0.1 Background Pumping well optimization technology is used to determine the ideal pumping well locations, and ideal pumping rates at these locations,
GMS 10.0 Tutorial SEAWAT Conceptual Model Approach Create a SEAWAT model in GMS using the conceptual model approach
 v. 10.0 GMS 10.0 Tutorial Create a SEAWAT model in GMS using the conceptual model approach Objectives Create a SEAWAT model in GMS using the conceptual model approach, which involves using the GIS tools
MODFLOW PEST Pilot Points Use pilot points with PEST to automatically calibrate a MODFLOW model
 v. 10.2 GMS 10.2 Tutorial Use pilot points with PEST to automatically calibrate a MODFLOW model Objectives Learn the features and options related to pilot points when used with PEST. Use fixed value pilot
Data Visualization SURFACE WATER MODELING SYSTEM. 1 Introduction. 2 Data sets. 3 Open the Geometry and Solution Files
 SURFACE WATER MODELING SYSTEM Data Visualization 1 Introduction It is useful to view the geospatial data utilized as input and generated as solutions in the process of numerical analysis. It is also helpful
Observation Coverage SURFACE WATER MODELING SYSTEM. 1 Introduction. 2 Opening the Data
 SURFACE WATER MODELING SYSTEM Observation Coverage 1 Introduction An important part of any computer model is the verification of results. Surface water modeling is no exception. Before using a surface
Training Manual FEFLOW 7.1
 Training Manual FEFLOW 7.1 Groundwater Modeling with FEFLOW 7.1 August 24, 2017 DHI WASY GmbH Groundwater Modelling Centre FEFLOW Services Contents 3 Contents Preface i 0.1 Scope and structure of this
MGO Tutorial: Plume Management
 MGO Tutorial: Plume Management Introduction Pumping well optimization technology is used to determine the ideal pumping well locations, and ideal pumping rates at these locations, in order to minimize
GMS 9.2 Tutorial SEAWAT Conceptual Model Approach Create a SEAWAT model in GMS using the conceptual model approach
 v. 9.2 GMS 9.2 Tutorial Create a SEAWAT model in GMS using the conceptual model approach Objectives Create a SEAWAT model in GMS using the conceptual model approach which involves using the GIS tools in
DR. SHUGUANG LI AND ASSOCIATES
 DR. SHUGUANG LI AND ASSOCIATES INTERACTIVE GROUNDWATER MODELING (IGW) TUTORIALS Dr. Shuguang Li and Associates at Michigan State University IGW Tutorials for Version 3 Copyright 2002 by Dr. Shuguang Li
Use the MODFLOW Lake (LAK3) package to simulate mine dewatering
 package to simulate mine dewatering") v. 10.3 GMS 10.3 Tutorial Use the MODFLOW Lake (LAK3) package to simulate mine dewatering Objectives Learn the steps involved in using the MODFLOW Lake (LAK3) package interface in GMS. This tutorial will
v. 10.3 GMS 10.3 Tutorial Use the MODFLOW Lake (LAK3) package to simulate mine dewatering Objectives Learn the steps involved in using the MODFLOW Lake (LAK3) package interface in GMS. This tutorial will
SETTLEMENT OF A CIRCULAR FOOTING ON SAND
 1 SETTLEMENT OF A CIRCULAR FOOTING ON SAND In this chapter a first application is considered, namely the settlement of a circular foundation footing on sand. This is the first step in becoming familiar
v SMS 11.1 Tutorial Data Visualization Requirements Map Module Mesh Module Time minutes Prerequisites None Objectives
 v. 11.1 SMS 11.1 Tutorial Data Visualization Objectives It is useful to view the geospatial data utilized as input and generated as solutions in the process of numerical analysis. It is also helpful to
Insight: Measurement Tool. User Guide
 OMERO Beta v2.2: Measurement Tool User Guide - 1 - October 2007 Insight: Measurement Tool User Guide Open Microscopy Environment: http://www.openmicroscopy.org OMERO Beta v2.2: Measurement Tool User Guide
MODFLOW Generating Data from Solids Using solid models to represent complex stratigraphy with MODFLOW
 v. 10.3 GMS 10.3 Tutorial MODFLOW Generating Data from Solids Using solid models to represent complex stratigraphy with MODFLOW Objectives Learn the steps necessary to convert solid models to MODFLOW data
APPENDIX B STEP-BY-STEP APPLICATIONS OF THE FEMWATER-LHS
 APPENDIX B STEP-BY-STEP APPLICATIONS OF THE FEMWATER-LHS Steady Two-Dimensional Drainage Problem 1. Double-click on the Argus ONE icon to open Argus ONE. 2. From the PIEs menu found along the top of the
v Mesh Editing SMS 11.2 Tutorial Requirements Mesh Module Time minutes Prerequisites None Objectives
 v. 11.2 SMS 11.2 Tutorial Objectives This tutorial lesson teaches manual mesh generation and editing techniques that can be performed using SMS. It should be noted that manual methods are NOT recommended.