Field measurements. Use of the radiance distribution to measure the optical absorption coefficient in the ocean
|
|
|
- Claribel Booker
- 5 years ago
- Views:
Transcription
1 Field measurements Limnol. Oceanogr., 34(8), 1989, , by the American Society of Limnology and Oceanography, Inc. Use of the radiance distribution to measure the optical absorption coefficient in the ocean K. J. Voss Department of Physics, University of Miami, Coral Gables, Florida Abstract Recent advances in instrumentation have enabled the accurate measurement of radiance distribution profiles. These measurements with the electro-optic radiance distribution camera system (RADS) can be used to explore theoretical treatments relating the radiance distribution to inherent properties such as absorption. I use a radiance distribution cast to obtain a profile of the optical absorption coefficient. Because this measurement of absorption is not direct, but rather is derived from the radiance distribution data, analysis of the possible sources of error is detailed, along with the advantages and disadvantages of the method. Measurement of the spectral optical absorption coefficient is of fundamental importance in ocean optics. As an inherent optical property (one that does not depend on the illumination characteristics of the ambient light field, Preisendorfer 1976), along with the scattering function and beam attenuation coefficient, it describes the fundamental interaction of light with seawater. Although an important optical property, it has not lent itself to easy and routine field measurement. There are several techniques that hold promise for measuring small volumes of seawater, including photoacoustics (Voss and Trees 1987), the shiny tube transmissometer (Zaneveld et al. 1988), and integrating sphere (Fry and Kattawar 1988). Few methods lend themselves to measurement of the average spectral optical --- Acknowledgments This work was supported by Office of Naval Rcsearch contract NO K-005. I also acknowledge the help of Albert Chapin in collecting the data and Bess Ward in allowing me to participate in her cruise on the RV R.G. Sprouf (sponsored by NSF OCE ), on which thcsc data were obtained. I also thank Roswell Austin for his guidance and many fruitful conversations. absorption coefficient for large (m3) sample volumes. Use of Gershun s law (Gershun 1939) to measure absorption in seawater allows measurement of the average spectral optical absorption coefficient (a) for large sample volumes; however, its use requires care and can be subject to several artifacts, both instru- mental and environmental. Gershun s law uses conservation of energy in the ambient light field to derive a. I will discuss this in greater detail later, but for now it suffices to mention that the downwelling and upwelling scalar irradiance coeffkients, EOd and E OUT must be measured along with the downwelling and upwelling vector irradiance coefficients, Ed and E,, as functions of depth. In most instruments these measurements are performed by separate sensors that must maintain their intercalibration (Hojerslev 1973). Recent advances in measuring the radiance distribution (Voss 1989) allow its measurement to occur with sufficient resolution and accuracy to permit calculation of EoLl, Eo,, Eli, and E, (see list of symbols). The primary advantage of measuring these quantities with the radiance distribution 1614 is reduction of the number of
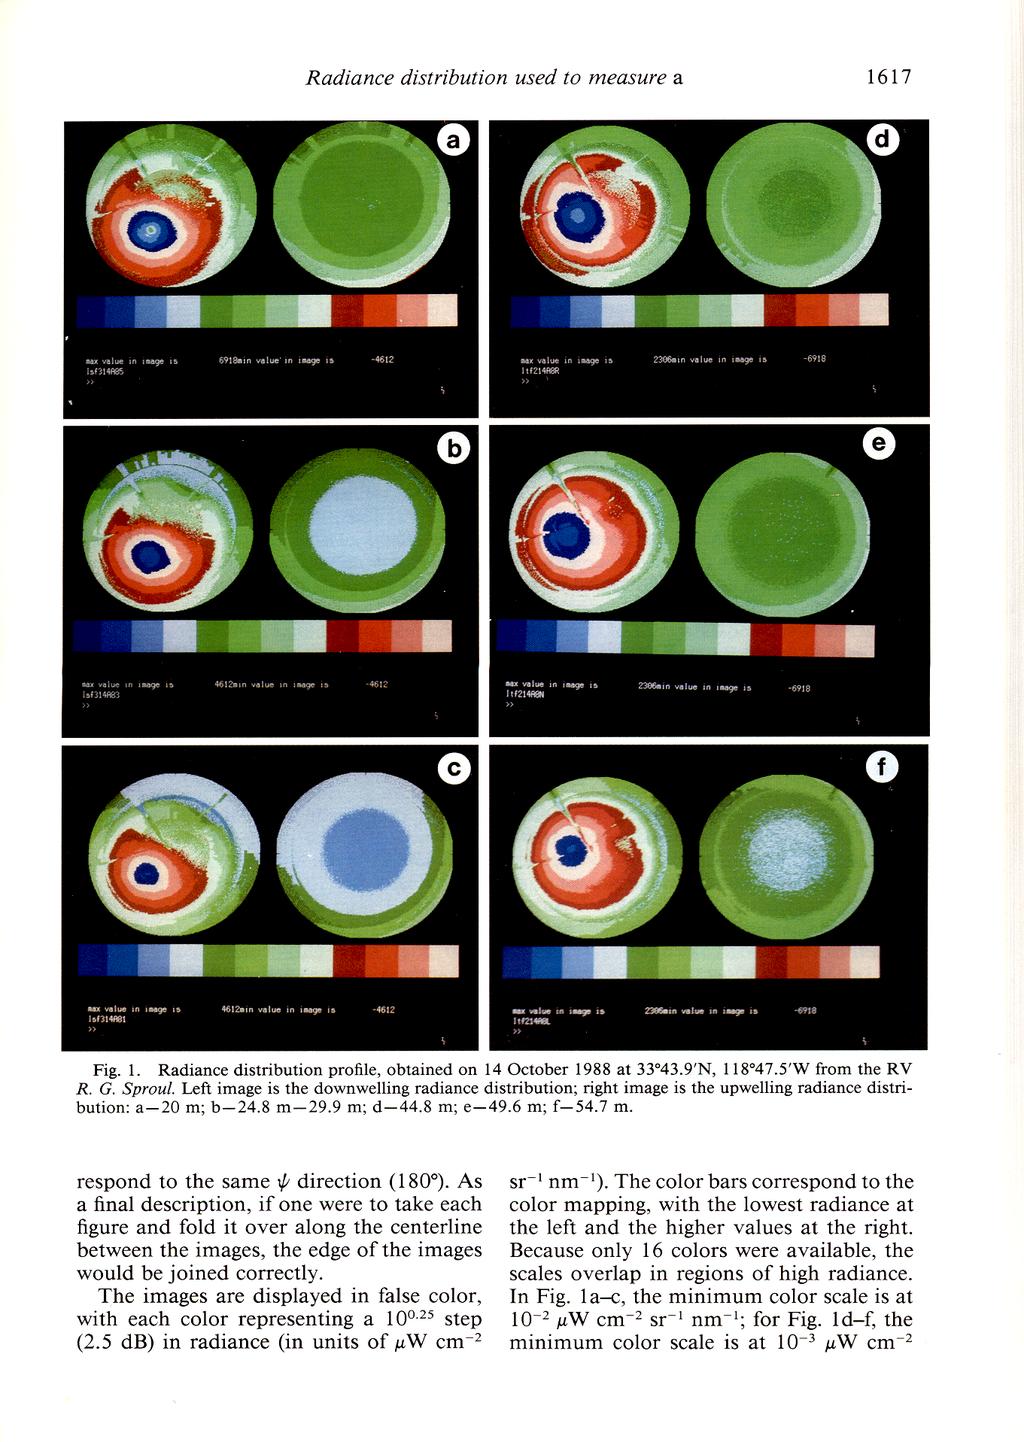
2 Radiance distribution used to measure a 1615 sensors required and elimination of possible Significant symbols drifts in absolute intercalibrations between sensors. It also allows quantification of pos- z Absorption coeffkient, m-r Beam attenuation coefhcicnt, m-l sible sources of error in this measurement, EOd, E OU Downwelling and upwelling scalar irrawhile allowing a general analysis of the ef- diance, PW cm-2 nm- fects of errors in measurement of these &,& Downwelling and upwelling vector irraquantities (Ed, E,, Eo,, and EOd) on the cal- diance, PW cmd2 nm-l E Net, or vector, irradiance, PW cm-2 culation of a. nm- Here I review the theoretical basis for Eo Total scalar irradiance, PW cm-2 nm-r measuring a with Gershun s law, show the L&o Downwelling and scalar diffuse attenuaresults of a sample water profile measured tion coefficients with this method and radiance distribution p Average cosine Downwelling and upwelling average data, and then analyze sources of error in CL 7 I - cosine this measurement. Depth, m hz $3-3 Radiance, PW cm -2 nm- sr-l Theory of Gershun 3 law A(quantity) Error in quantity Gershun s law uses conservation of energy to show ae, = -div E (1) where E. is the total scalar irradiance, EO = Eod + Eo,, div the divergence operator, div = & + d+d dy dz and E the net or vector irradiance, E = Ed - E,. The first approximation to be applied to enable use of this equation in the ocean to measure a is to assume that lensing and shadowing effects are absent; in other words, the irradiances are functions of depth only. This allows the divergence to be simplified by making the derivatives with y and x equal to zero. Gershun s law then simplifies to (Preisendorfer 1976) de 1dE ae, = -- dz ora= -E-. (2) The average cosine, p, relates E and E. for a given radiance distribution. It is dcfined by E(z) EA.(z) = - E,(z) - With this relationship, Eq. 2 can be expanded to 1 d a = -E,(z) d(z) - - bcwo(dl (3) deo(z) Mz) a = E,(z) d(z) (4) d(z) * The asymptotic region is defined as that region where the shape of the radiance distribution does not change,,u(z) = p, and therefore dp(z)/dz is zero (Preisendorfer 1959). Also in the asymptotic region the diffuse attenuation coefficients for vector and scalar irradiance arc equal (Preisendorfer 1959). In this region -= de(z) - de, d(z) d(z) and Eq. 4 and 2 are equivalent. These equations, specifically Eq. 2 and 4, lead to the measurement techniques by which Gershun s law can be used to measure the spectral absorption coefficient. The first requirement is measurement ofe, and E at various depths. Two methods may be involved; the first is through use of Eq. 2 and requires closely spaced measurements of E. Depths must be closely spaced since deldz must be determined for depth intervals for which the shape of the radiance distribution does not change significantly; p (and therefore E,) need only be measured at depths for which the absorption coefficient is required. In the second method, Eq. 4 is used and closely spaced measurements of E. and E must be obtained since both the change in E. and the change of b with depth are required.
3 1616 Voss The above equations can also be used to determine E,(z). Equation 4 can be integrated to obtain (Stavn 1987): &l(z) = &Ku --gjj ( ) exp[ -I=$$ dz j. (5) Equation 5 is of limited use, since to obtain E,(z) at any depth requires knowledge of E,(z ) and E(z ) at all depths, z, less than z in order to determine I. Measurement with radiance distribution Recent developments in measuring the spectral radiance distribution (Voss 1988) through use of the elcctro-optic radiance distribution camera system (RADS) have led to its feasibility in measuring the absorption coefficient. RADS uses two electro-optic cameras with fisheye lenses to measure the complete radiance distribution at a given depth and a given wavelength and another camera system to measure the downwelling sky radiance distribution at the surface for that wavelength. The upwelling or downwelling spectral radiance distribution at each depth is measured quickly (< 1 s); however, at present, transmitting the image to the surface requires 2 min per image. Thus, a cast with six depths sampled requires 0.5 h. The validity of assuming a constant light source for the cast is determined by using the surface radiance camera to investigate-changes in the sky or solar radiance during the data cast. Although the limited sampling rate reduces the effectiveness of the use of RADS in routine measuremcnt of the absorption coefficient in the ocean, the angular resolution of the data obtained allows investigation -into possible consequences of instrumental errors and environmental conditions on the absorption measurement. RADS is therefore most useful as a tool to investigate various aspects of radiative transfer, such as the use of apparent optical properties to obtain inherent optical properties and to investigate radiative transfer models with the high angular resolution of RADS. During a cruise off San Diego, RADS was used to collect radiance distribution data during a hydrocast. The data presented here are the results of this cast and a cast with the Vislab spectral transmissometer (VLST, Petzold and Austin 1968). The VLST is a beam transmissometer which allows the beam attenuation coefficient, c, at five differcnt visible wavelengths to be measured. This transmissometer is a cylindrically limited design, with a forward angle acceptance of <1.5. All b earn transmissometer data presented are at 490 nm, obtained with a IO-nm bandwidth. For the RADS data presented, the downwelling radiance data were taken at nm with a 25.5-nm bandwidth, and the upwelling radiance data were taken at nm with a 26.0-nm bandwidth. No effort was made to correct for this slight wavelength mismatch in the data analysis. A single cast was chosen, for which mea- surements of the radiance distribution at depths of 20.0, 24.8, 29.9, 44.8, 49.6, and 54.7 m were available. These measurements were obtained between 1248 PST (for the start of the 54.7-m sample) and 1328 PST (for the end of the 20-m sample). Measurements were also obtained at 35 and 40 m but were discarded because of pixel saturation in the images. Figure 1 shows the reduced radiance dis- tribution for these casts. In the panels of this figure the image on the left is the downwelling radiance distribution; the image on the right is the upwelling radiance distribution These images are best thought of as radiance distribution maps. The projection of these maps is as follows: the zenith angles for the images are directly proportional to the radial distance from the center of the image. The relative azimuthal directions are obtained directly by the azimuthal position in the image. The relative phase of the azimuthal direction for the downwelling and upwelling images is as follows: if one sets the azimuthal angle (+) in the downwelling radiance distribution image equal to zero for the top of the image, $ increases in a clockwise direction. For the upwelling radiance distribution image + increases in a counterclockwise direction. For example, the top of the images correspond to the same rc/ direction in both the upwelling and downwelling images (0 ). The left-hand side of the downwelling image corresponds to the right-hand side of the upwelling image and vice versa. The bottoms of both images cor-
4
5 1618 Voss sr-l nm-l. If F lg. la is used as an illustration, the center of the image ofthe upwelling radiance distribution has radiance values between 10-l and 1 O PW cm-2 sr- I nm-l (the center of the upwelling image has the minimum radiance values in each of the images). The values in the upwelling radiance distribution increase toward their outside edge and match the 90 zenith angle values in the downwelling radiance distribution. The bright portion of the downwelling image is the direct solar component, and the radiance values here reach the range of PW cmp2 sr-l nm-l (the very small green spot in the center of the solar component); the other images follow similarly. These images were also processed with an additional step beyond the radiometric calibration. Because the data did not extend to 90 zenith in both the upwelling and downwelling images, a routine to interpolate the images between the data edge of the downwelling image and the upwelling image was devised. A logarithmic least-squares fit was performed on 5 sections of $J and this line used to fill in data along the edges, which then satisfied the condition that the radiance distribution be continuous between the upwelling and downwelling images. An edge effect appears in the raw data downwelling image due to a neutral density coating installed on the instrument window (needed to reduce the intrascene dynamic range of the camera system, Voss 1989). A logarithmic least-squares fit was also used in this region to smooth across this edge effect in the image (which occurs at -45 zenith). These two steps are necessary to allow accurate calculation of Ed, E,, EOd, and E,, from these images. Several qualitative features are evident in these images. As the depth increases, the portion of the downwelling image relating to the solar component decreases in value and becomes less peaked (fewer contours per angular region). Another feature of the downwelling images is that they get much more symmetric and have much less variation in radiance values with depth [in the image at 20.0 m (Fig. 1 a) the radiance values range over 32.5 db, while in the image at 54.7 m (Fig. If) the values range over 22.5 db]. The upwelling images show no largescale change, but tend to decrease evenly overall. Another qualitative feature of these images is the evidence of a ship and cable shadow in the images. The instrument is supported by a triangular arrangement of three cables, with the instrument electrical cable tied off on one of these cables. These show in the images as three radial stripes [e.g. in the image at 54.7 m (Fig. lf) these stripes occur at $ of ~35, 260, and The ship shadow also causes an obvious effect in the downwelling image [most clearly evident in the images at 49.6 m (Fig. le) and 54.7 m (Fig. If) as the intrusions of low radiance values into high radiance areas at 1c/ of This instrument shows the firstorder effects of ship shadow quite plainly, and some of these images will be used elsewhere to calculate the effect of ship shadow on the irradiance and radiances measured. Values for the E,(z) and E(z) were obtained from these images through use of the equations and 2?r Ed(z) = d$ s 0 -J 0 90 sin(e) d8 L(8, $, z) cos(8) with E,,(z) and E,(z) calculated from similar integrals, but over the lower hemisphere ( I 180). Because the data existed as discrete values, these integrals were performed as numerical sums, with each pixel weighted by the solid angle it represented. Table 1 compiles these data, along with the upwelling and downwelling average cosines (calculated using I.C, = Ed/EOd and pu = E,/ E,,). From these values, the absorption can be calculated with two methods outlined previously. The first (using Eq. 2) is shown in Table 2 as a( 1) and the second (using Eq. 4) as a(2). The differentials in the equations were obtained by fitting the linear variation of the natural logarithm of the values concerned (E,, Ed, and p for the depth above,
6 Radiance distribution used to measure a 1619 Table 1. Downwelling and upwelling irradiance, downwelling and upwelling scalar irradiance, and downwelling and upwelling average cosines for depths sampled. Depth (m) &W cm-2 nm-l) PAZ) P"(Z) Q depth below, and central depth) with depth. The functional form was assumed to be logarithmic due to the exponential relationship of p(z) and E,(z) with z detailed in Eq. 5. The absorptions obtained with these two methods are close to equal (the maximum difference is 2.3%). Also shown in this table are both p(z) and dp(z)/dz. The magnitude of dp(z)/dz was quite small at all of these depths, reaching a maximum of 2.6% of the absorption at 29.9 m. One would expect that dh(z)/dz would bc larger at depths < 10 m, where the radiance distribution is changing rapidly; however, due to the large dynamic range in the radiance distribution at these depths, this cannot be measured with RADS at this time. During this cruise no alternate method of measuring the spectral absorption coefficient was available, so this measurement cannot be compared directly. However, one can USC a combination of the absorption coefficient and the beam attenuation coefficient to interrelate to historical data. Table 3 illustrates the scattering coefficient, obtained through the closure relation, the single scattering albedo, and the scattering to absorption ratio. Kirk (198 1) reported re- Table 2. Total average cosine, change in average cosine, the absorption coefficient calculated with Eq. 2 [a(l)] and the absorption coefficient calculated with Eq. 4 bg')l. dg(z)/dz 41) 42) Depth (m) N(Z) (m sults of a Monte-Carlo study of the relationships between optical properties in water with varying inherent properties. These results are useful in that they provide a reference for the predicted average cosine and reflectance as a function of b/a. These results generally agree with my measurements (e.g. my measurement at 24.8 m indicated a b/a of 3.84). If one interpolates figure 2 of Kirk for this value of b/a, h is between 0.70 and 0.63 (my value was 0.648) and reflectance is 0.03 (my value was 0.035). Error analysis There are several possible sources for error in these or any measurement of the irradiance values which can affect the calculation of a. The first source of error to be investigated is the effect of a limited dynamic range (m 30 db for the downwelling radiance distribution) on the calculation of the scalar and vector irradiance coefficients. The upwelling light field is characteristically flat, with much lower intrascene dynamic range; thus, it is much less likely to be affected by this problem. The downwelling radiance distribution has much more intrascene dynamic range and hence is the measurement for which great care must bc taken. Although Table 3. Scattering coefficient, calculated using the closure relation (b = c - a), single scattering albcdo (w = b/c), and ratio of b/a. Depth (m) (m w b/a
7 1620 Voss I.o +ib- y- 0.9 om l f q Qm 0.X OA.A oaa 0 0 Ed (20m). &,d(20m) Cl Ed (24.8 m) 8 &,d (24.8 m) A Ed (29.9 m) A EOtl (29.9 m) a.a. A 0 B, (20m) 0. I * z 0.6 E g 0.5.s z & 0.3 s? o Ed (44.8 m) l Eod (44.8 ml (49.6 m) n Eod (49.6 m) A Ed (54.7 m) m) I. I. I. I. I. I. I I Normalized integrated solid angle Fig. 2. Plot of the normalized integrated solid angle vs. integrated normalized downwelling irradiance, illustrating the concentration of irradiance near zenith. steps can be taken to ensure that no pixels in the field are saturated, the great dynamic range means that some of the pixels will be in the dark noise of the imager. Figure 2 illustrates the relative importance of the levels of radiance in calculating the scalar and vector irradiance. In this figure, the irradiance is integrated, starting at the pixels with the highest values of radiance and progressing to the lowest. As can be seen, at worst (scalar irradiance at 54.7 m) 50% of the irradiance is calculated from the 12% of solid angle with the higher radiance values, while 90% of the irradiance is calculated from 47% of the solid angle. For this cast, on average, 50% of the irradiance is calculated from 8% of solid angle, and 90% of the irradiance is calculated from 37% of solid angle. Thus if 1 O-20% of the lowest solid jj E. ; 0.6- s! 8 k B.9 0 E, (44.8 m) w.. EC& (44.X Ill) A id d q 0 E, (49.6 m) & q Eou (49.6 m) a A E, (54.7 m) 8 O.l-. o cp A Eou (54.7 m) A -I m B Normalized integrated solid angle Fig. 3. Plot of the normalized integrated solid angle vs. integrated normalized upwelling irradiance. angle in the image is neglected, the irradiance values will only be changed by a negligible amount. The same cannot be said for the upwelling field, as shown in Fig. 3. Here the higher radiance regions of solid angle do not dominate the irradiances. Although the limited intrascene dynamic range of this field allows careful measurement of the whole area, all of the lower hemisphere must be measured if accurate values for scalar and vector irradiance are to be obtained. The next source of possible error is im the determination of p with limited field-of-view sensors. Figures 4 and 5 illustrate the downwelling and upwelling average cosine as a function of integration angle. In the case of the downwelling (upwelling) average cosine, the irradiances used to find p are integrated from zenith (nadir) to the given angle. In A A!r
8 Radiance distribution used to measure a H - I4.i M I B p I 0.2 A (54.7 m) (2Om) 8 i l (24.8 m) (29.9 m) 0.2 n (44.8 m) A (49.6m) 0.1 A (54.7 m) Zenith Fig. 4. Downwelling average cosine as a function of included solid angle. the downwelling case, p changes rapidly at the beginning but tends toward an asymptotic value at greater integration angles because the angles near 90 have radiance values low relative to the zenith, and thus affect E,, E, and p to a lesser degree. The curve shown in Fig. 4 has been fitted with a polynomial and the slope calculated. In this manner, the rate of change of,u at each angle can be determined. The rate of change in this case (at 80 ) is 0.08% per degree. Thus, measurement of the irradiance values with collectors limited to an 85 field of view leads to a 0.4% error in p. In the case of the upwelling light field the effect is much stronger. As can be seen in Fig. 5, the calculated upwelling average cosine changes rapidly with angle because the large values of radiance in the upwelling distribution occur near 90, where they affect E, strongly but do not add significantly to E due to the cosine weighting factor. If this equation is fitted with a polynomial and the rate of change determined, an error of 1.2% per degree (at 80 ) is found. This leads to an error of 6% in p for an 85 field of view. Thus, in the upwelling field more cart must be taken to correctly measure the scalar and vector irradiance near 90 to avoid large errors in measurement that can propagate into the calculation of a. To determine the total error in the measurement of a, I chose Eq. 2 with the assumption that p was not changing rapidly. angle Fig. 5. Upwelling included solid angle. Nadir angle average cosine as a function of The equation describing the error is then dln(eo) Aa = (Add(z) + PA dlneo d(=). Calculating the error in this case shows the relative error in the measurement of the radiance distribution, and thus p is 6% (Voss and Zibordi 1989). The error in determining the slopes (three points used in the regression) can be determined by the standard error of the slope; the average was found to be 15% for the four points calculated, which implies a total error of 2 1% in the measurement of a. These measurements can also be used to estimate the probable errors in other instrumental configurations and can be made most accurately by combining the radiance distribution data presented with the exact parameters of the specific instruments. Two examples are presented here. In the first example, an instrument is used that measures only the downwelling parameters (but does so perfectly); it is assumed that these will dominate the resulting p, E, and EO. In this case the a which one would calculate can be found simply from the tables of data presented. The differences between this case and the complete calculation range from 10 to 16%. This result shows the relative dominance of the downwelling component in the calculation of a with this method. In the second case, an instrument is used that measures both upwelling and downwelling irradiance, but only to 85 zenith 90
9 1622 Voss angle in the downwelling case and 85 nadir angle in the upwelling case. In such an cxample, hd would be off by 0.4% and b, by 6%. It is difhcult to estimate how de,ldz would be affected, but KEd and KEo at 24.8 m are quite similar (Ktid = m-l, KEo = m-l, implying K will probably be affected to only a small degree (2%). In this case the total error for the measured a would be -4%, taking into account the domination of Ed and p-id in E and p. In both examples, the instruments were assumed to detcrminc the measured parameters exactly; additional instrumental errors would be additive. Another possible source of error which must be taken into account is that due to extra sources of radiance in the measured spectral band. Examples of possible sources arc Raman scattering (Stavn 1988), f luorescence (Gordon 1979) etc. In the spectral region measured in this example (500 nm), Raman scattering is probably negligible; however, it would be an important factor at longer wavelengths and would probably limit this method s usefulness. Although the common phytoplankton fluorescence occurs at wavelengths around 685 nm and certain types of dinoflagellates can fluoresce in the green (Shapiro et al. 1989), the effect at this wavelength (500 nm) would probably be negligible. This green fluorescence could become important at wavelengths around 550 nm where the total irradiance of the ambient light is reduced due to increased attenuation; at wavelengths > 600 nm other phytoplankton could contribute significantly to the background irradiance. Conclusions These measurements illustrate the use of the radiance distribution to measure the optical absorption coefficient profile. Instrumental error was analyzed and found to be -2 1%. Although this is a good method of measuring the bulk absorption coefficient, measurement of absorption is not the major purpose of an instrument such as RADS. RADS, with its fine angular resolution, can be used to determine the experimental limitations of other instruments with known measurement characteristics. Data from RADS can also be used to provide cxperimental tests of radiative transfer models and verifications of these models and their corresponding assumptions. References FRY, E. S., AND G. W. KATTAWAR Measurement of the absorption coefficient of ocean water using isotropic illumination, p In Ocean Optics 9, Proc. SPIE 925. GERSHLJN, A The light field. J. Math. Phys. 18: GORDON, H. R Diffuse reflectance of the ocean: The theory of its augmentation by chlorophyll a fluorescence at 685 nm. Appl. Opt. 18: 116 l HDJERSLEV, N. K Inherent and apparent optical properties of the western Mediterranean and the Hardangerfjord. Univ. Copenhagen Inst. Phys. Oceanogr. Rep. 21, p. l-26. KIRK, J. T Monte Carlo study of the nature of the underwater light field in, and the relationships between optical properties of, turbid yellow waters. Aust. J. Mar. Freshwater Res. 32: PBTZOLD, T. J., AND R. W. AUSTIN An underwater transmissometer for ocean survey work. Scripps Inst. Oceanogr. SIO Ref PREISENDORFER, R. W Theoretical proof of the existence of characteristic diffuse light in natural waters. J. Mar. Res. 18: l Hydrologic optics V. 1. NTIS PB /8ST, Springfield, VA. SHAPIRO, L. P., E. M. HAUGEN, AND E. J. CARPENTER Occurrence and abundance of grcen-fluorescing dinoflagellates in surface waters of the Northwest Atlantic and Northeast Pacific Oceans. J. Phycol. 25: STAVN, R. H The three-parameter model of the submarine light field: Radiant energy absorption and trapping in nepheloid layers recalculated. J. Geophys. Res. 92: Raman scattering ellects in ocean optics, p. 13 I-139. /n Ocean Optics 9, Proc. SPIE 925. Voss, K. J Radiance distribution measurements in coastal water, p In Ocean Optics 9, Proc. SPIE Electra-optic camera system for measurement of the underwater radiance distribution. Opt. Eng. 28: , AND C. C. TREES Differential optoacoustic absorption of pure water. Eos 68: , AND G. ZIBORDI Radiometric and geometric calibration of a visible spectral electro-optic fisheye camera radiance distribution system. J. Atmos. Ocean Technol. 6: ZANEVELD,.~. R. V.,R. BARTZ,J.C.KITCHEN, AND R. W. SPINRAD A reflective tube diffuse attenuation meter and absorption meter. Eos 69: 1124.
Effect of 3-D instrument casing shape on the self-shading of in-water upwelling irradiance
 Effect of 3-D instrument casing shape on the self-shading of in-water upwelling irradiance Jacek Piskozub Institute of Oceanology PAS, ul. Powstancow Warszawy 55, 81-712 Sopot, Poland piskozub@iopan.gda.pl
2017 Summer Course on Optical Oceanography and Ocean Color Remote Sensing. Apparent Optical Properties and the BRDF
 2017 Summer Course on Optical Oceanography and Ocean Color Remote Sensing Curtis Mobley Apparent Optical Properties and the BRDF Delivered at the Darling Marine Center, University of Maine July 2017 Copyright
Diffuse reflection coefficient of a stratified sea
 Diffuse reflection coefficient of a stratified sea Vladimir I. Haltrin A differential equation of a Riccati type for the diffuse reflection coefficient of a stratified sea is proposed. For a homogeneous
2017 Summer Course Optical Oceanography and Ocean Color Remote Sensing. Overview of HydroLight and EcoLight
 2017 Summer Course Optical Oceanography and Ocean Color Remote Sensing Curtis Mobley Overview of HydroLight and EcoLight Darling Marine Center, University of Maine July 2017 Copyright 2017 by Curtis D.
2017 Summer Course on Optical Oceanography and Ocean Color Remote Sensing. Introduction to Remote Sensing
 2017 Summer Course on Optical Oceanography and Ocean Color Remote Sensing Introduction to Remote Sensing Curtis Mobley Delivered at the Darling Marine Center, University of Maine July 2017 Copyright 2017
Toward closure of the inherent optical properties
 JOURNAL OF GEOPHYSICAL RESEARCH, VOL. 100, NO. C7, PAGES 13,193-13,199, JULY 15, 1995 Toward closure of the inherent optical properties of natural waters W. Scott Pegau and J. Ronald V. Zaneveld College
Quantifying the Dynamic Ocean Surface Using Underwater Radiometric Measurements
 DISTRIBUTION STATEMENT A. Approved for public release; distribution is unlimited. Quantifying the Dynamic Ocean Surface Using Underwater Radiometric Measurements Dick K.P. Yue Center for Ocean Engineering
Evaluation of Satellite Ocean Color Data Using SIMBADA Radiometers
 Evaluation of Satellite Ocean Color Data Using SIMBADA Radiometers Robert Frouin Scripps Institution of Oceanography, la Jolla, California OCR-VC Workshop, 21 October 2010, Ispra, Italy The SIMBADA Project
Analysis of the In-Water and Sky Radiance Distribution Data Acquired During the Radyo Project
 DISTRIBUTION STATEMENT A. Approved for public release; distribution is unlimited. Analysis of the In-Water and Sky Radiance Distribution Data Acquired During the Radyo Project Kenneth J. Voss Physics Department,
Quantitative estimation of the underwater radiance distribution
 1 2 3 4 Quantitative estimation of the underwater radiance distribution 5 Marlon R. Lewis 1,2, Jianwei Wei 1, Ronnie Van Dommelen 2, Kenneth J. Voss 3 6 7 8 9 10 11 1 Department of Oceanography, Dalhousie
ESA Training Course Oceanography from Space. Introduction into Hydro Optics
 ESA Training Course Oceanography from Space Introduction into Hydro Optics Roland Doerffer GKSS Institute for Coastal Research September 26, 26 The penetration of light in the sea Source: http://www.malediven.net/haupts.htm
Lecture 1a Overview of Radiometry
 Lecture 1a Overview of Radiometry Curtis Mobley Vice President for Science Senior Scientist Sequoia Scientific, Inc. Bellevue, Washington 98005 USA curtis.mobley@sequoiasci.com IOCCG Course Villefranche-sur-Mer,
RADIANCE IN THE OCEAN: EFFECTS OF WAVE SLOPE AND RAMAN SCATTERING NEAR THE SURFACE AND AT DEPTHS THROUGH THE ASYMPTOTIC REGION
 RADIANCE IN THE OCEAN: EFFECTS OF WAVE SLOPE AND RAMAN SCATTERING NEAR THE SURFACE AND AT DEPTHS THROUGH THE ASYMPTOTIC REGION A Thesis by JULIE MARIE SLANKER Submitted to the Office of Graduate Studies
Use of the Polarized Radiance Distribution Camera System in the RADYO Program
 DISTRIBUTION STATEMENT A: Approved for public release; distribution is unlimited. Use of the Polarized Radiance Distribution Camera System in the RADYO Program Kenneth J. Voss Physics Department, University
Polarized Downwelling Radiance Distribution Camera System
 Polarized Downwelling Radiance Distribution Camera System Kenneth J. Voss Physics Department, University of Miami Coral Gables, Fl. 33124 phone: (305) 284-2323 ext 2 fax: (305) 284-4222 email: voss@physics.miami.edu
contributions Radiance distribution over a ruffled sea: from glitter, sky, and ocean
 Radiance distribution over a ruffled sea: from glitter, sky, and ocean contributions Gilbert N. Plass, George W. Kattawar, and John A. Guinn, Jr. The upward radiance just above the ocean surface and at
Quantifying the Dynamic Ocean Surface Using Underwater Radiometric Measurements
 DISTRIBUTION STATEMENT A. Approved for public release; distribution is unlimited. Quantifying the Dynamic Ocean Surface Using Underwater Radiometric Measurements Dick K.P. Yue Center for Ocean Engineering
Philpot & Philipson: Remote Sensing Fundamentals Interactions 3.1 W.D. Philpot, Cornell University, Fall 12
 Philpot & Philipson: Remote Sensing Fundamentals Interactions 3.1 W.D. Philpot, Cornell University, Fall 1 3. EM INTERACTIONS WITH MATERIALS In order for an object to be sensed, the object must reflect,
Analysis of the In-Water and Sky Radiance Distribution Data Acquired During the Radyo Project
 DISTRIBUTION STATEMENT A. Approved for public release; distribution is unlimited. Analysis of the In-Water and Sky Radiance Distribution Data Acquired During the Radyo Project Kenneth J. Voss Physics Department,
Quantifying the Dynamic Ocean Surface Using Underwater Radiometric Measurement
 DISTRIBUTION STATEMENT A. Approved for public release; distribution is unlimited. Quantifying the Dynamic Ocean Surface Using Underwater Radiometric Measurement Lian Shen Department of Mechanical Engineering
REMOTE SENSING OF VERTICAL IOP STRUCTURE
 REMOTE SENSING OF VERTICAL IOP STRUCTURE W. Scott Pegau College of Oceanic and Atmospheric Sciences Ocean. Admin. Bldg. 104 Oregon State University Corvallis, OR 97331-5503 Phone: (541) 737-5229 fax: (541)
GEOG 4110/5100 Advanced Remote Sensing Lecture 2
 GEOG 4110/5100 Advanced Remote Sensing Lecture 2 Data Quality Radiometric Distortion Radiometric Error Correction Relevant reading: Richards, sections 2.1 2.8; 2.10.1 2.10.3 Data Quality/Resolution Spatial
Monte Carlo Study of the Scattering Error of a Quartz Reflective Absorption Tube
 438 JOURNAL OF ATMOSPHERIC AND OCEANIC TECHNOLOGY VOLUME 18 Monte Carlo Study of the Scattering Error of a Quartz Reflective Absorption Tube JACEK PISKOZUB Institute of Oceanology PAS, Sopot, Poland PIOTR
2017 Summer Course on Optical Oceanography and Ocean Color Remote Sensing. Monte Carlo Simulation
 2017 Summer Course on Optical Oceanography and Ocean Color Remote Sensing Curtis Mobley Monte Carlo Simulation Delivered at the Darling Marine Center, University of Maine July 2017 Copyright 2017 by Curtis
Retrieval of optical and microphysical properties of ocean constituents using polarimetric remote sensing
 Retrieval of optical and microphysical properties of ocean constituents using polarimetric remote sensing Presented by: Amir Ibrahim Optical Remote Sensing Laboratory, The City College of the City University
Use of the Polarized Radiance Distribution Camera System in the RADYO Program
 DISTRIBUTION STATEMENT A: Approved for public release; distribution is unlimited. Use of the Polarized Radiance Distribution Camera System in the RADYO Program Kenneth J. Voss Physics Department, University
Polarized Downwelling Radiance Distribution Camera System
 Polarized Downwelling Radiance Distribution Camera System Kenneth J. Voss Physics Department, University of Miami Coral Gables, Fl. 33124 phone: (305) 284-2323 ext 2 fax: (305) 284-4222 email: voss@physics.miami.edu
The Spherical Harmonics Discrete Ordinate Method for Atmospheric Radiative Transfer
 The Spherical Harmonics Discrete Ordinate Method for Atmospheric Radiative Transfer K. Franklin Evans Program in Atmospheric and Oceanic Sciences University of Colorado, Boulder Computational Methods in
Engineered Diffusers Intensity vs Irradiance
 Engineered Diffusers Intensity vs Irradiance Engineered Diffusers are specified by their divergence angle and intensity profile. The divergence angle usually is given as the width of the intensity distribution
Three dimensional light environment: Coral reefs and seagrasses
 Three dimensional light environment: Coral reefs and seagrasses 1) Three-dimensional radiative transfer modelling 2) Photobiology in submerged canopies 3) Sun glint correction of high spatial resolution
Phase function effects on oceanic light fields
 Phase function effects on oceanic light fields Curtis D. Mobley, Lydia K. Sundman, and Emmanuel Boss Numerical simulations show that underwater radiances, irradiances, and reflectances are sensitive to
A Direct Simulation-Based Study of Radiance in a Dynamic Ocean
 A Direct Simulation-Based Study of Radiance in a Dynamic Ocean Dick K.P. Yue Center for Ocean Engineering Massachusetts Institute of Technology Room 5-321, 77 Massachusetts Ave, Cambridge, MA 02139 phone:
Active Camouflage of Underwater Assets (ACUA)
") Active Camouflage of Underwater Assets (ACUA) Kendall L. Carder University of South Florida, College of Marine Science 140 7 th Avenue South, St. Petersburg, FL 33701 phone: (727) 553-3952 fax: (727) 553-3918
Active Camouflage of Underwater Assets (ACUA) Kendall L. Carder University of South Florida, College of Marine Science 140 7 th Avenue South, St. Petersburg, FL 33701 phone: (727) 553-3952 fax: (727) 553-3918
Preliminary results of an algorithm to determine the total absorption coefficient of water Suresh Thayapurath* a a
 Preliminary results of an algorithm to determine the total absorption coefficient of water Suresh Thayapurath* a a, Madhubala Talaulikar, Erwin J.A. Desa 1, Aneesh Lotlikar 2 a National Institute of Oceanography
CHLOROPHYLL CONCENTRATION ESTIMATED FROM IRRADIANCE MEASUREMENTS AT FLUCTUATING DEPTHS
 Ocean Optics XIV, Kailua-Kona, November 1998-1 - CHLOROPHYLL CONCENTRATION ESTIMATED FROM IRRADIANCE MEASUREMENTS AT FLUCTUATING DEPTHS Jasmine S. Bartlett, Mark R. Abbott, Ricardo M. Letelier and James
An asymptotic closure theory for irradiance in the sea and its inversion to obtain the inherent optical properties
 Limnol. Oceanogr., 34(8), 1989, 1442-1452 Q 1989, by the American Society of Limnology and Oceanography, Inc. An asymptotic closure theory for irradiance in the sea and its inversion to obtain the inherent
MODULE 3 LECTURE NOTES 3 ATMOSPHERIC CORRECTIONS
 MODULE 3 LECTURE NOTES 3 ATMOSPHERIC CORRECTIONS 1. Introduction The energy registered by the sensor will not be exactly equal to that emitted or reflected from the terrain surface due to radiometric and
Influence of the Depth-Dependence of the PAR Diffuse Attenuation Coefficient on the Computation of Downward Irradiance in Different Water Bodies
 Geophysica (2000), 36(1 2), 129 139 Influence of the Depth-Dependence of the PAR Diffuse Attenuation Coefficient on the Computation of Downward Irradiance in Different Water Bodies Estonian Marine Institute,
Instrument to measure the bidirectional reflectance distribution function of surfaces
 Instrument to measure the bidirectional reflectance distribution function of surfaces Kenneth J. Voss, Albert Chapin, Marco Monti, and Hao Zhang A new instrument to measure the in situ bidirectional reflectance
Monte-Carlo modeling used to simulate propagation of photons in a medium
 Monte-Carlo modeling used to simulate propagation of photons in a medium Nils Haëntjens Ocean Optics Class 2017 based on lectures from Emmanuel Boss and Edouard Leymarie What is Monte Carlo Modeling? Monte
Polarized radiance distribution measurements of skylight. I. System description and characterization
 Polarized radiance distribution measurements of skylight. I. System description and characterization Kenneth J. Voss and Yi Liu A new system to measure the natural skylight polarized radiance distribution
The influence of coherent waves on the remotely sensed reflectance
 The influence of coherent waves on the remotely sensed reflectance J. Ronald V. Zaneveld and Emmanuel Boss College of Ocean and Atmospheric Sciences, Oregon State University, Corvallis OR 97330 zaneveld@oce.orst.edu,
Uncertainties in the Products of Ocean-Colour Remote Sensing
 Chapter 3 Uncertainties in the Products of Ocean-Colour Remote Sensing Emmanuel Boss and Stephane Maritorena Data products retrieved from the inversion of in situ or remotely sensed oceancolour data are
Continued Development of the Look-up-table (LUT) Methodology For Interpretation of Remotely Sensed Ocean Color Data
 Methodology For Interpretation of Remotely Sensed Ocean Color Data") Continued Development of the Look-up-table (LUT) Methodology For Interpretation of Remotely Sensed Ocean Color Data Curtis D. Mobley Sequoia Scientific, Inc. 2700 Richards Road, Suite 107 Bellevue, WA
Continued Development of the Look-up-table (LUT) Methodology For Interpretation of Remotely Sensed Ocean Color Data Curtis D. Mobley Sequoia Scientific, Inc. 2700 Richards Road, Suite 107 Bellevue, WA
Radiance, Irradiance and Reflectance
 CEE 6100 Remote Sensing Fundamentals 1 Radiance, Irradiance and Reflectance When making field optical measurements we are generally interested in reflectance, a relative measurement. At a minimum, measurements
Polarimetric Effects in Non-polarimetric Imaging Russel P. Kauffman* 1a and Michael Gartley b
 Polarimetric Effects in Non-polarimetric Imaging Russel P. Kauffman* 1a and Michael Gartley b a Lockheed Martin Information Systems and Global Services, P.O. Box 8048, Philadelphia PA, 19101; b Digital
COMPONENTS OF REMOTE SENSING REFLECTANCE OF NORTHERN BALTIC NATURAL WATER BASINS
 COMPONENTS OF REMOTE SENSING REFLECTANCE OF NORTHERN BALTIC NATURAL WATER BASINS Helgi Arst, and Vladimir I. Haltrin Estonian Marine Institute, 1 Paldiski Road, Tallinn, Estonia, 1137 e-mail: helarst@online.ee
Spectral Extinction Coefficient measurements of inland waters
 Spectral Extinction Coefficient measurements of inland waters M. Potes, M. J. Costa, R. Salgado and P. Le Moigne Évora Geophysics Centre, PORTUGAL CNRM/GMME/MOSAYC Météo-France, FRANCE Third Workshop on
Theoretical derivation of the depth average of remotely sensed optical parameters
 Theoretical derivation of the depth average of remotely sensed optical parameters J. Ronald V. Zaneveld 1, Andrew H. Barnard 1 and Emmanuel Boss 2 1 WET Labs, Inc. P.O. Box 518, 62 Applegate Street, Philomath,
Ambien Occlusion. Lighting: Ambient Light Sources. Lighting: Ambient Light Sources. Summary
 Summary Ambien Occlusion Kadi Bouatouch IRISA Email: kadi@irisa.fr 1. Lighting 2. Definition 3. Computing the ambient occlusion 4. Ambient occlusion fields 5. Dynamic ambient occlusion 1 2 Lighting: Ambient
ENHANCEMENT OF DIFFUSERS BRDF ACCURACY
 ENHANCEMENT OF DIFFUSERS BRDF ACCURACY Grégory Bazalgette Courrèges-Lacoste (1), Hedser van Brug (1) and Gerard Otter (1) (1) TNO Science and Industry, Opto-Mechanical Instrumentation Space, P.O.Box 155,
An empirical algorithm to estimate spectral average cosine of underwater light field from remote sensing data in coastal oceanic waters
 Author version: Limnol. Oceanogr-Meth., vol.12; 2014; 74 85 An empirical algorithm to estimate spectral average cosine of underwater light field from remote sensing data in coastal oceanic waters Madhubala
Geometrical modeling of light scattering from paper substrates
 Geometrical modeling of light scattering from paper substrates Peter Hansson Department of Engineering ciences The Ångström Laboratory, Uppsala University Box 534, E-75 Uppsala, weden Abstract A light
Ocean Optics Inversion Algorithm
 Ocean Optics Inversion Algorithm N. J. McCormick 1 and Eric Rehm 2 1 University of Washington Department of Mechanical Engineering Seattle, WA 98195-26 mccor@u.washington.edu 2 University of Washington
Hyperspectral remote sensing for shallow waters: 2. Deriving bottom depths and water properties by optimization
 Hyperspectral remote sensing for shallow waters: 2. Deriving bottom depths and water properties by optimization Zhongping Lee, Kendall L. Carder, Curtis D. Mobley, Robert G. Steward, and Jennifer S. Patch
Self-shading correction for upwelling sea-surface radiance measurements made with buoyed instruments
 Self-shading correction for upwelling sea-surface radiance measurements made with buoyed instruments Robert A. Leathers, T. Valerie Downes Naval Research Laboratory, Code 7212 4555 Overlook Ave. SW, Washington,
Continued Development of the Look-up-table (LUT) Methodology For Interpretation of Remotely Sensed Ocean Color Data
 Methodology For Interpretation of Remotely Sensed Ocean Color Data") Continued Development of the Look-up-table (LUT) Methodology For Interpretation of Remotely Sensed Ocean Color Data W. Paul Bissett Florida Environmental Research Institute 10500 University Center Dr.,
Continued Development of the Look-up-table (LUT) Methodology For Interpretation of Remotely Sensed Ocean Color Data W. Paul Bissett Florida Environmental Research Institute 10500 University Center Dr.,
BOUSSOLE DATA PROCESSING
 BOUSSOLE DATA PROCESSING D. Antoine, B. Gentili, E. Leymarie V. Vellucci OUTLINE OUTLINE > Preprocessing conversion to physical units dark subtraction data reduction > Processing conversion to physical
Active Camouflage of Underwater Assets (ACUA)
") Active Camouflage of Underwater Assets (ACUA) Kendall L. Carder University of South Florida, College of Marine Science 140 7 th Avenue South, St. Petersburg, FL 33701 phone: 727-553-3952 fax 727-553-3918
Active Camouflage of Underwater Assets (ACUA) Kendall L. Carder University of South Florida, College of Marine Science 140 7 th Avenue South, St. Petersburg, FL 33701 phone: 727-553-3952 fax 727-553-3918
E (sensor) is given by; Object Size
 is given by; Object Size") A P P L I C A T I O N N O T E S Practical Radiometry It is often necessary to estimate the response of a camera under given lighting conditions, or perhaps to estimate lighting requirements for a particular
A P P L I C A T I O N N O T E S Practical Radiometry It is often necessary to estimate the response of a camera under given lighting conditions, or perhaps to estimate lighting requirements for a particular
Use of the Polarized Radiance Distribution Camera System in the RADYO Program
 Use of the Polarized Radiance Distribution Camera System in the RADYO Program Kenneth J. Voss Physics Department, University of Miami Coral Gables, Fl. 33124 phone: (305) 284-2323 ext 2 fax: (305) 284-4222
Inversion of irradiance and remote sensing reflectance in shallow water between 400 and 800 nm for calculations of water and bottom properties
 Inversion of irradiance and remote sensing reflectance in shallow water between 400 and 800 nm for calculations of water and bottom properties Andreas Albert and Peter Gege What we believe to be a new
Estimating oceanic primary production using. vertical irradiance and chlorophyll profiles. from ocean gliders in the North Atlantic
 Estimating oceanic primary production using vertical irradiance and chlorophyll profiles from ocean gliders in the North Atlantic Victoria S. Hemsley* 1,2, Timothy J. Smyth 3, Adrian P. Martin 2, Eleanor
Understanding Variability
 Understanding Variability Why so different? Light and Optics Pinhole camera model Perspective projection Thin lens model Fundamental equation Distortion: spherical & chromatic aberration, radial distortion
Polarization of the Radiation Reflected and Transmitted by the Earth's Atmosphere
 Polarization of the Radiation Reflected and Transmitted by the Earth's Atmosphere G. N. Plass and G. W. Kattawar The polarization of the reflected and transmitted radiation is calculated for a realistic
SEA BOTTOM MAPPING FROM ALOS AVNIR-2 AND QUICKBIRD SATELLITE DATA
 SEA BOTTOM MAPPING FROM ALOS AVNIR-2 AND QUICKBIRD SATELLITE DATA Mohd Ibrahim Seeni Mohd, Nurul Nadiah Yahya, Samsudin Ahmad Faculty of Geoinformation and Real Estate, Universiti Teknologi Malaysia, 81310
Surface and thickness profile measurement of a transparent film by three-wavelength vertical scanning interferometry
 Surface and thickness profile measurement of a transparent film by three-wavelength vertical scanning interferometry Katsuichi Kitagawa Toray Engineering Co. Ltd., 1-1-45 Oe, Otsu 50-141, Japan Corresponding
Sections 3-6 have been substantially modified to make the paper more comprehensible. Several figures have been re-plotted and figure captions changed.
 Response to First Referee s Comments General Comments Sections 3-6 have been substantially modified to make the paper more comprehensible. Several figures have been re-plotted and figure captions changed.
A Look-up-Table Approach to Inverting Remotely Sensed Ocean Color Data
 A Look-up-Table Approach to Inverting Remotely Sensed Ocean Color Data Curtis D. Mobley Sequoia Scientific, Inc. Westpark Technical Center 15317 NE 90th Street Redmond, WA 98052 phone: 425-867-2464 x 109
Optical model for use in oceanic ecosystem models
 Optical model for use in oceanic ecosystem models Cheng-Chien Liu, John D. Woods, and Curtis D. Mobley Modeling the plankton ecosystem requires a code for simulating the profile of irradiance from the
POLRADS: polarization radiance distribution measurement system
 POLRADS: polarization radiance distribution measurement system Kenneth J. Voss, 1,* and Nordine Souaidia, 1,2 1 Physics Department, University of Miami, 1320 Campo Sano Drive, Coral Gables, Florida, 33146,
Class 11 Introduction to Surface BRDF and Atmospheric Scattering. Class 12/13 - Measurements of Surface BRDF and Atmospheric Scattering
 University of Maryland Baltimore County - UMBC Phys650 - Special Topics in Experimental Atmospheric Physics (Spring 2009) J. V. Martins and M. H. Tabacniks http://userpages.umbc.edu/~martins/phys650/ Class
Shallow-water Remote Sensing: Lecture 1: Overview
 Shallow-water Remote Sensing: Lecture 1: Overview Curtis Mobley Vice President for Science and Senior Scientist Sequoia Scientific, Inc. Bellevue, WA 98005 curtis.mobley@sequoiasci.com IOCCG Course Villefranche-sur-Mer,
Radiometry and reflectance
 Radiometry and reflectance http://graphics.cs.cmu.edu/courses/15-463 15-463, 15-663, 15-862 Computational Photography Fall 2018, Lecture 16 Course announcements Homework 4 is still ongoing - Any questions?
Mode-Field Diameter and Spot Size Measurements of Lensed and Tapered Specialty Fibers
 Mode-Field Diameter and Spot Size Measurements of Lensed and Tapered Specialty Fibers By Jeffrey L. Guttman, Ph.D., Director of Engineering, Ophir-Spiricon Abstract: The Mode-Field Diameter (MFD) and spot
CMSC427 Shading Intro. Credit: slides from Dr. Zwicker
 CMSC427 Shading Intro Credit: slides from Dr. Zwicker 2 Today Shading Introduction Radiometry & BRDFs Local shading models Light sources Shading strategies Shading Compute interaction of light with surfaces
Menghua Wang NOAA/NESDIS/STAR Camp Springs, MD 20746, USA
 Ocean EDR Product Calibration and Validation Plan Progress Report: VIIRS Ocean Color Algorithm Evaluations and Data Processing and Analyses Define a VIIRS Proxy Data Stream Define the required in situ
MODULE 3. FACTORS AFFECTING 3D LASER SCANNING
 MODULE 3. FACTORS AFFECTING 3D LASER SCANNING Learning Outcomes: This module discusses factors affecting 3D laser scanner performance. Students should be able to explain the impact of various factors on
EcoLight-S 1.0 Users Guide and Technical Documentation
 EcoLight-S 1.0 Users Guide and Technical Documentation Curtis D. Mobley Sequoia Scientific, Inc. 2700 Richards Road, Suite 109 Bellevue, WA 98005 curtis.mobley@sequoiasci.com 425-641-0944 x 109 First Printing,
Attenuation of visible solar radiation in the upper water column: A model based on IOPs
 Attenuation of visible solar radiation in the upper water column: A model based on IOPs ZhongPing Lee, KePing Du 2, Robert Arnone, SooChin Liew 3, Bradley Penta Naval Research Laboratory Code 7333 Stennis
CS 5625 Lec 2: Shading Models
 CS 5625 Lec 2: Shading Models Kavita Bala Spring 2013 Shading Models Chapter 7 Next few weeks Textures Graphics Pipeline Light Emission To compute images What are the light sources? Light Propagation Fog/Clear?
Diffraction and Interference
 Diffraction and Interference Kyle Weigand, Mark Hillstrom Abstract: We measure the patterns produced by a CW laser near 650 nm passing through one and two slit apertures with a detector mounted on a linear
The variation of the polarized downwelling radiance distribution with depth in the coastal and clear ocean
 JOURNAL OF GEOPHYSICAL RESEARCH, VOL. 116,, doi:10.1029/2011jc007320, 2011 The variation of the polarized downwelling radiance distribution with depth in the coastal and clear ocean Purushottam Bhandari,
A Survey of Modelling and Rendering of the Earth s Atmosphere
 Spring Conference on Computer Graphics 00 A Survey of Modelling and Rendering of the Earth s Atmosphere Jaroslav Sloup Department of Computer Science and Engineering Czech Technical University in Prague
Quantifying the Dynamic Ocean Surface Using Underwater Radiometric Measurement
 DISTRIBUTION STATEMENT A. Approved for public release; distribution is unlimited. Quantifying the Dynamic Ocean Surface Using Underwater Radiometric Measurement Lian Shen Department of Mechanical Engineering
Improvements to the SHDOM Radiative Transfer Modeling Package
 Improvements to the SHDOM Radiative Transfer Modeling Package K. F. Evans University of Colorado Boulder, Colorado W. J. Wiscombe National Aeronautics and Space Administration Goddard Space Flight Center
Coupling of surface roughness to the performance of computer-generated holograms
 Coupling of surface roughness to the performance of computer-generated holograms Ping Zhou* and Jim Burge College of Optical Sciences, University of Arizona, Tucson, Arizona 85721, USA *Corresponding author:
Use of a laser beam with an oblique angle of incidence to measure the reduced scattering coefficient of a turbid medium
 Use of a laser beam with an oblique angle of incidence to measure the reduced scattering coefficient of a turbid medium Lihong Wang and Steven L. Jacques A simple and quick approach is used to measure
CRISM (Compact Reconnaissance Imaging Spectrometer for Mars) on MRO. Calibration Upgrade, version 2 to 3
 on MRO. Calibration Upgrade, version 2 to 3") CRISM (Compact Reconnaissance Imaging Spectrometer for Mars) on MRO Calibration Upgrade, version 2 to 3 Dave Humm Applied Physics Laboratory, Laurel, MD 20723 18 March 2012 1 Calibration Overview 2 Simplified
CRISM (Compact Reconnaissance Imaging Spectrometer for Mars) on MRO Calibration Upgrade, version 2 to 3 Dave Humm Applied Physics Laboratory, Laurel, MD 20723 18 March 2012 1 Calibration Overview 2 Simplified
CLEAR VISION ON TURBID WATER: THE NAIVASHA LAKE
 CLEAR VISION ON TURBID WATER: THE NAIVASHA LAKE M.S. Salama S.SALAMA@UTWNTE.NL June 13-14, 2013 Outlines Study Area The problem Objectives Field data Hydro optical models Empirical: CDOM, Chl-a and KD
ACCURATE TEXTURE MEASUREMENTS ON THIN FILMS USING A POWDER X-RAY DIFFRACTOMETER
 ACCURATE TEXTURE MEASUREMENTS ON THIN FILMS USING A POWDER X-RAY DIFFRACTOMETER MARK D. VAUDIN NIST, Gaithersburg, MD, USA. Abstract A fast and accurate method that uses a conventional powder x-ray diffractometer
Influence of surface waves on measured and modeled irradiance profiles
 Influence of surface waves on measured and modeled irradiance profiles J. Ronald V. Zaneveld, Emmanuel Boss, and Andrew Barnard Classical radiative transfer programs are based on the plane-parallel assumption.
Simulation of Diffuse Optical Tomography using COMSOL Multiphysics
 Simulation of Diffuse Optical Tomography using COMSOL Multiphysics SAM Kirmani *1 L Velmanickam 1 D Nawarathna 1 SS Sherif 2 and IT Lima Jr 1 1 Department of Electrical and Computer Engineering North Dakota
SPECTRAL APPROACH TO CALCULATE SPECULAR REFLECTION OF LIGHT FROM WAVY WATER SURFACE
 in Optics of Natural Waters (ONW 1), St. Petersburg, Russia, 1. SPECTRAL APPROACH TO CALCULATE SPECULAR REFLECTION OF LIGHT FROM WAVY WATER SURFACE V. I. Haltrin, W. E. McBride III, and R. A. Arnone Naval
Topic 9: Lighting & Reflection models 9/10/2016. Spot the differences. Terminology. Two Components of Illumination. Ambient Light Source
 Topic 9: Lighting & Reflection models Lighting & reflection The Phong reflection model diffuse component ambient component specular component Spot the differences Terminology Illumination The transport
Photometric Stereo.
 Photometric Stereo Photometric Stereo v.s.. Structure from Shading [1] Photometric stereo is a technique in computer vision for estimating the surface normals of objects by observing that object under
RAPID HYDROLOGIC MEASUREMENTS OF UNDERWATER ANGULAR DISTRIBUTION OF LIGHT*
 RAPID HYDROLOGIC MEASUREMENTS OF UNDERWATER ANGULAR DISTRIBUTION OF LIGHT* Vladimir I. Haltrin, Michael E. Lee, and Oleg V. Martynov Naval Research Laboratory, Ocean Sciences Branch, Code 7331 Stennis
This paper describes an analytical approach to the parametric analysis of target/decoy
 Parametric analysis of target/decoy performance1 John P. Kerekes Lincoln Laboratory, Massachusetts Institute of Technology 244 Wood Street Lexington, Massachusetts 02173 ABSTRACT As infrared sensing technology
Radiometry & BRDFs CS295, Spring 2017 Shuang Zhao
 Radiometry & BRDFs CS295, Spring 2017 Shuang Zhao Computer Science Department University of California, Irvine CS295, Spring 2017 Shuang Zhao 1 Today s Lecture Radiometry Physics of light BRDFs How materials
Measuring Light: Radiometry and Cameras
 Lecture 11: Measuring Light: Radiometry and Cameras Computer Graphics CMU 15-462/15-662, Fall 2015 Slides credit: a majority of these slides were created by Matt Pharr and Pat Hanrahan Simulating a pinhole