Multiple imputation using chained equations: Issues and guidance for practice
|
|
|
- Edwina Baldwin
- 5 years ago
- Views:
Transcription
1 Multiple imputation using chained equations: Issues and guidance for practice Ian R. White, Patrick Royston and Angela M. Wood By Gabrielle Simoneau
2 Missing data Inadequate handling of the missing data in a statistical analysis can lead to biased and/or inefficient estimates of parameters such as means or regression coefficients, and biased standard errors resulting in incorrect confidence intervals and significance tests. (i) (ii) Missing completely at random (MCAR) Missing at random (MAR) (iii) Missing not at random (MNAR) Key concept of Multiple Imputation (MI): use the distribution of the observed data to estimate a set of plausible values for the missing data.
3 Three stages of MI Stage 1: Generating multiply imputed data sets ORIGINAL DATASET ID x1 x2 z 1 z z 3 Fit model z ~ βx, using individuals with observed z β-hat,v-hat Repeat following steps m times: ü Draw β * from MVN(β-hat,V-hat) ü Draw imputations for z from the posterior distribution of z using β * IMPUTED DATASET 1 ID x1 x2 z IMPUTED DATASET 2 ID x1 x2 z IMPUTED DATASET m ID x1 x2 z 1 z 1 2 z* 21 3 z 3 1 z 1 2 z* 22 3 z 3 1 z 1 2 z* 2m 3 z 3
4 Three stages of MI Stage 2: Analyzing multiply imputed data sets For each imputed data set, estimate whatever parameters of interest (e.g. regression coefficients) and its estimated variability IMPUTED DATASET 1 ID x1 x2 z IMPUTED DATASET 2 ID x1 x2 z IMPUTED DATASET m ID x1 x2 z 1 z 1 2 z* 21 3 z 3 1 z 1 2 z* 22 3 z 3 1 z 1 2 z* 2m 3 z 3
5 Three stages of MI Stage 3: Combining estimates from multiply imputed data sets Combine the m estimates obtained from stage 2 into an overall estimate and covariance matrix using Rubin s rule. Overall estimate: Within-imputation variance: Between-imputation variance: Variance:
6 MICE MICE: Multiple Imputation by Chained Equations For common situation where missing values occur in several variables Impute x 1 using individuals with observed x 1 Impute x 2 using individual with observed x 2 and imputed values of x 1 Impute x k using individual with observed x k and imputed values of x 1, x 2,,x k-1 This is a cycle. Repeat times to generate one imputed data set. Repeat cycle m times to generate m imputed dataset
7 Objective How to impute missing values in Normally distributed and categorical variables UK700 data and MICE algorithm How to impute missing values in skewed distributions How to choose variables in the imputation model How to specify the form of the imputation model How to choose m, the number of imputations How to use multiply imputed data for extended statistical analysis Illustration using UK700 data Discussion on theoretical limitations and pitfalls of MICE
8 Continuous and Categorical variables Continuous Normally distributed variables ü Linear Regression Binary variables ü Logistic Regression Unordered categorical variables ü Multinomial Logistic Regression Ordered categorical variables ü Proportional Odds Model Useful R functions: lm() rchisq() rnorm() chol() glm() library(mvtnorm) rmvnorm() runif() library(mlogit) mlogit() library(vgam) vglm()
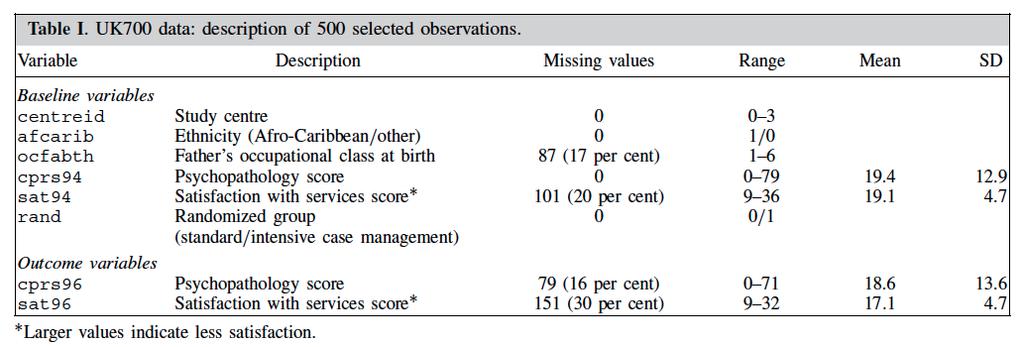
9 Illustrative data: UK700 trial Four centres Participants aged between yrs Diagnosed with psychotic illness and two or more psychiatric hospital admission, the most recent within the previous 2 years 708 participants assigned to 2 groups: ü Standard case management (case load of patients) ü Intensive case management (case load of patients) Objective: explore the effect of the intervention (type of case management) on satisfaction with services after two years of follow up, accounting for level of satisfaction at baseline
10 MICE algorithm: halfway in Stage 1 of MI
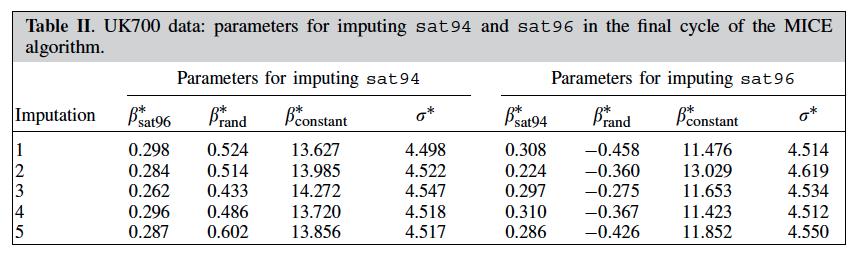
11 MICE algorithm: end of Stage 1, m = 5 imputed data sets
12 Figure 1. UK700 data: observed and imputed values for sat94 (satisfaction at baseline) and sat96 (outcome: satisfaction after two years of follow up)
13 Skewed continuous variables Two possible approaches: Transformation or Predictive mean matching 1. Transformation z is non-normal, apply a monotonic transformation f (.) such that the marginal distribution f (z) is approximately Normal Imputed values of f (z), then back-transformed to the original scale Suggested transformations: ü ü ü Box-Cox transformation (boxcox(), MASS library) Shifted-log transformation (Johnson library) Two-parameter transformations: Johnson S U family, modulus-exponential- Normal (MEN), modulus-power-normal (MPN)
14 Skewed continuous variables 2. Predictive mean matching Imputed values are sampled only from the observed values of z The distribution of imputed values closely matches that of the observed z Repeat stage 1 from standard MI procedure ü Regress z ~ βx ü Draw β * from MVN(β-hat,V-hat) WRONG MODEL!! Identify q individuals with closest predicted values ü Calculate predicted value for individual i with missing z i.e. β * x i ü Calculate predicted value for all individual h with observed z i.e. β * x h ü β * x i - β * x h Select imputed z ü The imputed value is an observed value of z randomly selected from those q individuals

15
16 Imputation model: variable selection Include the covariates and outcome from the analysis model ü Omitting the outcome would make the incomplete variable uncorrelated with the outcome in individuals with imputed variable ü Guidance for survival data Include predictors of the incomplete variable ü To make the MAR assumption more plausible ü Include all variables that both predicts the incomplete variable and predicts whether the incomplete variable is missing ü Data-driven decisions are ok to select variables to include in the imputation model
17 Imputation model form Not just a variable selection problem, but also determining the correct functional form and interactions that are required Passive approach ü Need z 2? Impute z and square the imputed values Congenial imputation model??? JAV: just another variable ü Ignore that z 2 is defined the square of z Interactions?
18 How many imputations? Standard recommendation: m = 3 or 5, based of efficiency of the estimates Fraction of missing information (FMI) = B/(W+B) ICC ü B = between-imputation variability ü W = within-imputation variability Reproducibility argument, based not only on efficiency of the estimates, but also on other statistics computed using the imputed data sets Rule of thumbs: m 100 FMI ü Approximate FMI by percentage of incomplete cases ü Take m slightly bigger


19 Analysis of imputed data (stage 2) Exclude individuals with missing outcome in the analysis of imputed data ü Only add noise to the estimates

20 Analysis of imputed data (stage 3) Can t combine any estimate with Rubin s rule ü Recall at stage 3
21 Analysis of imputed data (stage 2 and 3) Model building and model criticism Hypothesis testing ü Combine likelihood ratio test (large number of parameters prefereble with complete case ) vs. Wald test Variable selection ü Analyze all imputed data sets as one large data, weighted analysis to select variables Selection of non-linear and interaction terms ü If a non-linear term is in the analysis model, then it also need to be in the imputation model juggle with analysis and imputation model Predictions ü Compute predictions within each imputed dataset, possible to combine over all data sets Model checking ü Within each imputed dataset

22 UK700 illustrative example Model (if no missing data): sat96 ~ rand + sat94 + Icentre*cprs94 Need to impute missing values: sat94, sat96, crps96 (auxiliary) sat94: impute centrespecific means i.e. replace missing values by sat94 mean in corresponding centre Imputation of the outcome sat96 ü Separately by randomization group

23 UK700 illustrative example Far left boxplot shows the distribution of the observed outcome sat96 Each other boxplot shows the distribution of the imputed outcome across the m=30 imputed data sets
24 UK700 illustrative example Monte-Carlo standard error reasonably small
25 Limitations and pitfalls in MICE Lack of theoretical basis ü Justification of the MICE procedure rested on empirical results ü Results might depend on the order of imputation/which variable was imputed last Omitting the outcome in the imputation biases the coefficient of the incomplete variable towards the null Perfect predictions Departure from MAR assumption ü Include many variables in the imputation model Non-convergence of the cycles Checking the imputation models Regular modeling issues (too many variables, functional form) ü Careful exploration of the data in the first place
Missing Data and Imputation
 Missing Data and Imputation NINA ORWITZ OCTOBER 30 TH, 2017 Outline Types of missing data Simple methods for dealing with missing data Single and multiple imputation R example Missing data is a complex
in this course) ˆ Y =time to event, follow-up curtailed: covered under ˆ Missing at random (MAR) a
 ˆ Y =time to event, follow-up curtailed: covered under ˆ Missing at random (MAR) a") Chapter 3 Missing Data 3.1 Types of Missing Data ˆ Missing completely at random (MCAR) ˆ Missing at random (MAR) a ˆ Informative missing (non-ignorable non-response) See 1, 38, 59 for an introduction to
Chapter 3 Missing Data 3.1 Types of Missing Data ˆ Missing completely at random (MCAR) ˆ Missing at random (MAR) a ˆ Informative missing (non-ignorable non-response) See 1, 38, 59 for an introduction to
Missing Data: What Are You Missing?
 Missing Data: What Are You Missing? Craig D. Newgard, MD, MPH Jason S. Haukoos, MD, MS Roger J. Lewis, MD, PhD Society for Academic Emergency Medicine Annual Meeting San Francisco, CA May 006 INTRODUCTION
CHAPTER 1 INTRODUCTION
 Introduction CHAPTER 1 INTRODUCTION Mplus is a statistical modeling program that provides researchers with a flexible tool to analyze their data. Mplus offers researchers a wide choice of models, estimators,
Missing Data Missing Data Methods in ML Multiple Imputation
 Missing Data Missing Data Methods in ML Multiple Imputation PRE 905: Multivariate Analysis Lecture 11: April 22, 2014 PRE 905: Lecture 11 Missing Data Methods Today s Lecture The basics of missing data:
Missing Data Analysis for the Employee Dataset
 Missing Data Analysis for the Employee Dataset 67% of the observations have missing values! Modeling Setup Random Variables: Y i =(Y i1,...,y ip ) 0 =(Y i,obs, Y i,miss ) 0 R i =(R i1,...,r ip ) 0 ( 1
Multiple-imputation analysis using Stata s mi command
 Multiple-imputation analysis using Stata s mi command Yulia Marchenko Senior Statistician StataCorp LP 2009 UK Stata Users Group Meeting Yulia Marchenko (StataCorp) Multiple-imputation analysis using mi
Generalized least squares (GLS) estimates of the level-2 coefficients,
 estimates of the level-2 coefficients,") Contents 1 Conceptual and Statistical Background for Two-Level Models...7 1.1 The general two-level model... 7 1.1.1 Level-1 model... 8 1.1.2 Level-2 model... 8 1.2 Parameter estimation... 9 1.3 Empirical
Contents 1 Conceptual and Statistical Background for Two-Level Models...7 1.1 The general two-level model... 7 1.1.1 Level-1 model... 8 1.1.2 Level-2 model... 8 1.2 Parameter estimation... 9 1.3 Empirical
CHAPTER 7 EXAMPLES: MIXTURE MODELING WITH CROSS- SECTIONAL DATA
 Examples: Mixture Modeling With Cross-Sectional Data CHAPTER 7 EXAMPLES: MIXTURE MODELING WITH CROSS- SECTIONAL DATA Mixture modeling refers to modeling with categorical latent variables that represent
Missing Data. Where did it go?
 Missing Data Where did it go? 1 Learning Objectives High-level discussion of some techniques Identify type of missingness Single vs Multiple Imputation My favourite technique 2 Problem Uh data are missing
Multiple Imputation for Missing Data. Benjamin Cooper, MPH Public Health Data & Training Center Institute for Public Health
 Multiple Imputation for Missing Data Benjamin Cooper, MPH Public Health Data & Training Center Institute for Public Health Outline Missing data mechanisms What is Multiple Imputation? Software Options
MODEL SELECTION AND MODEL AVERAGING IN THE PRESENCE OF MISSING VALUES
 UNIVERSITY OF GLASGOW MODEL SELECTION AND MODEL AVERAGING IN THE PRESENCE OF MISSING VALUES by KHUNESWARI GOPAL PILLAY A thesis submitted in partial fulfillment for the degree of Doctor of Philosophy in
Opening Windows into the Black Box
 Opening Windows into the Black Box Yu-Sung Su, Andrew Gelman, Jennifer Hill and Masanao Yajima Columbia University, Columbia University, New York University and University of California at Los Angels July
Package smcfcs. March 30, 2019
 Package smcfcs March 30, 2019 Title Multiple Imputation of Covariates by Substantive Model Compatible Fully Conditional Specification Version 1.4.0 URL http://www.missingdata.org.uk, http://thestatsgeek.com
Handling Data with Three Types of Missing Values:
 Handling Data with Three Types of Missing Values: A Simulation Study Jennifer Boyko Advisor: Ofer Harel Department of Statistics University of Connecticut Storrs, CT May 21, 2013 Jennifer Boyko Handling
CHAPTER 11 EXAMPLES: MISSING DATA MODELING AND BAYESIAN ANALYSIS
 Examples: Missing Data Modeling And Bayesian Analysis CHAPTER 11 EXAMPLES: MISSING DATA MODELING AND BAYESIAN ANALYSIS Mplus provides estimation of models with missing data using both frequentist and Bayesian
GAMs semi-parametric GLMs. Simon Wood Mathematical Sciences, University of Bath, U.K.
 GAMs semi-parametric GLMs Simon Wood Mathematical Sciences, University of Bath, U.K. Generalized linear models, GLM 1. A GLM models a univariate response, y i as g{e(y i )} = X i β where y i Exponential
Correctly Compute Complex Samples Statistics
 PASW Complex Samples 17.0 Specifications Correctly Compute Complex Samples Statistics When you conduct sample surveys, use a statistics package dedicated to producing correct estimates for complex sample
Missing Data Analysis with SPSS
 Missing Data Analysis with SPSS Meng-Ting Lo (lo.194@osu.edu) Department of Educational Studies Quantitative Research, Evaluation and Measurement Program (QREM) Research Methodology Center (RMC) Outline
Correctly Compute Complex Samples Statistics
 SPSS Complex Samples 15.0 Specifications Correctly Compute Complex Samples Statistics When you conduct sample surveys, use a statistics package dedicated to producing correct estimates for complex sample
Missing Data Analysis for the Employee Dataset
 Missing Data Analysis for the Employee Dataset 67% of the observations have missing values! Modeling Setup For our analysis goals we would like to do: Y X N (X, 2 I) and then interpret the coefficients
Standard Errors in OLS Luke Sonnet
 Standard Errors in OLS Luke Sonnet Contents Variance-Covariance of ˆβ 1 Standard Estimation (Spherical Errors) 2 Robust Estimation (Heteroskedasticity Constistent Errors) 4 Cluster Robust Estimation 7
Ronald H. Heck 1 EDEP 606 (F2015): Multivariate Methods rev. November 16, 2015 The University of Hawai i at Mānoa
: Multivariate Methods rev. November 16, 2015 The University of Hawai i at Mānoa") Ronald H. Heck 1 In this handout, we will address a number of issues regarding missing data. It is often the case that the weakest point of a study is the quality of the data that can be brought to bear
Ronald H. Heck 1 In this handout, we will address a number of issues regarding missing data. It is often the case that the weakest point of a study is the quality of the data that can be brought to bear
An Algorithm for Creating Models for Imputation Using the MICE Approach:
 An Algorithm for Creating Models for Imputation Using the MICE Approach: An application in Stata Rose Anne rosem@ats.ucla.edu Statistical Consulting Group Academic Technology Services University of California,
The Performance of Multiple Imputation for Likert-type Items with Missing Data
 Journal of Modern Applied Statistical Methods Volume 9 Issue 1 Article 8 5-1-2010 The Performance of Multiple Imputation for Likert-type Items with Missing Data Walter Leite University of Florida, Walter.Leite@coe.ufl.edu
An introduction to SPSS
 An introduction to SPSS To open the SPSS software using U of Iowa Virtual Desktop... Go to https://virtualdesktop.uiowa.edu and choose SPSS 24. Contents NOTE: Save data files in a drive that is accessible
Missing Data Techniques
 Missing Data Techniques Paul Philippe Pare Department of Sociology, UWO Centre for Population, Aging, and Health, UWO London Criminometrics (www.crimino.biz) 1 Introduction Missing data is a common problem
Types of missingness and common strategies
 9 th UK Stata Users Meeting 20 May 2003 Multiple imputation for missing data in life course studies Bianca De Stavola and Valerie McCormack (London School of Hygiene and Tropical Medicine) Motivating example
MISSING DATA AND MULTIPLE IMPUTATION
 Paper 21-2010 An Introduction to Multiple Imputation of Complex Sample Data using SAS v9.2 Patricia A. Berglund, Institute For Social Research-University of Michigan, Ann Arbor, Michigan ABSTRACT This
Missing Data. SPIDA 2012 Part 6 Mixed Models with R:
 The best solution to the missing data problem is not to have any. Stef van Buuren, developer of mice SPIDA 2012 Part 6 Mixed Models with R: Missing Data Georges Monette 1 May 2012 Email: georges@yorku.ca
Statistical Methods for the Analysis of Repeated Measurements
 Charles S. Davis Statistical Methods for the Analysis of Repeated Measurements With 20 Illustrations #j Springer Contents Preface List of Tables List of Figures v xv xxiii 1 Introduction 1 1.1 Repeated
Motivating Example. Missing Data Theory. An Introduction to Multiple Imputation and its Application. Background
 An Introduction to Multiple Imputation and its Application Craig K. Enders University of California - Los Angeles Department of Psychology cenders@psych.ucla.edu Background Work supported by Institute
Analysis of Incomplete Multivariate Data
 Analysis of Incomplete Multivariate Data J. L. Schafer Department of Statistics The Pennsylvania State University USA CHAPMAN & HALL/CRC A CR.C Press Company Boca Raton London New York Washington, D.C.
arxiv: v1 [stat.me] 29 May 2015
![arxiv: v1 [stat.me] 29 May 2015](/thumbs/74/70821629.jpg "arxiv: v1 [stat.me] 29 May 2015") MIMCA: Multiple imputation for categorical variables with multiple correspondence analysis Vincent Audigier 1, François Husson 2 and Julie Josse 2 arxiv:1505.08116v1 [stat.me] 29 May 2015 Applied Mathematics
MIMCA: Multiple imputation for categorical variables with multiple correspondence analysis Vincent Audigier 1, François Husson 2 and Julie Josse 2 arxiv:1505.08116v1 [stat.me] 29 May 2015 Applied Mathematics
Handling missing data for indicators, Susanne Rässler 1
 Handling Missing Data for Indicators Susanne Rässler Institute for Employment Research & Federal Employment Agency Nürnberg, Germany First Workshop on Indicators in the Knowledge Economy, Tübingen, 3-4
CS6375: Machine Learning Gautam Kunapuli. Mid-Term Review
 Gautam Kunapuli Machine Learning Data is identically and independently distributed Goal is to learn a function that maps to Data is generated using an unknown function Learn a hypothesis that minimizes
Amelia multiple imputation in R
 Amelia multiple imputation in R January 2018 Boriana Pratt, Princeton University 1 Missing Data Missing data can be defined by the mechanism that leads to missingness. Three main types of missing data
Hierarchical Generalized Linear Models
 Generalized Multilevel Linear Models Introduction to Multilevel Models Workshop University of Georgia: Institute for Interdisciplinary Research in Education and Human Development 07 Generalized Multilevel
Example Using Missing Data 1
 Ronald H. Heck and Lynn N. Tabata 1 Example Using Missing Data 1 Creating the Missing Data Variable (Miss) Here is a data set (achieve subset MANOVAmiss.sav) with the actual missing data on the outcomes.
SPSS QM II. SPSS Manual Quantitative methods II (7.5hp) SHORT INSTRUCTIONS BE CAREFUL
 SHORT INSTRUCTIONS BE CAREFUL") SPSS QM II SHORT INSTRUCTIONS This presentation contains only relatively short instructions on how to perform some statistical analyses in SPSS. Details around a certain function/analysis method not covered
SPSS QM II SHORT INSTRUCTIONS This presentation contains only relatively short instructions on how to perform some statistical analyses in SPSS. Details around a certain function/analysis method not covered
1 RefresheR. Figure 1.1: Soy ice cream flavor preferences
 1 RefresheR Figure 1.1: Soy ice cream flavor preferences 2 The Shape of Data Figure 2.1: Frequency distribution of number of carburetors in mtcars dataset Figure 2.2: Daily temperature measurements from
Missing Data Part II: Multiple Imputation & Maximum Likelihood
 Missing Data Part II: Multiple Imputation & Maximum Likelihood Richard Williams, University of Notre Dame, https://www3.nd.edu/~rwilliam/ Last revised February 12, 2017 Warning: I teach about Multiple
Minitab detailed
 Minitab 18.1 - detailed ------------------------------------- ADDITIVE contact sales: 06172-5905-30 or minitab@additive-net.de ADDITIVE contact Technik/ Support/ Installation: 06172-5905-20 or support@additive-net.de
Statistical modelling with missing data using multiple imputation. Session 2: Multiple Imputation
 Statistical modelling with missing data using multiple imputation Session 2: Multiple Imputation James Carpenter London School of Hygiene & Tropical Medicine Email: james.carpenter@lshtm.ac.uk www.missingdata.org.uk
Frequently Asked Questions Updated 2006 (TRIM version 3.51) PREPARING DATA & RUNNING TRIM
 PREPARING DATA & RUNNING TRIM") Frequently Asked Questions Updated 2006 (TRIM version 3.51) PREPARING DATA & RUNNING TRIM * Which directories are used for input files and output files? See menu-item "Options" and page 22 in the manual.
Frequently Asked Questions Updated 2006 (TRIM version 3.51) PREPARING DATA & RUNNING TRIM * Which directories are used for input files and output files? See menu-item "Options" and page 22 in the manual.
Computational Methods. Randomness and Monte Carlo Methods
 Computational Methods Randomness and Monte Carlo Methods Manfred Huber 2010 1 Randomness and Monte Carlo Methods Introducing randomness in an algorithm can lead to improved efficiencies Random sampling
Missing Data Part II: Multiple Imputation Richard Williams, University of Notre Dame, https://www3.nd.edu/~rwilliam/ Last revised January 24, 2015
 Missing Data Part II: Multiple Imputation Richard Williams, University of Notre Dame, https://www3.nd.edu/~rwilliam/ Last revised January 24, 2015 Warning: I teach about Multiple Imputation with some trepidation.
Missing data a data value that should have been recorded, but for some reason, was not. Simon Day: Dictionary for clinical trials, Wiley, 1999.
 2 Schafer, J. L., Graham, J. W.: (2002). Missing Data: Our View of the State of the Art. Psychological methods, 2002, Vol 7, No 2, 47 77 Rosner, B. (2005) Fundamentals of Biostatistics, 6th ed, Wiley.
Resampling Methods. Levi Waldron, CUNY School of Public Health. July 13, 2016
 Resampling Methods Levi Waldron, CUNY School of Public Health July 13, 2016 Outline and introduction Objectives: prediction or inference? Cross-validation Bootstrap Permutation Test Monte Carlo Simulation
- 1 - Fig. A5.1 Missing value analysis dialog box
 WEB APPENDIX Sarstedt, M. & Mooi, E. (2019). A concise guide to market research. The process, data, and methods using SPSS (3 rd ed.). Heidelberg: Springer. Missing Value Analysis and Multiple Imputation
Variance Estimation in Presence of Imputation: an Application to an Istat Survey Data
 Variance Estimation in Presence of Imputation: an Application to an Istat Survey Data Marco Di Zio, Stefano Falorsi, Ugo Guarnera, Orietta Luzi, Paolo Righi 1 Introduction Imputation is the commonly used
Handbook of Statistical Modeling for the Social and Behavioral Sciences
 Handbook of Statistical Modeling for the Social and Behavioral Sciences Edited by Gerhard Arminger Bergische Universität Wuppertal Wuppertal, Germany Clifford С. Clogg Late of Pennsylvania State University
HANDLING MISSING DATA
 GSO international workshop Mathematic, biostatistics and epidemiology of cancer Modeling and simulation of clinical trials Gregory GUERNEC 1, Valerie GARES 1,2 1 UMR1027 INSERM UNIVERSITY OF TOULOUSE III
SOS3003 Applied data analysis for social science Lecture note Erling Berge Department of sociology and political science NTNU.
 SOS3003 Applied data analysis for social science Lecture note 04-2009 Erling Berge Department of sociology and political science NTNU Erling Berge 2009 1 Missing data Literature Allison, Paul D 2002 Missing
REALCOM-IMPUTE: multiple imputation using MLwin. Modified September Harvey Goldstein, Centre for Multilevel Modelling, University of Bristol
 REALCOM-IMPUTE: multiple imputation using MLwin. Modified September 2014 by Harvey Goldstein, Centre for Multilevel Modelling, University of Bristol This description is divided into two sections. In the
Using the package glmbfp: a binary regression example.
 Using the package glmbfp: a binary regression example. Daniel Sabanés Bové 3rd August 2017 This short vignette shall introduce into the usage of the package glmbfp. For more information on the methodology,
Package DSBayes. February 19, 2015
 Type Package Title Bayesian subgroup analysis in clinical trials Version 1.1 Date 2013-12-28 Copyright Ravi Varadhan Package DSBayes February 19, 2015 URL http: //www.jhsph.edu/agingandhealth/people/faculty_personal_pages/varadhan.html
Predict Outcomes and Reveal Relationships in Categorical Data
 PASW Categories 18 Specifications Predict Outcomes and Reveal Relationships in Categorical Data Unleash the full potential of your data through predictive analysis, statistical learning, perceptual mapping,
Analysis of Imputation Methods for Missing Data. in AR(1) Longitudinal Dataset
 Longitudinal Dataset") Int. Journal of Math. Analysis, Vol. 5, 2011, no. 45, 2217-2227 Analysis of Imputation Methods for Missing Data in AR(1) Longitudinal Dataset Michikazu Nakai Innovation Center for Medical Redox Navigation,
Int. Journal of Math. Analysis, Vol. 5, 2011, no. 45, 2217-2227 Analysis of Imputation Methods for Missing Data in AR(1) Longitudinal Dataset Michikazu Nakai Innovation Center for Medical Redox Navigation,
Simulation Study: Introduction of Imputation. Methods for Missing Data in Longitudinal Analysis
 Applied Mathematical Sciences, Vol. 5, 2011, no. 57, 2807-2818 Simulation Study: Introduction of Imputation Methods for Missing Data in Longitudinal Analysis Michikazu Nakai Innovation Center for Medical
Package CALIBERrfimpute
 Type Package Package CALIBERrfimpute June 11, 2018 Title Multiple Imputation Using MICE and Random Forest Version 1.0-1 Date 2018-06-05 Functions to impute using Random Forest under Full Conditional Specifications
Problem set for Week 7 Linear models: Linear regression, multiple linear regression, ANOVA, ANCOVA
 ECL 290 Statistical Models in Ecology using R Problem set for Week 7 Linear models: Linear regression, multiple linear regression, ANOVA, ANCOVA Datasets in this problem set adapted from those provided
Multiple Imputation for Continuous and Categorical Data: Comparing Joint and Conditional Approaches
 Multiple Imputation for Continuous and Categorical Data: Comparing Joint and Conditional Approaches Jonathan Kropko University of Virginia Ben Goodrich Columbia University Andrew Gelman Columbia University
Journal of Statistical Software
 JSS Journal of Statistical Software December 2011, Volume 45, Issue 5. http://www.jstatsoft.org/ REALCOM-IMPUTE Software for Multilevel Multiple Imputation with Mixed Response Types James R. Carpenter
Introduction to Mplus
 Introduction to Mplus May 12, 2010 SPONSORED BY: Research Data Centre Population and Life Course Studies PLCS Interdisciplinary Development Initiative Piotr Wilk piotr.wilk@schulich.uwo.ca OVERVIEW Mplus
Minitab 17 commands Prepared by Jeffrey S. Simonoff
 Minitab 17 commands Prepared by Jeffrey S. Simonoff Data entry and manipulation To enter data by hand, click on the Worksheet window, and enter the values in as you would in any spreadsheet. To then save
Stat 5100 Handout #14.a SAS: Logistic Regression
 Stat 5100 Handout #14.a SAS: Logistic Regression Example: (Text Table 14.3) Individuals were randomly sampled within two sectors of a city, and checked for presence of disease (here, spread by mosquitoes).
I211: Information infrastructure II
 Data Mining: Classifier Evaluation I211: Information infrastructure II 3-nearest neighbor labeled data find class labels for the 4 data points 1 0 0 6 0 0 0 5 17 1.7 1 1 4 1 7.1 1 1 1 0.4 1 2 1 3.0 0 0.1
Package misclassglm. September 3, 2016
 Type Package Package misclassglm September 3, 2016 Title Computation of Generalized Linear Models with Misclassified Covariates Using Side Information Version 0.2.0 Date 2016-09-02 Author Stephan Dlugosz
Also, for all analyses, two other files are produced upon program completion.
 MIXOR for Windows Overview MIXOR is a program that provides estimates for mixed-effects ordinal (and binary) regression models. This model can be used for analysis of clustered or longitudinal (i.e., 2-level)
Performance of Sequential Imputation Method in Multilevel Applications
 Section on Survey Research Methods JSM 9 Performance of Sequential Imputation Method in Multilevel Applications Enxu Zhao, Recai M. Yucel New York State Department of Health, 8 N. Pearl St., Albany, NY
CHAPTER 18 OUTPUT, SAVEDATA, AND PLOT COMMANDS
 OUTPUT, SAVEDATA, And PLOT Commands CHAPTER 18 OUTPUT, SAVEDATA, AND PLOT COMMANDS THE OUTPUT COMMAND OUTPUT: In this chapter, the OUTPUT, SAVEDATA, and PLOT commands are discussed. The OUTPUT command
Comparative Study of Instance Based Learning and Back Propagation for Classification Problems
 Comparative Study of Instance Based Learning and Back Propagation for Classification Problems 1 Nadia Kanwal, 2 Erkan Bostanci 1 Department of Computer Science, Lahore College for Women University, Lahore,
Statistics and Data Analysis. Common Pitfalls in SAS Statistical Analysis Macros in a Mass Production Environment
 Common Pitfalls in SAS Statistical Analysis Macros in a Mass Production Environment Huei-Ling Chen, Merck & Co., Inc., Rahway, NJ Aiming Yang, Merck & Co., Inc., Rahway, NJ ABSTRACT Four pitfalls are commonly
Ludwig Fahrmeir Gerhard Tute. Statistical odelling Based on Generalized Linear Model. íecond Edition. . Springer
 Ludwig Fahrmeir Gerhard Tute Statistical odelling Based on Generalized Linear Model íecond Edition. Springer Preface to the Second Edition Preface to the First Edition List of Examples List of Figures
Zero-Inflated Poisson Regression
 Chapter 329 Zero-Inflated Poisson Regression Introduction The zero-inflated Poisson (ZIP) regression is used for count data that exhibit overdispersion and excess zeros. The data distribution combines
Lecture on Modeling Tools for Clustering & Regression
 Lecture on Modeling Tools for Clustering & Regression CS 590.21 Analysis and Modeling of Brain Networks Department of Computer Science University of Crete Data Clustering Overview Organizing data into
Risk Score Imputation tutorial (Hsu 2009)
") Risk Score Imputation tutorial (Hsu 2009) Nikolas S. Burkoff **, Paul Metcalfe *, Jonathan Bartlett * and David Ruau * * AstraZeneca, B&I, Advanced Analytics Centre, UK ** Tessella, 26 The Quadrant, Abingdon
Risk Score Imputation tutorial (Hsu 2009) Nikolas S. Burkoff **, Paul Metcalfe *, Jonathan Bartlett * and David Ruau * * AstraZeneca, B&I, Advanced Analytics Centre, UK ** Tessella, 26 The Quadrant, Abingdon
Dealing with Categorical Data Types in a Designed Experiment
 Dealing with Categorical Data Types in a Designed Experiment Part II: Sizing a Designed Experiment When Using a Binary Response Best Practice Authored by: Francisco Ortiz, PhD STAT T&E COE The goal of
Regression. Dr. G. Bharadwaja Kumar VIT Chennai
 Regression Dr. G. Bharadwaja Kumar VIT Chennai Introduction Statistical models normally specify how one set of variables, called dependent variables, functionally depend on another set of variables, called
Using Machine Learning to Optimize Storage Systems
 Using Machine Learning to Optimize Storage Systems Dr. Kiran Gunnam 1 Outline 1. Overview 2. Building Flash Models using Logistic Regression. 3. Storage Object classification 4. Storage Allocation recommendation
Epidemiological analysis PhD-course in epidemiology
 Epidemiological analysis PhD-course in epidemiology Lau Caspar Thygesen Associate professor, PhD 9. oktober 2012 Multivariate tables Agenda today Age standardization Missing data 1 2 3 4 Age standardization
Package epitab. July 4, 2018
 Type Package Package epitab July 4, 2018 Title Flexible Contingency Tables for Epidemiology Version 0.2.2 Author Stuart Lacy Maintainer Stuart Lacy Builds contingency tables that
Epidemiological analysis PhD-course in epidemiology. Lau Caspar Thygesen Associate professor, PhD 25 th February 2014
 Epidemiological analysis PhD-course in epidemiology Lau Caspar Thygesen Associate professor, PhD 25 th February 2014 Age standardization Incidence and prevalence are strongly agedependent Risks rising
MCMC Methods for data modeling
 MCMC Methods for data modeling Kenneth Scerri Department of Automatic Control and Systems Engineering Introduction 1. Symposium on Data Modelling 2. Outline: a. Definition and uses of MCMC b. MCMC algorithms
Applied Regression Modeling: A Business Approach
 i Applied Regression Modeling: A Business Approach Computer software help: SAS SAS (originally Statistical Analysis Software ) is a commercial statistical software package based on a powerful programming
WELCOME! Lecture 3 Thommy Perlinger
 Quantitative Methods II WELCOME! Lecture 3 Thommy Perlinger Program Lecture 3 Cleaning and transforming data Graphical examination of the data Missing Values Graphical examination of the data It is important
Synthetic Data. Michael Lin
 Synthetic Data Michael Lin 1 Overview The data privacy problem Imputation Synthetic data Analysis 2 Data Privacy As a data provider, how can we release data containing private information without disclosing
Estimation of Item Response Models
 Estimation of Item Response Models Lecture #5 ICPSR Item Response Theory Workshop Lecture #5: 1of 39 The Big Picture of Estimation ESTIMATOR = Maximum Likelihood; Mplus Any questions? answers Lecture #5:
Approaches to Missing Data
 Approaches to Missing Data A Presentation by Russell Barbour, Ph.D. Center for Interdisciplinary Research on AIDS (CIRA) and Eugenia Buta, Ph.D. CIRA and The Yale Center of Analytical Studies (YCAS) April
Package EBglmnet. January 30, 2016
 Type Package Package EBglmnet January 30, 2016 Title Empirical Bayesian Lasso and Elastic Net Methods for Generalized Linear Models Version 4.1 Date 2016-01-15 Author Anhui Huang, Dianting Liu Maintainer
Paper CC-016. METHODOLOGY Suppose the data structure with m missing values for the row indices i=n-m+1,,n can be re-expressed by
 Paper CC-016 A macro for nearest neighbor Lung-Chang Chien, University of North Carolina at Chapel Hill, Chapel Hill, NC Mark Weaver, Family Health International, Research Triangle Park, NC ABSTRACT SAS
R software and examples
 Handling Missing Data in R with MICE Handling Missing Data in R with MICE Why this course? Handling Missing Data in R with MICE Stef van Buuren, Methodology and Statistics, FSBS, Utrecht University Netherlands
Compute MI estimates of coefficients using previously saved estimation results
 Title mi estimate using Estimation using previously saved estimation results Syntax Compute MI estimates of coefficients using previously saved estimation results mi estimate using miestfile [, options
A Comparison of Modeling Scales in Flexible Parametric Models. Noori Akhtar-Danesh, PhD McMaster University
 A Comparison of Modeling Scales in Flexible Parametric Models Noori Akhtar-Danesh, PhD McMaster University Hamilton, Canada daneshn@mcmaster.ca Outline Backgroundg A review of splines Flexible parametric
Categorical Data in a Designed Experiment Part 2: Sizing with a Binary Response
 Categorical Data in a Designed Experiment Part 2: Sizing with a Binary Response Authored by: Francisco Ortiz, PhD Version 2: 19 July 2018 Revised 18 October 2018 The goal of the STAT COE is to assist in
Integration. Volume Estimation
 Monte Carlo Integration Lab Objective: Many important integrals cannot be evaluated symbolically because the integrand has no antiderivative. Traditional numerical integration techniques like Newton-Cotes
Multiple Imputation with Mplus
 Multiple Imputation with Mplus Tihomir Asparouhov and Bengt Muthén Version 2 September 29, 2010 1 1 Introduction Conducting multiple imputation (MI) can sometimes be quite intricate. In this note we provide
Panel Data 4: Fixed Effects vs Random Effects Models
 Panel Data 4: Fixed Effects vs Random Effects Models Richard Williams, University of Notre Dame, http://www3.nd.edu/~rwilliam/ Last revised April 4, 2017 These notes borrow very heavily, sometimes verbatim,
Theoretical Concepts of Machine Learning
 Theoretical Concepts of Machine Learning Part 2 Institute of Bioinformatics Johannes Kepler University, Linz, Austria Outline 1 Introduction 2 Generalization Error 3 Maximum Likelihood 4 Noise Models 5