Applying the Standardized Precipitation Index as a Drought Indicator
|
|
|
- Alban Wilson
- 5 years ago
- Views:
Transcription
1 Applying the Standardized Precipitation Index as a Drought Indicator Mark Svoboda, Climatologist Monitoring Program Area Leader National Drought Mitigation Center University of Nebraska-Lincoln Mali Drought Monitoring Workshop, Bamako September 14-17, 2009
2 Characteristics of the Standardized Precipitation Index (SPI) Developed by McKee et al. in 1993 Simple index--precipitation is the only parameter (probability of observed precipitation transformed into an index) Being used in research or operational mode in over 60 countries Multiple time scales allow for temporal flexibility in evaluation of precipitation conditions and water supply
3 How it Works It is NOT simply the difference of precipitation from the mean divided by the standard deviation Precipitation is normalized using a probability distribution so that values of SPI are actually seen as standard deviations from the median Normalalized distribution allows for estimating both dry and wet periods Accumulated values can be used to analyze drought severity (magnitude)
4 How it Works Need 30 years of continuous monthly precipitation data (the longer the better) SPI time scale intervals longer than 24 months may be unreliable Is spatially invariant in its interpretation Probability based (probability of observed precipitation transformed into an index) nature is well suited to risk management
5 SPI Methodology Overview: The SPI is an index based on the probability of precipitation for any time scale. Who uses it: Many drought planners appreciate the SPI s versatility. Pros: The SPI can be computed for different time scales can provide early warning of drought and help assess drought severity less complex than the Palmer. One number/has historical context Cons: Based on Precipitation only no Temp, no ET Values based on preliminary data may change.
6 SPI Methodology The SPI was designed to quantify the precipitation deficit for multiple time scales These time scales reflect the impact of drought on the availability of the different water resources Soil moisture conditions respond to precipitation anomalies on a relatively short scale. Groundwater, streamflow, and reservoir storage reflect the longer-term precipitation anomalies For these reasons, McKee et al. (1993) originally calculated the SPI for 3, 6,12, 24, and 48 month time scales.
7 SPI Methodology The SPI calculation for any location is based on the long-term precipitation record for a desired period. This long-term record is fitted to a probability distribution, which is then transformed into a normal distribution so that the mean SPI for the location and desired period is zero (Edwards and McKee, 1997) Positive SPI values indicate greater than median precipitation, and negative values indicate less than median precipitation Because the SPI is normalized, wetter and drier climates can be represented in the same way, and wet periods can also be monitored using the SPI.
8 NDMC SPI Products Updated daily for several time frames using near real time data from the ACIS data stream from the Regional Climate Centers SPI map is generated by using Grid Analysis and Display System (GrADS). The discrete station SPI data are interpolated using a Cressman objective analysis. The grid resolution is 0.4 degrees Monthly SPI archive by climate division first of its kind and now back to 1900
9 SPI data used in the U.S. Drought Monitor D0 Abnormally Dry: SPI value of -0.5 to -0.7 D1 Moderate Drought: -0.8 to -1.2 D2 Severe Drought: -1.3 to -1.5 D3 Extreme Drought: -1.6 to -1.9 D4 Exceptional Drought: -2.0 or less NDMC Daily Gridded SPI Product
10 Probability of Recurrence SPI Category # of times in 100 yrs. 0 to Mild dryness to to Moderate dryness Severe dryness < -2.0 Extreme dryness Severity of event 33 1 in 3 yrs in 10 yrs. 5 1 in 20 yrs in 50 yrs.

11

12
13


14

15
16 Correlation between the PDSI and different SPI series as a function of the time scale of the SPI Correlation (r) SPI Months
, and by 0.")
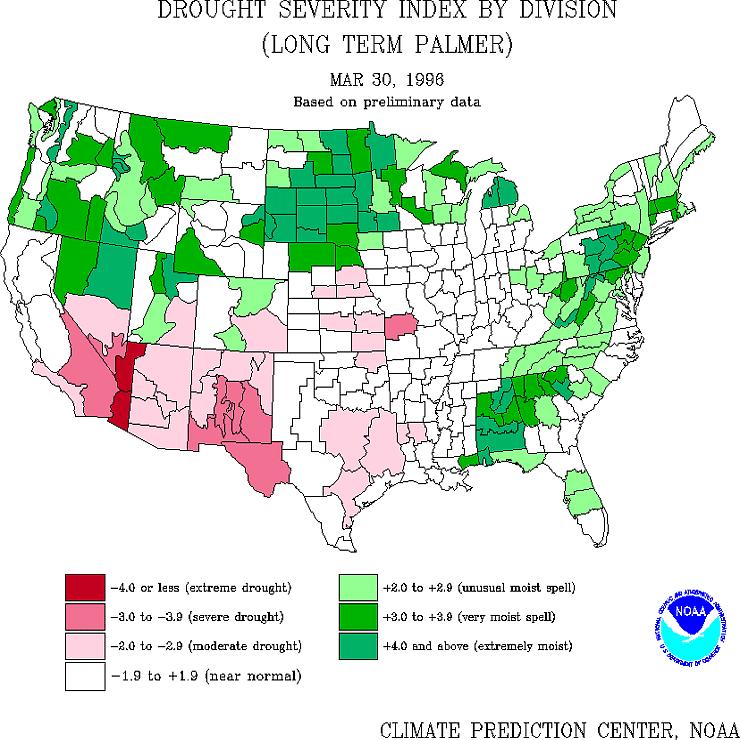
17 RESOLUTION: Standardized Precipitation Index (SPI) by Climate Division (above), and by 0.4º grid (below) Source: ACIS/HPRCC/NDMC
18 Jan-95 Jan-95 Hilo 6-Month SPI ( ) Jan-90 Jan-85 Jan-80 Jan-75 Jan-70 Jan-65 Jan-60 Jan-55 Time Hilo 12-Month SPI ( ) Jan-90 Jan-85 Jan-80 Jan-75 Jan-70 Jan-65 Jan-60 Jan-55 Time Jan Jan-50 SPI SPI

19

20

21

22

23

24
25 Using the SPI Program Monthly PC version is coded in C++ Available at the NDMC Easy to use UNIX version also available (more robust) Weekly version now available as well
26
27
28

29

30
31
32

33 Year Month SPI for Sikasso, Mali 9 Month SPI
34 Year Month SPI for Tessalit, Mali 9 Month SPI
35 A Case Study: Monitoring Drought in Hungary with the Standardized Precipitation Index A. Bussay 1, M. Hayes 2, Cs. Szinell 1, and M. Svoboda 2 1. Hungarian Meteorological Service 2. National Drought Mitigation Center, University of Nebraska-Lincoln
36 Goals of the Study One of the first applications of the SPI in Hungary and in Europe To identify the relationship of the SPI with streamflow, groundwater levels and soil moisture values To assess and compare the monitoring capabilities between the SPI and the Palmer Drought Severity Index
37 The Study Area
38 Classification Scale for SPI Values Table 1. Classification scale for SPI values (after Edwards and McKee 1996) SPI Values Category Time in Category (%) Extremely Wet to Very Wet to Moderately Wet to Near Normal to Moderately Dry to Severely Dry Extremely Dry 2.3
39 The course of 3-month SPI, 18-month SPI and PDSI during the 1983 drought in the southeast of Hungary SPI Years 3-month SPI 18-month SPI PDSI PDSI
40 The course of the 6-month SPI, 12-month SPI and water table depth during the 1983 drought in the southeast of Hungary Water table depth (cm) Years Water Table 6-month SPI 12-month SPI SPI
41 Findings The SPI and PDSI showed the strongest relationship at around 6 or 7 months Shorter time scales worked best with soil moisture and streamflow (2 to 3 months) Longer time scales worked best with groundwater levels (12 to 24 months) In all cases, the SPI captured tendencies and characteristics of these variables
42 How to get the SPI Program The free PC-based version of the SPI can be found at the NDMC: m/spi_program.htm The free UNIX version of the SPI can be found at: edprecipitation.php OR..the free weekly SPI code is also at:
43 Thank you! Questions? For SPI monthly code (PC or UNIX based), me at:
China UK, WRDMAP Integrated Water Resources Management Document Series
 1. WRA China UK, WRDMAP Integrated Water Resources Management Document Series 2. IWRM 3. Demand Management Manual 2.5: Using the Standardised Precipitation Index (SPI) to Assess Drought Condition May 2010
Use of SPI and Rainfall Deciles for Drought Assessment
 IJSRD - International Journal for Scientific Research & Development Vol. 5, Issue 02, 2017 ISSN (online): 2321-0613 Use of SPI and Rainfall Deciles for Drought Assessment I. L. Shah 1 Dr. T. M. V. Suryanarayana2
DROUGHT DETECTION AND QUANTIFICATION USING FIELD-BASED SPECTRAL MEASUREMENTS OF VEGETATION IN SEMI-ARID REGIONS
 DROUGHT DETECTION AND QUANTIFICATION USING FIELD-BASED SPECTRAL MEASUREMENTS OF VEGETATION IN SEMI-ARID REGIONS By Geoffrey Stuart Marshall Submitted in Partial Fulfillment of the Requirements for the
Manage your environmental monitoring data with power, depth and ease
 EQWin Software Inc. PO Box 75106 RPO White Rock Surrey BC V4A 0B1 Canada Tel: +1 (604) 669-5554 Fax: +1 (888) 620-7140 E-mail: support@eqwinsoftware.com www.eqwinsoftware.com EQWin 7 Manage your environmental
Using RiverWare to Support the Ongoing Bi-National Discussions for Management of the Colorado River
 Kevin Wheeler P.E. Using RiverWare to Support the Ongoing Bi-National Discussions for Management of the Colorado River Russ Callejo Purpose of Discussions Joint Cooperative Measures for Colorado River
Moving to the Web: Transition to a Web- Based Data Authoring System. Calvin Poulsen GIS Manager National Drought Mitigation Center UNL
 Moving to the Web: Transition to a Web- Based Data Authoring System Calvin Poulsen GIS Manager National Drought Mitigation Center UNL U.S. Drought Monitor Authoring What is the U.S. Drought Monitor What
Meteorological and hydrological antecedents and forecasts of Danube flood 2013
 Meteorological and hydrological antecedents and forecasts of Danube flood 2013 Hungarian Meteorological Service Hungarian Hydrological Forecasting Service Ákos HORVÁTH Head of Storm Warning Observatory
Long-term consistent grid data for temperature in Switzerland
 Federal Department of Home Affairs FDHA Federal Office of Meteorology and Climatology MeteoSwiss Long-term consistent grid data for temperature in Switzerland F. A. Isotta, M. Begert and C. Frei 10th September
Expanding Efficiency Services and Advancing Utility Program Strategies with M&V 2.0
 Expanding Efficiency Services and Advancing Utility Program Strategies with M&V 2.0 Ellen Franconi, Rocky Mountain Institute 2018 ACEEE Efficiency as a Resource November 1, 2017 Measurement & Verification
Climate Change/Extreme Weather Vulnerability Risk Assessment:
 Climate Change/Extreme Weather Vulnerability Risk Assessment: Federal Highway Administration (FHWA) Pilot Study for the Dallas-Fort Worth Region June 4, 2014 2014 TxDOT Transportation Planning Conference
Research Article Forecasting SPEI and SPI Drought Indices Using the Integrated Artificial Neural Networks
 Computational Intelligence and Neuroscience Volume 2016, Article ID 3868519, 17 pages http://dx.doi.org/10.1155/2016/3868519 Research Article Forecasting SPEI and SPI Drought Indices Using the Integrated
QUALITY CONTROL FOR UNMANNED METEOROLOGICAL STATIONS IN MALAYSIAN METEOROLOGICAL DEPARTMENT
 QUALITY CONTROL FOR UNMANNED METEOROLOGICAL STATIONS IN MALAYSIAN METEOROLOGICAL DEPARTMENT By Wan Mohd. Nazri Wan Daud Malaysian Meteorological Department, Jalan Sultan, 46667 Petaling Jaya, Selangor,
Groundwater Monitoring using Smart Sensors
 Groundwater Monitoring using Smart Sensors Srikanth Anumalla Byrav Ramamurthy Department of Computer Science and Engineering University of Nebraska-Lincoln Lincoln, Nebraska 68588-0115 Email: {anumalla,byrav}@cse.unl.edu
Map Algebra Exercise (Beginner) ArcView 9
 ArcView 9") Map Algebra Exercise (Beginner) ArcView 9 1.0 INTRODUCTION The location of the data set is eastern Africa, more specifically in Nakuru District in Kenya (see Figure 1a). The Great Rift Valley runs through
Map Algebra Exercise (Beginner) ArcView 9 1.0 INTRODUCTION The location of the data set is eastern Africa, more specifically in Nakuru District in Kenya (see Figure 1a). The Great Rift Valley runs through
Flash Flood Guidance System with Global Coverage
 Flash Flood Guidance System with Global Coverage Robert Jubach General Manager Hydrologic Research Center A Non-profit, Public Benefit Corporation http://www.hrc-lab.org Introduction Discuss a GLOBAL initiative
SEEFFG System Operational Concept
 The Republic of Turkey The Ministry of Forestry and Water Affairs SEEFFG System Operational Concept Presented by Ertan TURGU* eturgu@mgm.gov.tr Contributers: Yusuf Ulupınar* yulupinar@mgm.gov.tr Seyfullah
Anomaly Detection Solutions for Improved Equipment Availability
 Detection Solutions for Improved Equipment Availability Big Data is the enabler for Hitachi s Detection Technology Advances in ICT have made it easy to collect and store massive amounts of operational
RClimTool USER MANUAL
 RClimTool USER MANUAL By Lizeth Llanos Herrera, student Statistics This tool is designed to support, process automation and analysis of climatic series within the agreement of CIAT-MADR. It is not intended
Data Management in BMKG. Database Center, BMKG July 11, 2017
 Data Management in BMKG Database Center, BMKG July 11, 2017 Let s think about 4 Everlasting used data The biggest data producer in Indonesia Many data resources Forecaster may false but Data can t! STATION
DrinC Drought Indices Calculator Getting Started Guide Version 1.0
 DrinC Drought Indices Calculator Getting Started Guide Version 1.0 National Technical University of Athens Lab. of Reclamation Works & Water Resources Management Supervisor: Prof. George Tsakiris Software
Ecography. Supplementary material
 Ecography ECOG-03031 Fordham, D. A., Saltré, F., Haythorne, S., Wigley, T. M. L., Otto-Bliesner, B. L., Chan, K. C. and Brooks, B. W. 2017. PaleoView: a tool for generating continuous climate projections
Integrated Water Resources Science and Services (IWRSS)
") TOO MUCH POOR QUALITY TOO LITTLE Integrated Water Resources Science and Services (IWRSS) Collaborative Science, Services and Tools to Support Integrated and Adaptive Water Resources Management April, 2011
TOO MUCH POOR QUALITY TOO LITTLE Integrated Water Resources Science and Services (IWRSS) Collaborative Science, Services and Tools to Support Integrated and Adaptive Water Resources Management April, 2011
Assignment Two Part Two: Calibration for Flow Due April 3
 Assignment Two Part Two: Calibration for Flow Due April 3 The objective of part 2 of this project is to calibrate the tutorial SWAT model developed in part 1 for flow. Re-Running Part 1 The precipitation
NWSDSS. Hydrologic Engineering Center National Weather Service to Data Storage System Conversion Utility. User's Manual. Version 5.
 NWSDSS Hydrologic Engineering Center National Weather Service to Data Storage System Conversion Utility User's Manual Version 5.3 March 1995 Hydrologic Engineering Center U.S. Army Corps of Engineers 609
The CQUIN Learning Network Annual Meeting
 Annual Meeting CQUIN Dashboard: Development and Implementation Dr. Maureen Syowai ICAP at Columbia University February 13-15 Maputo, Mozambique Outline Background Implementation Results Conclusions 2 Background
Climate Services Across Borders
 Across Borders ICA&D TEAM ROYAL NETHERLANDS METEOROLOGICAL INSTITUTE (KNMI), WORLD METEOROLOGICAL ORGANIZATION Global, Europe, South America, Southeast Asia l Information Products INTRODUCTION The European
Andrew Lee BEng (Hons) CEng MIStructE FGS FPWS
 CEng MIStructE FGS FPWS") Jim Twaddle BSc (Hons) FGS Andrew Lee BEng (Hons) CEng MIStructE FGS FPWS 11 June 2010 ME50252/RE001 !! " # $ $ % # & " '(! ) # $ $ % * $ ( & " # $ $ % $ # $ $ % +, $ # $ $ % #! " $ # $ $ % -! $ # $ $
Jim Twaddle BSc (Hons) FGS Andrew Lee BEng (Hons) CEng MIStructE FGS FPWS 11 June 2010 ME50252/RE001 !! " # $ $ % # & " '(! ) # $ $ % * $ ( & " # $ $ % $ # $ $ % +, $ # $ $ % #! " $ # $ $ % -! $ # $ $
THE WHITE HOUSE. Office of the Press Secretary. For Immediate Release September 23, 2014 EXECUTIVE ORDER
 THE WHITE HOUSE Office of the Press Secretary For Immediate Release September 23, 2014 EXECUTIVE ORDER - - - - - - - CLIMATE-RESILIENT INTERNATIONAL DEVELOPMENT By the authority vested in me as President
DEOS : Web Services and Data Feeds
 DEOS : Web Services and Data Feeds DEOS Technical Note #17 Version 2 Copyright 2006-2008 Center for Climatic Research All material herein is copyright by The Center for Climatic Research Published: October
User Guide for the WegenerNet Data Portal
 User Guide for the WegenerNet Data Portal (v9/18feb2010) The WegenerNet Data Portal provides access to measurement data from the climate stations as well as detailed information about the project. Quality-checked
Valley. Scheduling. Client User Manual _ Valmont Industries, Inc., Valley, NE USA. All rights reserved.
 Valley Scheduling Client User Manual 09805_0 09 Valmont Industries, Inc., Valley, NE 6806 USA. All rights reserved. www.valleyirrigation.com Valley Scheduling This page was left blank intentionally Table
G. Srinivasan/Rupa Kumar Kolli
 WMO G. Srinivasan/Rupa Kumar Kolli Contributors: A.R Subbiah/ Rodney Martinez/Kareff Rafisura/Ruby Rose/Jai Ganesh WMO CCL XVI TECO 2014, Heidelberg, Germany 30 June 2014 1 Overview Climate information
Software for Processing and Interpreting Remote Sensing Image Time Series
 Software for Processing and Interpreting Remote Sensing Image Time Series Felix Rembold, Ferdinando Urbano, Carolien Tote, Herman Eerens, Dominique Haesen, Sven Gilliams, Lieven Byderkerke Why SPIRITS?»
RSA Cybersecurity Poverty Index : APJ
 RSA Cybersecurity Poverty Index : APJ 2016 Overview Welcome to RSA s second annual Cybersecurity Poverty Index. The RSA Cybersecurity Poverty Index is the result of an annual maturity self-assessment completed
Black Sea and Middle East Flash Flood Guidance (BSMEFFG) System Operational Concept
 System Operational Concept") The Republic of Turkey The Ministry of Forestry and Water Affairs Black Sea and Middle East Flash Flood Guidance (BSMEFFG) System Operational Concept Yusuf ULUPINAR Turkish State Meteorological Service
The Republic of Turkey The Ministry of Forestry and Water Affairs Black Sea and Middle East Flash Flood Guidance (BSMEFFG) System Operational Concept Yusuf ULUPINAR Turkish State Meteorological Service
Spatial verification activities at ARPA-SIMC: first results on MesoVICT cases. Maria Stefania Tesini
 Spatial verification activities at ARPA-SIMC: first results on MesoVICT cases Maria Stefania Tesini Andrea Montani, Chiara Marsigli, and Tiziana Paccagnella ARPA-SIMC, Hydro-Meteo-Climate Regional Service,
Mission report. on the Kosovo Declaration of Independence
 Installation of Meteorological, Climatological and Hydrological Data Base Management System and the related training in the Hydrometeorological Institute Pristina, Kosovo 1 2 6 June 2014 Mission report
WRAP-HYD. Initial Manipulations of IN and/or EV Records
 WRAP- The purpose of WRAP- is to facilitate developing hydrology-related input data for WRAP-SIM. The rology data program provides a set of optional routines to read, modify, and create files of naturalized
Early Warning Systems in Central America: Key Element to Disaster Risk Reduction
 Early Warning Systems in Central America: Key Element to Disaster Risk Reduction WORKSHOP: STRENGTHENING DROUGHT EARLY WARNING SYSTEMS Eng. Roy Barboza Sequeira Executive Secretary CEPREDENAC DRR Information
Urban SIS D4.4 Visualisation report
 Urban SIS D4.4 Visualisation report Issued by: Swedish Meteorological and Hydrological Institute Date: 29/12/2016 Official deadline: 31/12/2016 REF.: C3S_441 Lot3 Urban SIS D4.4 Copernicus Climate Change
Effects of PROC EXPAND Data Interpolation on Time Series Modeling When the Data are Volatile or Complex
 Effects of PROC EXPAND Data Interpolation on Time Series Modeling When the Data are Volatile or Complex Keiko I. Powers, Ph.D., J. D. Power and Associates, Westlake Village, CA ABSTRACT Discrete time series
October 27, Jim Ruff Manager Mainstem Passage and River Operations
 Bill Bradbury Chair Oregon Henry Lorenzen Oregon W. Bill Booth Idaho James A. Yost Idaho Jennifer Anders Vice Chair Montana Pat Smith Montana Tom Karier Washington Phil Rockefeller Washington October 27,
Decision Support for Extreme Weather Impacts on Critical Infrastructure
 Decision Support for Extreme Weather Impacts on Critical Infrastructure B. W. Bush Energy & Infrastructure Analysis Group Los Alamos National Laboratory Research Applications Laboratory and Computational
Sensor networks. Ericsson
 Sensor networks IoT @ Ericsson NETWORKS Media IT Industries Page 2 Ericsson at a glance Organization & employees CEO Börje Ekholm Technology & Emerging Business Finance & Common Functions Marketing & Communications
Ag-Analytics Data Platform
 Ag-Analytics Data Platform Joshua D. Woodard Assistant Professor and Zaitz Faculty Fellow in Agribusiness and Finance Dyson School of Applied Economics and Management Cornell University NY State Precision
1000 Series Data Logger
 1000 Series Data Logger Operation Manual Model # s 1200, 1225, 1250, 1400, 1425, 1450, 1525, 1650 CONTENTS General Overview 3 Model Specifications 4 External Sensors 5 Installation and Placement 6 Digital
Analysis Techniques: Flood Analysis Tutorial with Instaneous Peak Flow Data (Log-Pearson Type III Distribution)
") Analysis Techniques: Flood Analysis Tutorial with Instaneous Peak Flow Data (Log-Pearson Type III Distribution) Information to get started: The lesson below contains step-by-step instructions and "snapshots"
Analysis Techniques: Flood Analysis Tutorial with Instaneous Peak Flow Data (Log-Pearson Type III Distribution) Information to get started: The lesson below contains step-by-step instructions and "snapshots"
PRO11. Weather Station CaipoBase
 Product Catalogue 2014 PRODUCT CATALOG PRO11. Weather Station CaipoBase... 3 PRO33. Rain Monitoring System CaipoRain... 4 PRO80. Soil Moisture system CaipoSM... 5 PRO58. Caipo-Mini. Caipos & Davis ISS...
Hitachi Visualization Predictive Crime Analytics
 Hitachi Visualization Predictive Crime Analytics Creating Safe Cities - The Problem Public safety budgets are tightening Violent crimes e.g., assault are increasing in many cities along with the shifting
[Presentation Title]
![[Presentation Title]](/thumbs/93/114343951.jpg "[Presentation Title]") Session: [Session Title] [Presentation Title] [Presenter Name] [Presenter Organization] August [XX], 2016 Rhode Island Convention Center Providence, Rhode Island Federal Sector Buildings Overview In FY2014
Session: [Session Title] [Presentation Title] [Presenter Name] [Presenter Organization] August [XX], 2016 Rhode Island Convention Center Providence, Rhode Island Federal Sector Buildings Overview In FY2014
IMPLEMENTATON OF SOUTHASIA CLIMATE ASSESSMET AND DASET (SACA&D) AT BMKG
 AT BMKG") IMPLEMENTATON OF SOUTHASIA CLIMATE ASSESSMET AND DASET (SACA&D) AT BMKG OUTLINE Introduction of SACAD System Preparation of Implementation Data collecting and reformatting Preparing HW,SW and BW Current
IMPLEMENTATON OF SOUTHASIA CLIMATE ASSESSMET AND DASET (SACA&D) AT BMKG OUTLINE Introduction of SACAD System Preparation of Implementation Data collecting and reformatting Preparing HW,SW and BW Current
Dr. Theresa Modrick, Research Engineer Dr. Rochelle Graham, Research Meteorologist & Education Director Hydrologic Research Center
 Dr. Theresa Modrick, Research Engineer Dr. Rochelle Graham, Research Meteorologist & Education Director Hydrologic Research Center Central Asia Regional Flash Flood Guidance System Steering Committee Meeting
EF5 Overview. University of Oklahoma/HyDROS Module 1.3
 EF5 Overview University of Oklahoma/HyDROS Module 1.3 Outline Day 1 WELCOME INTRODUCTION TO HYDROLOGICAL MODELS EF5 OVERVIEW Features of EF5 Model structure Control file options Warm-up and model states
Workshop - Model Calibration and Uncertainty Analysis Using PEST
 About PEST PEST (Parameter ESTimation) is a general-purpose, model-independent, parameter estimation and model predictive uncertainty analysis package developed by Dr. John Doherty. PEST is the most advanced
IMS CLDB and EnviDB. Universal & Reliable Climate Database Management System. IMS CLDB and EnviDB Climatological and Integrated Environmental Database
 Scalable solution: cost effective LITE version full-featured CDMS* with variety of optional modules available cloud solution High Availability Option Manual or Automatic Data Sources Highly Configurable
1. Introduction. 2. Program structure. HYDROGNOMON components. Storage and data acquisition. Instruments and PYTHIA. Statistical
 HYDROGNOMON: A HYDROLOGICAL DATA MANAGEMENT AND PROCESSING SOFTWARE TOOL European Geosciences Union (EGU) General Assembly, Vienna, Austria, 25-29 April 2005 Session HS29: Hydrological modelling software
RSA Cybersecurity Poverty Index
 RSA Cybersecurity Poverty Index 2016 RSA Cybersecurity Poverty Index Overview Welcome to RSA s second annual Cybersecurity Poverty Index. The RSA Cybersecurity Poverty Index is the result of an annual
TT-DO&M (Climate side) introduction
 introduction") TT-DO&M (Climate side) introduction José A. Guijarro (jguijarrop@aemet.es) State Meteorological Agency, Palma de Mallorca, Spain 1 st Meeting of the RA VI Working Group on Climate and Hydrology (Warsaw,
TT-DO&M (Climate side) introduction José A. Guijarro (jguijarrop@aemet.es) State Meteorological Agency, Palma de Mallorca, Spain 1 st Meeting of the RA VI Working Group on Climate and Hydrology (Warsaw,
v Prerequisite Tutorials GSSHA Modeling Basics Stream Flow GSSHA WMS Basics Creating Feature Objects and Mapping their Attributes to the 2D Grid
 v. 10.1 WMS 10.1 Tutorial GSSHA Modeling Basics Developing a GSSHA Model Using the Hydrologic Modeling Wizard in WMS Learn how to setup a basic GSSHA model using the hydrologic modeling wizard Objectives
Using Operations Dashboard for ArcGIS: An Introduction
 FedGIS Conference February 24 25, 2016 Washington, DC Using Operations Dashboard for ArcGIS: An Introduction Ken Gorton Carmella A. Burdi, GISP Solution Engineer Esri National Government Team kgorton@esri.com
Securing Buildings & Facilities From Emerging Cyber Threats
 Session 5: [Session Title] Securing Buildings & Facilities From Emerging Cyber Threats Michael Mylrea Manager, Cybersecurity & Energy Technology Pacific Northwest National Lab August 10, 2016 Rhode Island
Jeff Nothwehr National Drought Mitigation Center University of Nebraska-Lincoln
 Using Multiprocessing in Python to Decrease Map Production Time Jeff Nothwehr National Drought Mitigation Center University of Nebraska-Lincoln Overview About multi-processing How it works Implementation
CS Review. Prof. Clarkson Spring 2017
 CS 5430 Review Prof. Clarkson Spring 2017 Recall: Audit logs Recording: what to log what not to log how to log locally remotely how to protect the log Reviewing: manual exploration automated analysis MANUAL
Walters Gardens TotalGrow Testing
 Walters Gardens TotalGrow Testing Test Summary: The potential for a 2/3 power consumption reduction by replacing 1000W high pressure sodium lights with 150W TotalGrow TG15A lights was tested and proven
INFORMATION NOTE. United Nations/Germany International Conference
 INFORMATION NOTE United Nations/Germany International Conference Earth Observation: Global solutions for the challenges of sustainable development in societies at risk Organized by The United Nations Office
PRC Coordination of Protection Systems for Performance During Faults
 PRC-027-1 Coordination of Protection Systems for Performance During Faults A. Introduction 1. Title: Coordination of Protection Systems for Performance During Faults 2. Number: PRC-027-1 3. Purpose: To
Spatial Outlier Detection
 Spatial Outlier Detection Chang-Tien Lu Department of Computer Science Northern Virginia Center Virginia Tech Joint work with Dechang Chen, Yufeng Kou, Jiang Zhao 1 Spatial Outlier A spatial data point
Catapult Open. The Open Data Cube (ODC) A tool to increase the value and impact of global Earth observation satellite data
 A tool to increase the value and impact of global Earth observation satellite data") The Open Data Cube (ODC) A tool to increase the value and impact of global Earth observation satellite data SATELLITE APPLICATIONS CATAPULT Our Mission // To innovate for a better world, empowered by satellites.
The Open Data Cube (ODC) A tool to increase the value and impact of global Earth observation satellite data SATELLITE APPLICATIONS CATAPULT Our Mission // To innovate for a better world, empowered by satellites.
What Would a Reusable Meteorology Component for Environmental Models Look Like
 What Would a Reusable Meteorology Component for Environmental Models Look Like C. R. Maul Institute afsustainable Irrigated Agriculture. (ISlA). Tatura VIC 3616. Australia Christian. Maul@nri. vic.gov.
BANGLADESH. I. Natural hazards in Bangladesh
 BANGLADESH I. Natural hazards in Bangladesh 1.1 Natural hazards likely to affect the country The cyclones and floods pose the greatest risk to Bangladesh on a country level. Sub nationally, the northern
Resilient Smart Grids
 Resilient Smart Grids André Teixeira Kaveh Paridari, Henrik Sandberg KTH Royal Institute of Technology, Sweden SPARKS 2nd Stakeholder Workshop Cork, Ireland March 25th, 2015 Legacy Distribution Grids Main
3. EXCEL FORMULAS & TABLES
 Winter 2019 CS130 - Excel Formulas & Tables 1 3. EXCEL FORMULAS & TABLES Winter 2019 Winter 2019 CS130 - Excel Formulas & Tables 2 Cell References Absolute reference - refer to cells by their fixed position.
Vulnerability of Energy and Telecom Infrastructures to Extreme Weather Events A Risk Assessment Tool
 Vulnerability of Energy and Telecom Infrastructures to Extreme Weather Events A Risk Assessment Tool Xavier Clotet, Milenko Halat Aplicaciones en Informática Avanzada S.L., Spain. Friday 24 March 2017
Spatial Hydrologic Modeling HEC-HMS Distributed Parameter Modeling with the MODClark Transform
 v. 9.0 WMS 9.0 Tutorial Spatial Hydrologic Modeling HEC-HMS Distributed Parameter Modeling with the MODClark Transform Setup a basic distributed MODClark model using the WMS interface Objectives In this
The Program pcpstat. User s Manual. Stefan Liersch, Berlin, August 12, 2003
 The Program pcpstat User s Manual Stefan Liersch, Berlin, August 12, 2003 stliersch@freenet.de Introduction The program pcpstat.exe calculates statistical parameters of daily precipitation data used by
The most recent CMS-Wave code developed is Version 3.2. Several new capabilities and advanced features in this version include:
 B8. Using CMS-Wave The most recent CMS-Wave code developed is Version 3.2. Several new capabilities and advanced features in this version include: Full-plane wind-generation of waves Automatic wave run-up
4D Seismic Inversion on Continuous Land Seismic Reservoir Monitoring of Thermal EOR
 4D Seismic Inversion on Continuous Land Seismic Reservoir Monitoring of Thermal EOR Laurene Michou, CGGVeritas, Massy, France, laurene.michou@cggveritas.com Thierry Coleou, CGGVeritas, Massy, France, thierry.coleou@cggveritas.com
Spatial and temporal rainfall approximation using additive models
 ANZIAM J. 42 (E) ppc1599 C1611, 2000 C1599 Spatial and temporal rainfall approximation using additive models C. Zoppou S. Roberts M. Hegland (Received 7 August 2000) Abstract We investigate the approximation
WHITE PAPER Application Performance Management. Managing the Performance of DB2 Environments
 WHITE PAPER Application Performance Management Managing the Performance of DB2 Environments Management summary... 3 Precise for DB2 UDB: Application Performance Monitoring... 4 Maximizing the efficiency
CORDEX DOMAINS (plus Arctic & Antarctica)
") CORDEX DOMAINS (plus Arctic & Antarctica) 12 domains with a resolution of 0.44 (approx. 50x50km²) Focus on Africa High resolution ~0.11 x0.11 for Europe (by some institutions) The TFRCD mandate was extended
CORDEX DOMAINS (plus Arctic & Antarctica) 12 domains with a resolution of 0.44 (approx. 50x50km²) Focus on Africa High resolution ~0.11 x0.11 for Europe (by some institutions) The TFRCD mandate was extended
National and Regional FDR Data Management in Southeast Asia
 National and Regional FDR Data Management in Southeast Asia GUSWANTO Research and Development Center Indonesian Meteorological and Geophysical Agency () International Workshop On Advances In Operational
ITACS : Interactive Tool for Analysis of the Climate System
 Contents 1 2 3 4 ITACS : Interactive Tool for Analysis of the Climate System Features of the ITACS Atmospheric Analysis Data, Outgoing Longwave Radiation (by NOAA), SST, Ocean Analysis Data, etc. Plain
Machine Learning in Data Quality Monitoring
 CERN openlab workshop on Machine Learning and Data Analytics April 27 th, 2017 Machine Learning in Data Quality Monitoring a point of view Goal Maximize the best Quality Data for physics analysis Data
(Cambridge) First semester plan of mathematics grade 6
 First semester plan of mathematics grade 6") 23/08/2015 to 21/09/2015 4.5 1 A :The Number system 1 Place Value Ordering, comparing and rounding numbers Factors and multiples Know what each digit represents in whole numbers up to a million. Know what
23/08/2015 to 21/09/2015 4.5 1 A :The Number system 1 Place Value Ordering, comparing and rounding numbers Factors and multiples Know what each digit represents in whole numbers up to a million. Know what
Design based validation of the MODIS Global Burned Area Product
 Design based validation of the MODIS Global Burned Area Product Luigi Boschetti1, David Roy2, Chris Justice3, Steve Stehman4 1 University of Idaho, Department of Forest, Rangeland and Fire Sciences 2 South
Real-Time Monitoring: Understanding the Commonly (Mis)Used Phrase
Used Phrase") Real-Time Monitoring: Understanding the Commonly (Mis)Used Phrase White Paper 30 October 2015 Executive Summary Matt Lane, Geist DCIM President, discusses real-time monitoring and how monitoring critical
Real-Time Monitoring: Understanding the Commonly (Mis)Used Phrase White Paper 30 October 2015 Executive Summary Matt Lane, Geist DCIM President, discusses real-time monitoring and how monitoring critical
Preliminary Research into Internet Data Sources
 18 th GSS Methodology Symposium Preliminary Research into Internet Data Sources Susan Williams and Martin Ralphs Standards & Strategy Division Office for National Statistics 26 th June 2013 Topics Context:
Adapting to Climate Change Contribution for ICT infrastructure
 Adapting to Climate Change Contribution for ICT infrastructure Dipl.-Ing. (Univ.) Thomas H. Wegmann International Standardization Manager DKE Deutsche Kommission Elektrotechnik Elektronik Informationstechnik
MEETING OF THE WMO COMMISSION FOR CLIMATOLOGY TASK GROUP ON FUTURE WMO CLIMATE DATABASE MANAGEMENT SYSTEMS. (GENEVA, 3-5 May 2000) WCDMP-No.
 WCDMP-No.") MEETING OF THE WMO COMMISSION FOR CLIMATOLOGY TASK GROUP ON FUTURE WMO CLIMATE DATABASE MANAGEMENT SYSTEMS (GENEVA, 3-5 May 2000) WCDMP-No. 46 WMO-TD No. 1025 World Meteorological Organization (Geneva,
MEETING OF THE WMO COMMISSION FOR CLIMATOLOGY TASK GROUP ON FUTURE WMO CLIMATE DATABASE MANAGEMENT SYSTEMS (GENEVA, 3-5 May 2000) WCDMP-No. 46 WMO-TD No. 1025 World Meteorological Organization (Geneva,
Hydrologic Modeling using HEC-HMS
 Hydrologic Modeling using HEC-HMS CE 412/512 Spring 2017 Introduction The intent of this exercise is to introduce you to the structure and some of the functions of the HEC-Hydrologic Modeling System (HEC-HMS),
Accessing NOAA Daily Temperature and Precipitation Extremes Based on Combined/Threaded Station Records
 Accessing NOAA Daily Temperature and Precipitation Extremes Based on Combined/Threaded Station Records Tim Owen 1 Keith Eggleston and Arthur DeGaetano 2 Robert Leffler 3 Version 03/20/06 1: NOAA National
PG&E Advanced Metering Assessment for Residential Electric Customers. September 2, 2010
 PG&E Advanced Metering Assessment for Residential Electric Customers September 2, 2010 Structure Overview Deep subject matter expertise with proven delivery methodologies to address energy & utility companies
Utilising Cygwin, Python & Octave to obtain daily & hourly climate data for multiple months, years, and stations from climate.weather.gc.
 Utilising Cygwin, Python & Octave to obtain daily & hourly climate data for multiple months, years, and stations from climate.weather.gc.ca danielbm@uvic.ca 1 outline Why? MSc students requests (my current
Maryland Corn: Historical Basis and Price Information Fact Sheet 495
 Maryland Corn: Historical Basis and Price Information Fact Sheet 495 Dale M. Johnson, Farm Management Specialist James C. Hanson, Professor and Chair Kevin McNew, Adjunct Professor, Founder and President
Maryland Soybeans: Historical Basis and Price Information
 Maryland Soybeans: Historical Basis and Price Information Fact Sheet 496 James C. Hanson Extension Specialist, Department of Agricultural and Resource Economics, University of Maryland Kevin McNew Adjunct
Development and Implementation of International and Regional Flash Flood Guidance (FFG) and Early Warning Systems. Project Brief
 and Early Warning Systems. Project Brief") Development and Implementation of International and Regional Flash Flood Guidance (FFG) and Early Warning Systems Project Brief 1 SUMMARY The purpose of this project is the development and implementation
Development and Implementation of International and Regional Flash Flood Guidance (FFG) and Early Warning Systems Project Brief 1 SUMMARY The purpose of this project is the development and implementation
STORMPAC USER GUIDE. Version 4.2
 STORMPAC USER GUIDE Version 4.2 WRc is an Independent Centre of Excellence for Innovation and Growth. We bring a shared purpose of discovering and delivering new and exciting solutions that enable our
Construction of Water Table Maps Using GIS
 Geology 309 Construction of Water Table Maps Using GIS Geographic Information Systems (GIS) provide useful tools that enable easy construction of water table maps. In this exercise you will use lake elevation
Software Testing: A Craftsman s Approach, 4 th Edition. Chapter 5 Boundary Value Testing
 Chapter 5 Boundary Value Testing Functional Testing The rationale for referring to specification-based testing as functional testing is likely due to the abstraction that any program can be viewed as a
ChristoHouston Energy Inc. (CHE INC.) Pipeline Anomaly Analysis By Liquid Green Technologies Corporation
 Pipeline Anomaly Analysis By Liquid Green Technologies Corporation") ChristoHouston Energy Inc. () Pipeline Anomaly Analysis By Liquid Green Technologies Corporation CHE INC. Overview: Review of Scope of Work Wall thickness analysis - Pipeline and sectional statistics Feature
ChristoHouston Energy Inc. () Pipeline Anomaly Analysis By Liquid Green Technologies Corporation CHE INC. Overview: Review of Scope of Work Wall thickness analysis - Pipeline and sectional statistics Feature