October 27, Jim Ruff Manager Mainstem Passage and River Operations
|
|
|
- Martin Grant
- 6 years ago
- Views:
Transcription

 in Boulder, CO will be the presenter. Dr. Koehler is the National Hydrologic and Geospatial Science Training Coordinator for the NWS.")
1 Bill Bradbury Chair Oregon Henry Lorenzen Oregon W. Bill Booth Idaho James A. Yost Idaho Jennifer Anders Vice Chair Montana Pat Smith Montana Tom Karier Washington Phil Rockefeller Washington October 27, 2014 MEMORANDUM TO: FROM: Fish and Wildlife Committee members Jim Ruff Manager Mainstem Passage and River Operations SUBJECT: Presentation on Columbia River streamflow and fish migration data visualization BACKGROUND: Presenter: Dr. Rick Koehler of NOAA s National Weather Service (NWS) in Boulder, CO will be the presenter. Dr. Koehler is the National Hydrologic and Geospatial Science Training Coordinator for the NWS. He is also a registered Professional Hydrologist with the American Institute of Hydrology (AIH). Summary: Dr. Koehler will use graphical data visualization to present selected Columbia River flow and adult Chinook salmon migration data in a new and novel way that may have application to the revised Fish and Wildlife Program. Specifically, the presentation will examine historic patterns in daily streamflow records and adult Chinook salmon daily counts for the lower Columbia River. Relevance: A data visualization technique will be presented where large amounts of time-series data are plotted as time maps, similar to a geographic information system (GIS). This approach provides the advantage of being able to see daily, weekly, monthly, seasonal, annual and inter-annual patterns or trends simultaneously. The technique also permits visualization of natural short- and long-term variation, as well as artificial fluctuations.
2 Workplan: While there are no direct links to the Council s amended Fish and Wildlife Program, there are a number of indirect links to the Program. For example, in the Data Management section of Part Four-Adaptive Management, a principle states the region should work collaboratively through established forums to continue to refine metrics, methods, and indicators which can be used consistently to evaluate and report on program progress, focal species, and their habitats. In addition, in the measures of the Reporting section it states that monitoring reports should provide important data about implementation, status and trends; and that the Council will continue to work with Bonneville and the ISRP to identify and assemble the information needed to produce an annual summary of results for Council review. Background: As a fellow member of AIH and after reviewing the Council s and Fish Passage Center web sites, Dr. Koehler contacted me about presenting selected data from the Columbia River Basin using the visualization technique. We determined that showing both Columbia River flow and adult Chinook salmon migration time series data would provide useful and relevant examples to help the Council visualize temporal patterns or trends and natural short- and long-term variations using this technique. w:\jr\ww\2014\ noaa-nws koehler data visualization memo.docx 2


3 Columbia River Streamflow and Fish Migration Data Visualization Richard Koehler, PhD, PH

4 Recent News Is this a fluke? Is this part of a trend? Is this cherry-picked data? How do other years compare? What are the numbers for adjacent days? What does this mean for other locations upstream? What factors play a part in this record? Source: bpa.gov Show me the data
 2014 X = Short-term coordinate 2013 Y = Long-term")

5 Timescape Helps view large amounts of time-based data Y (year) Z (value) 2014 X = Short-term coordinate 2013 Y = Long-term coordinate Z = Value (cell color) X (day) Time Raster Grid Data image Raster: A rectangular grid of colored cells

6 Traditional hydrograph Columbia River at The Dalles, OR 137 years of daily data (~49,800 values)
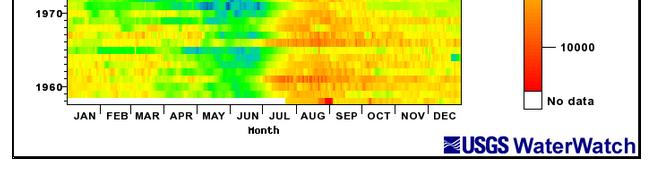
7 Raster hydrograph Columbia River at The Dalles, OR 137 years of daily data (~49,800 values)
8 Raster hydrograph Columbia River at The Dalles, OR 137 years of daily data (~49,800 values) By-pass tunnels close Lake Celilo begins to fill
9 Raster hydrograph Columbia River at The Dalles, OR 137 years of daily data (~49,800 values) Generators online Electricity production begins
10 Raster hydrograph Columbia River at The Dalles, OR 137 years of daily data (~49,800 values) Snowmelt runoff
11 Raster hydrograph Columbia River at The Dalles, OR 137 years of daily data (~49,800 values) Droughts
12 Raster hydrograph Columbia River at The Dalles, OR 137 years of daily data (~49,800 values) Record low flow
13 Raster hydrograph Columbia River at The Dalles, OR 137 years of daily data (~49,800 values) Storm flow
")
14 Raster hydrograph Columbia River at The Dalles, OR 137 years of daily data (~49,800 values) Sundays
15 Raster hydrograph Columbia River at The Dalles, OR 137 years of daily data (~49,800 values) Christmas
16 Raster hydrograph Columbia River at The Dalles, OR 137 years of daily data (~49,800 values) Monthly change
17 Raster hydrograph Columbia River at The Dalles, OR 137 years of daily data (~49,800 values) Data artifact


18 Adopted by the USGS* Snake River near Anatone, WA *
 Volume (ac-ft) The Dalles Dam")
19 Cumulative volume Columbia River at The Dalles, OR Cumulative volume (1879 to 2014) Volume (ac-ft) The Dalles Dam operational
20 Annual maximum Columbia River at The Dalles, OR Mean Daily Flow, Annual Maximum (1878 to 2014) The Dalles Dam operational

21 Bonneville Adult Chinook Daily count ( , 5 years)
22 Bonneville Adult Chinook Daily Count, ( , 76 years)


23 Bonneville Adult Chinook Daily Count, ( , 76 years) Yearly Maximum Daily Count

24 Bonneville Adult Chinook Running yearly total daily count Missing
25 Bonneville Adult Chinook Running yearly total daily count Missing


26 Bonneville Adult Chinook Running yearly total daily count Monthly PDO index Missing


27 Lower Columbia River System Daily count at four projects Bonneville The Dalles John Day McNary
28 Summary 1. Quickly get the Big Picture 2. See all the data 3. Better understanding 4. New ways to examine your data Works with any time-series: Power production, water temperature, dissolved gases, snowpack, precipitation, water diversions, tons of cargo shipped,
29 Questions?
30 Additional slides


31 Bonneville Adult Chinook Daily count change Pulses of fish pass through Bonneville. Only a few large pulses per season.
 2. Sea surface salinity (psu) 3. Air temp ( C) 4. Precipitation (cm) 5. Streamflow (m 3 s -1 ) 6.")

32 GIS-like analysis Puget Sound Puget Sound paralytic shellfish toxins * Time-series datasets: Traditional plots: Environmental factors 1. Sea surface temp ( C) 2. Sea surface salinity (psu) 3. Air temp ( C) 4. Precipitation (cm) 5. Streamflow (m 3 s -1 ) 6. Tidal height difference (m) 7. Upwelling (m 3 s m -1 ) 8. Wind speed (ms -1 ) * Moore, S.K., et al., Recent trends in paralytic shellfish toxins in Puget Sound, relationships to climate, and capacity for prediction of toxic events. Harmful Algae 8, doi: / j.hal


33 Binary filter Find days with favorable conditions Observed streamflow Criterion: Flow 350 m 3 s -1 Met = 1 Not met = 0 Missing 1,716 days or event windows 36%
 2,662 days 1,716 days Calendar Year VDA 2,062 days 4,116 days Day of Year")
34 Habitat analysis results 1,840 days 2,513 days Apply specific criterion to specific layer If Σ layers = 8 for specific day; Then conditions favorable for an event Potential Event Windows 2,424 days 2,546 days 127 days (~3%) 2,662 days 1,716 days Calendar Year VDA 2,062 days 4,116 days Day of Year Missing
July 30, 2013 MEMORANDUM. Council Members. Massoud Jourabchi. Overview of Data Centers
 Bill Bradbury Chair Oregon Henry Lorenzen Oregon W. Bill Booth Idaho James A. Yost Idaho Jennifer Anders Vice Chair Montana Pat Smith Montana Tom Karier Washington Phil Rockefeller Washington July 30,
MEMORANDUM. June 30, Council Members. Update on Transmission Planning Activities
 Bruce A. Measure Chair Montana Rhonda Whiting Montana W. Bill Booth Idaho James A. Yost Idaho Dick Wallace Vice-Chair Washington Tom Karier Washington Melinda S. Eden Oregon Joan M. Dukes Oregon June 30,
Canada s Fish Habitat Law. Fish - Water Quantity Interactions Okanagan Water Stewardship Council Meeting Oct 12, Kelowna, B.C.
 Canada s Fish Habitat Law Fish - Water Quantity Interactions Okanagan Water Stewardship Council Meeting Oct 12, 2006 - Kelowna, B.C. Disclaimer This presentation was developed at the specific request of
January 26, Tom Eckman, Charles Grist & Massoud Jourabchi. Status of Regional Planning Data Development
 Bruce A. Measure Chair Montana Rhonda Whiting Montana W. Bill Booth Idaho James A. Yost Idaho Dick Wallace Vice-Chair Washington Tom Karier Washington Bill Bradbury Oregon Joan M. Dukes Oregon January
2D Large Scale Automated Engineering for FEMA Floodplain Development in South Dakota. Eli Gruber, PE Brooke Conner, PE
 2D Large Scale Automated Engineering for FEMA Floodplain Development in South Dakota Eli Gruber, PE Brooke Conner, PE Project Acknowledgments FEMA Region 8 Staff: Brooke Conner, PE Casey Zuzak, GISP Ryan
Curve Fit: a pixel level raster regression tool
 a pixel level raster regression tool Timothy Fox, Nathan De Jager, Jason Rohweder* USGS La Crosse, WI a pixel level raster regression tool Working with multiple raster datasets that share a common theme
DEVELOPMENT OF A TOOL FOR OFFSHORE WIND RESOURCE ASSESSMENT FOR WIND INDUSTRY
 DEVELOPMENT OF A TOOL FOR OFFSHORE WIND RESOURCE ASSESSMENT FOR WIND INDUSTRY Alberto Rabaneda Dr. Matthew Stickland University of Strathclyde Mechanical and Aerospace Engineering Department Wind resource
IN THIS ISSUE. 1 Update to New Database System Complete. 2 Changes to Interrogation Data Loading and Validation
 OCTOBER 2013 Volume 11 Issue 2 The PTAGIS Newsletter is published periodically by Pacific States Marine Fisheries Commission. We welcome input from the PTAGIS community, so email us at ptagis_newsletter@ptagis.org
Integrated Water Resources Science and Services (IWRSS)
") TOO MUCH POOR QUALITY TOO LITTLE Integrated Water Resources Science and Services (IWRSS) Collaborative Science, Services and Tools to Support Integrated and Adaptive Water Resources Management April, 2011
TOO MUCH POOR QUALITY TOO LITTLE Integrated Water Resources Science and Services (IWRSS) Collaborative Science, Services and Tools to Support Integrated and Adaptive Water Resources Management April, 2011
Computational Fluid Dynamics Modeling Applications in the Columbia and Willamette Basins
 Computational Fluid Dynamics Modeling Applications in the Columbia and Willamette Basins Liza Roy, P.E. Hydraulic Engineer Portland District February 18, 2010 US Army Corps of Engineers Focused CFD Modeling
July 30, Massoud Jourabchi, Charlie Grist and Ben Kujala
 Bill Bradbury Chair Oregon Henry Lorenzen Oregon W. Bill Booth Idaho James A. Yost Idaho Jennifer Anders Vice Chair Montana Pat Smith Montana Tom Karier Washington Phil Rockefeller Washington July 30,
Development of an online hatchery release data mapping application N. Lynnae Sutton Fish Passage Center Portland Oregon USA
 The Beginning Development of an online hatchery release data mapping application N. Lynnae Sutton Fish Passage Center Portland Oregon USA OFWIM 2011 Conference and Annual Meeting October 17-20, 2011 Drury
Distribution Restriction Statement Approved for public release; distribution is unlimited.
 CECW-EH Regulation No. 1110-2-8155 Department of the Army U.S. Army Corps of Engineers Washington, DC 20314-1000 Engineering and Design HYDROMETEOROLOGICAL DATA MANAGEMENT AND ARCHIVING Distribution Restriction
FATHOM Model for Florida Bay: Overview and Calibration/Verification Exercise
 FATHOM Model for Florida : Overview and Calibration/Verification Exercise October 2-3, 13 Frank Marshall, Bill Nuttle, Jack Cosby Flux Accounting and Tidal Hydrology at the Ocean Margin The FATHOM Model
Charter for the System Interoperability and Data Synchronization Requirements Team
 Charter for the System Interoperability and Data Synchronization Requirements Team Introduction and Background The National Weather Service (NWS), the U.S. Army Corps of Engineers (USACE), and the U.S.
Technology Innovation Delivering Value to BPA Organized, Disciplined, Focused
 B O N N E V I L L E P O W E R A D M I N I S T R A T I O N Technology Innovation Delivering Value to BPA Organized, Disciplined, Focused Keeping the Lights on for the Long Term The Basics Bonneville Power
Automated Data Quality Assurance for Marine Observations
 Automated Data Quality Assurance for Marine Observations James V. Koziana Science Applications International Corporation (SAIC) Hampton, VA 23666 USA Third Meeting of GCOOS DMAC Renaissance Orlando Hotel
Build a MODRAT model by defining a hydrologic schematic
 v. 11.0 WMS 11.0 Tutorial Build a MODRAT model by defining a hydrologic schematic Objectives Learn how to define a basic MODRAT model using the hydrologic schematic tree in WMS by building a tree and defining
FISH PASSAGE CENTER. 847 NE 19 th Ave., Suite 250, Portland, OR Phone: (503) Fax: (503)
 Fax: (503)") FISH PASSAGE CENTER 847 NE 19 th Ave., Suite 250, Portland, OR 97232 Phone: (503) 833-3900 Fax: (503) 232-1259 www.fpc.org/ e-mail fpcstaff@fpc.org MEMORANDUM TO: Jim Ruff, NPCC Nancy Leonard, NPCC Adam
FISH PASSAGE CENTER 847 NE 19 th Ave., Suite 250, Portland, OR 97232 Phone: (503) 833-3900 Fax: (503) 232-1259 www.fpc.org/ e-mail fpcstaff@fpc.org MEMORANDUM TO: Jim Ruff, NPCC Nancy Leonard, NPCC Adam
11.1 Internet-Based Climate Analysis Software Applications
 11.1 Internet-Based Climate Analysis Software Applications Phillip A. Pasteris* USDA-NRCS, National Water and Climate Center, Portland, Oregon Keith L. Eggleston and William Noon Northeast Regional Climate
Projections for use in the Merced River basin
 Instructions to download Downscaled CMIP3 and CMIP5 Climate and Hydrology Projections for use in the Merced River basin Go to the Downscaled CMIP3 and CMIP5 Climate and Hydrology Projections website. 1.
July November 7, Council Decides on Trial PERC. Council Decides on Recommendations. September 27, 2012
 PERC Process July 2012 August 2012 September 13, 2012 October 3, 2012 November 7, 2012 Council Decides on Trial PERC August 22, 2012 September 27, 2012 October 9/10, 2012 Council Decides on Recommendations
The Volume and Extent of the Lake Created by the Bridge of the Gods, Colombia River
 Rachel Markoff 12/1/2011 GEO 327G/386G Term Project The Volume and Extent of the Lake Created by the Bridge of the Gods, Colombia River 1. Introduction The Bonneville Landslide occurred on the Colombia
Performance Tools and Holistic HPC Workflows
 Performance Tools and Holistic HPC Workflows Karen L. Karavanic Portland State University Work Performed with: Holistic HPC Workflows: David Montoya (LANL) PSU Drought Project: Yasodha Suriyakumar (CS),
On July 6, 2016, FPAC met via conference call for its weekly meeting. The following people participated in the meeting:
 FISH PASSAGE CENTER 847 NE 19 th Avenue, #250, Portland, OR 97232 Phone: (503) 833-3900 Fax: (503) 232-1259 www.fpc.org/ e-mail us at fpcstaff@fpc.org MEMORANDUM To: From: Fish Passage Advisory Committee
Longley Chapter 3. Representations
 Longley Chapter 3 Digital Geographic Data Representation Geographic Data Type Data Models Representing Spatial and Temporal Data Attributes The Nature of Geographic Data Representations Are needed to convey
APPENDIX E2. Vernal Pool Watershed Mapping
 APPENDIX E2 Vernal Pool Watershed Mapping MEMORANDUM To: U.S. Fish and Wildlife Service From: Tyler Friesen, Dudek Subject: SSHCP Vernal Pool Watershed Analysis Using LIDAR Data Date: February 6, 2014
J1.6 MONITORING AND ANALYZING THE GLOBAL OCEAN OBSERVING SYSTEM WITH THE OBSERVING SYSTEM MONITORING CENTER
 J1.6 MONITORING AND ANALYZING THE GLOBAL OCEAN OBSERVING SYSTEM WITH THE OBSERVING SYSTEM MONITORING CENTER Kevin M. O'Brien 1*,S. Hankin 2, R. Schweitzer 3, K. Kern 4, M. Little 4,T. Habermann 5, N. Auerbach
9 Planning Chronology
 9 Planning Chronology Lower Columbia Recovery Planning Process March 1998 The Lower Columbia Fish Recovery Board (LCFRB) is established by the Washington State Legislature to coordinate the development
WMS 10.0 Tutorial Watershed Modeling MODRAT Interface Schematic Build a MODRAT model by defining a hydrologic schematic
 v. 10.0 WMS 10.0 Tutorial Watershed Modeling MODRAT Interface Schematic Build a MODRAT model by defining a hydrologic schematic Objectives This tutorial shows users how to define a basic MODRAT model using
User Guide Interactive Mappers and Population Query Tool
 User Guide Interactive Mappers and Population Query Tool This project offers two interactive mappers; both have a similar look and the same navigation and reporting tools, but each maps salmon and steelhead
Streamgaging in the Flathead Basin Part 2: Data and Resources Kirk Miller Wyoming-Montana Water Science Center U.S.
 Streamgaging in the Flathead Basin Part 2: Data and Resources Kirk Miller Wyoming-Montana Water Science Center U.S. Geological Survey Prepared for Workshop: Streamgaging in the Flathead Basin, Kalispell,
By Eric Fritzinger Sohei Okamoto
 By Eric Fritzinger Sohei Okamoto What are Models? Mathematical models used to describe a system E.g. Atmospheric, Oceanic, Ecological, etc Algorithmic calculations which take input and produce estimated
Jeffery S. Horsburgh. Utah Water Research Laboratory Utah State University
 Advancing a Services Oriented Architecture for Sharing Hydrologic Data Jeffery S. Horsburgh Utah Water Research Laboratory Utah State University D.G. Tarboton, D.R. Maidment, I. Zaslavsky, D.P. Ames, J.L.
Hydrologic Modeling using HEC-HMS
 Hydrologic Modeling using HEC-HMS CE 412/512 Spring 2017 Introduction The intent of this exercise is to introduce you to the structure and some of the functions of the HEC-Hydrologic Modeling System (HEC-HMS),
v. 9.1 WMS 9.1 Tutorial Watershed Modeling HEC-1 Interface Learn how to setup a basic HEC-1 model using WMS
 v. 9.1 WMS 9.1 Tutorial Learn how to setup a basic HEC-1 model using WMS Objectives Build a basic HEC-1 model from scratch using a DEM, land use, and soil data. Compute the geometric and hydrologic parameters
5PRESENTING AND DISSEMINATING
 5PRESENTING AND DISSEMINATING INFORMATION This chapter presents information and guidance on how to present and disseminate marine water quality monitoring data to the program s intended audience. Section
2017 Asian Carp Action Plan Briefing
 Asian Carp Regional Coordinating Committee 2017 Asian Carp Action Plan Briefing January 11, 2017 Welcome and Introductions Matthew McKenna, Director, Northeast Midwest Institute Mike Weimer, Co-Chair ACRCC,
Design of a Software Framework Prototype for Scientific Model Interoperability
 2010 Annual Nevada NSF EPSCoR Climate Change Conference 2010 Annual Nevada NSF EPSCoR Climate Change Conference Feb 2nd, 10:30 AM - 10:40 AM Design of a Software Framework Prototype for Scientific Model
WMS 8.4 Tutorial Watershed Modeling MODRAT Interface Schematic Build a MODRAT model by defining a hydrologic schematic
 v. 8.4 WMS 8.4 Tutorial Watershed Modeling MODRAT Interface Schematic Build a MODRAT model by defining a hydrologic schematic Objectives This tutorial shows you how to define a basic MODRAT model using
1.0 INTRODUCTION. Subject: Peaking Analysis
 Memo Date: Friday, Project: NorthWestern Energy Operations Modeling of Hydros To: John Vandaveer, NorthWestern Energy From: Rick Miller, HDR Subject: Peaking Analysis 1.0 INTRODUCTION The goal of this
DISCOVERING THE NATURE OF PERIODIC DATA: II. ANALYZING DATA AND JUDGING THE GOODNESS OF FIT USING RESIDUALS
 DISCOVERING THE NATURE OF PERIODIC DATA: II. ANALYZING DATA AND JUDGING THE GOODNESS OF FIT USING RESIDUALS Scott A. Sinex and George S. Perkins Prince George s Community College Generating periodic data
StreamNet Project. FY 2002 Work Statement. Bruce Schmidt, Pacific States Marine Fisheries Commission
 StreamNet Project BPA Project No.: 198810814 FY 2002 Work Statement Bruce Schmidt, Pacific States Marine Fisheries Commission Cooperators: Phil Roger, Columbia River Intertribal Fish Commission; Bart Butterfield,
MATHEMATICS CONCEPTS TAUGHT IN THE SCIENCE EXPLORER, FOCUS ON EARTH SCIENCE TEXTBOOK
 California, Mathematics Concepts Found in Science Explorer, Focus on Earth Science Textbook (Grade 6) 1 11 Describe the layers of the Earth 2 p. 59-61 Draw a circle with a specified radius or diameter
Memoranda of Understanding (MOU) & Memoranda of Agreement (MOA)
 & Memoranda of Agreement (MOA)") Memoranda of Understanding (MOU) & Memoranda of Agreement (MOA) Partnerships in NRM PROSPECT Course US Army Corps of Engineers Course Objectives Goal: Participants will learn of the differences between
Memoranda of Understanding (MOU) & Memoranda of Agreement (MOA) Partnerships in NRM PROSPECT Course US Army Corps of Engineers Course Objectives Goal: Participants will learn of the differences between
How to use the SATURN Observation Network: Endurance Stations Site: Table of Contents
 How to use the SATURN Observation Network: Endurance Stations Site: Table of Contents Preface... 2 Introduction to the SATURN Interface... 3 Fixed station user interface... 5 The Recent Tab... 6 Reading
Watershed Modeling HEC-HMS Interface
 v. 10.1 WMS 10.1 Tutorial Learn how to set up a basic HEC-HMS model using WMS Objectives Build a basic HEC-HMS model from scratch using a DEM, land use, and soil data. Compute the geometric and hydrologic
Acquiring and Processing NREL Wind Prospector Data. Steven Wallace, Old Saw Consulting, 27 Sep 2016
 Acquiring and Processing NREL Wind Prospector Data Steven Wallace, Old Saw Consulting, 27 Sep 2016 NREL Wind Prospector Interactive web page for viewing and querying wind data Over 40,000 sites in the
B O N N E V I L L E A D M I N I S T R A T I O N B O N N E V I L L E P O W E R A D M I N I S T R A T I O N
 B O N N E V I L L E A D M I N I S T R A T I O N B O N N E V I L L E P O W E R A D M I N I S T R A T I O N NERC Monitoring and Situational Awareness Conference Bonneville Power Administration Self-Monitoring:
DEOS : Web Services and Data Feeds
 DEOS : Web Services and Data Feeds DEOS Technical Note #17 Version 2 Copyright 2006-2008 Center for Climatic Research All material herein is copyright by The Center for Climatic Research Published: October
Click to edit Master text styles Second level Third level Fourth level Fifth level
 Click to edit Master title style Photo Credit: NEBRASKAland Magazine/Nebraska Game and Parks Commission Click Presentation to edit Master Summary title style River Click History edit Master text styles
CUENCAS Developer's Guide. by Ricardo Mantilla 2009
 CUENCAS Developer's Guide by Ricardo Mantilla 2009 2 Contents Table CHAPTER 1 INTRODUCTION 3 11 LICENSING 4 12 OBTAINING THE SOURCE CODE 4 CHAPTER 2 THE CUENCAS DATABASE STRUCTURE 6 21 THE RASTERS FOLDER
SampleSize 3.0 USER S MANUAL
 SampleSize 3.0 USER S MANUAL SAMPLE SIZE CALCULATIONS FOR FISH AND WILDLIFE SURVIVAL STUDIES COLUMBIA BASIN RESEARCH SCHOOL OF AQUATIC AND FISHERY SCIENCES UNIVERSITY OF WASHINGTON Program SampleSize
Applying the Standardized Precipitation Index as a Drought Indicator
 Applying the Standardized Precipitation Index as a Drought Indicator Mark Svoboda, Climatologist Monitoring Program Area Leader National Drought Mitigation Center University of Nebraska-Lincoln Mali Drought
USING HYDRODESKTOP TO FIND DATA FOR WATERSHED HYDROLOGY
 USING HYDRODESKTOP TO FIND DATA FOR WATERSHED HYDROLOGY Exercise 4 February 10, 2011 by: Gonzalo E. Espinoza, Dr. Tim Whiteaker, and Dr. David Maidment Center for Research in Water Resources The University
Marine Transportation System Resilience: A Federal Agency Perspective
 Marine Transportation System Resilience: A Federal Agency Perspective Katherine Touzinsky, USACE-ERDC TRB-CMTS Biennial Conference, June 21-23 rd, 2016 Resilience Integrated Action Team: Mission and Objectives
August 2012 Volume 10 Issue 2
 August 2012 Volume 10 Issue 2 The PTAGIS Newsletter is published periodically by Pacific States Marine Fisheries Commission. We welcome input from the PTAGIS community, so email us at ptagis_newsletter@ptagis.org
Upper Trinity River Corridor Development Certificate Model Updates. Flood Management Task Force Meeting April 20, 2018
 Upper Trinity River Corridor Development Certificate Model Updates Flood Management Task Force Meeting April 20, 2018 Agenda Review of the Phase II Upper Trinity Watershed CDC Model Development Hydrology
Research Article Forecasting SPEI and SPI Drought Indices Using the Integrated Artificial Neural Networks
 Computational Intelligence and Neuroscience Volume 2016, Article ID 3868519, 17 pages http://dx.doi.org/10.1155/2016/3868519 Research Article Forecasting SPEI and SPI Drought Indices Using the Integrated
User Interface Design Considerations for a Time-Space GIS
 International Environmental Modelling and Software Society (iemss) 2012 International Congress on Environmental Modelling and Software Managing Resources of a Limited Planet, Sixth Biennial Meeting, Leipzig,
Indicators of Hydrologic Alteration
 Indicators of Hydrologic Alteration Version 7.1 User's Manual with rpurview LLC - Ted Rybicki Totten Software Design Smythe Scientific Software April 2009 Indicators of Hydrologic Alteration Version 7.1
Improving Accuracy of Real-Time Storm Surge Inundation Predictions
 Improving Accuracy of Real-Time Storm Surge Inundation Predictions M.S. Thesis Defense Nelson Tull May 23, 2018 Committee Advisor Casey Dietrich Committee members Helena Mitasova and Alejandra Ortiz Special
Estimation of Design Flow in Ungauged Basins by Regionalization
 Estimation of Design Flow in Ungauged Basins by Regionalization Yu, P.-S., H.-P. Tsai, S.-T. Chen and Y.-C. Wang Department of Hydraulic and Ocean Engineering, National Cheng Kung University, Taiwan E-mail:
Lights Out! Climate Change Risk to Internet Infrastructure. Prof. Paul Barford. Fall Computer Science Dept. University of Wisconsin
 Lights Out! Climate Change Risk to Internet Infrastructure Fall 2018 Prof. Paul Barford Computer Science Dept. University of Wisconsin I m a climate change skeptic I ve looked at the data Things are much
Version 3 Updated: 10 March Distributed Oceanographic Match-up Service (DOMS) User Interface Design
 User Interface Design") Distributed Oceanographic Match-up Service (DOMS) User Interface Design Shawn R. Smith 1, Jocelyn Elya 1, Adam Stallard 1, Thomas Huang 2, Vardis Tsontos 2, Benjamin Holt 2, Steven Worley 3, Zaihua Ji
Distributed Oceanographic Match-up Service (DOMS) User Interface Design Shawn R. Smith 1, Jocelyn Elya 1, Adam Stallard 1, Thomas Huang 2, Vardis Tsontos 2, Benjamin Holt 2, Steven Worley 3, Zaihua Ji
UNDERSTAND HOW TO SET UP AND RUN A HYDRAULIC MODEL IN HEC-RAS CREATE A FLOOD INUNDATION MAP IN ARCGIS.
 CE 412/512, Spring 2017 HW9: Introduction to HEC-RAS and Floodplain Mapping Due: end of class, print and hand in. HEC-RAS is a Hydrologic Modeling System that is designed to describe the physical properties
Boardman to Hemingway Project Advisory Team
 Boardman to Hemingway Project Advisory Team Central Project Advisory Team Meeting 5 Tonight s Objectives Review progress of the Community Advisory Process and discuss next steps Present analysis of revised
35 GRDC operating under the auspices of the UN - World Meteorological Organization (WMO) We have included this information into the revision.
 We have included this information into the revision.") Earth Syst. Sci. Data Discuss., https://doi.org/10.5194/essd-2017-103-ac3, 2018 Author(s) 2018. This work is distributed under the Creative Commons Attribution 4.0 License. Open Access Earth System Science
Earth Syst. Sci. Data Discuss., https://doi.org/10.5194/essd-2017-103-ac3, 2018 Author(s) 2018. This work is distributed under the Creative Commons Attribution 4.0 License. Open Access Earth System Science
Exploring GIS as a Tool to Age Fish Scales. Columbia River Inter Tribal Fish Commission Denise Kelsey
 Exploring GIS as a Tool to Age Fish Scales Columbia River Inter Tribal Fish Commission Denise Kelsey 1 Scale Collection from Sockeye Scale Card and Plastic Impression 2 1) Focus 2) Freshwater winter 3)
NWPP Market Assessment and. August 3, 2012
 NWPP Market Assessment and Coordination Committee (MC) Purpose, Objectives, andtimeline PNUCC Board of Directors PNUCC Board of Directors August 3, 2012 Northwest Power Pool Footprint Source: NWPP & DTC
CE 549 Lab 1 - Linking Streamflow Data to a Gauging Station
 CE 549 Lab 1 - Linking Streamflow Data to a Gauging Station Prepared by Venkatesh Merwade Lyles School of Civil Engineering, Purdue University vmerwade@purdue.edu January 2018 Objective The objective of
The effect of LiDAR digital elevation model resolution on stream network prediction and computational requirements
 The effect of LiDAR digital elevation model resolution on stream network prediction and computational requirements Current Stream Layer Inaccuracy LiDAR Hillshade I Inaccuracy DNR Hydro Layer Problem Increased
Introduction to GIS software
 Introduction to GIS software There are a wide variety of GIS software packages available. Some of these software packages are freely available for you to download and could be used in your classroom. ArcGIS
Climate Data Screener and Summarizer, version 3.2
 Climate Data Screener and Summarizer, version 3.2 Instruction Manual May 2011 Program Written By: Michael T. Tercek, Ph.D. WALKING SHADOW ECOLOGY PO Box 1085 Gardiner, Montana 59030 USA www.yellowstoneecology.com
METRO VANCOUVER REGIONAL DISTRICT CLIMATE ACTION COMMITTEE
 METRO VANCOUVER REGIONAL DISTRICT CLIMATE ACTION COMMITTEE Minutes of the Regular Meeting of the Metro Vancouver Regional District (MVRD) Climate Action Committee held at 1:03 p.m. on Wednesday, September
Automated Enforcement of High Resolution Terrain Models April 21, Brian K. Gelder, PhD Associate Scientist Iowa State University
 Automated Enforcement of High Resolution Terrain Models April 21, 2015 Brian K. Gelder, PhD Associate Scientist Iowa State University Problem Statement High resolution digital elevation models (DEMs) should
503 93RE. ACC Sub-Committee on Water Resources /, ;.r/>rv ACC/SWR/1993/3. /* -* ~' s * *» / V
 503 93RE ACC Sub-Committee on Water Resources /, ;.r/>rv ACC/SWR/1993/3 /* -* ~' s * *» / V 14th session ACC/SWR/1993/3 Page 2 BACKGROUND At ACC/SWR/1993/3 Page 3 What are the OBJECTIVES of a United Nations
SUMMARY OF SITE USE AUTHORIZATION REQUIREMENTS FOR WASHINGTON DEPARTMENT OF NATURAL RESOURCES DREDGED MATERIAL MANAGEMENT PROGRAM OFFICE
 6/1/09 Final DMMP CLARIFICATION PAPER: SUMMARY OF SITE USE AUTHORIZATION REQUIREMENTS FOR WASHINGTON DEPARTMENT OF NATURAL RESOURCES DREDGED MATERIAL MANAGEMENT PROGRAM OFFICE Prepared by: Courtney Wasson
Fall Chinook Distribution
 Page 1 of 22 Fall Chinook Distribution File Geodatabase Feature Class Tags Fall Chinook, Fish Distribution, Washington, Idaho, Columbia River Basin, Pacific Northwest, Oregon, Montana, Project Summary
Study of Water Quality of Utah Lake Tributaries and the Jordan River Outlet for the Calibration of the Utah Lake Water Salinity Model (LKSIM)
") Brigham Young University BYU ScholarsArchive All Theses and Dissertations 2012-03-13 Study of Water Quality of Utah Lake Tributaries and the Jordan River Outlet for the Calibration of the Utah Lake Water
Brigham Young University BYU ScholarsArchive All Theses and Dissertations 2012-03-13 Study of Water Quality of Utah Lake Tributaries and the Jordan River Outlet for the Calibration of the Utah Lake Water
Comparison of multiple point and single point calibration performance for the Saginaw River Watershed
 Comparison of multiple point and single point calibration performance for the Saginaw River Watershed Fariborz Daneshvar, A 1. Pouyan Nejadhashemi 1, Matthew R. Herman 1 1 Department of Biosystems and
Introducion to Hydrologic Engineering Centers River Analysis System (HEC- RAS) Neena Isaac Scientist D CWPRS, Pune -24
 Neena Isaac Scientist D CWPRS, Pune -24") Introducion to Hydrologic Engineering Centers River Analysis System (HEC- RAS) Neena Isaac Scientist D CWPRS, Pune -24 One dimensional river models (1-D models) Assumptions Flow is one dimensional Streamline
Introducion to Hydrologic Engineering Centers River Analysis System (HEC- RAS) Neena Isaac Scientist D CWPRS, Pune -24 One dimensional river models (1-D models) Assumptions Flow is one dimensional Streamline
GPU - Next Generation Modeling for Catchment Floodplain Management. ASFPM Conference, Grand Rapids (June 2016) Chris Huxley
 Chris Huxley") GPU - Next Generation Modeling for Catchment Floodplain Management ASFPM Conference, Grand Rapids (June 2016) Chris Huxley Presentation Overview 1. What is GPU flood modeling? 2. What is possible using
GPU - Next Generation Modeling for Catchment Floodplain Management ASFPM Conference, Grand Rapids (June 2016) Chris Huxley Presentation Overview 1. What is GPU flood modeling? 2. What is possible using
B O N N E V I L L E A D M I N I S T R A T I O N B O N N E V I L L E P O W E R A D M I N I S T R A T I O N
 B O N N E V I L L E A D M I N I S T R A T I O N B O N N E V I L L E P O W E R A D M I N I S T R A T I O N NERC Monitoring and Situational Awareness Conference Bonneville Power Administration Loss of EMS:
v Prerequisite Tutorials GSSHA Modeling Basics Stream Flow GSSHA WMS Basics Creating Feature Objects and Mapping their Attributes to the 2D Grid
 v. 10.1 WMS 10.1 Tutorial GSSHA Modeling Basics Developing a GSSHA Model Using the Hydrologic Modeling Wizard in WMS Learn how to setup a basic GSSHA model using the hydrologic modeling wizard Objectives
Reliability & Resiliency in the US Capitol Region/Hardening the Grid One Year after Hurricane Sandy
 1 Reliability & Resiliency in the US Capitol Region/Hardening the Grid One Year after Hurricane Sandy 2 Pepco D.C. Distribution System 260,000 Customers 175,000 Customers Supplied by Underground System
DATABASE ON SALINITY PATTERNS IN FLORIDA BAY *
 DATABASE ON SALINITY PATTERNS IN FLORIDA BAY * N. Rishe, M. Chekmasov, M. Chekmasova, D. Hernandez, A. Roque, N. Terekhova, A. Zhyzhkevych High Performance Database Research Center, School of Computer
Quality Control Concepts for LiDAR
 Quality Control Concepts for LiDAR January 24, 2012 Engineering Architecture Design-Build Surveying GeoSpatial Solutions Presentation Objectives Offer realistic and constructive advice for LiDAR project
The 2007 Annual Report of the West Penn Power Sustainable Energy Fund
 The 2007 Annual Report of the West Penn Power Sustainable Energy Fund PREPARED BY: JOEL L. MORRISON THE PENNSYLVANIA STATE UNIVERSITY (814) 865-4802 WPPSEF@EMS.PSU.EDU SUBMITTED BY: THE WEST PENN POWER
PCSWMM 2002 RUNOFF Block PAT AVENUE Storm Drainage Design
 PCSWMM 2002 RUNOFF Block PAT AVENUE Storm Drainage Design A Hello World Example Prepared by Robert Pitt and Alex Maestre, Department of Civil Engineering, University of Alabama April 10, 2002 Introduction
Environmental Impact Questionnaire
 Community Development Department 11 English Street Petaluma, CA 94952 Phone: 707-778-4301 Email: cdd@ci.petaluma.ca.us Web: www.cityofpetaluma.net/cdd Building Geographic Information Systems Housing Neighborhood
SIEREM: an environmental information system for water resources
 Climate Variability and Change Hydrological Impacts (Proceedings of the Fifth FRIEND World Conference held at Havana, Cuba, November 2006), IAHS Publ. 308, 2006. 19 SIEREM: an environmental information
The HEC-RAS Model Refresher
 The HEC-RAS Model Refresher Minmin Shu P.E. Transportation Review Unit Water Resources Division Michigan Department of Environmental Quality 12-6-2018 What Does the HEC-RAS Mean RAS----River Analysis System
DAILY FLOW ROUTING WITH THE MUSKINGUM-CUNGE METHOD IN THE PECOS RIVER RIVERWARE MODEL
 DAILY FLOW ROUTING WITH THE MUSKINGUM-CUNGE METHOD IN THE PECOS RIVER RIVERWARE MODEL Craig B. Boroughs, P.E., Project Hydraulic Engineer, Tetra Tech, Inc., Brecenridge, CO Edie Zagona, P.E., Ph.D., Research
QUALITY CONTROL FOR UNMANNED METEOROLOGICAL STATIONS IN MALAYSIAN METEOROLOGICAL DEPARTMENT
 QUALITY CONTROL FOR UNMANNED METEOROLOGICAL STATIONS IN MALAYSIAN METEOROLOGICAL DEPARTMENT By Wan Mohd. Nazri Wan Daud Malaysian Meteorological Department, Jalan Sultan, 46667 Petaling Jaya, Selangor,
Tom Achtor, Tom Rink, Tom Whittaker. Space Science & Engineering Center (SSEC) at the University of Wisconsin - Madison
 at the University of Wisconsin - Madison") Interactive Processing of Multi- and Hyper-spectral Environmental Satellite Data: The Next Generation of McIDAS EUMETSAT-AMS Conf. Amsterdam, NL 27 September 2007 Tom Achtor, Tom Rink, Tom Whittaker Space
Interactive Processing of Multi- and Hyper-spectral Environmental Satellite Data: The Next Generation of McIDAS EUMETSAT-AMS Conf. Amsterdam, NL 27 September 2007 Tom Achtor, Tom Rink, Tom Whittaker Space
WMS 10.0 Tutorial Hydraulics and Floodplain Modeling HY-8 Modeling Wizard Learn how to model a culvert using HY-8 and WMS
 v. 10.0 WMS 10.0 Tutorial Hydraulics and Floodplain Modeling HY-8 Modeling Wizard Learn how to model a culvert using HY-8 and WMS Objectives Define a conceptual schematic of the roadway, invert, and downstream
Synthetic Aperture Radar (SAR) Polarimetry for Wetland Mapping & Change Detection
 Polarimetry for Wetland Mapping & Change Detection") Synthetic Aperture Radar (SAR) Polarimetry for Wetland Mapping & Change Detection Jennifer M. Corcoran, M.S. Remote Sensing & Geospatial Analysis Laboratory Natural Resource Science & Management PhD Program
Synthetic Aperture Radar (SAR) Polarimetry for Wetland Mapping & Change Detection Jennifer M. Corcoran, M.S. Remote Sensing & Geospatial Analysis Laboratory Natural Resource Science & Management PhD Program
SIEREM: an environmental information system for water resources
 Climate Variability and Change Hydrological Impacts (Proceedings of the Fifth FRIEND World Conference held at Havana, Cuba, November 2006), IAHS Publ. 308, 2006. 19 SIEREM: an environmental information
FY 2007 SUMMARY USACE / SCA CONSERVATION INTERN & CREW PARTNERSHIPS
 FY 2007 SUMMARY USACE / SCA CONSERVATION INTERN & CREW PARTNERSHIPS KENTUCKY Buckhorn Lake 12week intern: 05/21/2007-08/13/2007 Responsibilities Include: Assist Park Ranger staff in the establishment of