AFTERACCESS: ICT ACCESS AND USE IN INDIA AND THE GLOBAL SOUTH
|
|
|
- Debra Stanley
- 5 years ago
- Views:
Transcription
1 AFTERACCESS: ICT ACCESS AND USE IN INDIA AND THE GLOBAL SOUTH A REPORT BASED ON NATIONALLY REPRESENTATIVE SURVEYS OF HOUSEHOLDS AND INDIVIDUALS CONDUCTED BY DIRSI, LIRNEASIA AND RESEARCH ICT AFRICA LIRNEASIA, AUGUST 2018 AfterAccess India 1
![The research reported here was conducted by LIRNEasia, an ICT [information and communication technology] policy and regulation think tank working in the Asia-Pacific.](/docs-images/90/101605736/images/2-0.jpg "LIRNEasia has been active in India since 2005, conducting both demand- and supply-side research as well as advocating for policy changes in the telecom sector on issues ranging from USO reform to ADC")
2 The research reported here was conducted by LIRNEasia, an ICT [information and communication technology] policy and regulation think tank working in the Asia-Pacific. LIRNEasia has been active in India since 2005, conducting both demand- and supply-side research as well as advocating for policy changes in the telecom sector on issues ranging from USO reform to ADC removal, and more. For more information, visit lirneasia.net or follow The AfterAccess surveys are conducted by pro-poor sister-networks across the Global South with support from the International Development Research Center (IDRC) of Canada and the Swedish International Development Cooperation Agency (SIDA). Our surveys are nationally representative and use methodology that is comparable across the countries. This currently includes completed surveys in 18 countries: six in Asia, seven in Africa, and five in Latin America. An additional four countries are being surveyed at present, making it the most comprehensive database on mobile phone and Internet access and use in the Global South. The currently available data was collected via 90-minute face-to-face interviews with 38,005 households and individuals, and allows for disaggregation by gender, rural or urban setting, and age among other factors. Data from 16 of the first 18 countries are presented in this report. The research for this report was conducted between April 2017 and February 2018 by LIRNEasia in Asia, Research ICT Africa (researchictafrica.net) in Africa and DIRSI (dirsi.net) in Latin America. For more information visit afteraccess.net or follow LIRNEasia, July 2018July 2018 Suggested citation for this report: LIRNEasia. (2018). AfterAccess India: ICT access and use in India and the Global South (Version 1). Colombo: LIRNEasia
3 table of contents highlights 4 about the study 5 about AfterAccess 6 AfterAccess in India 7 sample size determination 7 weighting of data 8 sampling and survey methodology 8 note on reading this report 9 connectivity 10 mobile ownership 11 handset type 15 new adopters 17 multiple SIM ownership 19 internet awareness and use 20 app use 29 social media 31 social media 32 public Wi-Fi 38 public Wi-Fi 39 market share and mobile expenditure 44 market share 45 mobile expenditure 46 online harassment 48 online harassment 49 e-commerce 57 mobile money 58 platforms 59
4 highlights 61% of Indians aged own mobile phones Just 28% of these phones are smartphones, 16% feature phones, and the majority (55%) are basic phones, therefore have no internet capability There is a 22% gap between urban and rural populations in mobile ownership, the largest gap among the Asian countries studied 65% still don t know what the Internet is; 81% claim not to use it Just 15% use social media 9% of Indian social media users report being bullied online; 7% report being faced with inappropriate or offensive material India performs best in Asian countries on platform use; mostly e-commerce, transport and ticket/ appointment platforms are being used. 4 AfterAccess India
5 about the study AfterAccess India 5

6 about the study About AfterAccess AfterAccess is a series of surveys of how individuals in 20+ countries of the Global South access and use ICTs. The surveys were conducted between April 2017 and February 2018 in 18 countries in Asia, Africa and Latin America via 38,005 face-to-face household and individual interviews lasting 90-minutes each. More countries are currently being added to the list. The objective of this global effort is to collect a range of household and individual data that can offer much greater insight into the demand-side barriers to digital equality, and in this way provide far more comprehensive national and regional evidence bases to inform policy and regulation. The surveys cover a wide range of topics related to mobile, Internet, social media and other platform use. AfterAccess is uniquely positioned to disrupt the current narratives of homogeneity in mobile and Internet access and use, illustrate the multifaceted challenges faced by the developing world, and identify precise points of policy intervention. The surveys are nationally representative in each country, for the age group, with a confidence margin of 95% and margin of error of approximately +/-3%. That is, the data can be extrapolated to the population in each country, producing estimates which will be within +/-3% of the actual levels. The methodology and sample sizes allow for disaggregated analysis of urban-rural populations, genders, and socio-economic groups at the national level. Comparable methodology and a (predominantly) common questionnaire were used across regions and countries. The research was conducted by LIRNEasia in Asia, DIRSI in Latin America and Research ICT Africa in Africa. AfterAccess countries covered and sample sizes. Note: Pakistan excludes AJK, FATA, Gilgit-Baltistan (~2% of population) 6 AfterAccess India

7 about the study AfterAccess in India In India, 5,000 households and individuals were surveyed from 250 wards and villages in 19 states and 108 districts (all randomly selected). The fieldwork was conducted in October-November 2017, by an international market research company, with supervision of all field activities by LIRNEasia. The data are representative of households in India as well as the population aged 15-65, i.e., can be extrapolated to those groups on a national level with statistical confidence. The data can be analyzed with statistical confidence by urban-rural, gender, socio-economic grouping and age groups at a national level. The data cannot be analyzed by state or district level, as the sample was not designed with that intention. Sample size determination The desired level of accuracy was set to a confidence level of 95% and an absolute precision (relative margin of error) of 3%. The population proportion P was set conservatively to 0.5, which yields the largest sample size. The minimum sample size (n) was determined by the following equation: AfterAccess India sample locations, based on GPS coordinates recorded during fieldwork Inserting the parameters for the survey yields the minimum sample size for simple random sampling. Depending on the sampling method for the survey, the minimum sample size will have to be multiplied by the design effect variable. In the absence of empirical data from previous surveys that would have suggested a different value, the default value of 2 is chosen for the design effect. This yields then, a minimum sample size of 768 per country for households and individuals. The actual sample size for countries was slightly larger than the minimum requirement to compensate for clustering AfterAccess India 7
, the sample")
8 about the study effects, and allows for urban/rural disaggregation of data, as well as genderbased disaggregation. However, in the case of India, given the size and complexity of the country, and the adjustments required to balance sample spread with practical constraints (finite time and resources), the sample size was further increased to 5,000. Weighting of data Two weights were constructed, one for households, and one for individuals. The weights are based on the inverse selection probabilities. The weights gross up the data to national level. Sampling and survey methodology Household and individual surveys were conducted in 5,000 households across India. The sampling methodology has been designed to ensure representation of the target group (population aged 15-65) at a national level with 95% confidence interval and a +/- 3.5 % margin of error. The sample size allows for disaggregation of data by urban-rural, gender and socio-economic classification at the national level. The method was developed using ward (urban) and village (rural) level data from the 2011 National Primary Census Abstract Data. The sampling process contained several steps, and multiple levels of selection, but at every level of selection, randomness was maintained, thus ensuring representation. The data was collected using mobile devices, and uploaded and reviewed on a daily basis, with live monitoring of GPS locations of survey teams. AfterAccess India sampling procedure PSU= Primary sample unit (ward or village) PPS= probability proportionate to size sampling Raw data collected was then weighted using 2017 national population estimates to correct for over- and under-sampling of certain population subgroups. 8 AfterAccess India
, at current international dollars. This is based on World Bank data for the year 2017 1, as shown in the Table.")
9 about the study Note on reading this report The ordering of the survey countries presented in each chart and table of this report is based on descending GNI per capita (Purchasing power parity, or PPP terms), at current international dollars. This is based on World Bank data for the year , as shown in the Table. Each data table or graph from the survey data is accompanied by the relevant survey question, and a table of sample bases for each tabulation. Where the number of respondents is low, the base is highlighted and where the number of respondents is insufficient for interpretation, the data is excluded. 1 AfterAccess India 9
10 connectivity 10 AfterAccess India

11 connectivity Mobile ownership Sixty-one percent of Indians aged own a mobile phone. Computer use is far behind no more than 6% of the same population group. India still has a significant urban-rural gap in mobile phone ownership, with rural dwellers 22% less likely to own a mobile than urban a larger gap than in other Asian country surveyed. India also has the highest gender gap in mobile ownership among the countries surveyed women in India are 46% less likely than men to own mobiles. Despite this, it is promising that approximately half of Indians between the ages of 15 and 65 who have either below-average or zero income (mostly women and those below 25 years) do own a phone. AfterAccess India 11

12 connectivity 12 AfterAccess India

13 connectivity AfterAccess India 13

14 connectivity 14 AfterAccess India

15 connectivity Handset type The Indian mobile market (along with those of most of the lower income countries) still predominantly comprises basic phones, with no, or limited Internet capability. Just 28% of mobile phone owners have smartphones, less than some of the poorer countries surveyed. As expected, smartphone ownership among urban respondents was higher at 40% than among rural respondents at 20%. The gender gap was not as high in device type as compared to mobile ownership, noted earlier. Forty-seven percent of Indian men aged and 40% of women had an Internet-enabled phone (i.e., smartphone or feature phone). It appears that the bigger hurdle is for women to get connected (become mobile phone owners); thereafter they are almost as likely as men to get an Internet-enabled phone. AfterAccess India 15

16 connectivity 16 AfterAccess India

17 connectivity New adopters Thirty-nine percent of current mobile owners only got connected in the past three years, predominantly from among rural dwellers, women and the lower-income-earners. AfterAccess India 17

18 connectivity 18 AfterAccess India


19 connectivity Multiple SIM ownership Twenty-six percent of Indian mobile owners aged had more than one active SIM card at the time of research; this includes a SIM which had been used in the 30 days preceding survey. Multiple-SIM ownership was higher among men, urban dwellers, those of the younger age groups and higherincome earners. AfterAccess India 19
20 connectivity Internet The lack of Internet awareness is a considerable problem in India, with just 35% of the population aware of what the Internet is. The level of use is thus even lower, at 19%. A similar pattern was seen in most of the lower income countries, particularly in Asia. The urban-rural and gender gaps in Internet use are large. Internet users are more from the higher income and higher education level brackets, and particularly from among smartphone owners. Feature phone owners are not users of the Internet. Internet use was closely associated with social media use; in fact, when most Internet users were asked what they do on the Internet, the most popular response was social media. Small percentages of the populations (just 10% in India) use the Internet for work. A lack of awareness of what the Internet is, is the key barrier to Internet use, with more than two-thirds of Internet non-users in India citing this as the reason for non-use. The lack of awareness was higher among expected groups (rural, women, low income) but surprisingly there was some non-awareness even among current smartphone owners who don t use the Internet. 20 AfterAccess India
21 connectivity AfterAccess India 21
22 connectivity 22 AfterAccess India

23 connectivity AfterAccess India 23

24 connectivity 24 AfterAccess India
25 connectivity AfterAccess India 25

26 connectivity 26 AfterAccess India

27 connectivity AfterAccess India 27
28 connectivity 28 AfterAccess India
.")
29 connectivity App use The highest reported use of mobile apps (48% of Indian mobile owners aged 15-65) was for social networking apps such as Facebook, Whatsapp, Instagram, etc. Social networking was the highest use in most countries. Messaging/chat applications were the next most popular in India (46%). Other entertainment and game apps were also used by Indian mobile owners. The use of more utilitarian apps (e.g., education, trading, transportation, etc.) was less frequent among Indian mobile owners. AfterAccess India 29

30 connectivity 30 AfterAccess India
31 social media AfterAccess India 31
32 social media Social media As seen in the previous sections, social media was the most popular use of the Internet on mobiles, used by 48% of mobile owners. However, its use was not evenly spread across all. The rural, women, less educated and those with lower incomes lagged behind in their use. Social media use was seen almost entirely among smartphone owners in India. Social media is mostly used for keeping in touch with family and friends as well as chatting (text) and calls. The majority of social media users are willing to share their name, gender, age etc. on social media, and even contact information; however, users are more guarded when it comes to religious and political views as well as sexual orientation. Fifty-eight percent of Indian social media users do not trust the news that they read on social media. 32 AfterAccess India
33 social media AfterAccess India 33

34 social media 34 AfterAccess India

35 social media AfterAccess India 35

36 social media 36 AfterAccess India

37 social media AfterAccess India 37
38 public Wi-Fi 38 AfterAccess India

39 public Wi-Fi Public Wi-Fi Public Wi-Fi is used by 42% of Indian Internet users between the ages of 15 and 65. At least half of these users make use of free Wi-Fi. A larger share of rural Internet users make use of the free public Wi-Fi than urban ones; the latter more often use paid hotspots. Male Internet users more often made use of free public Wi-Fi, as well as those from higher SECs. The relationship with age appears to be some-what a U-shaped one for Indian Internet users, where the youngest (15-25) and oldest (55-65) use free public W-Fi more often than the middle age groups (e.g., those earning, with less time and flexibility, etc.) AfterAccess India 39
40 public Wi-Fi 40 AfterAccess India

41 public Wi-Fi AfterAccess India 41

42 public Wi-Fi 42 AfterAccess India

43 public Wi-Fi 43 AfterAccess India AfterAccess India 43
44 market share and mobile expenditure 44 AfterAccess India
. Source: AfterAccess survey; www.trai.gov.")
45 market share and mobile expenditure Market share The primary SIM card (26% had more than one) used by Indian mobile owners in the population indicates a greater market concentration among the largest three players in terms of which they use the most, compared to supply-side data published by TRAI). Source: AfterAccess survey; Q: What is the name of your main operator (SIM card you use most often)? Base: All mobile subscribers, India (3,252) AfterAccess India 45
46 market share and mobile expenditure Mobile expenditure The average amount spent monthly by Indian mobile owners on services (including voice, SMS and data) was USD2.3 (approximately INR 149.6) at the time of survey (October-November 2017). The industry ARPU at the end of September 2017 was INR89 2, or USD The discrepancy can be accounted for by the fact that in the demand side data, the average is calculated based on the number of unique subscribers, while the APRUs (supply-side) are calculated based on the number of active SIMs, which we know from the survey is a larger number than that of unique subscribers (26% of mobile owners had more than one SIM). Another factor is the survey target group being those aged only. Note: Expenditure data not available for Argentina, Peru, Paraguay and Guatemala AfterAccess India

47 market share and mobile expenditure 47 AfterAccess India AfterAccess India 47
48 online harassment 48 AfterAccess India
49 online harassment Online harassment Respondents were asked about forms of harassment faced when online. The most common form experienced was being called offensive names. Harassment levels (reported by respondents) were slightly different at urban than rural level. Interestingly, the levels reported by women versus men were also different where men are experience more online harassment compared to women in India. The common perceived motivations for harassment were gender, religion or race and politics, and harassment was most often experienced on social media. When asked what effect the harassment had on the respondent, the most common response was It had no effect. However, 28% of India respondents who experienced online harassment said the incident/s reduced their use of the particular website. AfterAccess India 49
50 online harassment 50 AfterAccess India

51 online harassment AfterAccess India 51
52 online harassment 52 AfterAccess India

53 online harassment AfterAccess India 53

54 online harassment 54 AfterAccess India

55 online harassment AfterAccess India 55
56 online harassment 56 AfterAccess India
57 e-commerce AfterAccess India 57
58 e-commerce Mobile money On a percentage basis, the use of mobile money by mobile phone owners is very low. Just 4% use mobile banking, 1% use mobile money and a further 1% use both. Despite large numbers of registered users reported in the media on major payment platforms, the country performs poorly in this respect, especially when compared to some of the other countries surveyed. However, when asked if mobile owners use payment gateway apps on their mobiles, 15% of Indian mobile owners aged indicated that they did (see section on mobile app use). 58 AfterAccess India
59 e-commerce Platforms Buying Internet users were asked if they were aware of Internet websites or mobile apps to buy and sell goods or services that they need. This could include apps such as Uber, Lyft, AliExpress and Upwork.com, as well as social media such as Facebook and Instagram. The responses show that Indian Internet users have the highest levels of awareness among the Asian countries. Awareness was high particularly with regard to buying and selling goods and services (through platforms such as Amazon, AliExpress, ebay, etc.), buying/selling tickets and appointments, and transport and ridesharing apps. Almost half of India s Internet users were aware of these. When it came to actual use as well, India had the highest number of users (out of those aware of the platforms) in Asia, mostly with respect to the same three type s noted earlier (goods/products, transport services, tickets and appointments). Convenience and better prices were the key drivers for use. In the last three months, most had made less than three transactions; heavy use was not widespread. Just 16% of users completed the full transaction (search, order, payment and delivery) within the platform many only used the platform for search and order. The reasons for this ranged from lack of a need to do so (they have access to sufficient offline options), concerns about sharing personal details with third parties, and concerns regarding the quality of the product. Not knowing how to use these platforms was also a problem for some. Payments were most often done through debit cards and cash-on-delivery among, with some stating they used mobile and/or internet banking. Awareness was seen to be a barrier to greater uptake, 49% of those who are aware of these platforms said they did not know how to use them. AfterAccess India 59

60 e-commerce 60 AfterAccess India

61 e-commerce AfterAccess India 61

62 e-commerce 62 AfterAccess India

63 e-commerce AfterAccess India 63
64 e-commerce 64 AfterAccess India

65 e-commerce AfterAccess India 65
66 e-commerce 66 AfterAccess India

67 e-commerce AfterAccess India 67
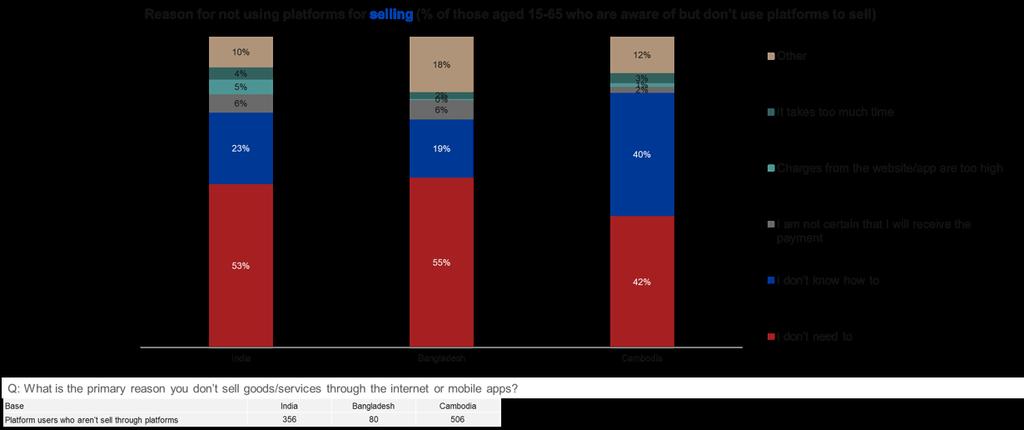
68 e-commerce Selling Respondents who are aware of platforms were asked whether they have used them to sell products or services. Low usage of platforms to sell products or services were observed. Better job rates/prices and getting access to a larger number of customers were the key drivers for use. More than 25% of users had sold five or more product or services over the last three months. Just 12% of users completed the full transaction (search, order, payment and delivery) within the platform many only used the platform to search for and accept jobs. The reasons for this ranged from lack of a need to do so (they have access to sufficient offline options) followed by not knowing how to accept orders and receive payments online. Concerns about sharing personal details with third parties and low online prices of goods/services were also problems for some. 56% of Indian platform users who sell, cash out their payments via mobile wallets or bank accounts belonging to someone else. Most of the users claimed that what they earn via selling goods or services online was not essential but nice to have. However, 24% claimed that the earnings are essential to them. Lack of need is the key reason for not using platforms to sell, and lack of knowledge was the second most common reason for non-usage. 68 AfterAccess India

69 e-commerce AfterAccess India 69
70 e-commerce 70 AfterAccess India
71 e-commerce AfterAccess India 71
72 e-commerce 72 AfterAccess India

73 e-commerce AfterAccess India 73
74 e-commerce 74 AfterAccess India
75 e-commerce AfterAccess India 75
76
77 AfterAccess India 77
78 LIRNEasia is a pro-poor, pro-market think tank working in the Asia-Pacific region. The AfterAccess surveys are conducted by pro-poor sister-networks across the Global South with support from the International Development Research Center (IDRC) of Canada and the Swedish International Development Cooperation Agency (SIDA). Our surveys are nationally representative and use methodology that is comparable across the countries. This currently includes completed surveys in 18 countries: six in Asia, seven in Africa, and five in Latin America. An additional four countries are being surveyed at present, making it the most comprehensive database on mobile phone and Internet access and use in the Global South. The currently available data was collected via 38,005 face-to-face interviews of households and individuals, and allows for disaggregation by gender, rural or urban setting, and age among other factors.
Let the people speak: using evidence from the Global South to reshape our digital future. IGF 2017 Panel (WS188), Geneva
, Geneva") Let the people speak: using evidence from the Global South to reshape our digital future IGF 217 Panel (WS188), Geneva Methodology Desired level of accuracy set to a confidence level of 95% and an absolute
Let the people speak: using evidence from the Global South to reshape our digital future IGF 217 Panel (WS188), Geneva Methodology Desired level of accuracy set to a confidence level of 95% and an absolute
AfterAccess: ICT access and use in Asia and the Global South
 AfterAccess: ICT access and use in Asia and the Global South A report based on nationally representative surveys of households and individuals conducted by DIRSI, LIRNE asia and Research ICT Africa Version
Teleuse on a Shoestring
 Teleuse on a Shoestring LIRNEasia Media Workshop Singapore. 28 February 2007 Agenda Research methodology & key findings: Harsha de Silva The SMS story and others Lorraine Carlos Salazar The next billion
The next billion customers
 The next billion customers Ayesha Zainudeen zainudeen@lirne.net LIRNEasia Media Workshop: Singapore 28 February 2007 fieldwork by funded by IDRC Agenda Research methodology & key findings: Harsha de Silva
WSIS and ICTs: what contributions to Development and SDG?
 WSIS and ICTs: what contributions to Development and SDG? Helani Galpaya UN-DESA 19 th Session Geneva, May 2016 This work was carried out with the aid of a grant from the International Development Research
Teleuse at the bottom of the pyramid data booklet
 Teleuse at the bottom of the pyramid data booklet Findings from a six-country study in emerging Asia www.lirneasia.net Teleuse at the bottom of the pyramid data booklet Findings from a six-country study
GLOBAL MOBILE PAYMENT METHODS: FIRST HALF 2016
 PUBLICATION DATE: OCTOBER 2016 PAGE 2 GENERAL INFORMATION I PAGE 3 KEY FINDINGS I PAGE 4-8 TABLE OF CONTENTS I PAGE 9 REPORT-SPECIFIC SAMPLE CHARTS I PAGE 10 METHODOLOGY I PAGE 11 RELATED REPORTS I PAGE
Mobile Messaging Apps Study : India. August 2014
 Mobile Messaging Apps Study : India August 2014 Contents 1. Research Objectives & Methodology 2. Key Findings 3. Mobile Consumption Behavior 4. Message Apps Usage & Behaviors Download Intent App Awareness
Connected Women. Methodology. The Mobile Gender Gap Report Copyright 2018 GSM Association
 Connected Women Methodology The Mobile Gender Gap Report 2018 Copyright 2018 GSM Association GSMA Connected Women The GSMA represents the interests of mobile operators worldwide, uniting nearly 800 operators
Smartphone Ownership 2013 Update
 www.pewresearch.org JUNE 5, 2013 Smartphone Ownership 2013 Update 56% of American adults now own a smartphone of some kind; Android and iphone owners account for half of the cell phone user population.
November 2016 G. Oscar Anderson, Senior Research Advisor AARP Research
 November 2016 G. Oscar Anderson, Senior Research Advisor AARP Research https://doi.org/10.26419/res.00140.001 AARP is a nonprofit, nonpartisan organization, with a membership of nearly 38 million that
Survey Questions and Methodology
 Survey Questions and Methodology Spring Tracking Survey 2012 Data for March 15 April 3, 2012 Princeton Survey Research Associates International for the Pew Research Center s Internet & American Life Project
INDIA DIGITAL STATSHOT KEY STATISTICAL INDICATORS FOR INTERNET, MOBILE, AND SOCIAL MEDIA USAGE IN INDIA IN AUGUST 2015 SIMON KEMP WE ARE SOCIAL
 we are social DIGITAL STATSHOT INDIA KEY STATISTICAL INDICATORS FOR INTERNET, MOBILE, AND SOCIAL MEDIA USAGE IN INDIA IN AUGUST 2015 SIMON KEMP WE ARE SOCIAL We Are Social We Are Social 2015 DIGITAL IN
The Rise of the Connected Viewer
 JULY 17, 2012 The Rise of the Connected Viewer 52% of adult cell owners use their phones while engaging with televised content; younger audiences are particularly active in these connected viewing experiences
The Gender Digital Divide in ASEAN. The Bangkok Brothers, Thailand
 The Gender Digital Divide in ASEAN The Bangkok Brothers, Thailand Rationale Timeline The UN launched MDGs. MDG3: Promote Gender Equality and Empower Women 1990 2 The impact of MDG3 was measured Huge gender
Mobile Access July 7, 2010 Aaron Smith, Research Specialist.
 Mobile Access 2010 Six in ten Americans go online wirelessly using a laptop or cell phone; African-Americans and 18-29 year olds lead the way in the use of cell phone data applications, but older adults
The Inclusive Internet Index (3i)
") 1 . The Inclusive Internet Index (3i) In-depth look at the global state of Internet connectivity and inclusiveness. This is the second year of the index, designed to build a time series of important data.
1 . The Inclusive Internet Index (3i) In-depth look at the global state of Internet connectivity and inclusiveness. This is the second year of the index, designed to build a time series of important data.
NANOS SURVEY NANOS SURVEY
 Canadians are three times more likely to say Canada should ban than allow Huawei from participating in the 5G network in Canada National survey released August, 2018 Project 2018-1260A Summary Fifty-four
The Mobile Gender Gap Report 2019
 Connected Women The Mobile Gender Gap Report 2019 Copyright 2019 GSM Association GSMA Connected Women The GSMA represents the interests of mobile operators worldwide, uniting more than 750 operators with
Survey Questions and Methodology
 Survey Questions and Methodology Winter Tracking Survey 2012 Final Topline 02/22/2012 Data for January 20 February 19, 2012 Princeton Survey Research Associates International for the Pew Research Center
4 USE OF ACCOUNTS. Use of accounts for digital payments. What are the overall changes since 2014?
 4 USE OF ACCOUNTS Owning an account is an important first step toward financial inclusion. But to fully benefit from having an account, people need to be able to use it in safe and convenient ways. This
INTRODUCTION. In this summary version, we present some of the key figures and charts.
 1 INTRODUCTION GWI Market reports track key digital behaviors and penetration levels at a national level, providing the very latest figures for topline engagement as well as analyzing patterns across demographic
CHAPTER 3 RESEARCH METHODOLOGY OF THE STUDY
 CHAPTER 3 RESEARCH METHODOLOGY OF THE STUDY 3.1 Introduction: In this chapter, an endeavor is made to portray the various aspects of the research methodology adopted for this study purpose. The aim of
86.1% of the population aged 16 to 74 have used the Internet in the last three months. 72.1% do it on a daily basis
 07 November 2018 Survey on Equipment and Use of Information and Communication Technologies (ICT) in Households. Year 2018 86.1% of the population aged 16 to 74 have used the Internet in the last. 72.1%
SMS VAS USAGE IN INDIA
 With the advent of Smartphones, everyone today is talking about Internet on mobiles, 3G speeds etc. However, SMS, a traditional short message service on mobile, even today is pretty much the most frequently
The Mobile Gender Gap Report 2018
 Connected Women The Mobile Gender Gap Report 2018 Copyright 2018 GSM Association GSMA Connected Women The GSMA represents the interests of mobile operators worldwide, uniting nearly 800 operators with
To Study the Usage & Awareness of M- Commerce and its services with reference to Nagpur City
 To Study the Usage & Awareness of M- Commerce and its services with reference to Nagpur City Prof. Prerna Thakwani Assistant Professor, Dept. of MBA, Tirpude Institute of Management Education, Nagpur,
MOBILE OPPORTUNITIES: POVERTY AND ACCESS TO TELEPHONY
 MOBILE OPPORTUNITIES: POVERTY AND ACCESS TO TELEPHONY IN LATIN AMERICA AND THE CARIBBEAN Trinidad and Tobago Executive Summary This work was carried out with the financial support from a grant given to
Welcome! Today s program
 Game of Phones Mobile Consumer Survey 18 October 2016 Welcome! Today s program Hour Item 08.00-08.10 Introductory remarks by on behalf of the Aga Khan University, Graduate School of Media and Communications
Regional Focus: Asia Pacific - the world's largest mobile phone market
 Regional Focus: Asia Pacific - the world's largest mobile phone market Euromonitor International 10 March 2010 Asia Pacific has the highest number of mobile phone subscriptions of all world regions, yet
Flash Eurobarometer 468. Report. The end of roaming charges one year later
 The end of roaming charges one year later Survey requested by the European Commission, Directorate-General for Communications Networks, Content & Technology and co-ordinated by the Directorate-General
ITU s work on ICT measurement
 ITU s work on ICT measurement WTO Conference on the Use of Data in the Digital Economy 2-3 October 2017 Martin Schaaper Senior ICT Analyst ICT Data and Statistics Division Telecommunication Development
of the pyramid mwomen Working Group November 9-10, Chennai, India
 ` The gendered use of telecom at the bottom of the pyramid Tahani Iqbal mwomen Working Group November 9-10, Chennai, India This work was carried out with the aid of a grant from the International Development
BY Laura Silver and Courtney Johnson
 FOR RELEASE OCTOBER 9, 2018 BY Laura Silver and Courtney Johnson FOR MEDIA OR OTHER INQUIRIES: Laura Silver, Senior Researcher Stefan Cornibert, Communications Manager 202.419.4517 RECOMMENDED CITATION
Almost half of all internet users now use search engines on a typical day
 Data Memo BY: Senior Research Fellow Deborah Fallows CONTACT: Associate Director Susannah Fox (202-419-4500) RE: Search Engine Use August 6, 2008 Almost half of all internet users now use search engines
MCA Market Research Consumer Perceptions Survey fixed broadband. April 2018
 MCA Market Research Consumer Perceptions Survey fixed broadband April 2018 DOCUMENT NAME Purpose The MCA Consumer Perception Surveys are carried out every two years to get insight on the preferences of
Note: All slides are under NDA
 1 Note: All slides are under NDA The Inclusive Internet Index (3i) In-depth look at the global state of Internet connectivity and inclusiveness. This is the second year of the index, designed to build
Sample: n=2,252 national adults, age 18 and older, including 1,127 cell phone interviews Interviewing dates:
 Survey Questions Spring 2013 Tracking Survey Final Topline 5/21/2013 Data for April 17-May 19, 2013 Princeton Survey Research Associates International for the Pew Research Center s Internet & American
Chapter 5: Spanning the Internet divide to drive development (ITU)
") Committed to Connecting the World Aid for Trade workshop 2017 Aid for trade monitoring and evaluation exercise 30 May, 2017, OECD, Paris Chapter 5: Spanning the Internet divide to drive development (ITU)
Committed to Connecting the World Aid for Trade workshop 2017 Aid for trade monitoring and evaluation exercise 30 May, 2017, OECD, Paris Chapter 5: Spanning the Internet divide to drive development (ITU)
Digital inclusion and resilient development
 Digital inclusion and resilient development Ayesha Zainudeen, Senior Research Manager Regional Expert Consultation on Connecting Asia Pacific s Digital Society for Building Resilience 5 6 September 2012,
Towards an understanding of ICT access and use in Africa
 Towards an understanding of ICT access and use in Africa Dr. Alison Gillwald Executive Director: Research ICT Africa Adjunct Professor - University of Cape Town, GSB, Management of Infrastructure Reform
The consumer mobile experience. Measuring the consumer experience of using Android mobile services
 Measuring the consumer experience of using Android mobile services RESEARCH REPORT Publication Date: 9 May 2018 About this document Ofcom has researched consumers experience of using mobile phones by collecting
THE STATE OF ONLINE VIDEO 2017
 EXPERIENCE FIRST MARKET RESEARCH THE STATE OF ONLINE VIDEO 2017 The State of Online Video is Limelight Networks latest in a series of surveys that explores consumer perceptions and behaviors around digital
Consumer Preferences in Narrowband Communications Research Report
 Consumer Preferences in Narrowband Communications Research Report Research Document Publication date: 19 March 9 Main Heading Contents Section Page 1 Executive summary 1 2 Methodology 5 3 Market context
CONSUMERLAB. Liberation from location. Consumers developing place-agnostic internet habits
 CONSUMERLAB Liberation from location Consumers developing place-agnostic internet habits An Ericsson Consumer Insight Summary Report October 2014 contents THE NEED TO KNOW 3 CONVERGING HABITS 4 FREEDOM
Measuring digital inequality in SA
 Measuring digital inequality in SA Alison Gillwald (PhD) Executive Director: Research ICT Africa Data enquiries:onkokame Mothobi (PhD) omothobi@researchictafrica.net WEF Internet for All Data Working Group
Mobile Internet & Smartphone Adoption
 Mobile Internet & Smartphone Adoption New Insights into Consumer Usage of Mobile Devices, the Shift to Smartphones & the Emergence of Tablets United States (US), United Kingdom (UK), Germany (DE), France
The SAPS Johannesburg Area Police Transformation Survey Results
 The SAPS Johannesburg Area Police Transformation Survey Results by Gareth Newham Research report written for the Centre for the Study of Violence and Reconciliation, January 2005. Gareth Newham is a former
India:An Overview/Case Study
 India:An Overview/Case Study 27 February, 2009 Agenda epayment Industry: An Overview mpayment Ecosystem mpayment Learnings Indian Banking Overview Banks Total number of Banks 79 Total number of branches
Spring Change Assessment Survey 2010 Final Topline 6/4/10 Data for April 29 May 30, 2010
 Spring Change Assessment Survey 2010 Final Topline 6/4/10 Data for April 29 May 30, 2010 for the Pew Research Center s Internet & American Life Project Sample: n= 2,252 national adults, age 18 and older,
Research Report: Voice over Internet Protocol (VoIP)
") Research Report: Voice over Internet Protocol (VoIP) Statement Publication date: 26 July 2007 Contents Section Page 1 Executive Summary 1 2 Background and research objectives 3 3 Awareness of VoIP 5 4
Research Report: Voice over Internet Protocol (VoIP) Statement Publication date: 26 July 2007 Contents Section Page 1 Executive Summary 1 2 Background and research objectives 3 3 Awareness of VoIP 5 4
Click to edit Master title style
 Jon Snyder, CGAP Photo Contest FINANCIAL INCLUSION INSIGHTS 2018 Côte d Ivoire Click to edit Master title style Corinne Riquet - Bamba Peter Zetterli Financial Inclusion Insights 2018 Côte d Ivoire This
BY Aaron Smith and Kenneth Olmstead
 FOR RELEASE APRIL 30, 2018 BY Aaron Smith and Kenneth Olmstead FOR MEDIA OR OTHER INQUIRIES: Aaron Smith, Associate Director, Research Tom Caiazza, Communications Manager 202.419.4372 RECOMMENDED CITATION
Customers Response to Mobile Number Portability with Special Reference to Vodafone Customers in Rajakkad
 Customers Response to Mobile Number Portability with Special Reference to Vodafone Customers in Rajakkad Manesh S & Dr. Latha Bai VG NSS COLLEGE, RAJAKUMARI India INTRODUCTION Mobile number portability
INTERNATIONAL TELECOMMUNICATION UNION Telecommunication Development Bureau Telecommunication Statistics and Data Unit
 INTERNATIONAL TELECOMMUNICATION UNION Telecommunication Development Bureau Telecommunication Statistics and Data Unit 18 December 2002 Original: Spanish 3 rd World Telecommunication/ICT Indicators Meeting
LIFE IN THE FAST LANE
 CONSUMERLAB LIFE IN THE FAST LANE How network speed affects user behavior in Saudi Arabia An Ericsson Consumer Insight Summary Report June 2014 contents METHODOLOGY 2 BEHAVIORAL DIFFERENCES 3 A DIVERSE
Research Digest: Adding value at-destination for the end traveller
 Research Digest: Adding value at-destination for the end traveller Understanding the business travellers in-trip needs and the mobile services they aspire for. Introduction TNS, on behalf of Amadeus, conducted
Telecom use at the bottom of the pyramid in emerging Asia
 Telecom use at the bottom of the pyramid in emerging Asia M is for Mobile: Exploring mobiles technology for social development Sesame Workshop New Delhi, 1 March 2011 Ayesha Zainudeen This work was carried
NinthDecimal Mobile Audience Q Insights Report
 Q2 2012 Insights Report Table of Contents Connected Device Trends 2 Location-Based Behaviors 3-4 52% of on-the-go moms own a tablet 52 % Social Sharing Behaviors 5-7 Connected Device Adoption 8-9 Worldwide
Key takeaways. Beyond-voice services offer new revenue sources for operators Social influence a key factor in beyond-voice service adoption
 Mobiles beyond voice: identifying the conditions for use Ayesha Zainudeen, Senior Research Manager, LIRNEasia Dimuthu Ratnadiwakara, former Researcher, LIRNEasia CPRsouth5, Xi an, China This work was carried
The Demographics of Mobile News Habits
 December 11, 2012 The Demographics of Mobile News Habits Men, College Grads and the Young are more Engaged FOR FURTHER INFORMATION: Amy Mitchell, Acting Director, Pew Research Center s Project for Excellence
360 View on M-Commerce. Presented by S. Baranikumar
 360 View on M-Commerce Presented by S. Baranikumar Having multiple channels is important for the future 7 in 10 ecommerce consumers use their mobile phone or smartphone to research online and 1/10 use
More%than%one%third%of%mobile%consumers%comparison%shop%on%while%in5store%
 Table of Contents Location-Based Trends 2-3 Mobile Shopping Behavior 4-5 Connected Device Adoption 6-9 Worldwide Location Highlights 10-11 Special Report: Automotive 12-14 On-the-go consumers comparison
Client: LIRNE ASIA. Headline: Real potential for m-money in Bangladesh identified Publication: Financial Express Position: Page - 16,Column 1 to 3
 Headline: Real potential for m-money in Bangladesh identified Publication: Financial Express Position: Page - 16,Column 1 to 3 Language: English Colour/B&W: B & W Size: Column 3 x 5.5 Inches Headline:
T he Inbox Report REVEAL MORE CONSUMER PERCEPTIONS OF . Fluent LLC Inbox. Sent. Drafts. Spam. Trash. Click here to Reply
 Inbox 1 Fluent LLC Sent Drafts Spam Trash T he Inbox Report CONSUMER PERCEPTIONS OF EMAIL loading... REVEAL MORE Click here to Reply Inbox Report 2018 Americans are addicted to email.
MOBILE MARKETING ASSOCIATION CONSUMER INTEREST IN MOBILE BANKING: GERMANY FEBRUARY 2010
 MOBILE MARKETING ASSOCIATION CONSUMER INTEREST IN MOBILE BANKING: GERMANY FEBRUARY 2010 MMA CONSUMER BRIEFING: GERMANY Mobile Marketing Association, 2010. ABOUT MMA S LIGHTSPEED GERMANY CONSUMER BRIEFINGS:
Australia. Consumer Survey Mail Findings
 Australia Post Consumer Survey Mail Findings July 2012 Methodology The Australia Post Consumer Survey measures consumer attitudes and behaviours of interest to Australia Post, particularly mail (letters),
ITU EXPERT GROUP ON HOUSEHOLD INDICATORS (EGH) BACKGROUND DOCUMENT 3 PROPOSAL FOR A DEFINITION OF SMARTPHONE 1
 BACKGROUND DOCUMENT 3 PROPOSAL FOR A DEFINITION OF SMARTPHONE 1") ITU EXPERT GROUP ON HOUSEHOLD INDICATORS (EGH) BACKGROUND DOCUMENT 3 PROPOSAL FOR A DEFINITION OF SMARTPHONE 1 SUMMARY The added features and functionalities of smartphones provide additional opportunities
ITU EXPERT GROUP ON HOUSEHOLD INDICATORS (EGH) BACKGROUND DOCUMENT 3 PROPOSAL FOR A DEFINITION OF SMARTPHONE 1 SUMMARY The added features and functionalities of smartphones provide additional opportunities
Mobile Banking ~ Smart & Secure
 WHITEPAPER Mobile Banking ~ Smart & Secure This whitepaper is an extract from: Mobile Banking Handset & Tablet Market Strategies 2013-2017... information you can do business with Mobile Banking ~ Smart
SURVEY ON BROADBAND AND WIRELESS USAGE IN SINGAPORE 2002
 SURVEY ON BROADBAND AND WIRELESS USAGE IN SINGAPORE 2002 Summary Report Page 1 of 23 Infocomm Development Authority of Singapore 8 Temasek Boulevard #14-00 Suntec Tower Three Singapore 038988 Republic
ICT indicators: LIRNEasia's perspective
 ICT indicators: LIRNEasia's perspective Rohan Samarajiva www.lirneasia.net; rohan [at] lirneasia.net International Seminar on ICT Statistics Seoul, July 19 21, 2010 This work was carried out with the aid
DATA MEMO. The volume of spam is growing in Americans personal and workplace accounts, but users are less bothered by it.
 DATA MEMO BY: Senior Research Fellow Deborah Fallows DATE: May 2007 The volume of spam is growing in Americans personal and workplace email accounts, but email users are less bothered by it. Spam continues
Executive Summary on. Privacy Awareness Survey on Smartphones. and Smartphone Apps
 Executive Summary on Privacy Awareness Survey on Smartphones and Smartphone Apps Submitted to Office of the Privacy Commissioner for Personal Data By Centre for the Advancement of Social Sciences Research
Insights JiWire Mobile Audience Insights Report Q2 2012
 JiWire Mobile Audience Report JiWire Mobile Audience Report Table of Contents Connected Device Trends 2 Location-Based Behaviors 3-4 Social Sharing Behaviors 5-7 Connected Device Adoption 8-9 Worldwide
GSMA Digital Dividend Spectrum Low-Cost LTE Device. User Survey Final Report. Martin Garner Senior Vice President
 GSMA Digital Dividend Spectrum Low-Cost LTE Device User Survey Final Report Martin Garner Senior Vice President Agenda Executive summary Survey aims and approach Key findings Recommendations Country market
NTCA 2016 WIRELESS SURVEY REPORT
 NTCA 2016 WIRELESS SURVEY REPORT January 2017 DISCLAIMER: Data from the survey has been presented as reported. To get more information on this report please contact Rick Schadelbauer at NTCA (703-351-2019,
emarketer US Social Network Usage StatPack
 May 2016 emarketer US Social Network Usage StatPack Presented by Learning from Social Advertising Data Trends Video Views ONCE A USER WATCHES 25% OF A VIDEO, DO THEY Stop Watching Watch 50% Watch 75% Finish
GeoPoll Straw Poll Survey. African Millennials - Mobile Usage and Media Consumption
 African Millennials - Mobile Usage and Media Consumption Increased dependency on technology and a mobile first approach is being driven by African Millennials, this is according to a recent GeoPoll rapid
N.J. drivers continue to roll the dice with safety
 For immediate release Mon., Aug. 6, 2012 7 pp. Contacts: Dan Cassino 973.896.7072 Zach Hosseini (NJ DHTS) 609.984.2529 Rich Higginson 908.213.1971 N.J. drivers continue to roll the dice with safety Despite
A six country study of Teleuse at the bottom of the pyramid
 Profiling the BOP Teleuse@BOP3: A six country study of Teleuse at the bottom of the pyramid 11 December 2009 LIRNEasia@5 This work was carried out with the aid of a grant from the International Development
5 Internet and online content
 5 Internet and online content Communications Market Report 207 - Northern Ireland 5 Internet and online content 5. Internet take-up 5.2 Internet-enabled devices 5.3 Internet use 5 Internet and online content
The growth of the smartphone market in Kenya
 2015 Jumia Kenya // The Growth of the Smartphone Market in Kenya 1 The growth of the smartphone market in Kenya May 2015 Authored by: Sofia Zab, Head of Marketing, Jumia Kenya Abstract: The Kenyan smartphone
2018 Canadian consumer tech market. Executive summary
 2018 Canadian consumer tech market Executive summary Overall technology ownership trends The most popular consumer technology products in Canada continue to be televisions, smartphones, and laptops. Among
How App Ratings and Reviews Impact Rank on Google Play and the App Store
 APP STORE OPTIMIZATION MASTERCLASS How App Ratings and Reviews Impact Rank on Google Play and the App Store BIG APPS GET BIG RATINGS 13,927 AVERAGE NUMBER OF RATINGS FOR TOP-RATED IOS APPS 196,833 AVERAGE
Measuring sector performance: Instruments and impact
 Measuring sector performance: Instruments and impact Ayesha Zainudeen, Senior Research Manager Helani Galpaya, COO DIRSI: Telecommunications in Latin America 20 November 2010, Lima This work was carried
Promoting Trade, Inclusiveness and Connectivity for Sustainable Development
 Promoting Trade, Inclusiveness and Connectivity for Sustainable Development Setting the Scene CTD WORKSHOP 30 MAY 2017 1 Global Reviews of Aid for Trade Since 2007, successive Global Reviews of Aid for
Insights JiWire Mobile Audience Insights Report Q4 2012
 Table of Contents Mobile Audience Trends 2-6 Connected Device Adoption & Trends 7-10 Worldwide Location Highlights 11-12 Public Wi-Fi Trends 13 79.5 % of mobile consumers are influenced by the availability
Network performance through the eyes of customers
 ericsson.com/ mobility-report Network performance through the eyes of customers Extract from the Ericsson Mobility Report June 2018 2 Articles Network performance through the eyes of customers Understanding
Victim Personal Statements 2017/18
 Victim Personal Statements / Analysis of the offer and take-up of Victim Personal Statements using the Crime Survey for England and Wales, April to March. October Foreword A Victim Personal Statement (VPS)
Sample: n=2,252 national adults, age 18 and older, including 1,127 cell phone interviews Interviewing dates:
 Survey Questions Spring 2013 Tracking Survey Final Topline 5/21/2013 Data for April 17-May 19, 2013 Princeton Survey Research Associates International for the Pew Research Center s Internet & American
Paycards: Generational Trends Shaping the Future of Worker Pay
 Paycards: Generational Trends Shaping the Future of Worker Pay Exciting findings about generational perceptions of paycards and paycard features reveal appeal with Generation Z and Millennials Research
Tech Tracker + Social Networking module Quarterly Release: Q1 2012
 1 Tech Tracker + Social Networking module Quarterly Release: Q1 2012 Quarterly tracker into trends in tech ownership, internet access areas covered Social Network Internet usage and the connected home
1. Title: Case Study: Successful App Genres in India Subtitle: The most popular types of apps with daily active users
 1. Title: Case Study: Successful App Genres in India Subtitle: The most popular types of apps with daily active users 2. Title: Successful App Categories in India Subtitle: The top 5 app categories with
Contents. 1. Survey Background and Methodology. 2. Summary of Key Findings. 3. Survey Results. 4. Appendix
 Mobile Trends 2014 Contents 1. Survey Background and Methodology 2. Summary of Key Findings 3. Survey Results 4. Appendix 2 Research Methodology Method Sample Size Online survey programmed and hosted by
Measuring Internet development in Africa from a content use, hosting and distribution perspective
 Measuring Internet development in Africa from a content use, hosting and distribution perspective @EnricoCalandro Senior Researcher @RIAnetwork @JosiahChavula Research Engineer @AfriNIC @AmreeshPhokeer
84.6% of the population aged 16 to 74 has used the Internet in the last three months. 69.0% use it everyday
 5 October 2017 Survey on Equipment and Use of Information and Communication Technologies (ICT) in Households. Year 2017 84.6% of the population aged 16 to 74 has used the Internet in the last three months.
Ⅰ. Introduction 1. Ⅱ. Internet is [DAILY LIFE] Internet Usage Rate and Internet Users 2 2. Internet Usage Pattern 5. Ⅲ. Internet is [MOVING] 6
![Ⅰ. Introduction 1. Ⅱ. Internet is [DAILY LIFE] Internet Usage Rate and Internet Users 2 2. Internet Usage Pattern 5. Ⅲ. Internet is [MOVING] 6](/thumbs/83/87671680.jpg "Ⅰ. Introduction 1. Ⅱ. Internet is [DAILY LIFE] Internet Usage Rate and Internet Users 2 2. Internet Usage Pattern 5. Ⅲ. Internet is [MOVING] 6") Contents 2016 Survey on the Internet Usage Ⅰ. Introduction 1 Ⅱ. Internet is [DAILY LIFE] 2 1. Internet Usage Rate and Internet Users 2 2. Internet Usage Pattern 5 Ⅲ. Internet is [MOVING] 6 1. Mobile Internet
Contents 2016 Survey on the Internet Usage Ⅰ. Introduction 1 Ⅱ. Internet is [DAILY LIFE] 2 1. Internet Usage Rate and Internet Users 2 2. Internet Usage Pattern 5 Ⅲ. Internet is [MOVING] 6 1. Mobile Internet
A STUDY OF CUSTOMER DEFECTION IN CELLULAR SERVICES IN INDIA
 A STUDY OF CUSTOMER DEFECTION IN CELLULAR SERVICES IN INDIA H.K.PRASAD Dr RECHANNA Research Scholar, JSSRF, University of Mysore, Mysuru. Associate Professor in Commerce, JSS College for Women, Saraswathipuram,
ComReg Consumer FVCT Market Research
 ComReg Document 17/90a ComReg Consumer FVCT Market Research Objectives & Methodology / ComReg is required to review certain electronic communications markets that are susceptible to ex-ante regulation,
AMERICANS USE OF THE U.S. POSTAL SERVICE: AN AARP BULLETIN SURVEY
 AMERICANS USE OF THE U.S. POSTAL SERVICE: AN AARP BULLETIN SURVEY APRIL 2013 AMERICANS USE OF THE U.S. POSTAL SERVICE: AN AARP BULLETIN SURVEY Report Prepared by Alicia Williams Copyright 2013 AARP Research