UNIX Server Optimization With TCO and ROI Analysis
|
|
|
- Deborah Oliver
- 6 years ago
- Views:
Transcription
1 UNIX Server Optimization With TCO and ROI Analysis Prepared For: John Smith Vice President of Finance ABC Company 123 Main Street Anytown, USA Prepared By: Datatrend Technologies, Inc 121 Cheshire Lane, Suite 700 Minnetonka, MN
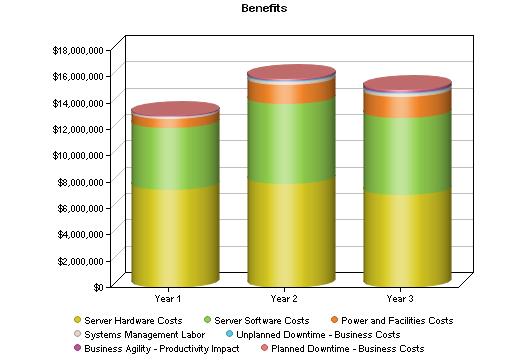
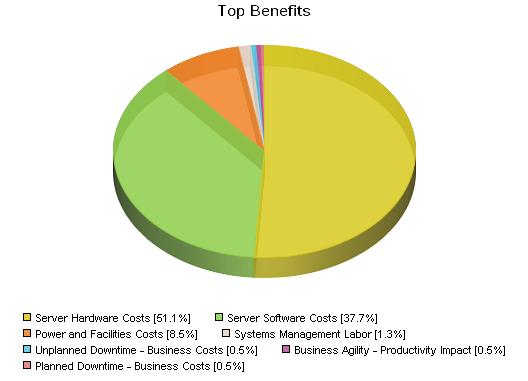
2 1. Project Overview This ROI and TCO Analysis was created specifically for ABC Company, with research and analysis completed on November 15, 2011 leveraging the Enterprise ROI Engine from Alinean, Inc. IBM Systems Consolidation Evaluation Tool derives its estimations based on the current (AS-IS) cost of ownership for server operations, as entered by each individual end user, to a proposed (To-Be) IBM server solution. Consolidation estimations help to assess the return on investment (ROI) by switching or migrating to the proposed platform and the total cost of ownership (TCO) of the proposed solution. All estimates are based on individual end user input and publicly available data provided by Alinean, Inc. The results in this report, based on a 3 year outlook were created from assumptions about ABC Company s IT infrastructure profile and opportunity metrics, combined with industry research metrics and financial calculations contained in the Alinean software, an independent financial modeling tool and model developed by worldwide leading and independent analyst firm IDC ( and ROI consultancy Alinean, The IT Value Experts ( 2. Executive Summary For this analysis a TCO comparison and a risk adjusted cost-benefit analysis of the proposed solution's impact was conducted. Comparing the Solution A: Current (As Is) Environment with Solution B: IBM Server Solution results in a $42,050,427 advantage for Solution B. Comparing the proposed costs and benefits of Solution B: IBM Server Solution versus the As Is opportunities, it was projected that implementing the proposed solutions resulted in $44,004,628 of 3 year cumulative benefits. Of these projected benefits, $43,356,506 are direct (hard) benefits and $648,123 are indirect (soft) benefits. Top cumulative benefits for the project include: - Server Hardware Costs - $22,471,569 - Server Software Costs - $16,578,000 - Power and Facilities Costs - $3,734,781 - Systems Management Labor - $572,155 - Unplanned Downtime - Business Costs - $238,731 - Business Agility - Productivity Impact - $205,162 - Planned Downtime - Business Costs - $204,230 These benefits can be grouped regarding business impact as: - $43,356,506 in IT cost reductions - $205,162 in business operating efficiency improvements - $442,961 in business strategic advantage benefits The proposed project is expected to help the company meet the following goals and drive the following benefits: - Reduce IT Infrastructure Costs $42,784,351 - Improve IT Staff Efficiency / Productivity $572,155 - Improve IT System Availability / Service Levels $442,961 - Improve Time to Market for New Offerings $205,162 The proposed project is expected to deliver the following benefits to specified stakeholders: - Information Technology - IT $39,621,724 - Operations $3,734,781 - Sales and Marketing $442,961 - Enterprise-wide Target User Population $205,162 To implement the proposed project will require a 3 year cumulative investment of $7,030,311 including: - $4,866,501 in initial expenses - $6,880,311 in capital expenditures - $150,000 in operating expenditures 2
3 Comparing the costs and benefits of the proposed project using discounted cash flow analysis and factoring in a risk-adjusted discount rate of 12.5%, the proposed business case predicts: - Risk Adjusted Return on Investment (RA ROI) of 427% - Return on Investment (ROI) of 526% - Net Present Value (NPV) savings of $28,150,248 - Internal Rate of Return (IRR) of 261% - Payback period of 8.0 month(s) Note: The project has been risk-adjusted for an overall deployment schedule of 6 months, realized benefits to include 100.0% of direct benefits and 20.0% of indirect benefits and a deployment schedule (adoption curve) of 85.0% for year 1,95.0% for year 2, and 100.0% over each successive year of the analysis. 3. Opportunity Based on our discovery, the company was profiled as follows: Industry: Media / Entertainment Primary Geographic Location: United States Annual Revenue: $4,730.0 Number of server users for this project: 200 Current server replacement: Power based servers Primary business application focus: Multiple Workloads 4. Proposed Solution Based on your unique opportunities, it was determined that the following solution (Solution B: IBM Server Solution) would help address your goals and opportunities: Solution Component Recommendation Quantity Net Price Servers IBM - Power System GHz (48) 3 $1,741,965 Operating system IBM AIX + PowerVM 3 $302,400 Virtualization software IBM PowerVM 3 $0 Virtualization management IBM VMControl 144 $25,200 Database Software IBM DB2 58 $2,818,800 Data Growth None 0 $0 Application server None 0 $0 Systems management IBM Tivoli 24 $3,336 Threat prevention / management None 0 $0 None 0 $0 Other software (specify) None 0 $0 Professional Services 0 $100,000 Training 0 $50,000 Special incentive allowances 0 $0 Total $5,041, TCO Analysis and Benefit Summary Comparing the Solution A: Current (As Is) Environment with Solution B: IBM Server Solution results in a $42,050,427 advantage for Solution B. For this analysis, the cumulative 3 year TCO comparison is as follows: IT Costs TCO Comparison Cumulative 3 Year Solution A: Current (As Is) Environment Solution B: IBM Server Solution Difference (A - B) Difference (A - B)% Server Hardware Costs $22,471,569 $1,741,965 $20,729, % Server Software Costs $16,578,000 $5,138,346 $11,439, % Systems Management Labor $2,248,681 $1,497,866 $750, % 3

4 Power and Facilities Costs $4,941,960 $70,506 $4,871, % Total IT Costs $46,240,210 $8,448,683 $37,791, % Business Operating Costs Business Agility - Productivity Impact $2,757,570 $1,409,423 $1,348, % Total Business Operating Costs $2,757,570 $1,409,423 $1,348, % Business Strategic Costs Unplanned Downtime - Business Costs $2,353,008 $784,276 $1,568, % Planned Downtime - Business Costs $2,684,039 $1,342,019 $1,342, % Total Business Strategic Costs $5,037,047 $2,126,295 $2,910, % Total $54,034,827 $11,984,401 $42,050, % Comparing the As Is current costs and opportunities to the proposed solution yields expected benefits of $44,004,628 over the 3 year analysis period, with $43,356,506 in direct (hard) benefits, and $648,123 in indirect (soft) benefits. Benefits Summary Year 1 Year 2 Year 3 Total Total Benefits (to Solution B from Current (AS IS)) $13,076,153 $15,902,596 $15,025,879 $44,004,628 Top Benefits Server Hardware Costs $7,471,877 $7,933,375 $7,066,318 $22,471,569 Server Software Costs $4,697,100 $6,037,155 $5,843,745 $16,578,000 Power and Facilities Costs $690,123 $1,461,436 $1,583,223 $3,734,781 Systems Management Labor $102,222 $221,040 $248,892 $572,155 Unplanned Downtime - Business Costs (Indirect) Business Agility - Productivity Impact (Indirect) Planned Downtime - Business Costs (Indirect) $42,297 $91,934 $104,499 $238,731 $36,350 $79,007 $89,805 $205,162 $36,185 $78,648 $89,397 $204,230 All other included benefits. $0 $0 $0 $0 Total Top Benefits $13,076,153 $15,902,596 $15,025,879 $44,004,628 Direct Benefits $12,961,322 $15,653,006 $14,742,178 $43,356,506 Indirect Benefits $114,832 $249,590 $283,701 $648,123 4
5 5

 $0 $150,000 $0 $0 $150,000 Total Operating Investment $0 $150,000")
6 6. Investment Summary To implement the proposed project will require a 3 year cumulative investment of $7,030,311 including: $4,866,501 in initial expenses $6,880,311 in capital expenditures $150,000 in operating expenditures Investment Summary Initial Year 1 Year 2 Year 3 Total Total Investment $4,866,501 $770,870 $696,470 $696,470 $7,030,311 Capital Investment Software Purchases (IT) $3,124,536 $620,870 $696,470 $696,470 $5,138,346 Server Hardware Purchases (IT) $1,741,965 $0 $0 $0 $1,741,965 Total Capital Investment $4,866,501 $620,870 $696,470 $696,470 $6,880,311 Operating Investment Professional Services (IT) $0 $150,000 $0 $0 $150,000 Total Operating Investment $0 $150,000 $0 $0 $150,000 6
 of 526% - Net Present Value (NPV) savings of $28,150,248 - Internal Rate of Return (IRR) of 261% - Payback period of 8.")
7 7. ROI Analysis Analyzing the opportunity, and applying the proposed solution, the cash flow and key financial metrics were calculated, resulting in a: - Risk Adjusted Return on Investment (RA ROI) of 427% - Return on Investment (ROI) of 526% - Net Present Value (NPV) savings of $28,150,248 - Internal Rate of Return (IRR) of 261% - Payback period of 8.0 month(s) ROI Analysis (Solution B) (Probable Case) Initial Year 1 Year 2 Year 3 Benefits (to Solution B from Current (AS IS)) $0 $13,076,153 $15,902,596 $15,025,879 Cumulative Benefits $13,076,153 $28,978,749 $44,004,628 Investment (Solution B) $4,866,501 $770,870 $696,470 $696,470 Cumulative Investment $4,866,501 $5,637,371 $6,333,841 $7,030,311 Cash Flow ($4,866,501) $12,305,283 $15,206,126 $14,329,409 Cumulative Cash Flow ($4,866,501) $7,438,782 $22,644,908 $36,974,318 ROI 526% Risk Adjusted ROI 427% NPV Savings $28,150,248 IRR 261% Payback period (including deployment period) 8 month(s) 7
8 Risk Adjusted Discount Rate 12.5% 8

9 8. Financing Analysis IBM Global Financing typically can provide credit qualified clients with access to fixed rate capital at competitive rates with flexible terms in supported countries. Financing typically helps to deliver improved ROI and lower TCO as compared to a capital expenditure based purchase, thus helping your company to better match costs with expected IT benefits. The following table shows the sample terms and rates used in this analysis to project the impact that financing may have on the expected returns for this investment. Internal cost of capital 9.5% Cost of debt 5.0% Implementation period (months) 6 Solution Component Purchase Price Term (Months) Monthly Payment Server Hardware $1,741, $44, Server Software $3,124, $92, Professional Services $150, $4, Total $5,016,501 $141, Based on the demonstration financing terms described above this project could yield an 28.1% higher ROI by leveraging IBM Global Finance compared to an upfront capital purchase. Financing could potentially accelerate the payback for this project by 2 months. Investment Analysis Purchase Purchase (NPV) Lease (NPV) Initial Investment $5,041,701 $5,041,701 $4,724,330 Total Three Year Investment $7,030,311 $6,838,102 $6,545,932 Total Three Year Benefits $50,044,870 $43,013,192 $43,013,192 Return on Investment (ROI) 611.8% 529.0% 557.1% Internal Rate of Return 292.6% 292.6% 312.6% Payback Period (months) IBM Global Financing offerings are provided through IBM Credit LLC in the United States and other IBM subsidiaries and divisions worldwide to qualified commercial and government customers. Rates are based on a customer's credit rating, financing terms, offering type, equipment type and options, and other factors, including the regulatory environment, and rates and offerings available may vary by country. Other restrictions may apply. Rates and offerings are subject to change, extension or withdrawal by IBM Global Financing without notice. Minimum transaction sizes are US$ 5,000 on a loan, and US$ 25,000 (or local equivalent) on Fair Market Value or Full Payout Lease (in each case, where available from IBM Global Financing). Monthly payments are estimates based on financing rates for installations of qualified products and services in the United States in the current quarter for "Best" credit customers (as determined by IBM Global Financing) for a thirty-six month term. Your actual rates may vary based on your creditworthiness, configuration details, and other factors etc. and are subject to credit approval by IBM Credit LLC or the relevant local IBM Global Financing company. For some clients, total software and services financing is limited to 75% of hardware financed. Other restrictions and conditions may apply, so please contact your IBM Authorized Business Partner or IBM or IBM Global Financing representative for more information. The rates and offering descriptions provided are for informational purposes only and do not represent a commitment by IBM Global Financing to offer leasing or financing, whether at these rates and terms or any other rates and terms. 9
10 Appendix A: Questionnaire (As Is) IBM System Consolidation Evaluation Tool This TCO / ROI evaluation tool was developed independently by the leading tool developer, Alinean, Inc. The tool is designed to provide customers with a quick initial high level analysis of potential consolidation savings by switching to current IBM platforms. This version quantifies potential benefits based on IBM Power Systems servers. Additional versions are available for IBM System x and IBM System z servers. Demonstrated results are based on projected costs associated with specified growth and replacement plans for future years, should you continue with your current hardware and software environment. This tool is sponsored by the Move Up To IBM at: Contact IBM Company Profile What is the closest industry match to your company / organization? Media / Entertainment n1 Where are the primary locations for your data center operations? United States n2 What is the annual revenue (or budget equivalence) for the organization supported by the specified servers? (in Millions) $4,730.0 n3 How many users access the servers in the scope of this project? 200 n4 Current (As Is) Workload Profile Please indicate the servers to be consolidated by the proposed solution. (If your specific server model is not listed, please choose a proxy that is a close match.) Average Cores Workload Group Workload Types Server Type Server Count per Server On-line Transaction Workload Group 1 Processing (OLTP) Sun Fire E25K (1.2 GHz) (48 ch / 96 co) n5 Workload Group 2 Financial / Trading Sun Fire E20K (1.8 GHz) (24 ch / 48 co) n6 Workload Group 3 IT Infrastructure Sun Fire V480 (1.2 GHz) (4 ch / 4 co) 25 4 n7 Workload Group 4 Application Development Sun Fire 4800 (1.2 GHz) (8 ch / 8 co) 20 4 n8 Workload Group 5 Application Development Sun Fire 6800 (1.2 GHz) (16 ch / 16 co) n9 Workload Group 6 Please Select Please Select 0 4 n10 Total 100 3,300 Cumulative estimated workload factor for current servers (used in estimating capacity of target servers) 10,958.2 n11 Projected costs for the current environment are based on the following growth and replacement values for the current server architecture. Average annual growth in computing requirements Average server replacement period (years) 0.0% n n13 Current (As Is) Software Profile Please update the software packages, license levels and pricing to reflect your unique environment. Workload Group Operating System OS License Fee per Server Database Software Database Licenses per Server Price per Database License Workload Group 1 Sun Solaris $0 Oracle EE 48 $18,000 n14 Workload Group 2 Sun Solaris $0 Oracle EE 24 $18,000 n15 Workload Group 3 Sun Solaris $0 Oracle EE 0 $0 n16 Workload Group 4 Sun Solaris $0 Oracle EE 2 $18,000 n17 Workload Group 5 Sun Solaris $0 None 16 $0 n18 Workload Group 6 None $0 None 0 $0 n19 Additional Enterprise Software Packages Predominant Package Type Total Enterprise Licenses Average Price per License Annual Support per License Data Growth (per core) None 0 $0 $0 n20 Application server (per core) None 0 $0 $0 n21 Systems management (per core) None 0 $0 $0 n22 Server virtualization (per core) None 0 $0 $0 n23 Threat prevention / management (per core) None 0 $0 $0 n24 (per user) None 0 $0 $0 n25 Other software (specify) None 0 $0 $0 n26 Current (As Is) Systems Administration Profile Specify the current systems administration and operations staff full time equivalents (FTEs). Systems Administration and Operations Staff Number of FTEs Average Annual Unburdened Salary Systems administrators 5.56 $67,806 n27 Systems operators 3.33 $55,790 n28 Other (specify) 0.00 $0 Total 8.89 $63,305 10
11 Current (As Is) Availability Profile Specify your current availability (downtime). Current Availability (Downtime) Annual Hours of Downtime Availability Percentage of Users Impacted per Outage Revenue Impact per Hour of Outage Average annual system availability % 20.0% $283,800 n29 Average annual scheduled downtime % $28,380 n30 Copyright Alinean, Inc. All rights reserved Disclaimer v3.2.2 Notes: 1. The type of organization. This, along with the primary location of the organization scales key metrics in the tool, particularly relating to salary and any other industry-related metrics. 2. The primary geographic location where the company or organization operates, and the company data centers. The specification should be made for the in-scope users and data centers as part of this project. This, along with the industry type of the company or organization helps scale key metrics in the tool, particularly relating to salary and any other geographic related metrics. 3. The annual revenue for the scope of the organization for this analysis helps to estimate storage capacity and factors such as the cost of downtime. 4. The user population for the scope of this analysis helps estimate storage requirements and the cost of downtime. 5. The selected server information is used to estimate costs for maintaining and growing the current environment, as well as estimating the appropriate IBM system for consolidation. Workload Types include the following classifications: (Web Infrastructure) - Web servers, proxy servers, http servers, connectors (Application Development) - Developer workbench, dev and test servers, Rational, Eclipse (Database) - All production and test databases (Decision Support) - Data mining, data warehousing, analytics (IT Infrastructure) - ftp servers, file and print servers, monitoring consoles, LDAP, DNS, test (Business Processing) - transaction processing, batch processing, customer relationship management, enterprise planning 6. See above 7. See above 8. See above 9. See above 10. See above 11. The workload factor is based on Alinean research using a combination of published benchmarks to estimate approximate computing capacity for the specified current servers. 12. According to Alinean research most organizations processing capacity grows between 12-23% per year. This factor is used to estimate costs for growing the current environment. 13. Typically organizations replace aging server equipment on a regular basis with newer faster and more reliable servers. This factor is used to estimate costs for replacing aging equipment. 14. The selected server software information is used to estimate costs for maintaining and growing the current environment, as well as estimating the appropriate IBM system for consolidation. All software licensing costs are consolidated at a total per server level. 15. See above 16. See above 17. See above 18. See above 19. See above 20. The data management software is used to estimate annual maintenance costs as well as costs for additional licenses for growth. 11
12 21. The application server type is used to estimate annual maintenance costs as well as costs for additional licenses for growth. 22. The systems management information is used to estimate annual maintenance costs as well as costs for additional licenses for growth. 23. The server virtualization software is used to estimate annual maintenance costs as well as costs for additional licenses for growth. 24. The threat prevention / management software is used to estimate annual maintenance costs as well as costs for additional licenses for growth software costs are included for comparison with proposed configuration. Information is used to estimate annual maintenance costs as well as costs for additional licenses for growth. 26. If you have additional software for consideration, please enter that information here. 27. Default assumes 1 systems administrator FTE for every 18 servers. Average annual unburdened salary is estimated at $79,000 USD base salary and scaled by industry and location. 28. Default assumes 1 systems operator FTE for every 30 servers. Average annual unburdened salary is estimated at $65,000 USD base salary and scaled by industry and location. 29. Average annual downtime and the costs of downtime are based on Alinean research Average annual downtime and the costs of downtime are based on Alinean research
13 Appendix B: Solution Selection (To Be) IBM Solution Recommendations Optimizing workloads and driving towards a Smarter Systems environment are critical paths IT must begin to achieve in 2010 and beyond. The IBM Systems recommendations below are based on a high level assessment of relative workload requirements for the specified systems in the Questionnaire tab and based on published benchmarks. The demonstration systems below represent a sustained level of high utilization and extensive virtualization. The new IBM POWER7 products are capable of sustained utilization rates in excess of 90%. Many factors will influence the final solution needed to consolidate your environment and those final results may be different from the tool recommendations. List pricing for the various systems models represent typical and average configurations including memory, storage, network interface cards, cables, and chassis. Cost for racks and HMC is not included. All prices are in USA $. Prices from resellers may vary. Prices are subject to change without notice. Will software licenses be transferred from retired systems where applicable, or purchased new? Transferred n1 Would you like to include server virtualization in the analysis? Yes n2 Would you like to configure the solution for high availability? Yes n3 Server Component Recommendation Quantity Price Net Price X Servers IBM - Power System GHz (48) 3 $580,655 $1,741,965 n4 X Operating system IBM AIX + PowerVM 3 $100,800 $302,400 n5 X Virtualization software IBM PowerVM 3 $0 $0 n6 X Virtualization management IBM VMControl 144 $175 $25,200 n7 X Database Software IBM DB2 58 $48,600 $2,818,800 n8 Data Growth None 0 $0 $0 n9 Application server None 0 $0 $0 n10 X Systems management IBM Tivoli 24 $139 $3,336 n11 Threat prevention / management None 0 $0 $0 n12 None 0 $0 $0 n13 Other software (specify) None 0 $0 $0 n14 X Professional Services Fees $0 $100,000 n15 Training $0 $50,000 n16 Special incentive allowances $0 $0 n17 Total $4,891,701 $5,041,701 Estimated workload factor for the demonstrated systems are based on sustained high utilization levels and highly virtualized environments. Your actual consolidation results will vary depending on your unique systems/workload optimization needs. Initial hardware purchase discount level Initial software purchase discount level Copyright Alinean, Inc. All rights reserved Notes: 15,138.0 n18 0.0% n19 0.0% n20 1. Often software licenses are transferred free of charge from retired servers to new servers during a consolidation. 2. Virtualization is included by default to Power systems. 3. If high availability is selected the number of recommended servers is doubled. 4. The recommended server type and quantity is based on a comparison with the relative workload of the servers entered in the Questionnaire. This model takes a conservative approach and does not factor in increase utilization which often occurs in a server consolidation. The default recommendations have been compared to several real world cases. The recommendations are generally very appropriate, however, computing workloads and characteristics can vary significantly. Please select the most appropriate target system and quantity, if you believe there is a better solution for your needs. 5. The operating system selection is used to estimate the costs for the proposed solution. If licenses of the same type are available to be transferred from the retired systems, the cost for those licenses are not added to the proposed solution. (Pricing for IBM AIX and IBM i includes the PowerVM option.) 6. The cost of IBM PowerVM is included with the OS listed above. Pricing for vsphere is based on $2245 per socket. 7. The threat prevention / management software is used to estimate the costs for the proposed solution. If licenses of the same type are available to be transferred from the retired systems, the cost for those licenses are not added to the proposed solution. 8. The database selection is used to estimate the costs for the proposed solution. If licenses of the same type are available to be transferred from the retired systems, the cost for those licenses are not added to the proposed solution. The price for the IBM DB2i database is included in the IBM i operating system license. 9. The data management software is used to estimate the costs for the proposed solution. If licenses of the same type are available to be transferred from the retired systems, the cost for those licenses are not added to the proposed solution. 10. The application server selection is used to estimate the costs for the proposed solution. If licenses of the same type are available to be transferred from the retired systems, the cost for those licenses are not added to the proposed solution. 13
14 11. The systems management selection is used to estimate the costs for the proposed solution. If licenses of the same type are available to be transferred from the retired systems, the cost for those licenses are not added to the proposed solution. 12. The threat prevention / management software is used to estimate the costs for the proposed solution. If licenses of the same type are available to be transferred from the retired systems, the cost for those licenses are not added to the proposed solution. 13. The selection is used to estimate the costs for the proposed solution. If licenses of the same type are available to be transferred from the retired systems, the cost for those licenses are not added to the proposed solution. 14. If you have additional software for consideration, please enter that information here. 15. Please use this field to capture any estimated services costs that would be required to install and configure the new servers. Application porting or migration efforts can be included. For granularity of services costs you can click on the Professional Services link to bring up the individual worksheet. Please update the professional services estimates to reflect your anticipated project costs. 16. The tool does not estimate training costs. Please update this information to reflect your expectations for training. 17. Enter special incentives that reduce the Net Price Total of your solutions such as IGF Competitive Buyback, Trade-in values, IBM Rewards, or other special incentives from IBM and our Partners. 18. Workload factor for the demonstrated systems are based on sustained high utilization levels and highly virtualized environments. Your actual consolidation results will vary depending on your unique systems/workload optimization needs. 19. Enter the anticipated discount value to be applied across the hardware costs. To discount components individually, simply input the desired Net Price in the table above. 20. Enter the anticipated discount value to be applied across the software costs. To discount components individually, simply input the desired Net Price in the table above. 14
15 Appendix C: TCO and Benefit Details Server Hardware Costs This worksheet compares the server hardware costs for on-going maintenance and growth expectations for the current environment versus the purchase price and growth expectations for the server hardware for the proposed IBM server solution. Cumulative Benefits (3 - Year): $22,471,569 Organization financial benefit type: Net Fixed Assets (NFA - Cumulative) Values map to benefit class: Direct Benefits Goal: Reduce IT Infrastructure Costs Stakeholder: Information Technology - IT Average annual growth rate in computing requirements 0.0% Average server replacement period (years) 5.0 Average annual decrease in server hardware costs 0.0% n1 Server Hardware Costs Year 1 Year 2 Year 3 Year 4 Year 5 Current (As Is) Environment Server count (beginning of year) Annual growth rate in computing requirements 0.0% 0.0% 0.0% 0.0% 0.0% Annual server purchases for replacement Average price per server $0 $0 $0 $799,131 $799,131 Annual server purchase costs $0 $0 $0 $15,982,624 $15,982,624 Average annual server support costs 11.0% 11.0% 13.0% 15.0% 17.0% Annual server support costs $8,790,443 $8,790,443 $10,388,706 $11,986,968 $13,585,230 Annual server hardware costs $8,790,443 $8,790,443 $10,388,706 $27,969,592 $29,567,854 Server Hardware Costs Year 1 Year 2 Year 3 Year 4 Year 5 IBM Server Solution Server count (beginning of year) Annual growth rate in computing requirements 0.0% 0.0% 0.0% 0.0% 0.0% New server purchases for growth Server upgrades for growth $0 $0 $0 $0 $0 Annual server purchase costs $1,741,965 $0 $0 $0 $0 Average annual server support costs 0.0% 0.0% 0.0% 11.0% 11.0% Annual server support costs $0 $0 $0 $191,616 $191,616 Special incentive allowances $0 $0 $0 $0 $0 Annual server hardware costs $1,741,965 $0 $0 $191,616 $191,616 Annual Benefits Year1 Year 2 Year 3 Year 4 Year 5 Server costs for current (As Is) environment IBM server costs are included in investment $8,790,443 $8,790,443 $10,388,706 $27,969,592 $29,567,854 Server Hardware Costs (Current Environment) Year 1 Year 2 Year 3 Year 4 Year 5 Workload Group 1 - Sun Fire E25K (1.2 GHz) (48 ch / 96 co) Server count (beginning of year) Annual server purchases for replacement Average price per server $2,170,656 $2,170,656 $2,170,656 $2,170,656 $2,170,656 Annual server purchase costs $0 $0 $0 $8,682,624 $8,682,624 Annual server support costs $4,775,443 $4,775,443 $5,643,706 $6,511,968 $7,380,230 Workload Group 2 - Sun Fire E20K (1.8 GHz) (24 ch / 48 co) Server count (beginning of year) Annual server purchases for replacement Average price per server $1,350,000 $1,350,000 $1,350,000 $1,350,000 $1,350,000 Annual server purchase costs $0 $0 $0 $5,400,000 $5,400,000 Annual server support costs $2,970,000 $2,970,000 $3,510,000 $4,050,000 $4,590,000 Workload Group 3 - Sun Fire V480 (1.2 GHz) (4 ch / 4 co) 15
16 Server count (beginning of year) Annual server purchases for replacement Average price per server $36,000 $36,000 $36,000 $36,000 $36,000 Annual server purchase costs $0 $0 $0 $180,000 $180,000 Annual server support costs $99,000 $99,000 $117,000 $135,000 $153,000 Workload Group 4 - Sun Fire 4800 (1.2 GHz) (8 ch / 8 co) Server count (beginning of year) Annual server purchases for replacement Average price per server $55,000 $55,000 $55,000 $55,000 $55,000 Annual server purchase costs $0 $0 $0 $220,000 $220,000 Annual server support costs $121,000 $121,000 $143,000 $165,000 $187,000 Workload Group 5 - Sun Fire 6800 (1.2 GHz) (16 ch / 16 co) Server count (beginning of year) Annual server purchases for replacement Average price per server $500,000 $500,000 $500,000 $500,000 $500,000 Annual server purchase costs $0 $0 $0 $1,500,000 $1,500,000 Annual server support costs $825,000 $825,000 $975,000 $1,125,000 $1,275,000 Workload Group 6 - Please Select Server count (beginning of year) Annual server purchases for replacement Average price per server $0 $0 $0 $0 $0 Annual server purchase costs $0 $0 $0 $0 $0 Annual server support costs $0 $0 $0 $0 $0 Annual server hardware purchase costs $0 $0 $0 $15,982,624 $15,982,624 Annual server hardware support costs $8,790,443 $8,790,443 $10,388,706 $11,986,968 $13,585,230 Total annual server hardware costs $8,790,443 $8,790,443 $10,388,706 $27,969,592 $29,567,854 Notes: 1. Historically server processing speeds have increased significantly, while prices have remained relatively stable. This has resulted in the ability to purchase much more powerful servers for lower prices over time. This value is used to discount the cost of future hardware purchases to account for this factor. Realized Benefits (Probable) Year 1 Year 2 Year 3 Solution A Current (As Is) Environment $8,790,443 $7,032,355 $6,648,772 Solution B IBM Server Solution $1,741,965 $0 $0 Worksheet / Ideal Benefit B from Current (AS IS)) (to Solution $8,790,443 $7,032,355 $6,648,772 Q1 $0.00 $7,933, $7,066, Q2 $0.00 $0.00 $0.00 Q3 $7,471, $0.00 $0.00 Q4 $0.00 $0.00 $0.00 Realized Total Benefits $7,471,877 $7,933,375 $7,066,318 Server Software Costs This worksheet compares the server software costs for on-going support and growth expectations for the current environment versus the purchase price and growth expectations for the server software for the proposed IBM server solution. Cumulative Benefits (3 - Year): $16,578,000 Organization financial benefit type: Net Fixed Assets (NFA - Cumulative) Values map to benefit class: Direct Benefits Goal: Reduce IT Infrastructure Costs Stakeholder: Information Technology - IT Average annual growth rate in computing requirements 0.0% Server Software Costs Year 1 Year 2 Year 3 Year 4 Year 5 16
17 Current (As Is) Environment Server count (beginning of year) Annual OS & DB license purchases $0 $0 $0 $0 $0 Annual OS & DB support costs $5,526,000 $5,526,000 $5,526,000 $5,526,000 $5,526,000 Annual data growth license purchases $0 $0 $0 $0 $0 Annual data growth support costs $0 $0 $0 $0 $0 Annual application server license purchases $0 $0 $0 $0 $0 Annual application server support costs $0 $0 $0 $0 $0 Annual systems management license purchases $0 $0 $0 $0 $0 Annual systems management support costs $0 $0 $0 $0 $0 Annual server virtualization license purchases $0 $0 $0 $0 $0 Annual server virtualization support costs $0 $0 $0 $0 $0 Annual threat management license purchases $0 $0 $0 $0 $0 Annual threat management support costs $0 $0 $0 $0 $0 Annual license purchases $0 $0 $0 $0 $0 Annual support costs $0 $0 $0 $0 $0 Annual other software license purchases $0 $0 $0 $0 $0 Annual other software support costs $0 $0 $0 $0 $0 Annual software license purchases $0 $0 $0 $0 $0 Annual software support costs $5,526,000 $5,526,000 $5,526,000 $5,526,000 $5,526,000 Total annual software costs $5,526,000 $5,526,000 $5,526,000 $5,526,000 $5,526,000 Server Software Costs Year 1 Year 2 Year 3 Year 4 Year 5 IBM Server Solution Server count (beginning of year) OS (IBM AIX + PowerVM) license purchases $302,400 $0 $0 $0 $0 OS (IBM AIX + PowerVM) support costs $0 $75,600 $75,600 $75,600 $75,600 Virtualization (IBM PowerVM) license purchases $0 $0 $0 $0 $0 Virtualization (IBM PowerVM) support costs $0 $0 $0 $0 $0 DB (IBM DB2) license purchases $2,818,800 $0 $0 $0 $0 DB (IBM DB2) support costs $620,136 $620,136 $620,136 $620,136 $620,136 Data Growth (None) license purchases $0 $0 $0 $0 $0 Data Growth (None) support costs $0 $0 $0 $0 $0 AppSrv (None) license purchases $0 $0 $0 $0 $0 AppSrv (None) support costs $0 $0 $0 $0 $0 Mgnt (IBM Tivoli) license purchases $3,336 $0 $0 $0 $0 Mgnt (IBM Tivoli) support costs $734 $734 $734 $734 $734 Security (None) license purchases $0 $0 $0 $0 $0 Security (None) support costs $0 $0 $0 $0 $0 (None) license purchases $0 $0 $0 $0 $0 (None) support costs $0 $0 $0 $0 $0 Other (None) license purchases $0 $0 $0 $0 $0 Other (None) support costs $0 $0 $0 $0 $0 Annual software license purchases $3,124,536 $0 $0 $0 $0 Annual software support costs $620,870 $696,470 $696,470 $696,470 $696,470 Total annual software costs $3,745,406 $696,470 $696,470 $696,470 $696,470 Annual Benefits Year1 Year 2 Year 3 Year 4 Year 5 Software costs for current (As Is) environment IBM software costs are included in investment $5,526,000 $5,526,000 $5,526,000 $5,526,000 $5,526,000 Current (As Is) Environment Server Group OS Package DB Package Average OS & DB License Fee per Server Average Annual OS & DB Support per Server Workload Group 1 Sun Solaris Oracle EE $864,000 $174,780 Workload Group 2 Sun Solaris Oracle EE $432,000 $88,380 Workload Group 3 Sun Solaris Oracle EE $0 $1,980 Workload Group 4 Sun Solaris Oracle EE $36,000 $9,180 Workload Group 5 Sun Solaris None $0 $1,980 Workload Group 6 None None $0 $0 Current (As Is) Environment Year 1 Year 2 Year 3 Year 4 Year 5 Workload Group 1 - Sun Fire E25K (1.2 GHz) (48 ch / 96 co) Server count (beginning of year) OS & DB license costs per new server $864,000 $864,000 $864,000 $864,000 $864,000 Annual OS & DB license costs $0 $0 $0 $0 $0 Annual OS & DB support costs $3,495,600 $3,495,600 $3,495,600 $3,495,600 $3,495,600 17
18 Workload Group 2 - Sun Fire E20K (1.8 GHz) (24 ch / 48 co) Server count (beginning of year) OS & DB license costs per new server $432,000 $432,000 $432,000 $432,000 $432,000 Annual OS & DB license costs $0 $0 $0 $0 $0 Annual OS & DB support costs $1,767,600 $1,767,600 $1,767,600 $1,767,600 $1,767,600 Workload Group 3 - Sun Fire V480 (1.2 GHz) (4 ch / 4 co) Server count (beginning of year) OS & DB license costs per new server $0 $0 $0 $0 $0 Annual OS & DB license costs $0 $0 $0 $0 $0 Annual OS & DB support costs $49,500 $49,500 $49,500 $49,500 $49,500 Workload Group 4 - Sun Fire 4800 (1.2 GHz) (8 ch / 8 co) Server count (beginning of year) OS & DB license costs per new server $36,000 $36,000 $36,000 $36,000 $36,000 Annual OS & DB license costs $0 $0 $0 $0 $0 Annual OS & DB support costs $183,600 $183,600 $183,600 $183,600 $183,600 Workload Group 5 - Sun Fire 6800 (1.2 GHz) (16 ch / 16 co) Server count (beginning of year) OS & DB license costs per new server $0 $0 $0 $0 $0 Annual OS & DB license costs $0 $0 $0 $0 $0 Annual OS & DB support costs $29,700 $29,700 $29,700 $29,700 $29,700 Workload Group 6 - Please Select Server count (beginning of year) OS & DB license costs per new server $0 $0 $0 $0 $0 Annual OS & DB license costs $0 $0 $0 $0 $0 Annual OS & DB support costs $0 $0 $0 $0 $0 Annual OS & DB license costs $0 $0 $0 $0 $0 Annual OS & DB support costs $5,526,000 $5,526,000 $5,526,000 $5,526,000 $5,526,000 Annual server software costs $5,526,000 $5,526,000 $5,526,000 $5,526,000 $5,526,000 Realized Benefits (Probable) Year 1 Year 2 Year 3 Solution A Current (As Is) Environment $5,526,000 $5,526,000 $5,526,000 Solution B IBM Server Solution $3,745,406 $696,470 $696,470 Worksheet / Ideal Benefit B from Current (AS IS)) (to Solution $5,526,000 $5,526,000 $5,526,000 Q1 $0.00 $6,037, $5,843, Q2 $0.00 $0.00 $0.00 Q3 $4,697, $0.00 $0.00 Q4 $0.00 $0.00 $0.00 Realized Total Benefits $4,697,100 $6,037,155 $5,843,745 Power and Facilities Costs This worksheet compares the facilities (space and power) costs for the current environment versus the proposed IBM server solution. Cumulative Benefits (3 - Year): $3,734,781 Organization financial benefit type: Operating Expense (Allocated) Values map to benefit class: Direct Benefits Goal: Reduce IT Infrastructure Costs Stakeholder: Operations Measure datacenter space using (square feet or square meters) Square Feet Space Requirements Current (As Is) Environment IBM Server Solution Savings Number of servers Average space required per server (Square Feet) Total datacenter space requirements (Square Feet)
19 Average annual cost per square foot of datacenter space $62.50 $62.50 Total annual costs for datacenter space (year 1) $45,125 $476 $44,649 Power and HVAC Requirements Current (As Is) Environment IBM Server Solution Savings Number of servers (processors for IBM) Average power consumption per server (Watts) 10,479 5,020 1,042,880 Average HVAC consumption per server (Watts) 9,431 4, ,582 Total hourly power and HVAC consumption (Watts) 1,991,000 28,614 1,962,386 Annual operating hours 8,766 8,766 Annual power and HVAC consumption (kwatt hours) 17,453, ,830 Average cost per kwatt hour $ $ n1 Total annual power and HVAC costs (year 1) $1,602,195 $23,026 $1,579,169 Average annual growth in computing resources 0.0% Annual Facilities Costs Year 1 Year 2 Year 3 Year 4 Year 5 Current (As Is) Environment annual facilities costs $1,647,320 $1,647,320 $1,647,320 $1,647,320 $1,647,320 IBM Server Solution annual facilities costs $23,502 $23,502 $23,502 $23,502 $23,502 Annual savings in facilities costs $1,623,818 $1,623,818 $1,623,818 $1,623,818 $1,623,818 Notes: 1. Default is the average cost of electricity in the U.S. according to Energy Information Administration, "Average Retail Price of Electricity to Ultimate Customer by End-Use Sector, by State." Realized Benefits (Probable) Year 1 Year 2 Year 3 Solution A Current (As Is) Environment $1,647,320 $1,647,320 $1,647,320 Solution B IBM Server Solution $23,502 $23,502 $23,502 Worksheet / Ideal Benefit B from Current (AS IS)) (to Solution $1,623,818 $1,623,818 $1,623,818 Q1 $0.00 $345, $385, Q2 $0.00 $345, $385, Q3 $345, $385, $405, Q4 $345, $385, $405, Realized Total Benefits $690,123 $1,461,436 $1,583,223 Systems Management Labor This worksheet compares the systems management labor costs for the current environment versus the proposed IBM server solution. Cumulative Benefits (3 - Year): $572,155 Organization financial benefit type: Operating Expense (Allocated) Values map to benefit class: Direct Benefits Goal: Improve IT Staff Efficiency / Productivity Stakeholder: Information Technology - IT Average annual burden rate for labor 28.0% n1 Systems Management Labor Current FTEs Expected Savings Proposed FTEs Average Annual Fully Burdened Salary Annual Savings Year 1 Systems administrators % 3.34 $86,792 $192,678 n2 Systems and backup operators % 2.66 $71,411 $47,845 Other (specify) % 0.00 $0 $0 Total % 6.00 $240,523 Average annual growth in systems management staff 0.0% n3 Average annual growth in systems management salaries 4.0% Systems Management Labor Year 1 Year 2 Year 3 Year 4 Year 5 19
20 Current (As Is) Environment - FTEs Current (As Is) Environment - annual labor costs $720,362 $749,176 $779,143 $810,309 $842,721 IBM Server Solution - FTEs IBM Server Solution - annual labor costs $479,839 $499,033 $518,994 $539,754 $561,344 Annual savings - FTEs Annual savings - labor costs $240,523 $250,143 $260,149 $270,555 $281,377 Notes: 1. The annual salary burden factor includes additional costs such as paid time off and benefits that the company incurs beyond the employees base salary. This factor is based on geography, where the average is 26% for the US and 35% for Europe. 2. Server consolidation reduces the number of physical servers and help standardize configurations leading to reduced labor requirements. 3. The growth in staff is estimated at 2/3rds the growth rate in servers. This is used to estimate the growth in labor costs. Realized Benefits (Probable) Year 1 Year 2 Year 3 Solution A Current (As Is) Environment $720,362 $749,176 $779,143 Solution B IBM Server Solution $479,839 $499,033 $518,994 Worksheet / Ideal Benefit B from Current (AS IS)) (to Solution $240,523 $250,143 $260,149 Q1 $0.00 $51, $59, Q2 $0.00 $51, $59, Q3 $51, $59, $65, Q4 $51, $59, $65, Realized Total Benefits $102,222 $221,040 $248,892 Unplanned Downtime - Business Costs The IBM server solution supports high availability capabilities, which can significantly reduce business interruptions due to system failures. Cumulative Benefits (3 - Year): $238,731 Organization financial benefit type: Revenue or Equivalent Values map to benefit class: Indirect Benefits Goal: Improve IT System Availability / Service Levels Stakeholder: Sales and Marketing Unplanned Downtime Current (As Is) Environment Expected Benefits with Proposed Solution Expected Availability for Proposed Solution Average annual system availability % 66.7% % n1 Annual hours of unplanned system downtime Estimated revenue or equivalent cost per hour of unplanned downtime $283,800 $283,800 Annual business losses due to availability issues $7,463,940 $4,976,149 $2,487,791 Net incremental contribution 10.0% 10.0% Annual incremental margin contribution $746,394 $497,615 $248,779 Unplanned Downtime Year 1 Year 2 Year 3 Year 4 Year 5 Current (As Is) costs $7,463,940 $7,837,137 $8,228,994 $8,640,444 $9,072,466 Incremental margin contribution $746,394 $783,714 $822,900 $864,045 $907,247 Proposed (To Be) costs $2,487,791 $2,612,181 $2,742,790 $2,879,930 $3,023,927 Incremental margin contribution $248,779 $261,218 $274,279 $287,993 $302,393 Reduction in business loss from improved availability $4,976,149 $5,224,956 $5,486,204 $5,760,514 $6,048,539 Incremental margin contribution $497,615 $522,496 $548,621 $576,052 $604,854 Annual benefit growth (starting in year 2) 5.0% n2 Note - Availability includes all aspects of potential downtime, including hardware system errors, software errors, configuration issues and administrative 20
21 issues. The IBM servers historically have delivered system availability approaching 5 9s, or %. The default expectations in this model assume much more conservative estimates based primarily on other factors which may impact total system availability. Notes: 1. The IBM server solution supports high availability capabilities, which can significantly reduce business interruptions due to storage failures. 2. Used to calculate annual benefits in ongoing years of the analysis. By default, equal to the annual growth in revenue or equivalent. Realized Benefits (Probable) Year 1 Year 2 Year 3 Incremental Revenue or Equivalent Solution A Current (As Is) Environment $7,463,940 $7,837,137 $8,228,994 Solution B IBM Server Solution $2,487,791 $2,612,181 $2,742,790 Worksheet / Ideal Benefit (to Solution $4,976,149 $5,224,956 $5,486,204 B from Current (AS IS)) Q1 $0.00 $211, $248, Q2 $0.00 $211, $248, Q3 $211, $248, $274, Q4 $211, $248, $274, Realized Total $422,973 $919,343 $1,044,991 Net Contribution: Incremental Revenue or Equivalent Solution A Current (As Is) Environment $746,394 $783,714 $822,900 Solution B IBM Server Solution $248,779 $261,218 $274,279 Worksheet / Ideal Benefit B from Current (AS IS)) (to Solution $497,615 $522,496 $548,621 Q1 $0.00 $21, $24, Q2 $0.00 $21, $24, Q3 $21, $24, $27, Q4 $21, $24, $27, Realized Total $42,297 $91,934 $104,499 Business Agility - Productivity Impact Server consolidation and virtualization can often speed the deployment of new applications by reducing the time required for purchasing, installing and configuring new server resources. Often new server resources can simply be created by defining additional virtual machines on an existing physical server. Cumulative Benefits (3 - Year): $205,162 Organization financial benefit type: Operating Expense (Allocated) Values map to benefit class: Indirect Benefits Goal: Improve Time to Market for New Offerings Stakeholder: Enterprise-wide Target User Population Business Agility - Productivity Impact Current (As Is) Environment Benefits with Proposed Solution IBM Server Solution New application projects per year 3 3 Average system provisioning time per application (days) % 23 Average annual value in productivity improvement per application $2,365,000 $2,365,000 Average lost productivity improvement value per system provisioning $291,575 $142,548 $149,027 Annual value of productivity losses due to system provisioning $874,725 $427,644 $447,081 Business Agility - Productivity Impact Year 1 Year 2 Year 3 Year 4 Year 5 Current (As Is) costs $874,725 $918,461 $964,384 $1,012,603 $1,063,233 Proposed (To Be) costs $447,081 $469,435 $492,907 $517,552 $543,430 Reduction in productivity losses from improved agility $427,644 $449,026 $471,477 $495,051 $519,804 Annual benefit growth (starting in year 2) 5.0% n1 Notes: 21
22 1. Used to calculate annual benefits in ongoing years of the analysis. Default set equal to the growth in salaries. Realized Benefits (Probable) Year 1 Year 2 Year 3 Solution A Current (As Is) Environment $874,725 $918,461 $964,384 Solution B IBM Server Solution $447,081 $469,435 $492,907 Worksheet / Ideal Benefit B from Current (AS IS)) (to Solution $427,644 $449,026 $471,477 Q1 $0.00 $18, $21, Q2 $0.00 $18, $21, Q3 $18, $21, $23, Q4 $18, $21, $23, Realized Total Benefits $36,350 $79,007 $89,805 Planned Downtime - Business Costs The IBM server solution supports improved systems management capabilities, which can reduce or even eliminate planned downtime and business interruptions. Cumulative Benefits (3 - Year): $204,230 Organization financial benefit type: Revenue or Equivalent Values map to benefit class: Indirect Benefits Goal: Improve IT System Availability / Service Levels Stakeholder: Sales and Marketing Planned Downtime Current (As Is) Environment Expected Benefits with Proposed Solution Potential Planned Downtime for Proposed Solution Annual hours of planned system downtime per year % n1 Estimated revenue or equivalent cost per hour of planned downtime $28,380 $28,380 Annual business losses due to scheduled downtime $8,514,000 $4,257,000 $4,257,000 Net incremental contribution 10.0% 10.0% Annual incremental margin contribution $851,400 $425,700 $425,700 Planned Downtime Year 1 Year 2 Year 3 Year 4 Year 5 Current (As Is) costs $8,514,000 $8,939,700 $9,386,685 $9,856,019 $10,348,820 Incremental margin contribution $851,400 $893,970 $938,669 $985,602 $1,034,882 Proposed (To Be) costs $4,257,000 $4,469,850 $4,693,343 $4,928,010 $5,174,411 Incremental margin contribution $425,700 $446,985 $469,334 $492,801 $517,441 Reduction in business loss from reduced planned downtime $4,257,000 $4,469,850 $4,693,342 $4,928,009 $5,174,409 Incremental margin contribution $425,700 $446,985 $469,335 $492,801 $517,441 Annual benefit growth (starting in year 2) 5.0% n2 Notes: 1. The IBM server solution supports improved storage management capabilities, which can reduce or even eliminate planned downtime and business interruptions. 2. Used to calculate annual benefits in ongoing years of the analysis. By default, equal to the annual growth in revenue or equivalent. Realized Benefits (Probable) Year 1 Year 2 Year 3 Incremental Revenue or Equivalent Solution A Current (As Is) Environment $8,514,000 $8,939,700 $9,386,685 Solution B IBM Server Solution $4,257,000 $4,469,850 $4,693,343 Worksheet / Ideal Benefit (to Solution $4,257,000 $4,469,850 $4,693,342 B from Current (AS IS)) Q1 $0.00 $180, $212, Q2 $0.00 $180, $212, Q3 $180, $212, $234,
Server Consolidation for Oracle E-Business Suite with IBM Power Systems Servers:
 Server for Oracle E-Business Suite with IBM Power Systems Servers: Lowering Total Cost of Ownership An Alinean White Paper Greg Shanker - Vice President Published by: Alinean, Inc. 201 S. Orange Ave Suite
Microsoft SQL Server on HP Integrity Servers:
 Microsoft SQL Server on Servers: Lowering Total Cost of Ownership (TCO) through server consolidation An Alinean White Paper Greg Shanker - Vice President Published by: Alinean, Inc. 201 S. Orange Ave Suite
Server Consolidation with IBM System x and BladeCenter with Intel Xeon Processors:
 Server Consolidation with IBM System x and BladeCenter with Intel Xeon Processors: Lowering Total Cost of Ownership An Alinean White Paper Greg Shanker - Vice President Published by: Alinean, Inc. 201
Red Hat Virtualization Increases Efficiency And Cost Effectiveness Of Virtualization
 Forrester Total Economic Impact Study Commissioned by Red Hat January 2017 Red Hat Virtualization Increases Efficiency And Cost Effectiveness Of Virtualization Technology organizations are rapidly seeking
IBM Storwize V7000 TCO White Paper:
 IBM Storwize V7000 TCO White Paper: A TCO White Paper An Alinean White Paper Published by: Alinean, Inc. 201 S. Orange Ave Suite 1210 Orlando, FL 32801-12565 Tel: 407.382.0005 Fax: 407.382.0906 Email:
Server TCO Showdown. Lenovo System x3950 X6 and IBM Storwize V7000 vs. HP Superdome 2. Total Cost of Ownership Comparison. An Alinean White Paper
 Server TCO Showdown Lenovo System x3950 X6 and IBM Storwize V7000 vs. HP Superdome 2 Total Cost of Ownership Comparison An Alinean White Paper Copyright 2001-2015 Alinean, Inc. All Rights Reserved. i TABLE
Empowering Systems of Engagement: Business Value of Couchbase NoSQL Engagement Database. An IDC White Paper, Sponsored by Couchbase and Intel
 Empowering Systems of Engagement: Business Value of Couchbase NoSQL Engagement Database An IDC White Paper, Sponsored by Couchbase and Intel Authors: Carl W. Olofson, Matthew Marden Sponsored by: Couchbase
A Mission Critical Protection Investment That Pays You Back
 A Mission Critical Protection Investment That Pays You Back By Wade Ettleman and Earl Philmon June 2012 Page 1 of 8 www.cellwatch.com A Mission Critical Protection Investment That Pays You Back Reliable
Virtualizing the SAP Infrastructure through Grid Technology. WHITE PAPER March 2007
 Virtualizing the SAP Infrastructure through Grid Technology WHITE PAPER March 2007 TABLE OF CONTENTS TABLE OF CONTENTS 2 Introduction 3 The Complexity of the SAP Landscape 3 Specific Pain Areas 4 Virtualizing
Evaluating Hyperconverged Full Stack Solutions by, David Floyer
 Evaluating Hyperconverged Full Stack Solutions by, David Floyer April 30th, 2018 Wikibon analysis and modeling is used to evaluate a Hyperconverged Full Stack approach compared to a traditional x86 White
Analyzing the Economic Value of HPE ConvergedSystem 700 in Enterprise Environments. By Mark Bowker, Senior Analyst and Adam DeMattia, Research Analyst
 Executive Summary Analyzing the Economic Value of HPE ConvergedSystem 700 in Enterprise Environments By Mark Bowker, Senior Analyst and Adam DeMattia, Research Analyst December 2014 This ESG White Paper
BUSINESS VALUE SPOTLIGHT
 BUSINESS VALUE SPOTLIGHT Improve Performance, Increase User Productivity, and Reduce Costs with Database Archiving: A Case Study of AT&T May 2010 Sponsored by Informatica, Inc. Background AT&T's Wireless
The Total Economic Impact Of Dell FX2 Architecture
 A Forrester Total Economic Impact Study Commissioned By Dell Project Director: Sarah Musto July 2016 The Total Economic Impact Of Dell FX2 Architecture Cost Savings And Business Benefits Enabled By FX2
RED HAT ENTERPRISE LINUX. STANDARDIZE & SAVE.
 RED HAT ENTERPRISE LINUX. STANDARDIZE & SAVE. Is putting Contact us INTRODUCTION You know the headaches of managing an infrastructure that is stretched to its limit. Too little staff. Too many users. Not
Predictive Insight, Automation and Expertise Drive Added Value for Managed Services
 Sponsored by: Cisco Services Author: Leslie Rosenberg December 2017 Predictive Insight, Automation and Expertise Drive Added Value for Managed Services IDC OPINION Competitive business leaders are challenging
W H I T E P A P E R I B M P u r e S y s t e m s : D e l i v e r i n g I T E f f i c i e n c y
 Global Headquarters: 5 Speen Street Framingham, MA 01701 USA P.508.872.8200 F.508.935.4015 www.idc.com W H I T E P A P E R I B M P u r e S y s t e m s : D e l i v e r i n g I T E f f i c i e n c y Sponsored
2017 Q4 Earnings Conference Call
 2017 Q4 Earnings Conference Call Forward Looking Statements This presentation includes certain forward-looking statements that are made as of the date hereof and are based upon current expectations, which
BUILD BETTER MICROSOFT SQL SERVER SOLUTIONS Sales Conversation Card
 OVERVIEW SALES OPPORTUNITY Lenovo Database Solutions for Microsoft SQL Server bring together the right mix of hardware infrastructure, software, and services to optimize a wide range of data warehouse
CIO Forum Maximize the value of IT in today s economy
 CIO Forum Maximize the value of IT in today s economy Laura Scott, Vice President Service Product Line Sales Global Technology Services IT infrastructure is reaching a breaking point. 85% idle In distributed
W H I T E P A P E R I B M P u r e F l e x a n d F l e x S y s t e m : I n f r a s t r u c t u r e f o r I T E f f i c i e n c y
 Global Headquarters: 5 Speen Street Framingham, MA 01701 USA P.508.872.8200 F.508.935.4015 www.idc.com W H I T E P A P E R I B M P u r e F l e x a n d F l e x S y s t e m : I n f r a s t r u c t u r e
Tech Data s Acquisition of Avnet Technology Solutions
 Tech Data s Acquisition of Avnet Technology Solutions Creating a Premier Global IT Distributor: From the Data Center to the Living Room September 19, 2016 techdata.com 1 Forward-Looking Statements Safe
34% DOING MORE WITH LESS How Red Hat Enterprise Linux shrinks total cost of ownership (TCO) compared to Windows. I n a study measuring
 compared to Windows. I n a study measuring") WHITEPAPER DOING MORE WITH LESS How shrinks total cost of ownership (TCO) compared to Windows I n a study measuring the TCO of Windows and servers, Red Hat Enterprise platforms exhibited 34% lower annual
WHITEPAPER DOING MORE WITH LESS How shrinks total cost of ownership (TCO) compared to Windows I n a study measuring the TCO of Windows and servers, Red Hat Enterprise platforms exhibited 34% lower annual
Cincinnati Bell Inc. March 4, 2013
 Cincinnati Bell Inc. March 4, 2013 Safe Harbor This presentation and the documents incorporated by reference herein contain forwardlooking statements regarding future events and our future results that
Q Results. Emirates Integrated Telecommunications Company PJSC May 2014
 Q1 214 Results Emirates Integrated Telecommunications Company PJSC May 214 Disclaimer Emirates Integrated Telecommunications Company PJSC (hereafter du ) is a telecommunication services provider in the
3Q17 Results Presentation. 16 October 2017
 3Q17 Results Presentation 16 October 2017 Forward looking statements Important note This presentation and the following discussion may contain forward looking statements by M1 Limited ( M1 ) relating to
IBM Corporation. Global Energy Management System Implementation: Case Study. Global
 Energy Management System Implementation: Case Study IBM Corporation ISO 50001 Registration: Results and Benefits It takes a global team to drive real success. Business case for energy management IBM is
Government IT Modernization and the Adoption of Hybrid Cloud
 Government IT Modernization and the Adoption of Hybrid Cloud An IDC InfoBrief, Sponsored by VMware June 2018 Federal and National Governments Are at an Inflection Point Federal and national governments
Transcript: First Quarter FY 2016 Earnings Conference Call October 29, :00 a.m. ET
 Transcript: First Quarter FY 2016 Earnings Conference Call October 29, 2015 11:00 a.m. ET Welcome to our September 2015 quarter earnings conference call. I'm joined in Indianapolis by Eric Meek, our Chief
The Business Value of Modernizing Infrastructure with Hyper-Converged Systems
 Sponsored by: Dell EMC Authors: Richard L. Villars Eric Sheppard Matthew Marden October 2017 Business Value Highlights 619% five-year ROI 6 months to payback 59% lower cost of operations 73% faster to
ROI CASE STUDY MAY Logicalis Achieves 159% ROI* with CA DCIM Solution
 ROI CASE STUDY MAY 2015 Logicalis Achieves 159% ROI* with CA DCIM Solution 2 ROI CASE STUDY: LOGICALIS MAY 2015 Logicalis increases efficiency and maximizes availability with CA DCIM UK service provider
AtoS IT Solutions and Services. Microsoft Solutions Summit 2012
 Microsoft Solutions Summit 2012 1 Building Private Cloud with Microsoft Solution 2 Building Private Cloud with Microsoft Solution Atos integration Establish a new strategic IT partnership From July 2011
Most likely, your organization is not in the business of running data centers, yet a significant amount of time & money is spent doing just that.
 AWS Cloud Economics Most likely, your organization is not in the business of running data centers, yet a significant amount of time & money is spent doing just that. What if you could: Eliminate the undifferentiated
THE JOURNEY OVERVIEW THREE PHASES TO A SUCCESSFUL MIGRATION ADOPTION ACCENTURE IS 80% IN THE CLOUD
 OVERVIEW Accenture is in the process of transforming itself into a digital-first enterprise. Today, Accenture is 80 percent in a public cloud. As the journey continues, Accenture shares its key learnings
Cisco ACI Helps Integra Compete in Next-Generation Telecom Services Market
 IDC ExpertROI SPOTLIGHT Cisco ACI Helps Integra Compete in Next-Generation Telecom Services Market Sponsored by: Cisco Matthew Marden February 2016 Overview Brad Casemore Founded in 1996, Integra is one
Innovative and Flexible financing. for the New Economy C APITAL. The Leader in End-to-End Financial Services for Your Network Investments
 C APITAL The Leader in End-to-End Financial Services for Your Network Investments Cisco Systems Capital (Australia) Pty Limited Innovative and Flexible financing for the New Economy Challenges Constrained
IBM EXAM QUESTIONS & ANSWERS
 IBM 000-105 EXAM QUESTIONS & ANSWERS Number: 000-105 Passing Score: 650 Time Limit: 60 min File Version: 65.5 http://www.gratisexam.com/ IBM 000-105 EXAM QUESTIONS & ANSWERS Exam Name: Power Systems with
Our Mission: To provide technology resources for the County and set the vision for future technology investments
 Jack Belcher, Chief Information Officer 2100 CLARENDON BLVD., SUITE 612, ARLINGTON, VA 22201 703-228-3220 cio@arlingtonva.us Our Mission: To provide technology resources for the County and set the vision
HPE Hyper Converged 250 for Microsoft CPS Standard Business Value Analysis
 HPE Hyper Converged 250 for Microsoft CPS Standard Business Value Analysis June 2016 Sponsored by Hewlett Packard Enterprise and Microsoft Porter Consulting works with vendors to provide independent assessments
92% Industry-leading 4G LTE population coverage with consistent 4G download speeds
 Solid financial performance in a challenging environment; with key differentiating factors of delivering unmatched customer experience and superior network quality fuelling growth. Financial Review We
The Total Economic Impact Of Citrix s Provisioning Server for Datacenters 4.5
 Prepared for Citrix August 29, 2006 The Total Economic Impact Of Citrix s Provisioning Server for Datacenters 4.5 Project Director: Shaheen Zojwalla Contributor: Jeffrey North TABLE OF CONTENTS Executive
Deutsche Leveraged Finance Conference. Matt Steinfort, CFO
 Deutsche Leveraged Finance Conference Matt Steinfort, CFO October 4, 2017 Safe Harbor Information contained in this presentation that is not historical by nature constitutes forward-looking statements
IMPLICATIONS AND OPPORTUNITIES OF THE REIT MODERNIZATION ACT
 IMPLICATIONS AND OPPORTUNITIES OF THE REIT MODERNIZATION ACT INTRODUCTION Congress created REITs in 1960 to allow people to invest in diversified, professionally managed real estate enterprises, but over
Future of the Data Center
 Future of the Data Center Maine Digital Government Summit November 29, 2012 Dan Diltz Vice President, Public Sector 1 Session Description A new data center is the perfect opportunity to start fresh by
Innovating with Real-Time Data and Insights with SAP HANA for Better Business Outcomes and More Efficient Operations
 Sponsored by: SAP Authors: Carl W. Olofson Matthew Marden November 2016 Innovating with Real-Time Data and Insights with SAP HANA for Better Business Outcomes and More Efficient Operations Business Value
Benefits of IBM Power Systems in the Cloud 2012 IBM Corporation
 Benefits of IBM Power Systems in the Cloud 2012 IBM Corporation Overview Fast Facts Trends and Growth of Cloud Solutions The Realities Infrastructure Matters Integration of Cloud Solutions Value Proposition
Analyzing the Economic Value of HP ConvergedSystem 700x with Microsoft Hyper-V. By Mark Bowker, Senior Analyst and Adam DeMattia, Research Analyst
 White Paper Analyzing the Economic Value of HP ConvergedSystem 700x with Microsoft Hyper-V By Mark Bowker, Senior Analyst and Adam DeMattia, Research Analyst October 2013 This ESG White Paper was commissioned
Total Cost of Ownership: Benefits of the OpenText Cloud
 Total Cost of Ownership: Benefits of the OpenText Cloud OpenText Managed Services in the Cloud delivers on the promise of a digital-first world for businesses of all sizes. This paper examines how organizations
The Future of Business Continuity & Resiliency
 The Future of Business Continuity & Resiliency Richard Cocchiara: IBM Distinguished Engineer; CTO IBM Business Continuity & Resiliency Services (BCRS); Managing Partner IBM Resiliency Consulting Services
IT Transformation Through ESPCs
 June 27, 2013 IT Transformation Through ESPCs Restricted Siemens AG 2013. All rights reserved. siemens.com/answers Contents Integration of IT with Facilities ESPCs as Related to Data Centers Measurement
Exhibit 4.1: Pricing and Volumes Matrix VA UC
 VA180815UC Exhibit 4.1 Pricing and Volumes Matrix VA180815UC COMMONWEALTH OF VIRGINIA VIRGINIA INFORMATION TECHNOLOGIES AGENCY (VITA) SUPPLY CHAIN MANAGEMENT DIVISION 11751 MEADOWVILLE LANE CHESTER, VIRGINIA
Energy Performance Contracting
 Energy Performance Contracting December 2017 Outlines Section One: Jonson Controls as an Energy Service Company (ESCO) Reasons behind investment in Energy Efficiency Section Two: Funding Options of Energy
Storage Infrastructure Optimization
 Brussels, Belgium, 13th TF-Storage Meeting Denis Stanarevic, IBM SIO South East Europe Storage Infrastructure Optimization Setup the scene Cost Categories Environment Time To run... You need The complete
ROI CASE STUDY IBM SPSS CITY OF LANCASTER. ROI: 1301% Payback: 1.5 months Average annual benefit: $1,344,338. Cost : Benefit Ratio 1 : 45.
 ROI CASE STUDY IBM SPSS CITY OF LANCASTER THE BOTTOM LINE The City of Lancaster, California needed to gain greater visibility into where Part I crimes were occurring and where they were expected to occur
Achieving Best in Class Software Savings through Optimization not Negotiation
 Achieving Best in Class Software Savings through Optimization not Negotiation August 10, 2012 Agenda Introduction Industry Trends Best in Class Software Asset Management How good is best in class? How
PLAYBOOK. How Do You Plan to Grow? Evaluating Your Critical Infrastructure Can Help Uncover the Right Strategy
 PLAYBOOK F O R C H A N G E How Do You Plan to Grow? Evaluating Your Critical Infrastructure Can Help Uncover the Right Strategy The world is becoming more digital every day. The demand for feature-rich,
IBM ServiceUnits available for Premium, Standard, and Offsite Services
 IBM United States Hardware Announcement 113-140, dated October 7, 2013 IBM ServiceUnits available for Premium, Standard, and Offsite Services Table of contents 1 Overview 9 Publications 2 Key prerequisites
Create a planet run by the sun.
 Create a planet run by the sun. Sunrun & Comcast Agreement August 24, 2017 Safe Harbor & Forward Looking Statements This presentation contains forward-looking statements within the meaning of Section 27A
W H I T E P A P E R S e r v e r R e f r e s h t o M e e t t h e C h a n g i n g N e e d s o f I T?
 W H I T E P A P E R S e r v e r R e f r e s h t o M e e t t h e C h a n g i n g N e e d s o f I T? Sponsored by: Sun Microsystems and Intel Kenneth Cayton September 2008 E X E C U T I VE SUMMARY Global
IBM Power Systems Express Servers
 Mid-sized businesses are the engines of a Smarter Planet IBM Power Systems Servers companies. With a range of options from blades, 2-U, 4-U rack and tower systems, IBM Power Systems servers provide the
Dell helps you simplify IT
 Dell helps you simplify IT Workshops the first step. Reduce desktop and data center complexity. Improve productivity. Innovate. Dell IT Consulting Services New Edition 2011 Introduction Are you spending
T-Mobile US Q4 and Full Year 2013
 T-Mobile US Q4 and Full Year 2013 Disclaimer This presentation contains forward-looking statements within the meaning of the U.S. federal securities laws. For those statements, we claim the protection
Total Cost of Ownership: Benefits of ECM in the OpenText Cloud
 Total Cost of Ownership: Benefits of ECM in the OpenText Cloud OpenText Managed Services brings together the power of an enterprise cloud platform with the technical skills and business experience required
The Total Economic Impact Of Salesforce Studio
 A Forrester Total Economic Impact Study Commissioned By Salesforce September 2017 The Total Economic Impact Of Salesforce Email Studio Cost Savings And Business Benefits Enabled By The Salesforce Email
REALIZE YOUR. DIGITAL VISION with Digital Private Cloud from Atos and VMware
 REALIZE YOUR DIGITAL VISION with Digital Private Cloud from Atos and VMware Today s critical business challenges and their IT impact Business challenges Maximizing agility to accelerate time to market
Global Headquarters: 5 Speen Street Framingham, MA USA P F
 Global Headquarters: 5 Speen Street Framingham, MA 01701 USA P.508.872.8200 F.508.935.4015 www.idc.com W H I T E P A P E R T h e B u s i n e s s C a s e f o r M i d r a n g e T a p e L i b r a r y S o
SHARED SERVICES - INFORMATION TECHNOLOGY
 Updated: February, 00 EB-00-0 Exhibit D Page of SHARED SERVICES - INFORMATION TECHNOLOGY.0 INTRODUCTION 0 Information Technology ( IT ) refers to computer systems (hardware, software and applications)
Infor Lawson on IBM i 7.1 and IBM POWER7+
 Infor Lawson on IBM i 7.1 and IBM POWER7+ IBM Systems & Technology Group Mike Breitbach mbreit@us.ibm.com This document can be found on the web, Version Date: March, 2014 Table of Contents 1. Introduction...
Markus Kujala, Systems Engineering Manager
 Markus Kujala, Systems Engineering Manager markus@nutanix.com Agenda -How Datacenters are built today - What s in it for you? -Real world examples 2 Agenda -How Datacenters are built today - What s in
Cisco Preparing Its Datacenters for the Next Generation of Virtualization and Hybrid Cloud with Its Application Centric Infrastructure
 IDC BUSINESS VALUE BRIEF: CISCO ACI Cisco Preparing Its Datacenters for the Next Generation of Virtualization and Hybrid Cloud with Its Application Centric Infrastructure Sponsored by: Cisco Matthew Marden
NOKIA FINANCIAL RESULTS Q3 / 2012
 Nokia Internal Use Only NOKIA FINANCIAL RESULTS Q3 / 2012 Conference Call October 18, 2012 15.00 / Helsinki 08.00 / New York Stephen Elop / President & CEO Timo Ihamuotila / CFO Matt Shimao / Head of Investor
CYRUSONE TO ACQUIRE ZENIUM DATA CENTERS
 CYRUSONE TO ACQUIRE ZENIUM DATA CENTERS THIRD QUARTER 2017 EARNINGS October 31, 2017 DECEMBER 21, 2017 SAFE HARBOR S A F E H A R B O R This presentation contains forward-looking statements regarding future
Improving Availability and Lowering TCO with HP Integrity Servers and OpenVMS
 Improving Availability and Lowering TCO with HP Integrity Servers and OpenVMS Comparing mid-range UNIX cluster TCO, availability, and business value www.alinean.com Analyst: Thomas Pisello, author of IT
Cincinnati Bell Third Quarter 2011 Results. November 3, 2011
 Cincinnati Bell Third Quarter 2011 Results November 3, 2011 Today s Agenda Performance Highlights Jack Cassidy, President & Chief Executive Officer Review of Wireline, Wireless, IT Services & Hardware
Total Economic Impact Of Trend Micro Enterprise Security
 Prepared for Trend Micro June 2011 Total Economic Impact Of Trend Micro Enterprise Security Project Directors: Jon Erickson and Sadaf Roshan Bellord TABLE OF CONTENTS Executive Summary... 3 Purpose...
Hybrid Cloud 1. ebookiness created by the HPE Europe Division of Ingram Micro
 Hybrid Cloud 1 contents 3 Hybrid IT: the path to the Cloud HPE & Microsoft: the strongest commitment to the Hybrid cloud 4 5 Accelerate your business with the hybrid cloud offered by HPE and Azure Why
Ericsson Second quarter 2018
 Ericsson Second quarter 2018 July 18, 2018 Telefonaktiebolaget LM Ericsson 2018 Second quarter report 2018 July 18, 2018 Page 1 Peter Nyquist Vice President Investor Relations Telefonaktiebolaget LM Ericsson
Power your planet. Optimizing the Enterprise Data Center POWER7 Powers a Smarter Infrastructure
 Power your planet. Optimizing the Enterprise Data Center POWER7 Powers a Smarter Infrastructure Enoch Lau Field Technical Sales Specialist, Power Systems Systems & Technology Group Power your planet. Smarter
DATACENTER AS A SERVICE. We unburden you at the level you desire
 DATACENTER AS A SERVICE We unburden you at the level you desire MARKET TREND BY VARIOUS ANALYSTS The concept of flexible and scalable computing is a key reason to create a Cloud based architecture 77%
The Total Economic Impact Of Microsoft Windows Server 2012 R2
 A Forrester Total Economic Impact Study Commissioned By Microsoft Project Director: Sean Owens June 2014 The Total Economic Impact Of Microsoft Windows Server 2012 R2 Cost Savings And Business Benefits
FY16 Results Presentation. 24 January 2017
 FY16 Results Presentation 24 January 2017 Forward looking statements Important note This presentation and the following discussion may contain forward looking statements by M1 Limited ( M1 ) relating to
Oracle Buys Automated Applications Controls Leader LogicalApps
 Oracle Buys Automated Applications Controls Leader LogicalApps To strengthen Oracle s Governance, Risk and Compliance Suite with Real-time Policy Enforcement October 26, 2007 Disclaimer The following is
Verizon closes 2017 with strong wireless customer growth and retention, well-positioned in new markets
 News Release FOR IMMEDIATE RELEASE January 23, 2018 Media contact: Bob Varettoni 908.559.6388 robert.a.varettoni@verizon.com Verizon closes 2017 with strong wireless customer growth and retention, well-positioned
Return On Investment (ROI) for IP Communications
 for IP Communications") Return On Investment (ROI) for IP Communications 2002, Cisco Systems, Inc. All rights reserved. 1 Agenda General ROI Trends Changes in the Capital Budgeting Process Building the Business Case for New Technologies
Return On Investment (ROI) for IP Communications 2002, Cisco Systems, Inc. All rights reserved. 1 Agenda General ROI Trends Changes in the Capital Budgeting Process Building the Business Case for New Technologies
Investor Presentation. February 2016
 Investor Presentation February 2016 Disclaimer Forward-Looking Statements This presentation contains forward-looking statements within the meaning of Section 27A of the Securities Act of 1933, as amended,
Windstream acquisition of Broadview Networks Transaction overview April 13, 2017
 Windstream acquisition of Broadview Networks Transaction overview April 13, 2017 Safe Harbor Statement Windstream Holdings, Inc. claim the protection of the safe-harbor for forward-looking statements contained
Power Systems for Your Business
 Hotel Mulia Jakarta Power Systems for Your Business Septia Sukariningrum Power Systems Technical Sales Specialist IBM Indonesia The datacenter is changing Server sprawl resulting in lack of space Datacenter
DATA CENTER COLOCATION BUILD VS. BUY
 DATA CENTER COLOCATION BUILD VS. BUY Comparing the total cost of ownership of building your own data center vs. buying third-party colocation services Executive Summary As businesses grow, the need for
Service Provider Consulting
 From Microsoft Services 1 Industry Overview More and more businesses are looking to outsource IT, decrease management requirements and ultimately save money. With worldwide public cloud spending expected
Business Value Enabled by HPE Datacenter Care Service
 Sponsored by: HPE Authors: Elaina Stergiades Rob Brothers Matthew Marden May 2016 Business Value Enabled by HPE Datacenter Care Service EXECUTIVE SUMMARY As more enterprises adopt technologies such as
VMware vsphere subscription upgrades available
 , dated March 2, 2010 VMware vsphere subscription upgrades available Table of contents 1 Overview 4 Program number 2 Key prerequisites 4 Technical information 2 Planned availability date 5 Ordering information
Interoute Acquisition Summary. February 26, 2018
 Interoute Acquisition Summary February 26, 2018 Disclaimer Forward-Looking Statements: This presentation contains forward-looking statements which are made pursuant to the safe harbor provisions of Section
Symantec Data Center Transformation
 Symantec Data Center Transformation A holistic framework for IT evolution As enterprises become increasingly dependent on information technology, the complexity, cost, and performance of IT environments
1Q 2016 Earnings Conference Call. April 29, 2016
 1Q 2016 Earnings Conference Call April 29, 2016 Safe Harbor Statement This presentation includes forward-looking statements within the meaning of Section 27A of the Securities Act and Section 21E of the
DATACENTER SERVICES DATACENTER
 SERVICES SOLUTION SUMMARY ALL CHANGE React, grow and innovate faster with Computacenter s agile infrastructure services Customers expect an always-on, superfast response. Businesses need to release new
Management Update: Storage Management TCO Considerations
 IGG-09172003-01 C. Stanley Article 17 September 2003 Management Update: Storage Management TCO Considerations CIOs, asset managers, data center managers and business managers should be aware of the total
Cisco Start. IT solutions designed to propel your business
 Cisco Start IT solutions designed to propel your business Small and medium-sized businesses (SMBs) typically have very limited resources to invest in new technologies. With every IT investment made, they
The Advantages of Leasing IBM Storwize V7000 Storage Systems Cal Braunstein CEO and Executive Director of Research
 The Advantages of Leasing IBM Storwize V7000 Storage Systems Cal Braunstein CEO and Executive Director of Research Table of Contents Executive Summary... 3 Hyper-Efficient Storage... 3 The Value of Leasing...
Q Earnings Conference Call. November 6, 2018
 Q3 2018 Earnings Conference Call November 6, 2018 Safe Harbor Statement This presentation includes forward-looking statements within the meaning of Section 27A of the Securities Act and Section 21E of
Conference call April 26, :00 / Helsinki 08:00 / New York 1 Nokia 2016 Q1 2018
 Conference call April 26, 2018 15:00 / Helsinki 08:00 / New York 1 Nokia 2016 Q1 2018 Disclaimer It should be noted that Nokia and its business are exposed to various risks and uncertainties, and certain
Mid-Market Data Center Purchasing Drivers, Priorities and Barriers
 Mid-Market Data Center Purchasing Drivers, Priorities and Barriers Featuring Sophia Vargas, Forrester Research Inc. 30 May 2014 Introducing today s presenters: Matt Miszewski Senior Vice President of Sales