Sorting Fields Changing the Values Line Charts Scatter Graphs Charts Showing Frequency Pie Charts Bar Charts...
|
|
|
- Stewart O’Connor’
- 5 years ago
- Views:
Transcription

1 Database Guide
2 Contents Introduction... 1 What is RM Easiteach Database?... 1 The Database Toolbar... 2 Reviewing the License Agreement... 3 Using Database... 3 Starting Database... 3 Key Features... 4 Creating a Simple Database... 4 Making a Record... 4 Creating Fields... 4 Entering Data... 5 Adding New Records... 6 Navigating Between Records... 7 Sorting Fields... 7 Adding and Deleting Records and Fields... 8 Deleting Records... 8 Adding and Deleting Fields... 8 Adding a Field... 8 Deleting a Field... 9 Displaying a Table... 9 Editing Content Creating a Query Creating Charts Selecting Fields Choosing the Chart Bar Chart i
3 Sorting Fields Changing the Values Line Charts Scatter Graphs Charts Showing Frequency Pie Charts Bar Charts Copying and Pasting Your Chart Table Map Creating Databases in Table Map Creating a Report Adding Fields Deleting Fields Sorting the Database Relationship Editing and Formatting Fields Moving and Sizing Field Labels and Boxes Formatting Fields Properties Creating a Check Box Inserting a Default Image Creating a Drop-Down List Locking Databases Printing Database Files Tips for Using Database Quick Tips Ideas for Lessons ii
4 Introduction 1 RM Easiteach Database combines powerful professional features with simple tools that make managing and analyzing records an engaging activity. What is RM Easiteach Database? Database programs are used to store information electronically. Information about an individual object is entered into the fields on a record. The records of all the objects in a group form the database. Information stored in the database can be manipulated to answer questions, presented as tables or reports, and analyzed using charts and graphs. RM Easiteach Database can be used for collecting, displaying, and analyzing any type of data. There is support for dates, numbers, lists, and pictures, as well as sounds, animations, and videos. Data can be entered into fields in a wide variety of forms, sorted, and selected. Charts and graphs are easy to produce and present, and tables can be displayed for quick viewing. RM Easiteach Database also contains example databases for demonstrating and working with sample data in the classroom. Databases are powerful programs. To make the best use of RM Easiteach Database, it is a good idea to read through the guide before you begin.

5 The Database Toolbar 2 Previous Record Opens the previous record in your database Last Record Navigates to the last record in your database Add Field Adds a new field to a record Select Records Use to run a query to select records that match certain conditions Chart Creates a range of charts to analyse your records Add Record Adds a new record to your database Sort Up Sorts your database up by the selected field Delete Record Deletes a record from your database Next Record Opens the next record in your database First Record Navigates to the first record in your database Properties Use to format fields, create check boxes and add drop-down lists Change Data View Displays your records in a table Table Map Use to manage your records and create new reports Sort Down Sorts your database down by the selected field
6 Reviewing the License Agreement 3 If you wish to review your License Agreement while you are running RM Easiteach: 1. Click File > About RM Easiteach. 2. Select License Agreement. Using Database Starting Database To run Database, select Toolbars from the bottom of the RM Easiteach screen and click Database. The Database toolbar is now visible on the RM Easiteach page. To see examples of RM Easiteach Database, select File > Open > Examples and click Database.
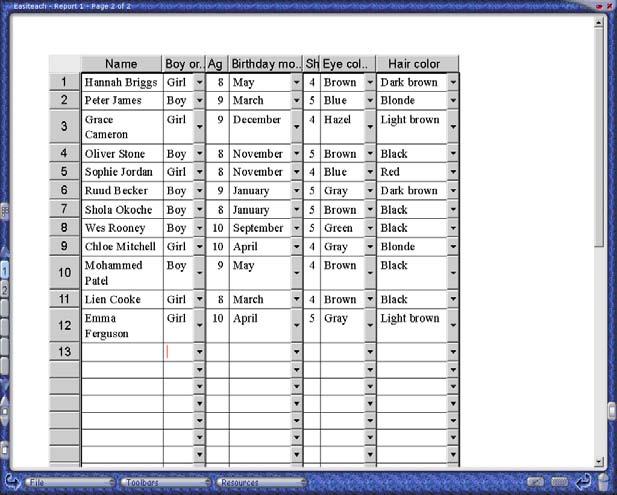
7 Key Features 4 Creating a Simple Database In the following example, Database is used to record the ages and heights of students in centimeters for a Science lesson. It demonstrates what you can do with RM Easiteach Database. Making a Record A database is used to store information about a set of objects, such as a group of students. The information about each object is kept on a record for example, all the information kept on one student. Each record is divided into fields, and each field contains a separate piece of information about the object. Creating Fields 1. Select the Add Field button from the Database toolbar. The new field displays as a blue dashed box. 2. Click near the top of the page to place the field label and field box. The field label is highlighted in gray. 3. Type the word Name, and the field label changes from Field1 to Name.
8 4. Add two more fields further down the page and label them Age and Height If you want to customize your field labels and boxes for example, resize a field for a picture, add a fill color, or rotate a field label - see Editing and Formatting Fields on p. 34. The fields are now ready to accept your data. Entering Data You can enter text, numbers, and images into the field box. 1. Enter your data by clicking inside a field box and typing the information. You have now created the first record in your database. 2. You can preset the format of the data entered in any field box. For example, you can choose to display the units of a measurement, such as cm, so that you need not type it each time. See Editing and Formatting Fields on
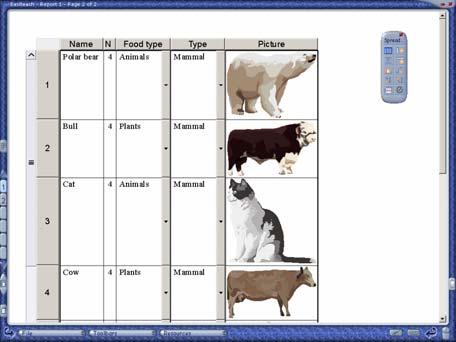
9 p. 34 for simple instructions. 3. If you want to add an image to a field, go to Resources and Multimedia Bank. You can select images from Multimedia or navigate to other picture resources through this window. Select the image and drag it into the field box. 6 Adding New Records 1. To make a record for the next student, click the New Record button. You are presented with a blank record sheet to fill in. 2. Repeat the procedure for everyone you wish to add to the database. Your database now contains a record for each of your students.
10 Navigating Between Records 7 You can quickly navigate through the database using the buttons on your Database toolbar. 1. To move between adjacent records, use the Previous Record and Next Record buttons. 2. To move to the beginning or end of your database, use the First Record and Last Record buttons. Sorting Fields You can use the Sort Up and Sort Down buttons to sort the records in your database by any field. Text entries sort alphabetically; figures sort by number size. For example, if a Height field is sorted up, all the records in the database rearrange in order of height shortest to tallest. Using Sort Up and Sort Down can help you spot trends or patterns in your database. 1. To select a field for sorting, you can either click inside a field box or select Change Data View and click a column heading. 2. Now press the Sort Up or Sort Down button. The database sorts by the selected field.
11 Adding and Deleting Records and Fields 8 Deleting Records If you want to delete a record, navigate to the record and click the Delete Record button on the Database toolbar. The record is deleted with no further warning message. This action cannot be undone on the RM Easiteach toolbar, so make sure that you are deleting the correct record. Adding and Deleting Fields You can add a new field or delete a field throughout your database. Adding a Field 1. To add a field, open any record and select the New Field button. 2. Place the field on your page and click on the field label to rename it. The field appears on all the records in your database.


12 Deleting a Field 1. To delete a field, press the Table Map button on the Database toolbar to open the Table Map window Select the field name for deletion, and click the Delete Field button on the Table Map window. The field and its data are deleted from all records in your database. This action is carried out without further warning and cannot be undone. Displaying a Table You can view all the records you have created in your database in a table. 1. Select Change Data View on the Database toolbar to display the table. 2. You can edit the records in your database from this view by clicking on the data and amending it. 3. To close the table, click Change Data View again.
13 You can also create reports - tables containing a selection of the fields in your database. For example, you can create a table showing only name and height. Reports are particularly useful when a database contains a large number of fields. Making a report produces a smaller table on the page, and allows the students to focus on a few fields. 10 See Table Map on p. 24 for instructions on creating reports. Editing Content You can change the information in records whether they are being viewed individually as pages or collectively as a table. 1. Go to Toolbars > RM Easiteach at the bottom of the screen, and select Edit Mode from the RM Easiteach toolbar. 2. To change the information on a page, simply click inside the required field box and amend its contents. 3. To edit a number of records, select Change Data View to show the database in table format. Click on the items to be changed. The changes now appear on the individual pages.

14 Creating a Query 11 A query lets you view data in your database that matches certain conditions for example, all students in the database who are more than 136 cm tall. While the query is active you can only see the records that match these conditions. 1. To run a query, click the Select Records button on the Database toolbar to open the Query window. 2. Select the required field name from the drop-down list in the first box in this example, the Height field. The next box becomes active.


15 3. Select the condition from the drop-down list in the criteria box in this example, is greater than. You can choose to use mathematical symbols instead of words such as > for is greater than - by clicking the Use symbols option The third box is now active. Select the required value from the drop-down list in the box. The list contains all the values under the field name being queried.

16 5. When all the boxes are complete, press the Add to query button. The query appears in the large Query box You can now choose to add another condition by selecting the And or Or buttons on the Query window. For example, And Age - is less than When your query is ready, click the Run Query button on the Query window.

17 8. While the query is running, you can only see the records that meet the conditions the rest of the records are hidden from view. The number of records found meeting the conditions is displayed on the page To remove the query and return to normal viewing, click the Clear button on the Query window. Creating Charts Database lets you make bar charts, line charts, scatter graphs, and pie charts using the data in your databases. Selecting Fields To create a chart, you first need to select the fields to be used. The first field name that you choose becomes the x-axis (horizontal axis) of the chart. You can select the fields by clicking in the field boxes or selecting the field labels.
18 1. If you are working on a database that has been saved, go to Toolbars at the bottom of the screen and select RM Easiteach. Now click Edit Mode on the RM Easiteach toolbar. 2. Select a single field box by double-clicking inside the box To select multiple field boxes, double-click inside the first box and then right-click inside subsequent boxes. 4. You can also select fields by their field labels. Double-click on one field label and then right-click on subsequent labels. 5. You can also group-select several field labels by clicking the pointer close to the field labels and then holding and dragging across them. To look at the first chart, group-select all the fields Name, Age and Height.

19 16 Choosing the Chart When the fields are selected, the Chart button is enabled on the Database toolbar. 1. Click the Chart button to open the Chart palette. 2. Selecting a chart type displays your fields in its format. You can click between the types of chart to show your chart in different modes. 3. If you want a background grid on your chart, select the Grid option. Grids can be useful as a quick reference for calculating heights and values in a graph. 4. You can rename your chart by clicking the title Chart and retyping the text.
20 Bar Chart 17 Select the field labels and press the Bar Chart button to display them in bar chart format. In the example, the Name field forms the x-axis because it was the first field selected. Sorting Fields Sorting a field before preparing a chart affects its appearance. Click in the field box, and use the Sort Up or Sort Down buttons on the Database toolbar. You can use the Sort Up button here to prepare a chart showing Height by Age, and the trend towards growth with age. 1. Click in the Age field box and select Sort Up. The database records are arranged in order of age youngest to oldest. 2. Select the Name and then the Height field labels, and click the Bar Chart button from the Chart palette.
 is too great.")

21 The chart now shows height by age, demonstrating the trend towards growth with age. 18 However, the differences in height are difficult to read because the range of values on the y-axis (0-150 cm) is too great. This can be improved by changing the values. Changing the Values You can change the values on the axes to alter the display and make the chart more readable and meaningful. 1. Select the values on the chart and retype them in the example the Height values are changed to start at 130 and end at Click the page to enter the new values. The chart now shows the differences in height, and a trend towards growth with age.
22 Line Charts 19 Line charts are useful for showing trends set against each other. They are prepared in exactly the same way as bar charts. In the example, the Sort Up button is used once again to prepare a line chart showing Height by Age, and the trend towards growth with age. 1. Click in the Age field box, and use the Sort Up button on the Database toolbar. The database records are arranged in order of age youngest to oldest. 2. Select the Name, Age and Height fields and press the Line Chart button on the Chart palette.
23 Scatter Graphs 20 Scatter graphs are used to show the relationships between different numeric series. A scatter graph must have at least two series of numbers. In the example, height is plotted against age. 1. Select Height and then Age from the field labels. 2. Go to Chart and press the Scatter graph button to display your graph. 3. You can change the start and end values on the axes to alter the display. Simply select the values and retype them.

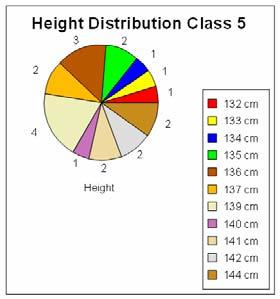
24 Charts Showing Frequency 21 You can use Pie Charts and Bar Charts to show frequency how often a type of data occurs in a field. The frequency can be shown as a number or a percentage of occurrences. Pie Charts A pie chart shows how the total number of database entries in a field is divided up. The example shows the distribution of height in the database. 1. To create a pie chart, select a single field label on your page and choose Pie Chart from the Chart palette. The chart shows height by frequency of occurrence the number of times each height occurs in the group. 2. To select a single cell, simply double-click the cell. 3. To show height by percentage of occurrence, select the Percentage option on the Chart palette.


25 Bar Charts 22 Using bar charts you can express the frequency of individual numbers. 1. Select a single field label in the example, this is Height - and press the Bar Chart button on the Chart palette. 2. As only one field label has been selected, the frequency option is selected by default. 3. To show the frequency of occurrence as a percentage, select the Percentage option on the Chart palette.
26 Copying and Pasting Your Chart 23 When you have completed your chart, you can copy and paste it to a new page. 1. Select the chart and click the Copy button on the RM Easiteach toolbar. 2. Now open the destination page. To open a new page, select New Page at the side of the RM Easiteach screen. Click the destination page and select Paste from the RM Easiteach toolbar. 3. Once the chart has been copied and pasted, you cannot edit the text or values. However, you can change the chart format by selecting the buttons and options on the Chart palette.
27 Table Map 24 Table Map is a powerful organizer. You can create databases as tables; rename tables; sort, add, and delete fields; and make reports from your database records. Creating Databases in Table Map Using Table Map you can create a database that opens in table mode. The column headings are the field names, and each row represents a record of the database. This makes it easy to enter large amounts of data. Selecting Change Data View shows the individual records in the database. To create the database: 1. Press Table Map on the Database toolbar to open the Table Map window.

28 2. Click the New Table button on the Table Map window. The table header and first field appear on the Table Map window. 25 If the New Table button is inactive, go to File > Save and save the file. Reopen Table Map and select the New Table button. 3. To add more fields, click a blank area on the column heading to select the table and activate the New Field button on the Table Map window. 4. Click the New Field button to add more fields. You can also add more fields by clicking a field tab and pressing Enter on your keyboard.


29 5. Click the Table1 heading and type the name of your database. Then click inside the fields and change the field names as required To place the table on the page, click the table header to select the table and then drag the table by the header onto the page. It is displayed as a blue dotted frame until it is released.

30 7. You can now close or minimize the Table Map window to view the table. Click inside the first row to type the data for the first record. Continue until all the records have been entered. You can add a new record at any time by entering it into a new row on the table. 27 To create a record form, rather than a table map, select Insert New Page from the side of the RM Easiteach screen and drag the individual fields onto the page.

31 Creating a Report 28 You can create a report from your database for example, a table showing only names and wings. This can be useful when your database contains a large number of fields. Making a report allows you to focus on a few fields in a table that fits on one page. When you create a report from your database, you must work on a new page in your RM Easibook. If you amend the table shown in Change Data View on the original page, and the file is saved accidentally, the amendments to the table view will also be saved. 1. Open a new page by selecting Insert New Page from the side of the RM Easiteach screen. 2. Select Table Map on the Database toolbar to open the Table Map window. 3. Click the tab of the first field that you want in your report. Hold the Ctrl button down on your keyboard and select the other fields you require.


32 29 4. Click and hold one of the selected field tabs, and drag the fields onto the page. 5. You can now close the Table Map window. The fields that are not being used in the report are simply hidden from view. They can be viewed at any time by selecting Change Data View on the Database toolbar. Your report is now complete.


33 Adding Fields To add a field and display the new version of the fields as a table, you must open a new page. Click Insert New Page at the side of the screen. 2. Click Table Map and select the field above the point where you want to insert a new field. Click the Add field button on the Table Map window. You can also add a field by clicking the last field in the table and then pressing Return on your keyboard. 3. Select the field name and change it. 4. Click a blank area on the column heading to select the table, and drag it to the page.

34 5. You can move the new table view showing the new fields to page 1 of your RM Easibook. Go to View at the side of the screen and select View > Storyboard Click the table and drag it to the top left corner of the screen. A red line displays the insertion point.

35 7. You can also delete unwanted tables in Storyboard. Click the table to select it, and either drag it to the Garbage or press Delete on your keyboard To return to normal viewing, either select View > Normal or press page 1 at the side of the screen. Deleting Fields To delete a field, click the field and then the Delete field button on the Table Map window. This action is carried out without further warning and cannot be undone.


36 Sorting the Database 33 You can sort the database by clicking a field tab and selecting the Key button on the Table Map window. The field name highlights in blue and the records in the database sort up by the field text sorts in alphabetical order and numbers sort by number size. Relationship The Relationship button highlights when you have created a relationship between two tables for example, when the field has a drop-down list. A line links the two related tables.
37 Editing and Formatting Fields 34 Moving and Sizing Field Labels and Boxes 1. Click near the field box or field label, or both items if required. Now hold down and drag the pointer over the objects to select them. 2. To resize objects, click and drag the corner points. If you want to rotate the field label, drag the green handle. 3. To move a field box and/or field label, move the pointer over the selected objects until it changes to a hand, and then hold and drag them into place.

38 Formatting Fields 35 You can preset the format of the data entered in any field box using the Effects button on the RM Easiteach toolbar. For example, you can choose to display height in cm or use currency symbols. 1. Select the field that you want to format by double-clicking inside the field box or on the field label. 2. Click Toolbars at the bottom of the RM Easiteach screen and select RM Easiteach. If the Effects button is not visible, click the bottom arrow on the toolbar to extend it. 3. Click Effects to open the Effects window and select Cell from the tabs. 4. Select the format required from the list of Format options, and click the Effects button to format the field. 5. The Format box contains commonly used formats. If you want to create your own format, for example kg, simply type it in the format box. To make the format appear to the right of the value, enter a 1 before it, e.g. 1kg. 6. The Cell tab also allows you to change the Justification (alignment) of the data in the field and set a Fill color for the fields.
39 Properties 36 You can use Properties to check or change the type of data a field contains and how it is displayed. You can also make an image the default image for empty cells. Drop-down lists and Boolean (Yes/No or True/False) boxes are created using the Field Properties window. 1. To open the Field Properties window, select the Properties button on the Database toolbar. 2. To format a field, select the field name from the Field box and select the required Field type and properties.


40 Creating a Check Box 37 You can format a field as a Yes/No check box. 1. Create and name the field and open the Properties window. Select the field name from the drop-down list. 2. Go to Field type and select Boolean from the drop-down list. 3. The field changes to a box. The box can be checked or cleared by clicking on it.

41 Inserting a Default Image 38 You can use the Picture box to select an image to appear on all empty fields in the records. For example, you could choose a school emblem, such as a bee. Placing a picture in empty fields helps to highlight fields that have not been filled in. 1. Click the Picture button under the Picture box. The Multimedia Bank opens. You can choose an RM Easiteach picture file or navigate to other picture or photo files. Click the required image and it appears in the Picture box. 2. If the image has not already appeared in the empty fields, click the Next Record button on the Database toolbar to activate it. Creating a Drop-Down List If you have a field that contains a limited number of entry types for example, a gender field you can create a drop-down list to make entering easier.

42 1. After you have created and named your field, open Properties on the Database toolbar. Click the arrow in the Field box on the Properties window, and select the field Now select the Use list option in List values. 3. Type a word into the small List values box and click the Add button. The word appears in the large List values box. You can also add pictures from the Multimedia Bank by selecting Picture. 4. When your list is complete, close the Field Properties window. Clicking inside the field box now reveals a drop-down list. Click an item to enter it. If you want to make the list appear in a particular order, for example months of the year, you need to enter them in reverse order.
43 Locking Databases 40 You may wish to lock your database to prevent the field labels and boxes being deleted or changed in error. This will not, however, lock the data within the fields. 1. Open the Easiteach toolbar and click the down arrow at the bottom of the toolbar to display the Utilities button. 2. If you are working on a saved database, press the Edit Mode button. 3. Select all the field labels and boxes by clicking in the top left corner of the page and dragging to the bottom right. They can also be selected by pressing Ctrl+A on the keyboard. 4. Click the Utilities button to open the Utilities toolbar and press Lock/Unlock to Background. Your selection is now locked to the page. 5. To access locked field labels and boxes, click the Access Locked Items button on the Utilities toolbar. The button highlights while the locked items are accessible. You can now edit the fields. 6. Click the Access Locked Items again to relock or click the Lock/Unlock to Background button to remove the locking completely.
44 Printing Database Files 41 To print a Database page, select File > Print. Choose the number of copies required and check that the Only this page option is active. Tips for Using Database Quick Tips To enter today s date in a field or anywhere on the page, click where the date is required and press Ctrl+D on your keyboard. To change the format of the date, see Editing and Formatting Fields on p. 34. When viewing your database in table format, you can alter the width of the columns to make viewing easier. Hold the pointer over the edges of the columns until the arrows appear. Now hold down and drag the column to a more suitable width. Ideas for Lessons If the students need to collect data, you can create the field boxes and field labels for a database table and print it blank for students to use.

45 You can either use the individual sheets or select Change Data View for a table format. 42 If you wish to use sample data, rather than creating your own, you can use preprepared examples of Database. Go to File > Open > Examples... and select Database. You can use these files as demonstration models. Ask the students to create a database entry screen that can also be used as a questionnaire. Take photos of the students with a digital camera or scan in images of their pets, and add these to your student database. Encourage historical research by creating databases about interesting personalities from the past.
46 Chart the growing patterns of plants in different habitats and use the scatter graph function to plot relationships. 43 RM Part Number: 17U-774 RM Easiteach Database Guide (US English) v1. Copyright Research Machines plc, All rights reserved.
Geography. Getting Started Guide
 Geography Getting Started Guide Contents Introduction 1 Installing RM Easiteach Geography 1 Expand and Enhance your Use of RM Easiteach 1 Reviewing your License Agreement 2 Key Features 3 Grid Overlay
Excel Core Certification
 Microsoft Office Specialist 2010 Microsoft Excel Core Certification 2010 Lesson 6: Working with Charts Lesson Objectives This lesson introduces you to working with charts. You will look at how to create
Working with Tables in Word 2010
 Working with Tables in Word 2010 Table of Contents INSERT OR CREATE A TABLE... 2 USE TABLE TEMPLATES (QUICK TABLES)... 2 USE THE TABLE MENU... 2 USE THE INSERT TABLE COMMAND... 2 KNOW YOUR AUTOFIT OPTIONS...
Science. Getting Started Guide
 Science Getting Started Guide Contents Introduction 1 Installing RM Easiteach Science 1 Extend and Enhance your Use of RM Easiteach 1 Reviewing your License Agreement 2 Key Features 3 Magnetic Lines 3
Microsoft Excel 2010 Part 2: Intermediate Excel
 CALIFORNIA STATE UNIVERSITY, LOS ANGELES INFORMATION TECHNOLOGY SERVICES Microsoft Excel 2010 Part 2: Intermediate Excel Spring 2014, Version 1.0 Table of Contents Introduction...3 Working with Rows and
Creating a Spreadsheet by Using Excel
 The Excel window...40 Viewing worksheets...41 Entering data...41 Change the cell data format...42 Select cells...42 Move or copy cells...43 Delete or clear cells...43 Enter a series...44 Find or replace
EXCEL 2003 DISCLAIMER:
 EXCEL 2003 DISCLAIMER: This reference guide is meant for experienced Microsoft Excel users. It provides a list of quick tips and shortcuts for familiar features. This guide does NOT replace training or
Spreadsheet definition: Starting a New Excel Worksheet: Navigating Through an Excel Worksheet
 Copyright 1 99 Spreadsheet definition: A spreadsheet stores and manipulates data that lends itself to being stored in a table type format (e.g. Accounts, Science Experiments, Mathematical Trends, Statistics,
Microsoft Excel 2007
 Microsoft Excel 2007 1 Excel is Microsoft s Spreadsheet program. Spreadsheets are often used as a method of displaying and manipulating groups of data in an effective manner. It was originally created
IT2.weebly.com Applied ICT 9713
 Chapter 11 Database and charts You already know how to o define database record structures o enter data into a database o select subsets of data within a database o sort data within a database o produce
Application of Skills: Microsoft Excel 2013 Tutorial
 Application of Skills: Microsoft Excel 2013 Tutorial Throughout this module, you will progress through a series of steps to create a spreadsheet for sales of a club or organization. You will continue to
Starter. Getting Started Guide
 Starter Getting Started Guide Contents Introduction... 1 Installing and Licensing Easiteach... 1 Expand and Enhance your Use of Easiteach... 1 Key Features... 3 Screen Menus... 3 File... 3 Toolbars...
Spreadsheet Concepts: Creating Charts in Microsoft Excel
 Spreadsheet Concepts: Creating Charts in Microsoft Excel lab 6 Objectives: Upon successful completion of Lab 6, you will be able to Create a simple chart on a separate chart sheet and embed it in the worksheet
Spreadsheet Warm Up for SSAC Geology of National Parks Modules, 2: Elementary Spreadsheet Manipulations and Graphing Tasks
 University of South Florida Scholar Commons Tampa Library Faculty and Staff Publications Tampa Library 2009 Spreadsheet Warm Up for SSAC Geology of National Parks Modules, 2: Elementary Spreadsheet Manipulations
SUM - This says to add together cells F28 through F35. Notice that it will show your result is
 COUNTA - The COUNTA function will examine a set of cells and tell you how many cells are not empty. In this example, Excel analyzed 19 cells and found that only 18 were not empty. COUNTBLANK - The COUNTBLANK
Microsoft Excel 2002 M O D U L E 2
 THE COMPLETE Excel 2002 M O D U L E 2 CompleteVISUAL TM Step-by-step Series Computer Training Manual www.computertrainingmanual.com Copyright Notice Copyright 2002 EBook Publishing. All rights reserved.
12 BASICS OF MS-EXCEL
 12 BASICS OF MS-EXCEL 12.1 INTRODUCTION MS-Excel 2000 is a Windows based application package. It is quite useful in entering, editing, analysis and storing of data. Arithmetic operations with numerical
SPREADSHEET (Excel 2007)
") SPREADSHEET (Excel 2007) 1 U N I T 0 4 BY I F T I K H A R H U S S A I N B A B U R Spreadsheet Microsoft Office Excel 2007 (or Excel) is a computer program used to enter, analyze, and present quantitative
SPREADSHEET (Excel 2007) 1 U N I T 0 4 BY I F T I K H A R H U S S A I N B A B U R Spreadsheet Microsoft Office Excel 2007 (or Excel) is a computer program used to enter, analyze, and present quantitative
Part 1: Basics. Page Sorter:
 Part 1: Basics Page Sorter: The Page Sorter displays all the pages in an open file as thumbnails and automatically updates as you add content. The page sorter can do the following. Display Pages Create
Excel 2007 New Features Table of Contents
 Table of Contents Excel 2007 New Interface... 1 Quick Access Toolbar... 1 Minimizing the Ribbon... 1 The Office Button... 2 Format as Table Filters and Sorting... 2 Table Tools... 4 Filtering Data... 4
Microsoft Office Excel
 Microsoft Office 2007 - Excel Help Click on the Microsoft Office Excel Help button in the top right corner. Type the desired word in the search box and then press the Enter key. Choose the desired topic
Introduction to Excel 2007
 Introduction to Excel 2007 These documents are based on and developed from information published in the LTS Online Help Collection (www.uwec.edu/help) developed by the University of Wisconsin Eau Claire
Gloucester County Library System EXCEL 2007
 Gloucester County Library System EXCEL 2007 Introduction What is Excel? Microsoft E x c e l is an electronic s preadsheet program. I t is capable o f performing many diff e r e n t t y p e s o f c a l
Excel Foundation Quick Reference (Windows PC)
") Excel Foundation Quick Reference (Windows PC) See https://staff.brighton.ac.uk/is/training/pages/excel/foundation.aspx for videos and exercises to accompany this quick reference card. Structure of a spreadsheet
Excel Foundation Quick Reference (Windows PC) See https://staff.brighton.ac.uk/is/training/pages/excel/foundation.aspx for videos and exercises to accompany this quick reference card. Structure of a spreadsheet
Introduction to Microsoft Excel 2010
 Introduction to Microsoft Excel 2010 This class is designed to cover the following basics: What you can do with Excel Excel Ribbon Moving and selecting cells Formatting cells Adding Worksheets, Rows and
Creating a Basic Chart in Excel 2007
 Creating a Basic Chart in Excel 2007 A chart is a pictorial representation of the data you enter in a worksheet. Often, a chart can be a more descriptive way of representing your data. As a result, those
Excel 2003 Tutorial II
 This tutorial was adapted from a tutorial by see its complete version at http://www.fgcu.edu/support/office2000/excel/index.html Excel 2003 Tutorial II Charts Chart Wizard Chart toolbar Resizing a chart
3/31/2016. Spreadsheets. Spreadsheets. Spreadsheets and Data Management. Unit 3. Can be used to automatically
 MICROSOFT EXCEL and Data Management Unit 3 Thursday March 31, 2016 Allow users to perform simple and complex sorting Allow users to perform calculations quickly Organizes and presents figures that can
SmartView. User Guide - Analysis. Version 2.0
 SmartView User Guide - Analysis Version 2.0 Table of Contents Page i Table of Contents Table Of Contents I Introduction 1 Dashboard Layouts 2 Dashboard Mode 2 Story Mode 3 Dashboard Controls 4 Dashboards
course notes quick reference guide
 course notes quick reference guide Microsoft Excel 2010 Welcome to Excel 2010 Excel 2010 is the premier spreadsheet application from Microsoft. Excel 2010 makes it easier to analyze data quickly with new
Creating and Modifying Charts
 Creating and Modifying Charts Introduction When you re ready to share data with others, a worksheet might not be the most effective way to present the information. A page full of numbers, even if formatted
Introduction to Microsoft Excel 2010
 Introduction to Microsoft Excel 2010 This class is designed to cover the following basics: What you can do with Excel Excel Ribbon Moving and selecting cells Formatting cells Adding Worksheets, Rows and
Simply Personnel Screen Designer
 Simply Personnel Screen Designer -Training Workbook- Screen Designer Page 1 Build 12.8 Introduction to Simply Personnel Screen Designer This document provides step-by-step guide for employee users to give
Microsoft Excel 2016 / 2013 Basic & Intermediate
 Microsoft Excel 2016 / 2013 Basic & Intermediate Duration: 2 Days Introduction Basic Level This course covers the very basics of the Excel spreadsheet. It is suitable for complete beginners without prior
Section 1 Microsoft Excel Overview
 Course Topics: I. MS Excel Overview II. Review of Pasting and Editing Formulas III. Formatting Worksheets and Cells IV. Creating Templates V. Moving and Navigating Worksheets VI. Protecting Sheets VII.
Creating Interactive PDF Forms
 Creating Interactive PDF Forms Using Adobe Acrobat X Pro for the Mac University Information Technology Services Training, Outreach, Learning Technologies and Video Production Copyright 2012 KSU Department
CHRIST THE KING BOYS MATRIC HR. SEC. SCHOOL, KUMBAKONAM CHAPTER 2 TEXT FORMATTING
 CHAPTER 2 TEXT FORMATTING 1. Explain how to create a Bulleted and Numbered List in Star Office Writer? One way to create a list of points or topics in a document is to create a bulleted list. A bullet
Excel 2013 for Beginners
 Excel 2013 for Beginners Class Objective: This class will familiarize you with the basics of using Microsoft Excel. Class Outline: Introduction to Microsoft Excel 2013... 1 Microsoft Excel...2-3 Getting
THE EXCEL ENVIRONMENT... 1 EDITING...
 Excel Essentials TABLE OF CONTENTS THE EXCEL ENVIRONMENT... 1 EDITING... 1 INSERTING A COLUMN... 1 DELETING A COLUMN... 1 INSERTING A ROW... DELETING A ROW... MOUSE POINTER SHAPES... USING AUTO-FILL...
Chapter 4. Microsoft Excel
 Chapter 4 Microsoft Excel Topic Introduction Spreadsheet Basic Screen Layout Modifying a Worksheet Formatting Cells Formulas and Functions Sorting and Filling Borders and Shading Charts Introduction A
DataSweet also has a whole host of improvements which are not covered in this document.
 Page 1 Introduction DataSweet 3.5.0 contains many new features that make DataSweet a really powerful tool for data handling in the classroom. This document only covers the new features and how they work.
Learn more about Pages, Keynote & Numbers
 Learn more about Pages, Keynote & Numbers HCPS Instructional Technology May 2012 Adapted from Apple Help Guides CHAPTER ONE: PAGES Part 1: Get to Know Pages Opening and Creating Documents Opening a Pages
Excel 2013 Intermediate
 Excel 2013 Intermediate Quick Access Toolbar... 1 Customizing Excel... 2 Keyboard Shortcuts... 2 Navigating the Spreadsheet... 2 Status Bar... 3 Worksheets... 3 Group Column/Row Adjusments... 4 Hiding
Introduction to Microsoft Word 2008
 1. Launch Microsoft Word icon in Applications > Microsoft Office 2008 (or on the Dock). 2. When the Project Gallery opens, view some of the available Word templates by clicking to expand the Groups, and
Desktop Studio: Charts. Version: 7.3
 Desktop Studio: Charts Version: 7.3 Copyright 2015 Intellicus Technologies This document and its content is copyrighted material of Intellicus Technologies. The content may not be copied or derived from,
Tricking it Out: Tricks to personalize and customize your graphs.
 Tricking it Out: Tricks to personalize and customize your graphs. Graphing templates may be used online without downloading them onto your own computer. However, if you would like to use the templates
Excel 2013 Part 2. 2) Creating Different Charts
 Creating Different Charts") Excel 2013 Part 2 1) Create a Chart (review) Open Budget.xlsx from Documents folder. Then highlight the range from C5 to L8. Click on the Insert Tab on the Ribbon. From the Charts click on the dialogue
Excel 2013 Part 2 1) Create a Chart (review) Open Budget.xlsx from Documents folder. Then highlight the range from C5 to L8. Click on the Insert Tab on the Ribbon. From the Charts click on the dialogue
EXCEL 2010 PROCEDURES
 EXCEL 2010 PROCEDURES Starting Excel 1 Click the Start 2 Click All Programs 3 Click the Microsoft Office folder icon 4 Click Microsoft Excel 2010 Naming and Saving (Ctrl+S) a Workbook 1 Click File 2 Click
English Language Arts. Getting Started Guide
 English Language Arts Getting Started Guide Contents Introduction 1 Installing RM Easiteach ELA 1 Expand and Enhance your Use of RM Easiteach 1 Reviewing your License Agreement 2 Key Features 3 Split Screen
Microsoft. Excel. Microsoft Office Specialist 2010 Series EXAM COURSEWARE Achieve more. For Evaluation Only
 Microsoft Excel 2010 Microsoft Office Specialist 2010 Series COURSEWARE 3243 1 EXAM 77 882 Achieve more Microsoft Office Specialist 2010 Microsoft Excel Core Certification 2010 Lesson 6: Working with
Creating a Website in Schoolwires
 Creating a Website in Schoolwires Overview and Terminology... 2 Logging into Schoolwires... 2 Changing a password... 2 Navigating to an assigned section... 2 Accessing Site Manager... 2 Section Workspace
Microsoft Excel 2010 Tutorial
 1 Microsoft Excel 2010 Tutorial Excel is a spreadsheet program in the Microsoft Office system. You can use Excel to create and format workbooks (a collection of spreadsheets) in order to analyze data and
Information Technology and Media Services. Office Excel. Charts
 Information Technology and Media Services Office 2010 Excel Charts August 2014 Information Technology and Media Services CONTENTS INTRODUCTION... 1 CHART TYPES... 3 CHOOSING A CHART... 4 CREATING A COLUMN
User Guide. Web Intelligence Rich Client. Business Objects 4.1
 User Guide Web Intelligence Rich Client Business Objects 4.1 2 P a g e Web Intelligence 4.1 User Guide Web Intelligence 4.1 User Guide Contents Getting Started in Web Intelligence 4.1... 5 Log into EDDIE...
Microsoft How to Series
 Microsoft How to Series Getting Started with EXCEL 2007 A B C D E F Tabs Introduction to the Excel 2007 Interface The Excel 2007 Interface is comprised of several elements, with four main parts: Office
Creating a Website in Schoolwires Technology Integration Center
 Creating a Website in Schoolwires Technology Integration Center Overview and Terminology... 2 Logging into Schoolwires... 2 Changing a password... 2 Accessing Site Manager... 2 Section Workspace Overview...
Creating Charts in Office 2007 Table of Contents
 Table of Contents Microsoft Charts... 1 Inserting a Chart in Excel... 1 Tip Shortcut Key to Create a Default Chart in Excel... 2 Activating Your Chart... 2 Resizing an Embedded Chart... 2 Moving a Chart...
Word 2013 Quick Start Guide
 Getting Started File Tab: Click to access actions like Print, Save As, and Word Options. Ribbon: Logically organize actions onto Tabs, Groups, and Buttons to facilitate finding commands. Active Document
Desktop Studio: Charts
 Desktop Studio: Charts Intellicus Enterprise Reporting and BI Platform Intellicus Technologies info@intellicus.com www.intellicus.com Working with Charts i Copyright 2011 Intellicus Technologies This document
HOUR 12. Adding a Chart
 HOUR 12 Adding a Chart The highlights of this hour are as follows: Reasons for using a chart The chart elements The chart types How to create charts with the Chart Wizard How to work with charts How to
Microsoft Access 5: Reports & Other Useful Functions
 Microsoft Access 5: Reports & Other Useful Functions You can print out simple records of your data by using the Office menu. However, if you want to create a customized report from one or more tables or
IT ACADEMY LESSON PLAN
 IT Academy Program 10 IT ACADEMY LESSON PLAN Microsoft Excel Lesson 1 Turn potential into success Lesson 1: Understanding Microsoft Office Excel 2010 Learning Objectives Lesson Introduction Creating a
MICROSOFT EXCEL BIS 202. Lesson 1. Prepared By: Amna Alshurooqi Hajar Alshurooqi
 MICROSOFT EXCEL Prepared By: Amna Alshurooqi Hajar Alshurooqi Lesson 1 BIS 202 1. INTRODUCTION Microsoft Excel is a spreadsheet application used to perform financial calculations, statistical analysis,
Excel 2. Module 3 Advanced Charts
 Excel 2 Module 3 Advanced Charts Revised 1/1/17 People s Resource Center Module Overview This module is part of the Excel 2 course which is for advancing your knowledge of Excel. During this lesson we
Numbers Basics Website:
 Website: http://etc.usf.edu/te/ Numbers is Apple's new spreadsheet application. It is installed as part of the iwork suite, which also includes the word processing program Pages and the presentation program
D&B Market Insight Release Notes. November, 2015
 D&B Market Insight Release Notes November, 2015 Table of Contents Table of Contents... 2 Charting Tool: Add multiple measures to charts... 3 Charting Tool: Additional enhancements to charts... 6 Data Grids:
Basics of Spreadsheet
 106 :: Data Entry Operations 6 Basics of Spreadsheet 6.1 INTRODUCTION A spreadsheet is a large sheet having data and information arranged in rows and columns. As you know, Excel is one of the most widely
Microsoft Excel 2000 Charts
 You see graphs everywhere, in textbooks, in newspapers, magazines, and on television. The ability to create, read, and analyze graphs are essential parts of a student s education. Creating graphs by hand
Introduction to Excel 2013 Part 2
 Introduction to Excel 2013 Part 2 Open a file Select File from the Menu bar, select Open from the drop down menu, navigate to the place where the file was stored, double-left click on the file name. Modify
Microsoft Excel Microsoft Excel
 Excel 101 Microsoft Excel is a spreadsheet program that can be used to organize data, perform calculations, and create charts and graphs. Spreadsheets or graphs created with Microsoft Excel can be imported
PowerPoint 2016 Building a Presentation
 PowerPoint 2016 Building a Presentation What is PowerPoint? PowerPoint is presentation software that helps users quickly and efficiently create dynamic, professional-looking presentations through the use
PowerPoint 2016 Basics for Mac
 1 PowerPoint 2016 Basics for Mac PowerPoint 2016 Basics for Mac Training Objective To learn the tools and features to get started using PowerPoint more efficiently and effectively. What you can expect
Gloucester County Library System. Excel 2010
 Gloucester County Library System Excel 2010 Introduction What is Excel? Microsoft Excel is an electronic spreadsheet program. It is capable of performing many different types of calculations and can organize
This book is about using Microsoft Excel to
 Introducing Data Analysis with Excel This book is about using Microsoft Excel to analyze your data. Microsoft Excel is an electronic worksheet you can use to perform mathematical, financial, and statistical
MICROSOFT EXCEL TUTORIAL
 MICROSOFT EXCEL TUTORIAL G E T T I N G S T A R T E D Microsoft Excel is one of the most popular spreadsheet applications that helps you manage data, create visually persuasive charts, and thought-provoking
Tutorial 5: Working with Excel Tables, PivotTables, and PivotCharts. Microsoft Excel 2013 Enhanced
 Tutorial 5: Working with Excel Tables, PivotTables, and PivotCharts Microsoft Excel 2013 Enhanced Objectives Explore a structured range of data Freeze rows and columns Plan and create an Excel table Rename
Creating Page Layouts 25 min
 1 of 10 09/11/2011 19:08 Home > Design Tips > Creating Page Layouts Creating Page Layouts 25 min Effective document design depends on a clear visual structure that conveys and complements the main message.
Rockefeller College MPA Excel Workshop: Clinton Impeachment Data Example
 Rockefeller College MPA Excel Workshop: Clinton Impeachment Data Example This exercise is a follow-up to the MPA admissions example used in the Excel Workshop. This document contains detailed solutions
WebIntelligence. Creating Documents
 Creating Documents This page is intentionally left blank. 2 WIC110904 Table of Contents Lesson Objective... 5 For Assistance...6 Introduction... 7 Document Editor... 7 Designing a Query Flowchart... 9
Creating Reports in Access 2007 Table of Contents GUIDE TO DESIGNING REPORTS... 3 DECIDE HOW TO LAY OUT YOUR REPORT... 3 MAKE A SKETCH OF YOUR
 Creating Reports in Access 2007 Table of Contents GUIDE TO DESIGNING REPORTS... 3 DECIDE HOW TO LAY OUT YOUR REPORT... 3 MAKE A SKETCH OF YOUR REPORT... 3 DECIDE WHICH DATA TO PUT IN EACH REPORT SECTION...
Detailed Table of Contents
 Detailed Table of Contents INTRODUCTION...1 I.1 THE OBJECTIVES OF THIS TEXT...1 I.2 WHY LibreOffice?...1 I.3 WHAT IS SPECIAL ABOUT THIS TEXT?...1 I.4 THE STATUS OF COMPUTING IN SCHOOLS...2 I.5 TEACHING
MicroStrategy Desktop
 MicroStrategy Desktop Quick Start Guide MicroStrategy Desktop is designed to enable business professionals like you to explore data, simply and without needing direct support from IT. 1 Import data from
Workbooks & Worksheets. Getting Started. Formatting. Formulas & Functions
 1 Getting Started Cells Workbooks & Worksheets Formatting Formulas & Functions Chart Printing 2 Getting Started Start a spreadsheet program Recognize the spreadsheet screen layout Use the ribbon,quick
Topics Covered. Create and format a column chart Create and format a pie chart Create and format a line chart Use a trendline Insert a sparkline
 Excel Charts CS101 Topics Covered Create and format a column chart Create and format a pie chart Create and format a line chart Use a trendline Insert a sparkline About Excel charts Display data Easier
EXCEL BASICS: MICROSOFT OFFICE 2010
 EXCEL BASICS: MICROSOFT OFFICE 2010 GETTING STARTED PAGE 02 Prerequisites What You Will Learn USING MICROSOFT EXCEL PAGE 03 Opening Microsoft Excel Microsoft Excel Features Keyboard Review Pointer Shapes
Inserting Information into PowerPoint
 LESSON 6 6.1 Inserting Information into PowerPoint After completing this lesson, you will be able to: Change the layout of a slide. Insert a clip art image. Scale an image. Insert and format a table. Insert
Activity: page 1/10 Introduction to Excel. Getting Started
 Activity: page 1/10 Introduction to Excel Excel is a computer spreadsheet program. Spreadsheets are convenient to use for entering and analyzing data. Although Excel has many capabilities for analyzing
Windows Movie Maker / Microsoft Photo Story Digital Video
 Windows Movie Maker / Microsoft Photo Story Digital Video http://intranet/technology/index.html TRC HELP DESK X5092 April 2006 Photo Story and Movie Maker Microsoft Photo Story 3 allows you to create fantastic
Export a PROTECT Report to Excel (User s Guide Lesson 21 : Reports) Tips for Using Microsoft Excel and Exported Reports
 Tips for Using Microsoft Excel and Exported Reports") Export a PROTECT Report to Excel (User s Guide Lesson 21 : Reports) 1. Run a PROTECT Export report 2. Click the Export button which is at far left on the toolbar in the PROTECT report window. 3. The Export
Export a PROTECT Report to Excel (User s Guide Lesson 21 : Reports) 1. Run a PROTECT Export report 2. Click the Export button which is at far left on the toolbar in the PROTECT report window. 3. The Export
CHAPTER 4: MICROSOFT OFFICE: EXCEL 2010
 CHAPTER 4: MICROSOFT OFFICE: EXCEL 2010 Quick Summary A workbook an Excel document that stores data contains one or more pages called a worksheet. A worksheet or spreadsheet is stored in a workbook, and
DataMaster for Windows
 DataMaster for Windows Version 3.0 April 2004 Mid America Computer Corp. 111 Admiral Drive Blair, NE 68008-0700 (402) 426-6222 Copyright 2003-2004 Mid America Computer Corp. All rights reserved. Table
Technology for Merchandise Planning and Control
 Technology for Merchandise Planning and Control Contents: Module Three: Formatting Worksheets Working with Charts UREFERENCE/PAGES Formatting Worksheets... Unit C Formatting Values... Excel 52 Excel 57
Using Charts in a Presentation 6
 Using Charts in a Presentation 6 LESSON SKILL MATRIX Skill Exam Objective Objective Number Building Charts Create a chart. Import a chart. Modifying the Chart Type and Data Change the Chart Type. 3.2.3
Excel Tutorial 1
 IT٢.we Excel 2003 - Tutorial 1 Spreadsheet Basics Screen Layout Title bar Menu bar Standard Toolbar Other Tools Task Pane Adding and Renaming Worksheets Modifying Worksheets Moving Through Cells Adding
Adding records Pasting records Deleting records Sorting records Filtering records Inserting and deleting columns Calculated columns Working with the
 Show All About spreadsheets You can use a spreadsheet to enter and calculate data. A spreadsheet consists of columns and rows of cells. You can enter data directly into the cells of the spreadsheet and
Working with Tables in Microsoft Word
 Working with Tables in Microsoft Word Microsoft Word offers a number of ways to make a table. The best way depends on how you like to work, and on how simple or complex the table needs to be. 1. Click
WEEK NO. 12 MICROSOFT EXCEL 2007
 WEEK NO. 12 MICROSOFT EXCEL 2007 LESSONS OVERVIEW: GOODBYE CALCULATORS, HELLO SPREADSHEET! 1. The Excel Environment 2. Starting A Workbook 3. Modifying Columns, Rows, & Cells 4. Working with Worksheets
Technology Assignment: Scatter Plots
 The goal of this assignment is to create a scatter plot of a set of data. You could do this with any two columns of data, but for demonstration purposes we ll work with the data in the table below. You
Working with Charts Stratum.Viewer 6
 Working with Charts Stratum.Viewer 6 Getting Started Tasks Additional Information Access to Charts Introduction to Charts Overview of Chart Types Quick Start - Adding a Chart to a View Create a Chart with
eschoolplus+ Cognos Query Studio Training Guide Version 2.4
 + Training Guide Version 2.4 May 2015 Arkansas Public School Computer Network This page was intentionally left blank Page 2 of 68 Table of Contents... 5 Accessing... 5 Working in Query Studio... 8 Query